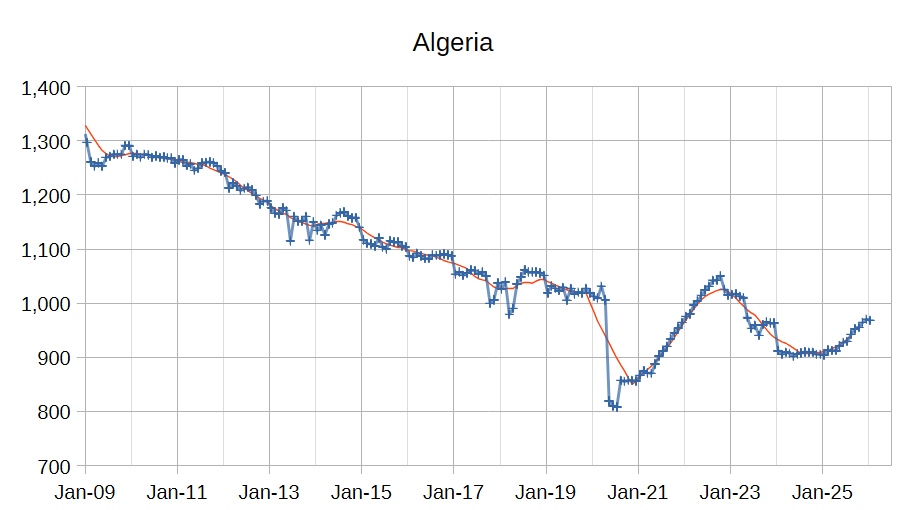
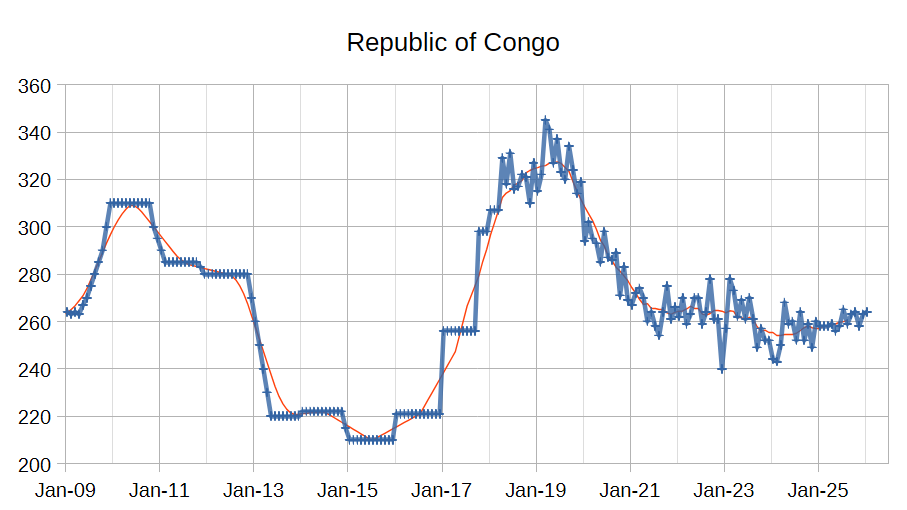
The OPEC Monthly Oil Market Report (MOMR) for February 2026 was published recently. The last month reported in most of the OPEC charts that follow is January 2026 and output reported for OPEC nations is crude oil output in thousands of barrels per day (kb/d). In the OPEC charts below the blue line with markers is monthly output and the thin red line is the centered twelve month average (CTMA) output.
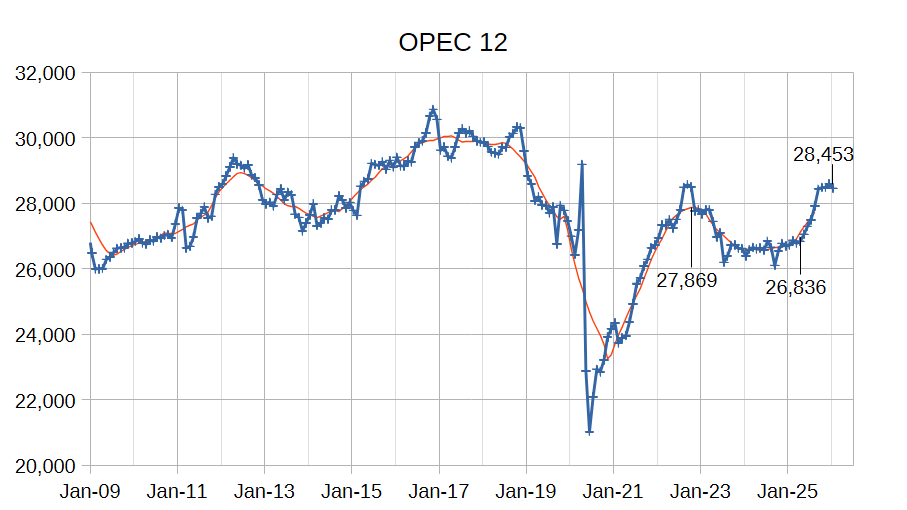
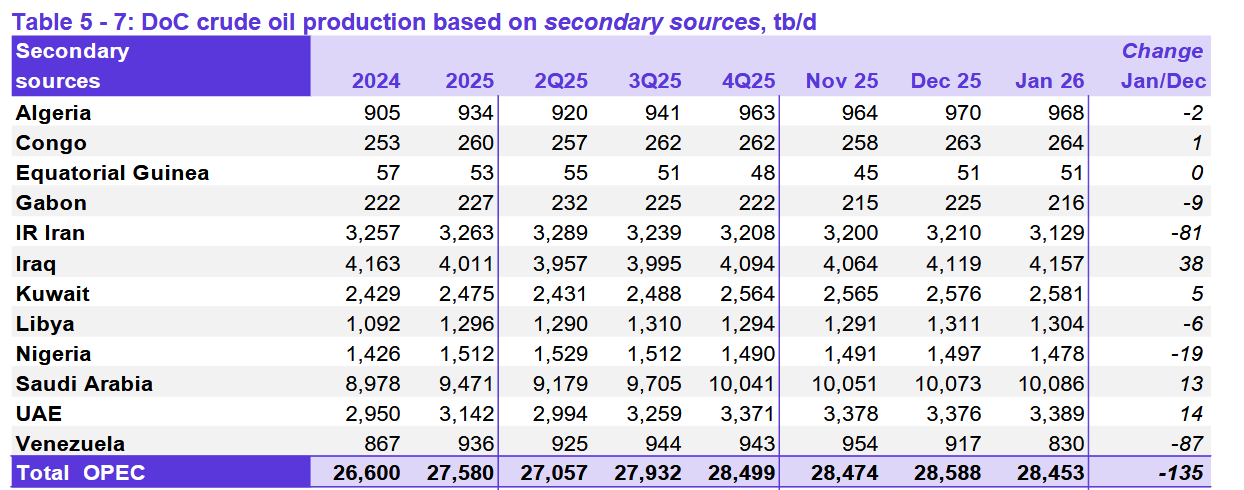
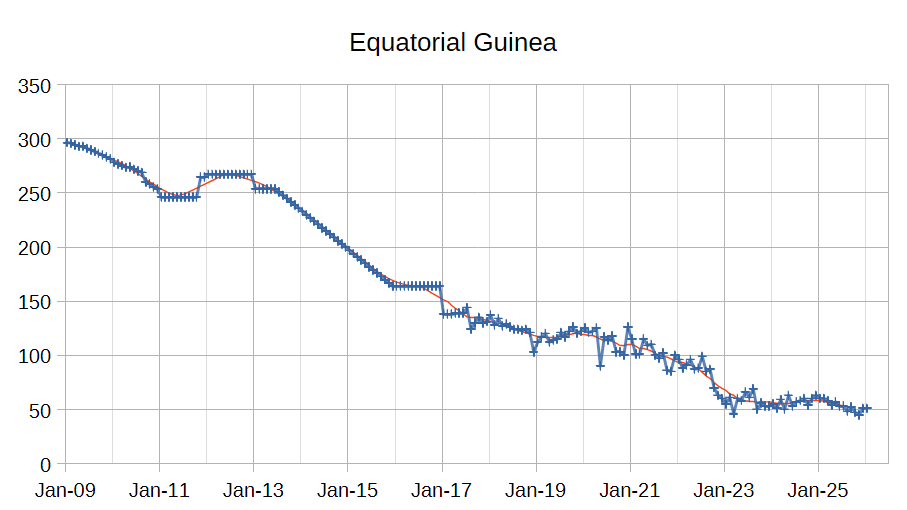
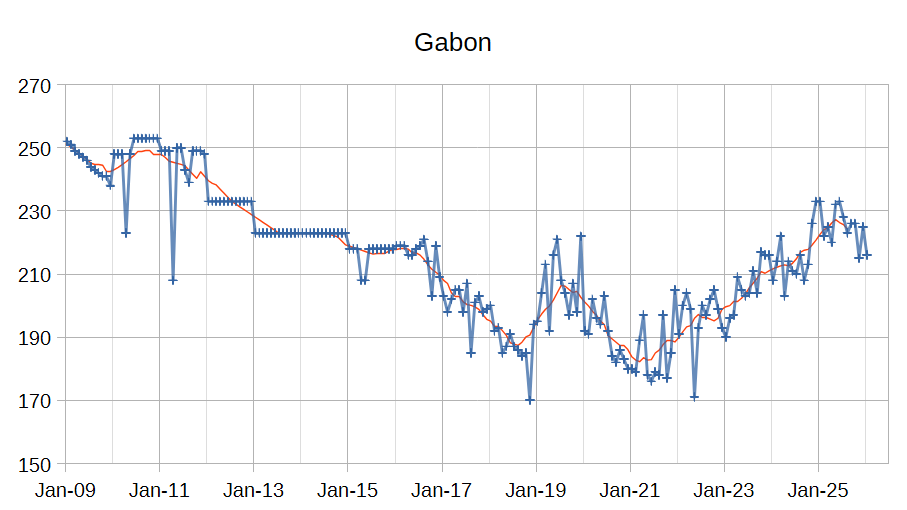
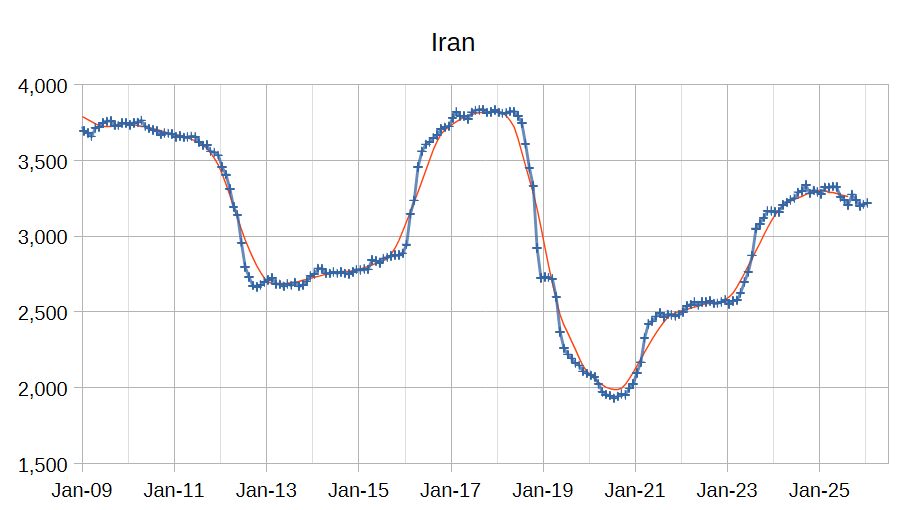
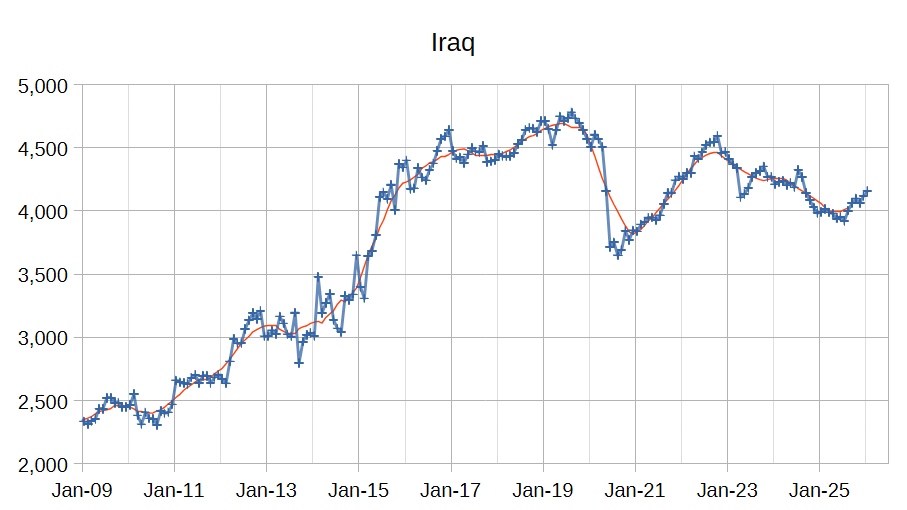
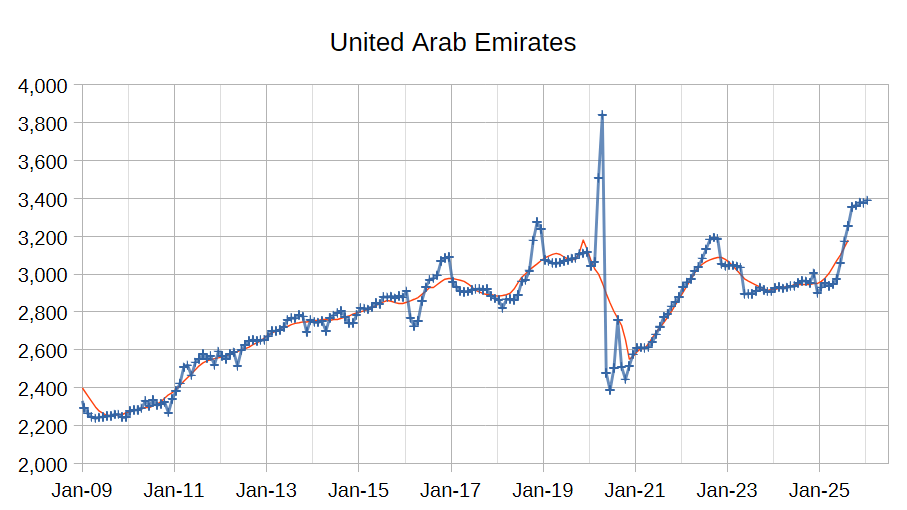
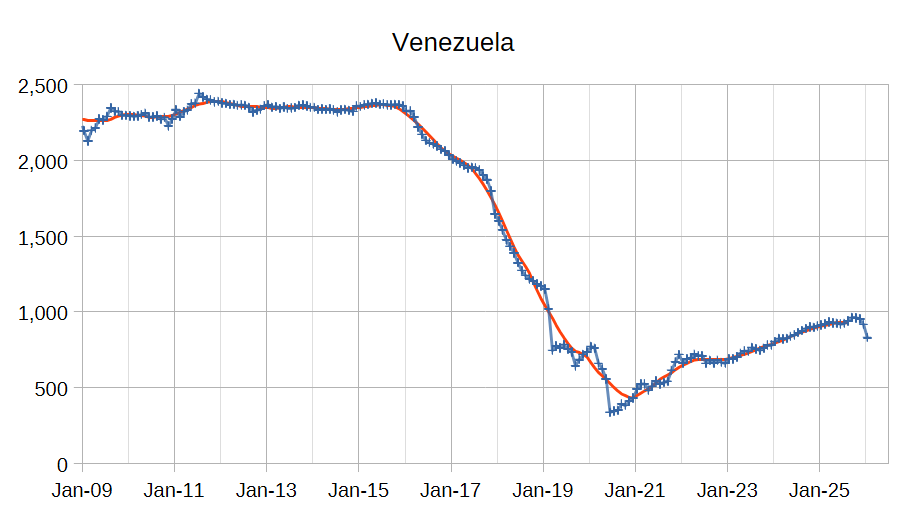
OPEC 12 output decreased by 135 kb/d with the largest increases from Iraq (38 kb/d), UAE (14 kb/d), and Saudi Arabia (13 kb/d). Venezuela (-87 kb/d), Iran (-81 kb/d), and Nigeria (-19 kb/d) saw decreased crude output. All other OPEC members had small increases or decreases of 9 kb/d or less.
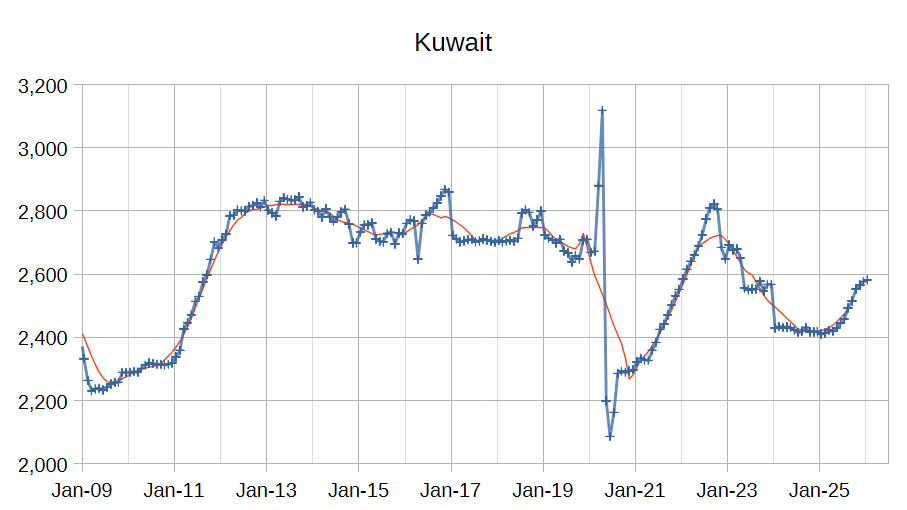
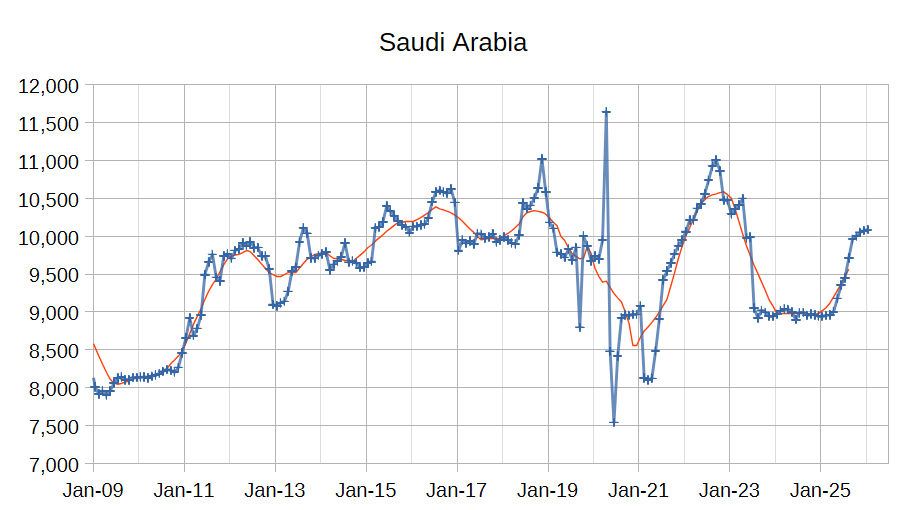
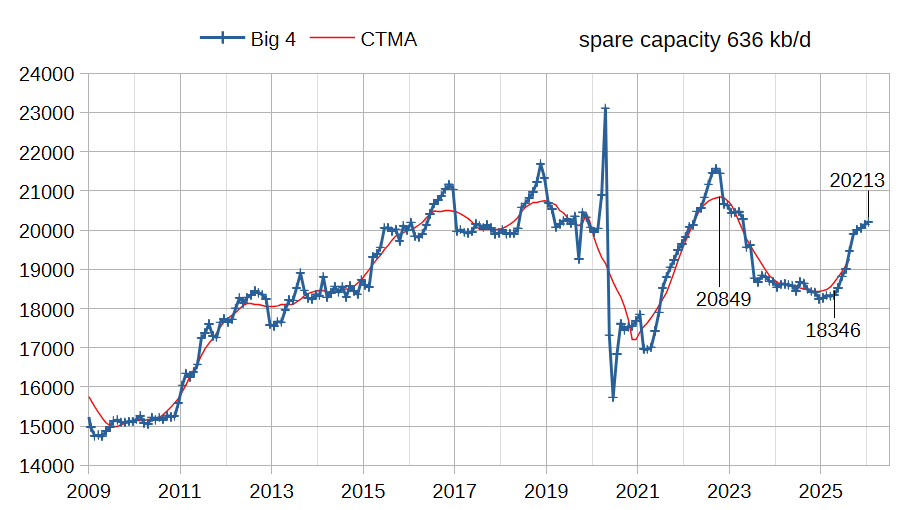
The chart above shows output from the Big 4 OPEC producers that are subject to output quotas and where most of OPEC spare capacity currently exists (Saudi Arabia, UAE, Iraq, and Kuwait.) After the pandemic, Big 4 average output peaked in 2022 at a centered 12 month average (CTMA) of 20849 kb/d, crude output has been cut by 636 kb/d relative to the 2022 CTMA peak to 202213 kb/d in January 2026. The Big 4 may have about 636 kb/d of spare capacity when World demand calls for an increase in output. Since April 2025 the OPEC Big 4 have increased output from 18346 kb/d to 20213 kb/d, an increase of 1867 kb/d in 9 months. The rate of increase in Big 4 output seems to be slowing lately. Note that there may be some added spare capacity from UAE, but there may have been reduced spare capacity in Kuwait and Iraq. My definition of spare capacity is the recent (past 48 months) 12 month peak of OPEC Big 4 output, claims of higher capacity remain unproven until we see sustained (12 month average) output at capacity.
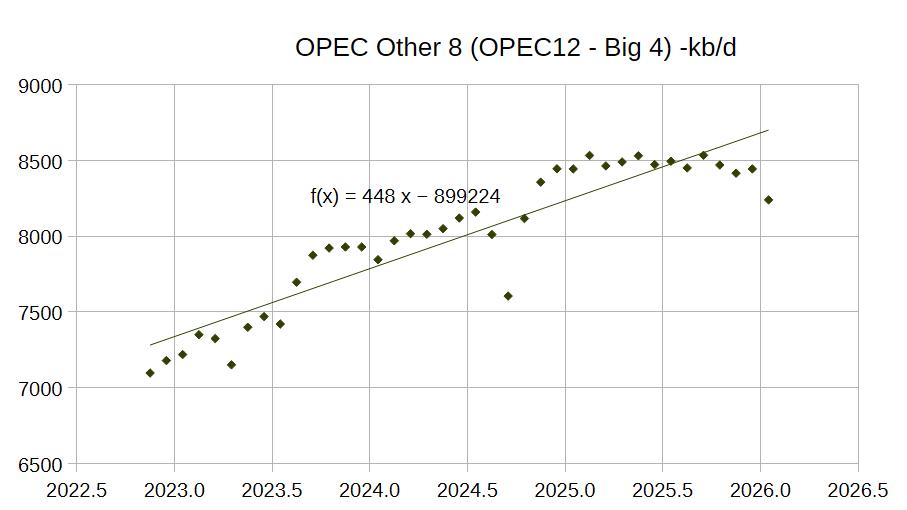
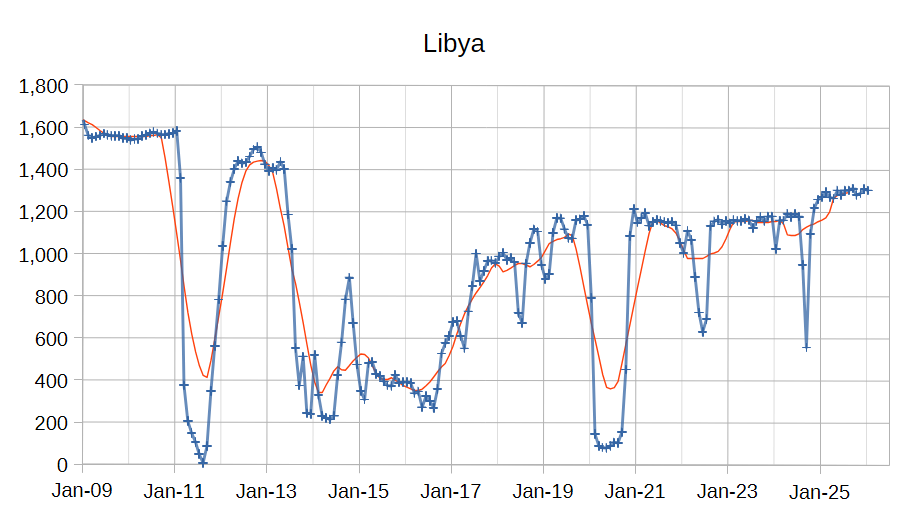
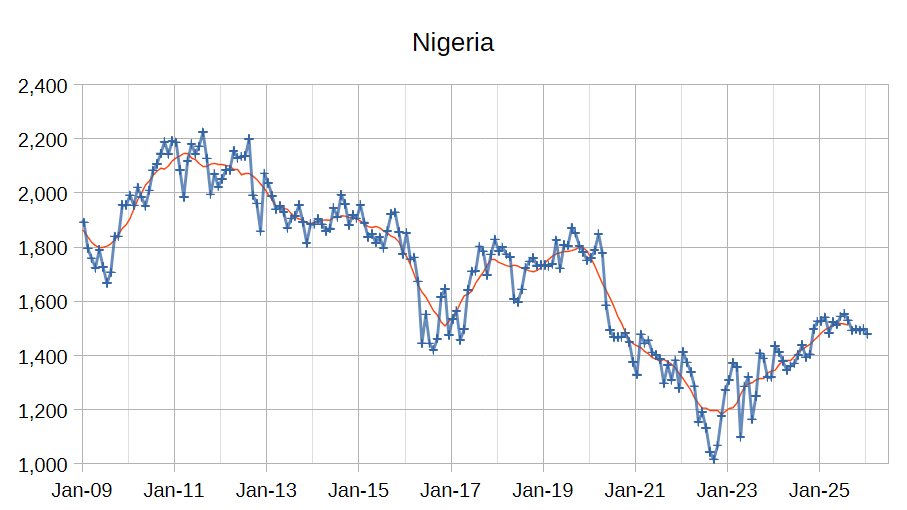
The chart above shows output from the Other 8 OPEC producers excluding the Big 4. Clearly gains in output from these nations have been stagnant since early 2025. This is the reason I focus on the Big 4 OPEC producers.
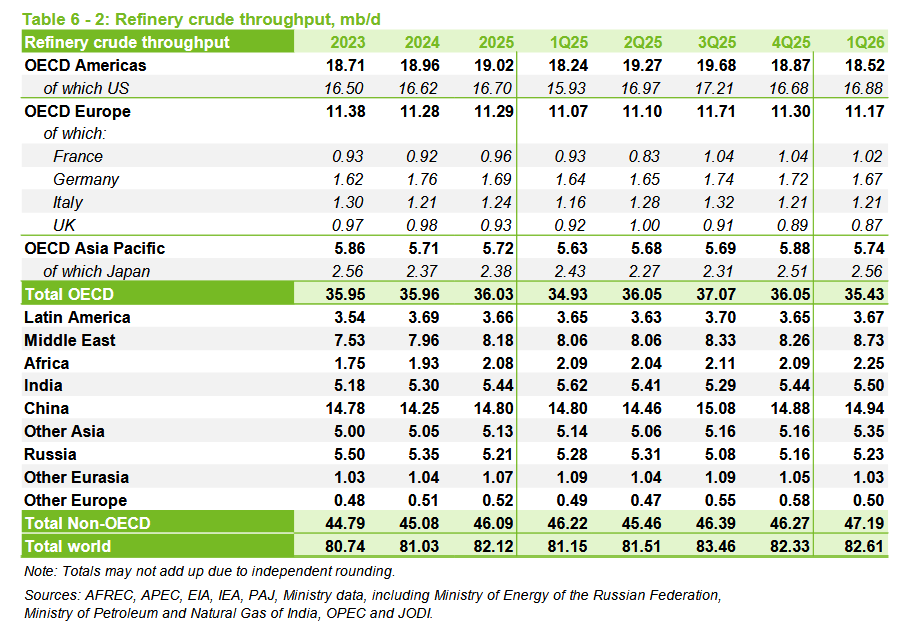
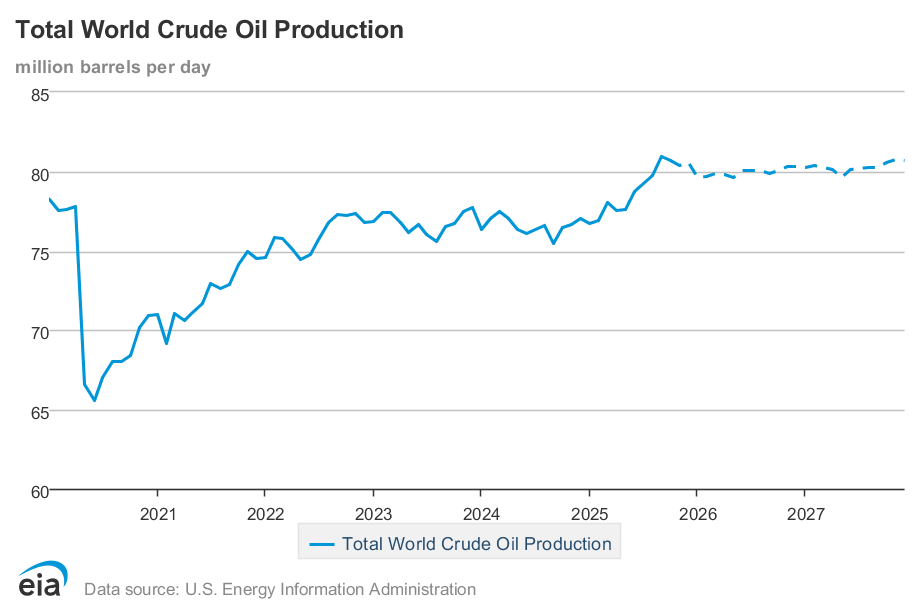
Refinery crude throughput is a measure of World demand for C+C (though imperfect because some crude is burned directly in power plants in the Middle East.) OPEC data shows the previous peak was 81.68 Mb/d in 2018. For the most recent 4 quarters (ending 2026Q1) the average World refinery throughput was 82.48 Mb/d, a new annual average peak which is higher than the 2025 average of 82.12 Mb/d by 360 kb/d and higher than the 2018 peak by 800 kb/d (roughly a 110 kb/d annual rate of increase over 7.25 years.)
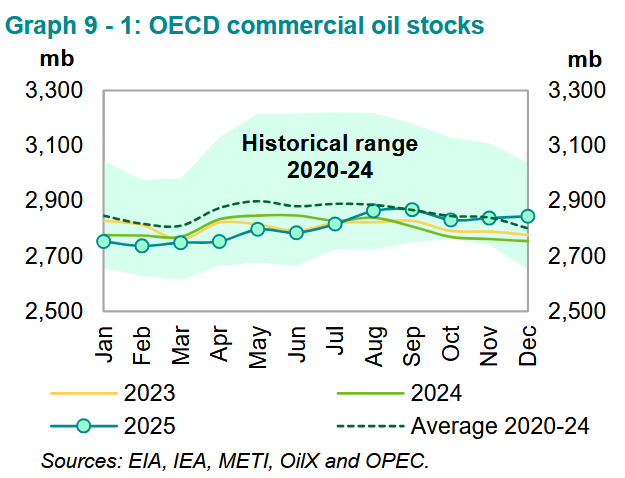
OECD commercial oil stocks rose above the 5 year average in December 2025 for the first tome in the past 36 months.
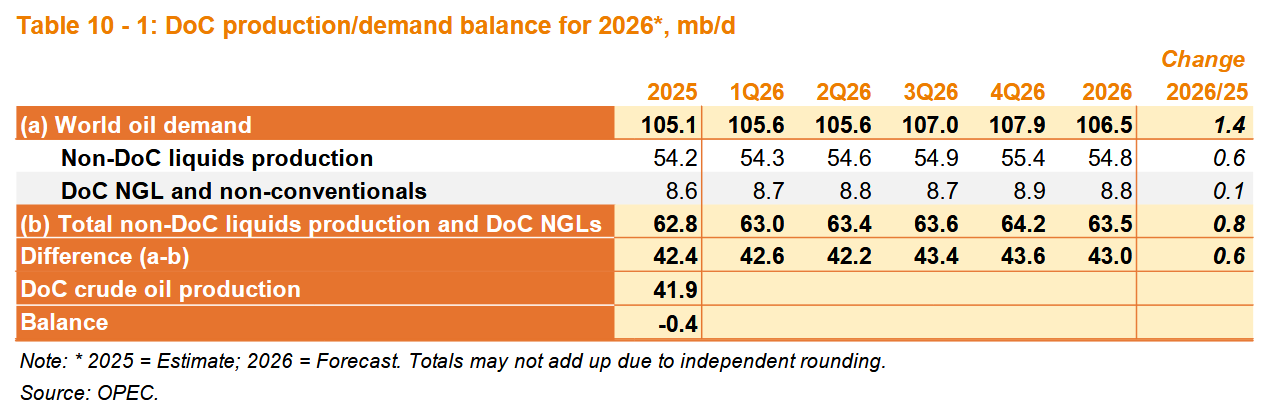
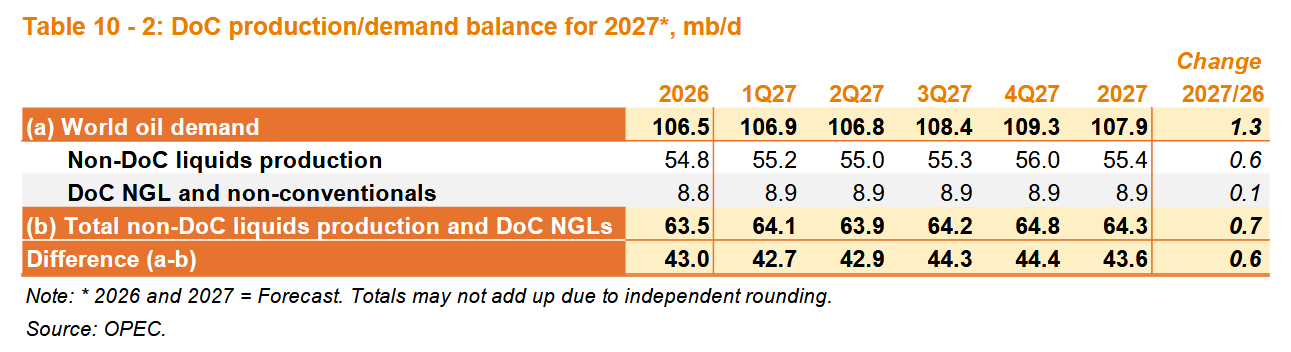
OPEC expects demand for petroleum liquids to rise by 1.4 Mb/d in 2026 and by 1.3 Mb/d in 2027 and expects demand for OPEC crude to rise by 600 kb/d in both 2026 and 2027. If the OPEC demand estimates and non-DOC liquids production estimates and my estimate for OPEC spare capacity are all correct we could see a very tight oil market in 2027. My guess is that demand will be less robust than the OPEC estimate.
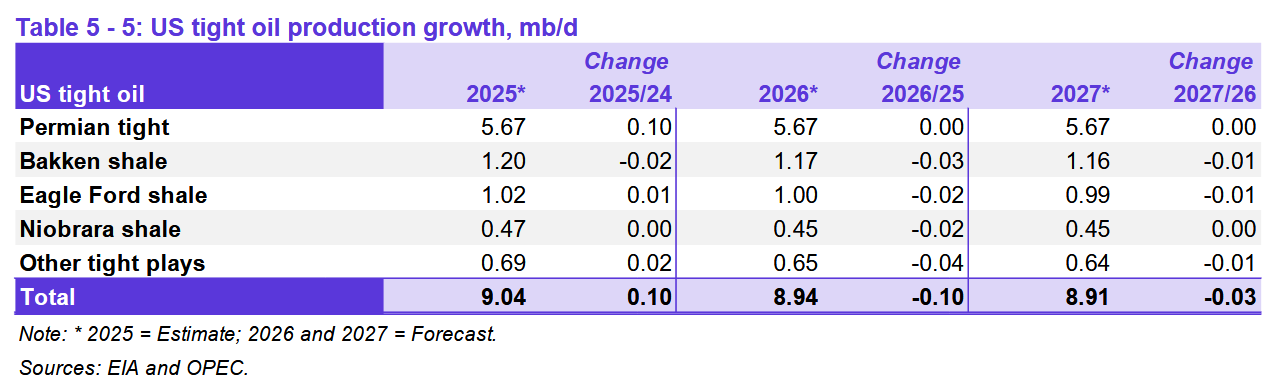
OPEC expects US tight oil output will fall in 2026 and 2027. This seems correct especially if oil prices follow the current futures market curve (with December 2027 WTI futures at $61.50/b as I write this.)
Leave a Reply