By Ovi
The focus of this post is an overview of World oil production along with a more detailed review of the top 11 Non-OPEC oil producing countries. OPEC production is covered in a separate post.
Below are a number of Crude plus Condensate (C + C) production charts, usually shortened to “oil”, for the oil producing countries. The charts are created from data provided by the EIA’s International Energy Statistics and are updated to January 2025. This is the latest and most detailed/complete World oil production information available. Information from other sources such as OPEC, the STEO and country specific sites such as Brazil, Norway, Mexico, Argentina and China is used to provide a short term outlook.

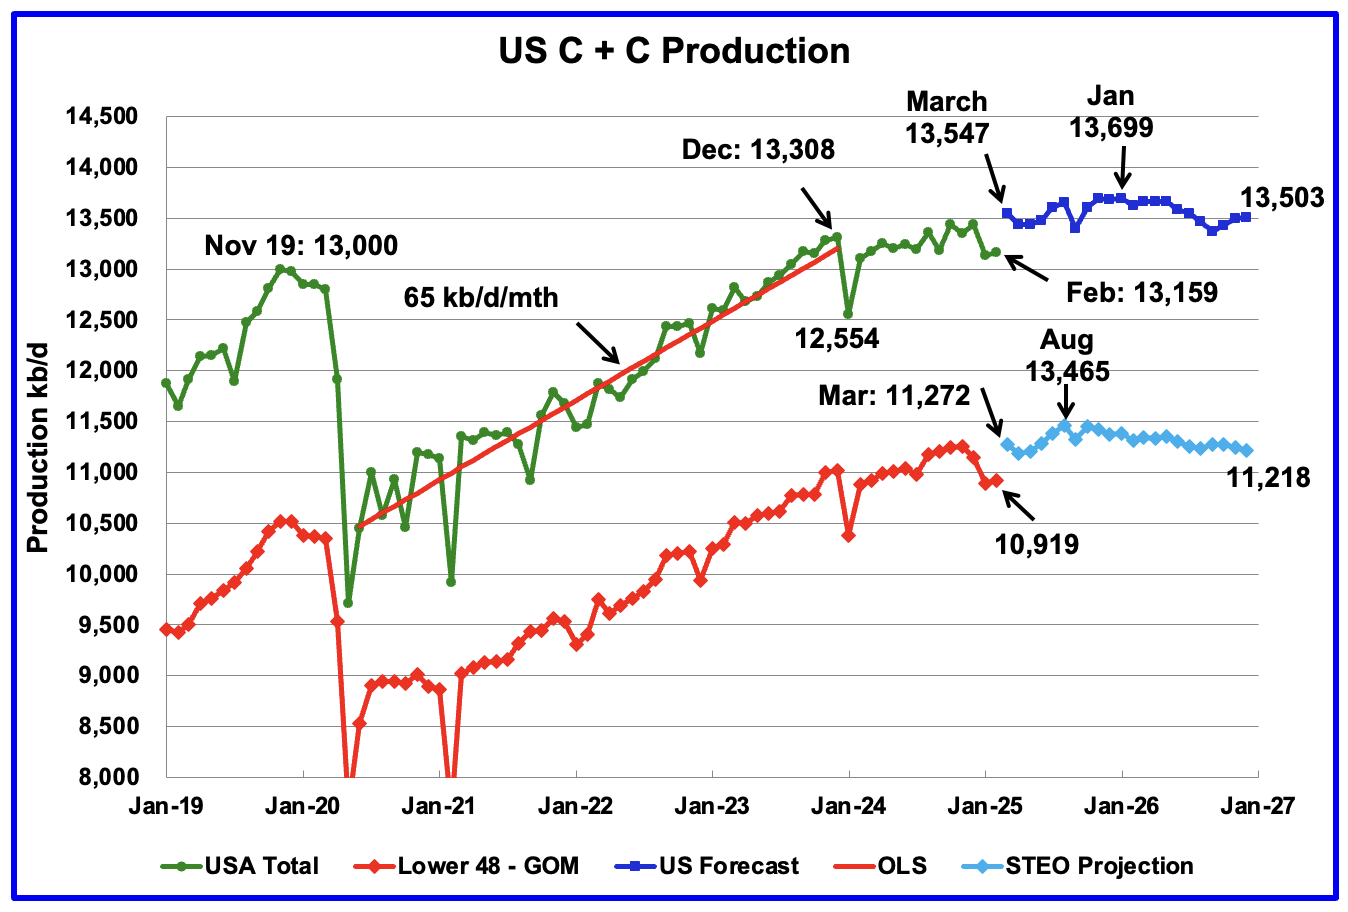
World oil production decreased by 231 kb/d in January to 82,184 kb/d, green graph. The largest decrease came from the US, 305 kb/d. February’s World oil production is projected to increase by 400 kb/d to 82,584 kb/d.
This chart also projects World C + C production out to December 2026. It uses the May 2025 STEO report along with the International Energy Statistics to make the projection. The May STEO report notes its forecast only partially incorporated the world’s new tariff conditions.
For December 2026, production is projected to be 83,820 kb/d. The December 2026 oil production is lower than the November 2018 peak by 772 kb/d. December 2026 production has been revised down by 116 kb/d from the previous report.
From December 2023 to December 2026, World oil production is estimated to increase by 804 kb/d.
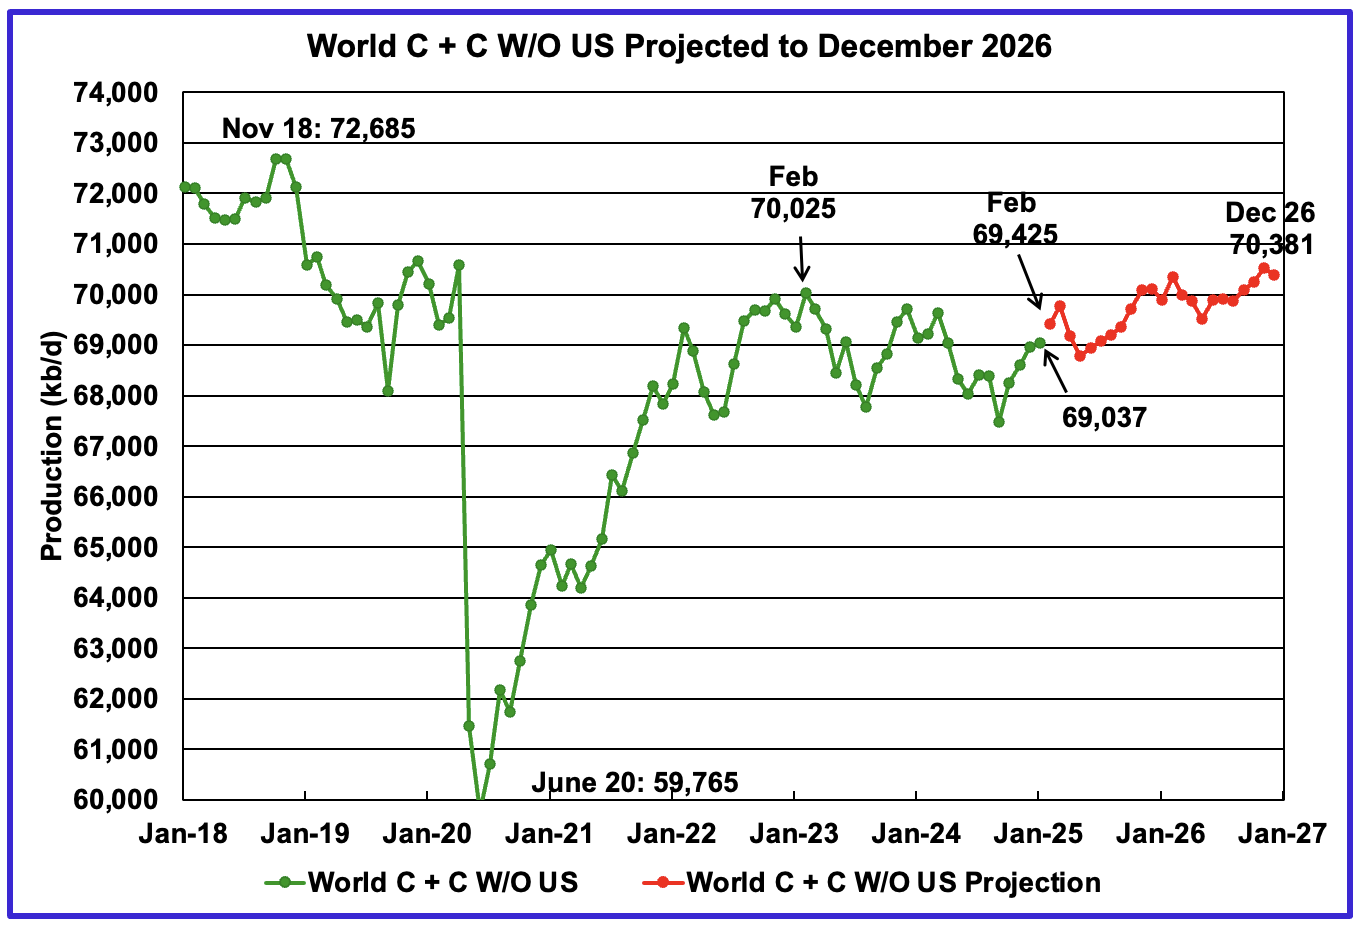
January’s World oil output without the US increased by 74 kb/d to 69,037 kb/d. February’s production is expected to increase by 388 kb/d to 69,425 kb/d.
The STEO is forecasting that December 2026 crude output will be 70,381 kb/d. Note that the December 2026 output is 2,304 kb/d lower than the November 2018 peak of 72,685 kb/d.
World oil production W/O the U.S. from January 2025 to December 2026 is forecast to increase by a total of 1,344 kb/d.
A Different Perspective on World Oil Production
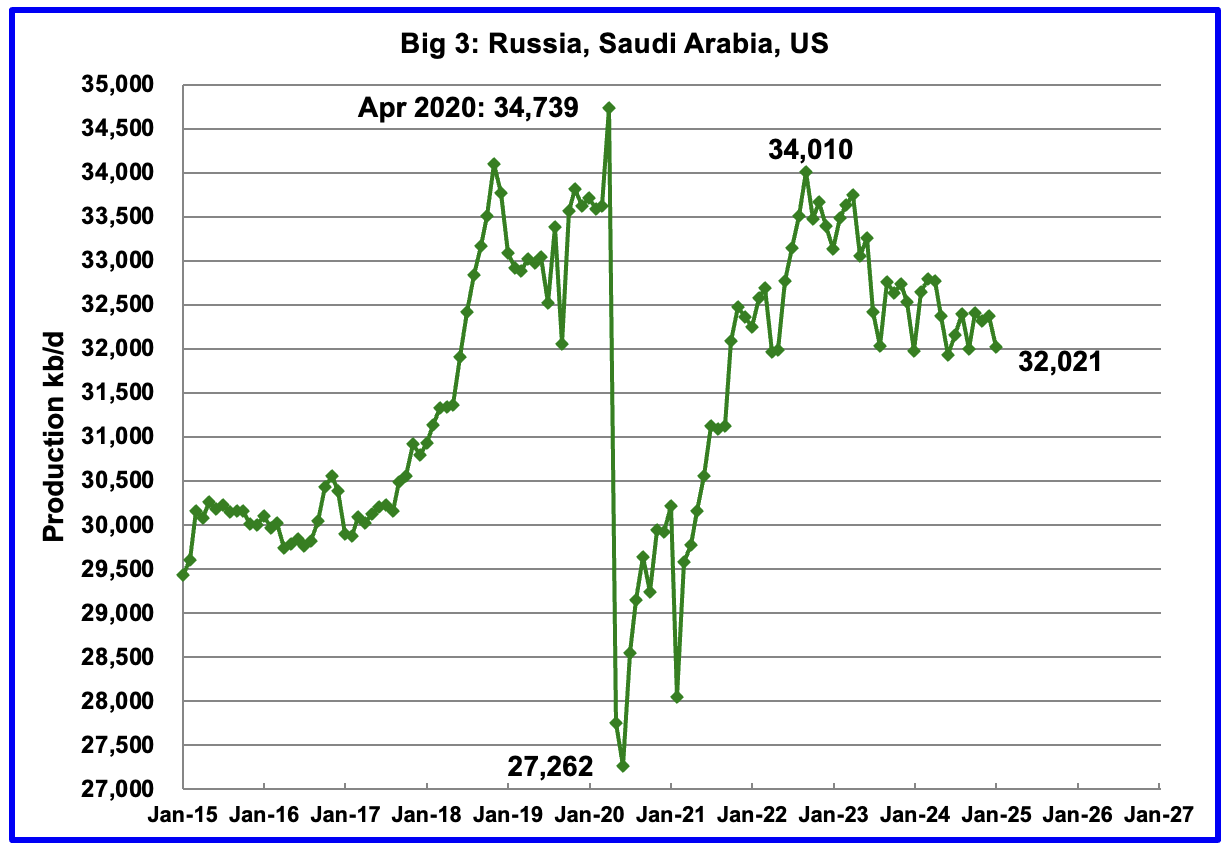
Peak production in the Big 3 occurred in April 2020 at a rate of 34,739 kb/d. The peak was associated with a large production increase from Saudi Arabia. Post covid, production peaked at 34,010 kb/d in September 2022. The production decline since then is primarily due to cutbacks by Saudi Arabia and Russia.
January’s Big 3 oil production decreased by 355 kb/d to 32,021 kb/d. Of the 355 kb/d decrease, the US accounted for 305 kb/d. Production in January was 1,989 kb/d lower than the September 2022 post pandemic high of 34,010 kb/d. OPEC has announced it will start increasing production in May so the 1,989 kb/d drop should start to get smaller.
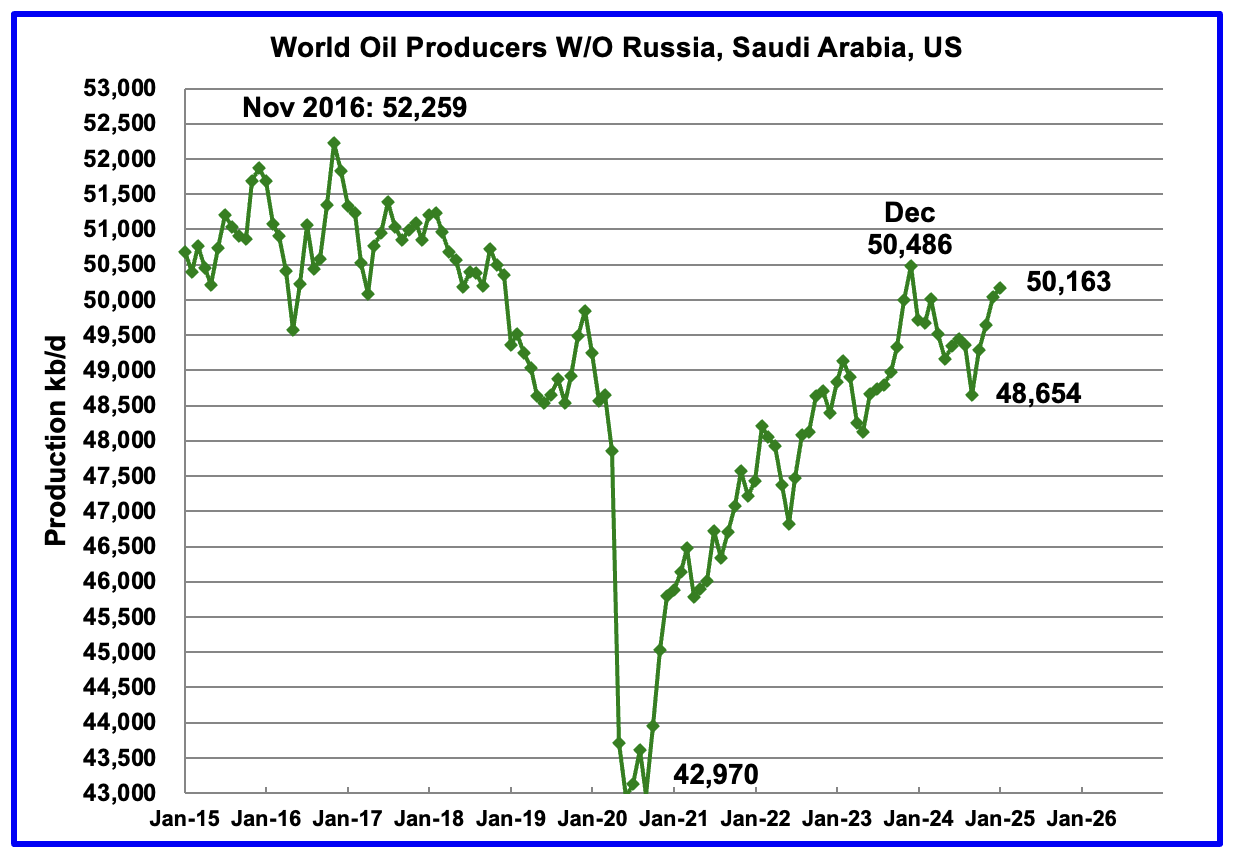
Production in the Remaining countries had been slowly increasing since the September 2020 low of 42,970 kb/d to December 2023. Production has risen for the last four months and output in January increased by 124 kb/d to 50,163 kb/d and is now 323 kb/d lower than December 2023.
Countries Expected to Grow Oil Production
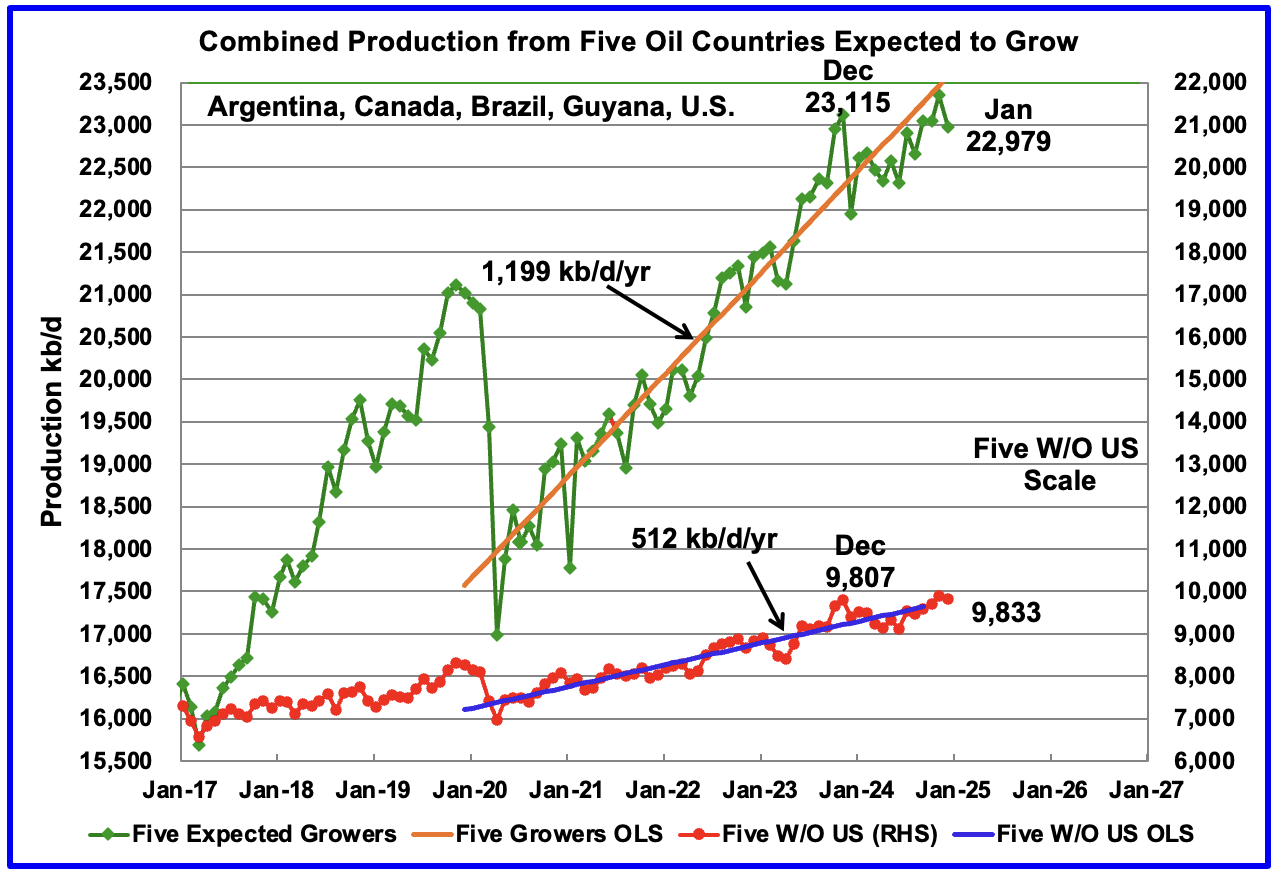
This chart was first posted a few of months back and shows the combined oil production from five Non-OPEC countries, Argentina, Brazil, Canada, Guyana and the U.S., whose oil production is expected to grow. These five countries are often cited by OPEC and the IEA for being capable of meeting the increasing World oil demand for next year. For these five countries, production from April 2020 to August 2024 rose at an average rate of 1,199 kb/d/year as shown by the orange OLS line.
To show the impact of US growth over the past 5 years, U.S. production was removed from the five countries and that graph is shown in red. The production growth slope for the remaining four countries has been reduced by 687 kb/d/yr to 512 kb/d/yr.
January production has been added to the five growers chart, down 370 kb/d to 22,979 kb/d. For the Five growers W/O U.S. January production dropped to 9,833 kb/d, down 65 kb/d from December 2024 and is 26 kb/d higher than December 2023.
The OLS lines have not been updated and will not be updated going forward unless additional production data provides a strong indication that production is rising/changing.
Production up to December 2023 may be a situation where the past is not a good indicator of the future. In this case it may be more important to focus on what has happened to production after December 2023 rather than before.
Countries Ranked by Oil Production
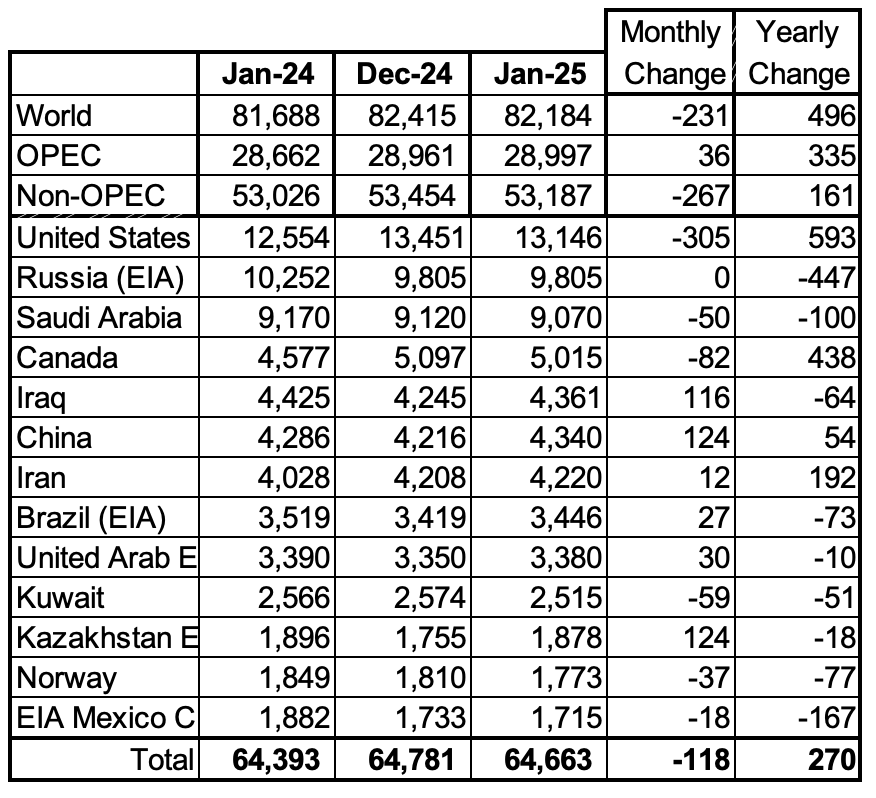
Above are listed the World’s 13th largest oil producing countries. In January 2024, these 13 countries produced 78.7% of the World’s oil. On a MoM basis, production decreased by 118 kb/d in these 13 countries while on a YOY basis, production rose by 270 kb/d.
January Non-OPEC Oil Production Charts
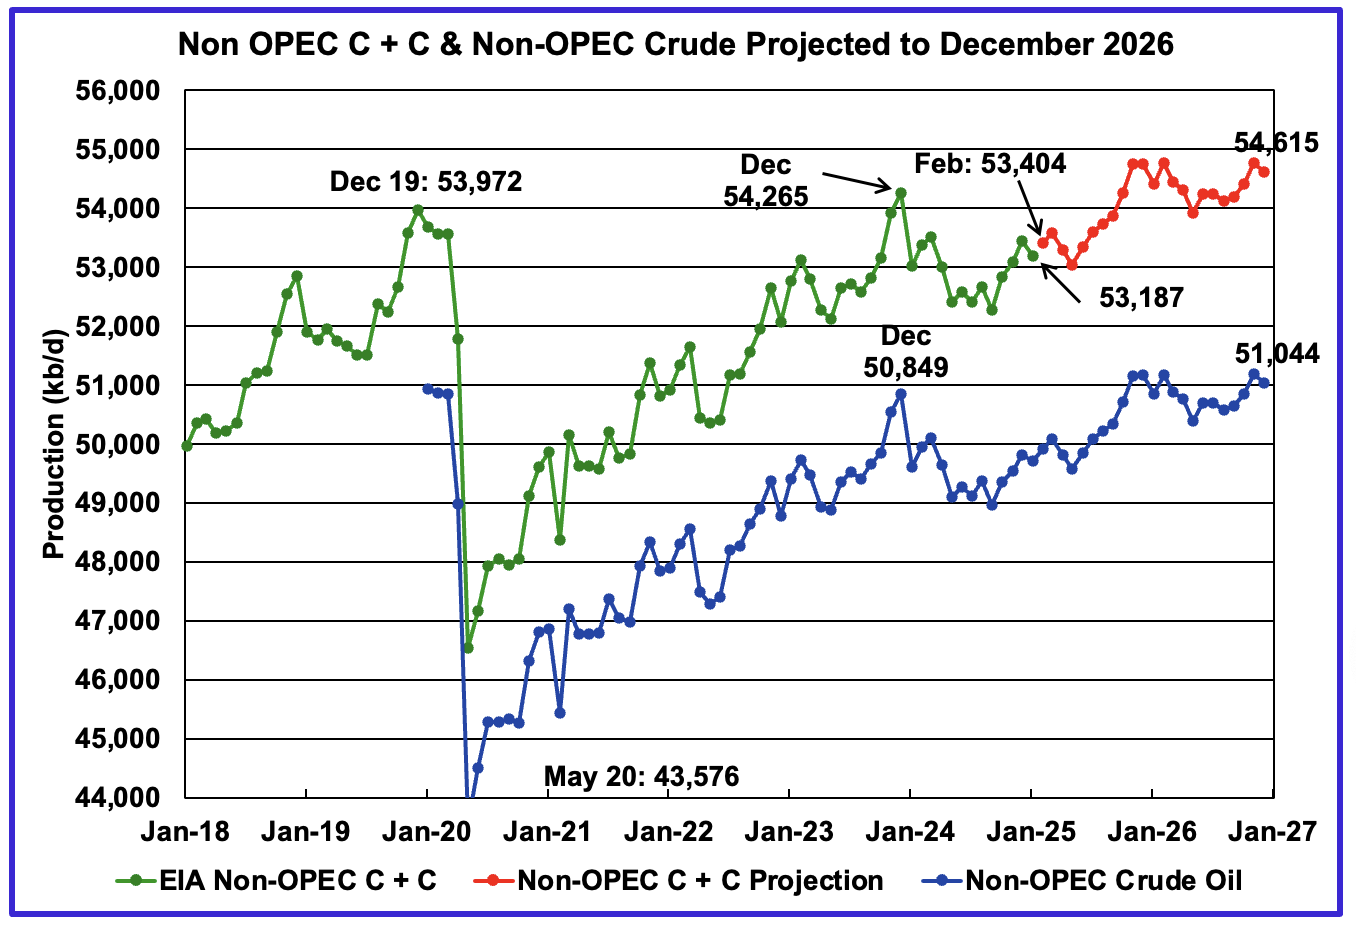
January’s Non-OPEC oil production decreased by 267 kb/d to 53,187 kb/d. February is expected to add 217 kb/d to 53,404 kb/d.
Using data from the May 2025 STEO, a projection for Non-OPEC oil output was made for the period February 2025 to December 2026. (Red graph). Output is expected to reach 54,615 kb/d in December 2026. December 2026 was revised down by 230 kb/d from the previous report.
From January 2025 to December 2026, oil production in Non-OPEC countries is expected to increase by 1,428 kb/d.

January’s Non-OPEC W/O US oil production rose by 37 kb/d to 40,040 kb/d. February’s production is projected to rise by 205 kb/d to 40,245 kb/d.
From January 2025 to December 2026, production in Non-OPEC countries W/O the U.S. is expected to increase by 1,137 kb/d. December 2026 production is projected to be 7 kb/d higher than December 2019, essentially no growth over seven years. December 2026 production was revised down by 165 kb/d from the last report to 41,177 kb/d.
Non-OPEC Oil Countries Ranked by Production
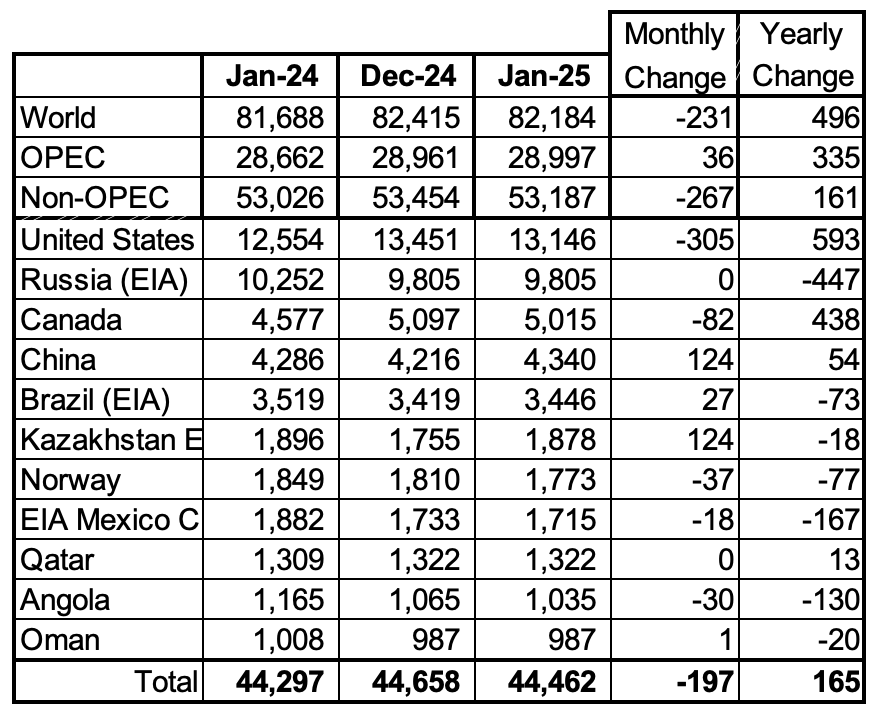
Listed above are the World’s 11 largest Non-OPEC producers. The original criteria for inclusion in the table was that all of the countries produced more than 1,000 kb/d. Oman has recently fallen below 1,000 kb/d.
January’s production decreased by 197 kb/d to 44,462kb/d for these eleven Non-OPEC countries while as a whole the Non-OPEC countries saw a yearly production increase of 161 kb/d to 53,187 kb/d.
In January 2024, these 11 countries produced 83.6% of all Non-OPEC oil.
Non-OPEC Country’s Oil Production Charts
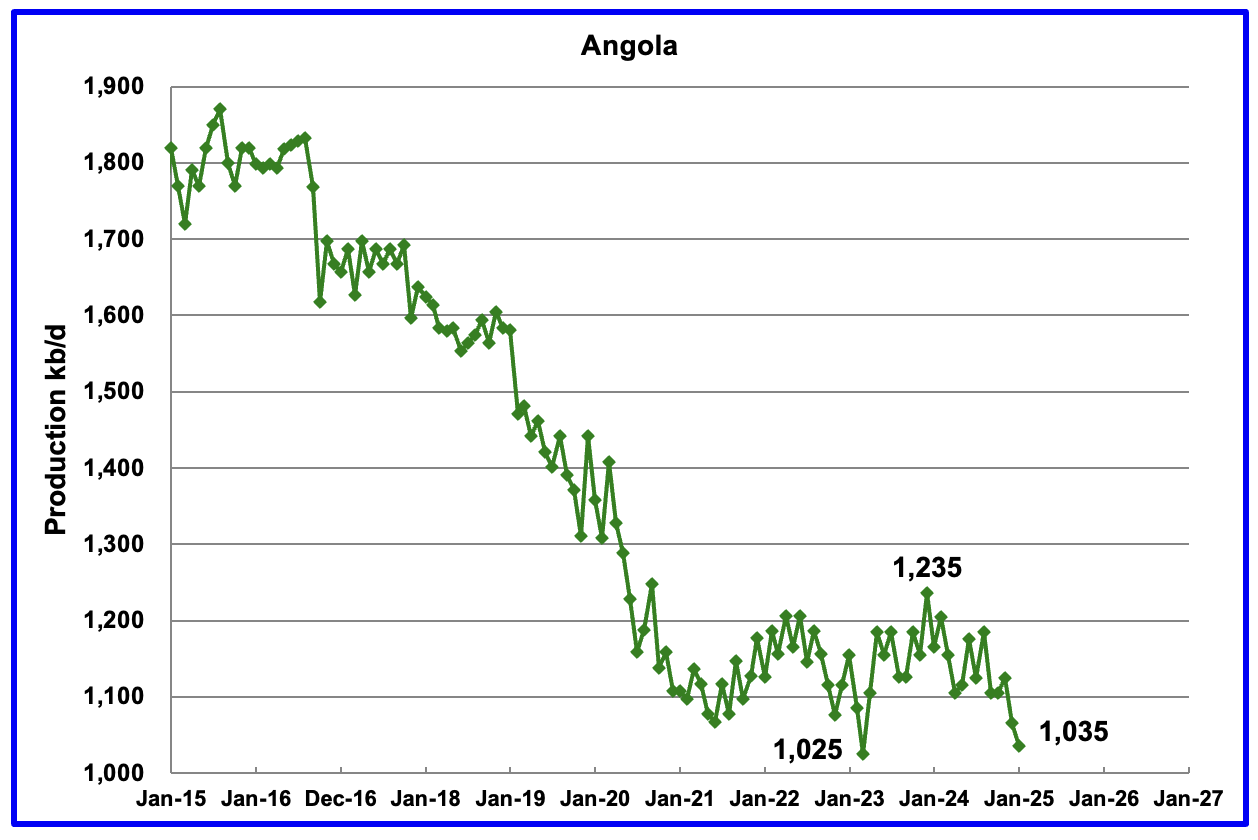
Angola’s January production dropped by 30 kb/d to 1,035 kb/d. Since early 2022 Angola’s production settled into a plateau phase between 1,100 kb/d and 1,200 kb/d. However December and January brought a drop below the lower plateau.
According to the March OPEC MOMR: “Growth is set to be driven by the US, Brazil, Canada and Norway, with the main decline anticipated in Angola. Angola output has now dropped for two months and is just 10 kb/d above its previous low.
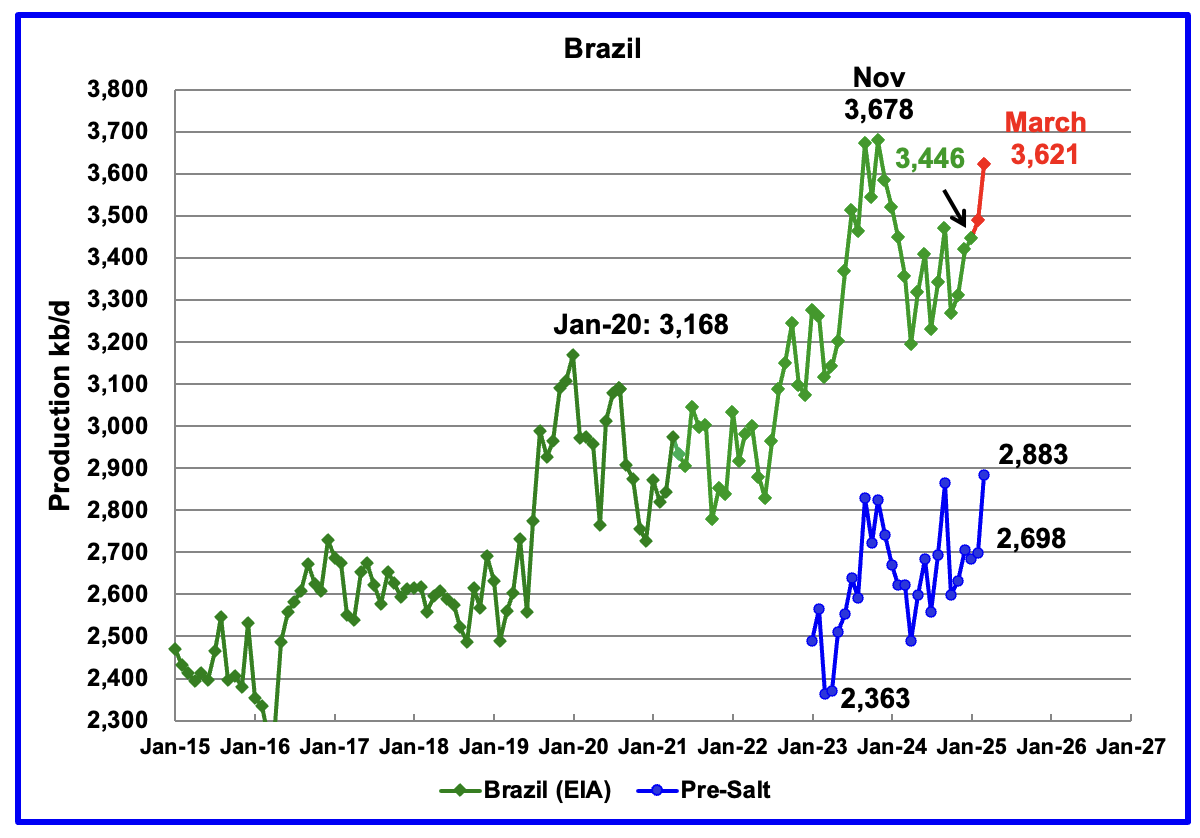
The EIA reported that Brazil’s January production increased by 27 kb/d to 3,446 kb/d.
Brazil’s National Petroleum Association (BNPA) reported that production increased in February and March to 3,621 kb/d. The pre-salt graph tracks Brazil’s trend in the oil graph. For March, pre-salt production increased by 185 kb/d to 2,883 kb/d, a new high.
The February to March increase could be related to the addition of the two new floating platforms. The December OPEC report states that two new floating production storage and offloading (FPSO) platforms came online in November. It also mentions operational issues and slow ramp-ups in several offshore platforms continue to be an issue. Perhaps this explains the delayed March production ramp up.
The March OPEC report states “Petrobras initiated production from the FPSO Almirante Tamandaré (Buzios 7) in mid-February at the Buzios field, located in the pre-salt layer of the Santos Basin, as the sixth production system in this field.” It also states that scheduled startup of planned new platforms could be delayed, “Nevertheless, operational issues and unplanned disruptions could potentially delay some scheduled start-ups from the platforms.”
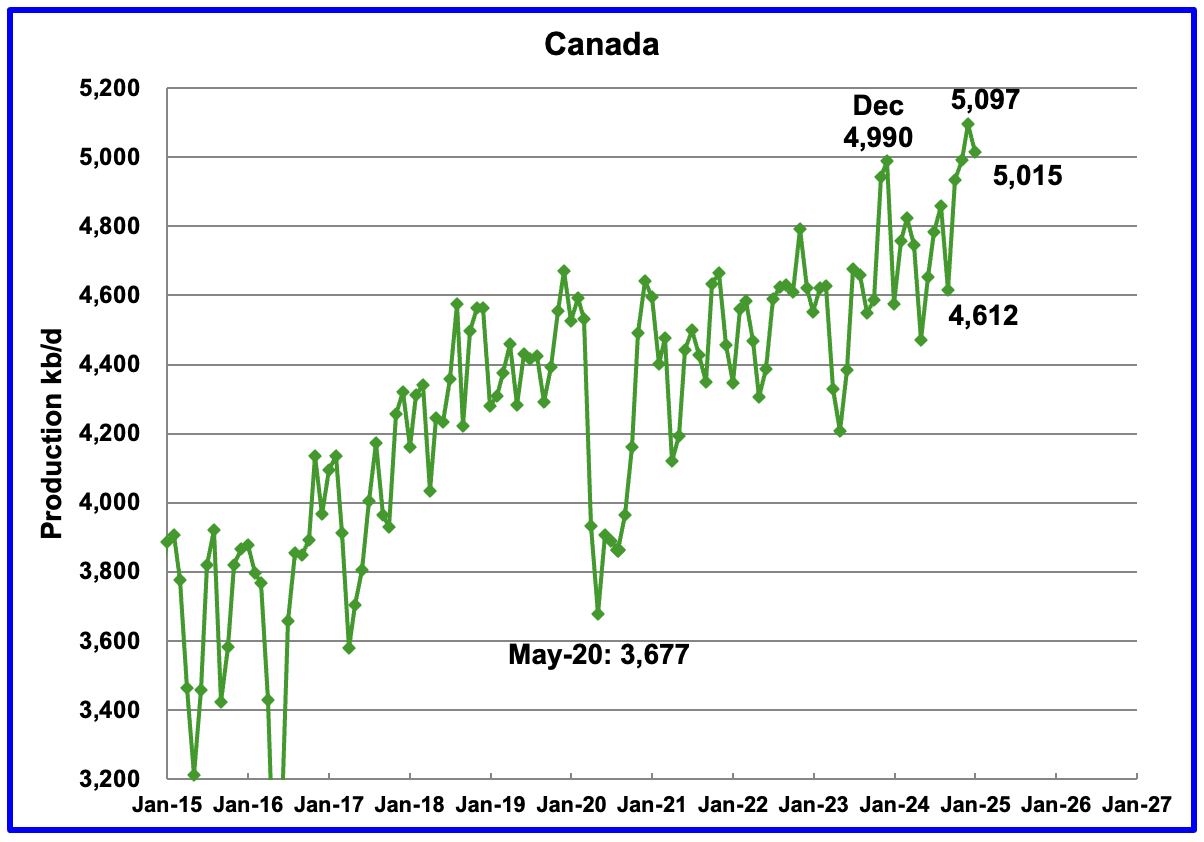
Canada’s production decreased by 82 kb/d in January to 5,015 kb/d after hitting a new high of 5,097 kb/d in January. Oil sands operations in February in the very cold Fort McMurray region are very difficult.
The Alberta premier is asking that the new Prime Minister Carney ease the anti oil sands policies of the previous government. If they don’t a referendum on separating from Canada could be held according to this Article.
Canada will be entering the LNG market in Mid 2025 according to this Article. The article also shows how the anti-FF policies of the previous government hampered the start of Canadian LNG projects.
“Canada and the United States both began proposing LNG export facilities at roughly the same time in the early 2010’s. In typical ‘let’s not wait around fashion’, the United States seized the moment and has become the world’s largest LNG exporter in the world since then. Canada has exported zero. Nothing.”
Travel time from Kitimat to Asia is close to 10 days vs 20 days from the US Gulf. This could result in more US LNG being shipped to Europe. Also it will reduce the amount of NG Canada sends to the US and could possibly support NG prices in the US as it may consume more internally, according to this Article.
“This milestone is pivotal for Canada’s energy sector, as LNG Canada represents the nation’s inaugural LNG export facility. Upon completion, the plant is projected to export 14 million metric tonnes per annum (MTPA) of supercooled natural gas, opening up new avenues for Canadian energy resources beyond the traditional reliance on the U.S. market.”
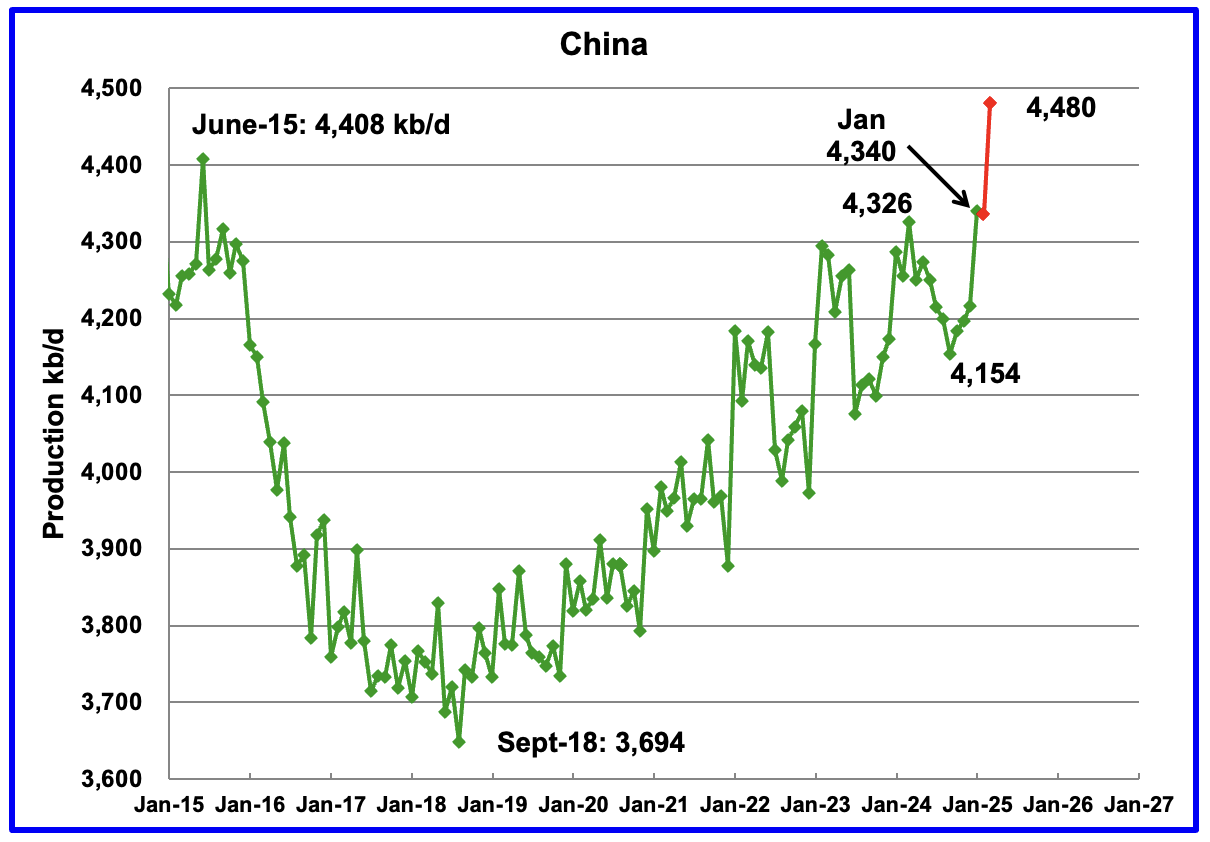
The EIA reported China’s January oil output increased by 124 kb/d to 4,340 kb/d.
The China National Bureau of Statistics reported average production for January and February of 4,335 kb/d, very close to the EIA’s January report. For March the Bureau reported that oil production surged to a new high of 4,480 kb/d. On a YoY basis, China’s production increased by 154 kb/d from the year ago high of 4,326 kb/d.
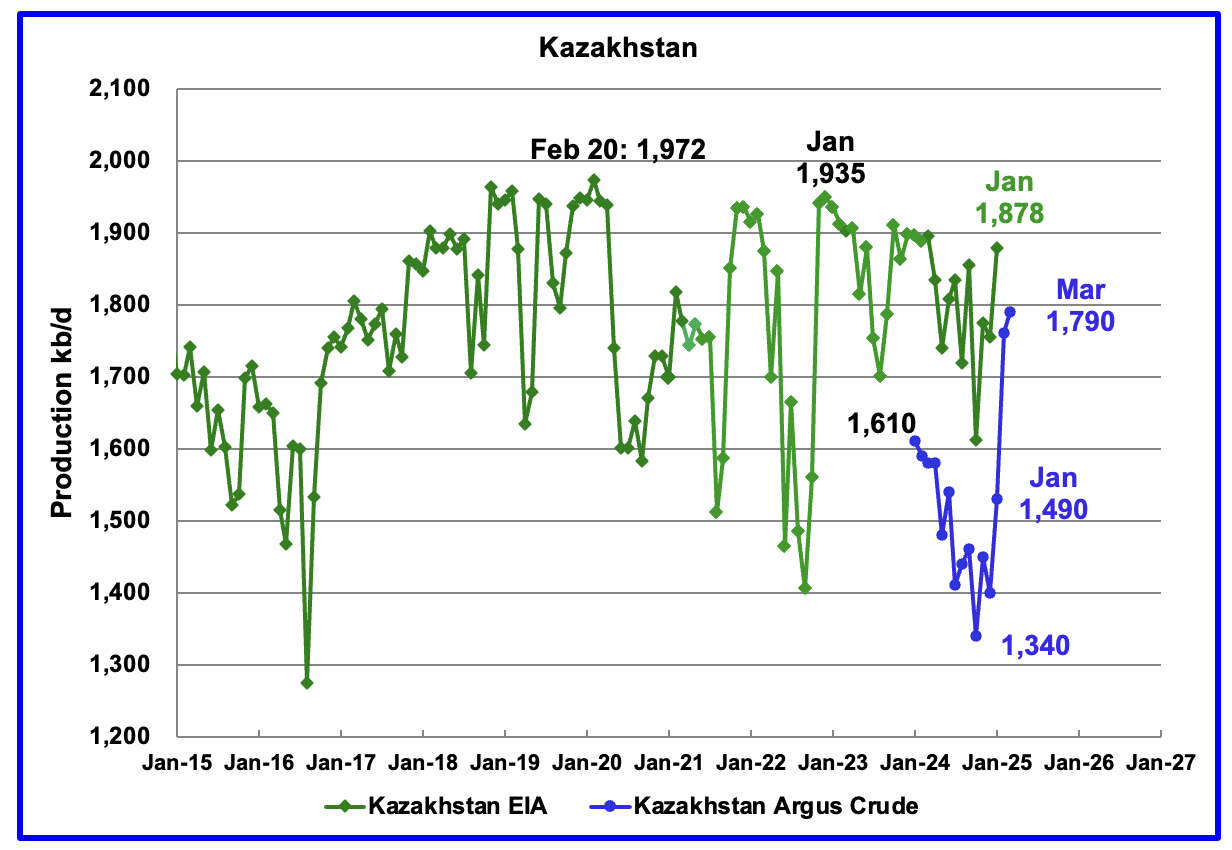
According to the EIA, Kazakhstan’s oil output increased by 124 kb/d in January to 1,878 kb/d.
Kazakhstan’s recent pre-salt crude oil production, as reported by Argus, has been added to the chart. In October pre-salt crude production dropped by 120 kb/d to a low 1,340 kb/d. Since then production has risen by 450 kb/d. March production came in at 1,790 kb/d due to a New Field coming online. Note this is crude whereas the EIA numbers are C + C.
Kazakhstan’s June OPEC crude production target is 1,500 kb/d. At 1,790 kb/d, Kazakhstan is 290 kb/d over their target. According to this Article, Kazakhstan says it has no plans to cut oil production this month (May) after massively exceeding its Opec+ target in March.
Since Kazakhstan’s reduction promises have not materialized, OPEC announced it would “accelerate plans to revive halted supplies in May and June, with an increase triple the size originally scheduled of 411 kb/d in each of May and June”.
Combined with the Trump tariffs the production increase announcement dropped the price of WTI/Brent by $10/b over two days. OPEC is trying to send a message to Kazakhstan to comply with its production target.
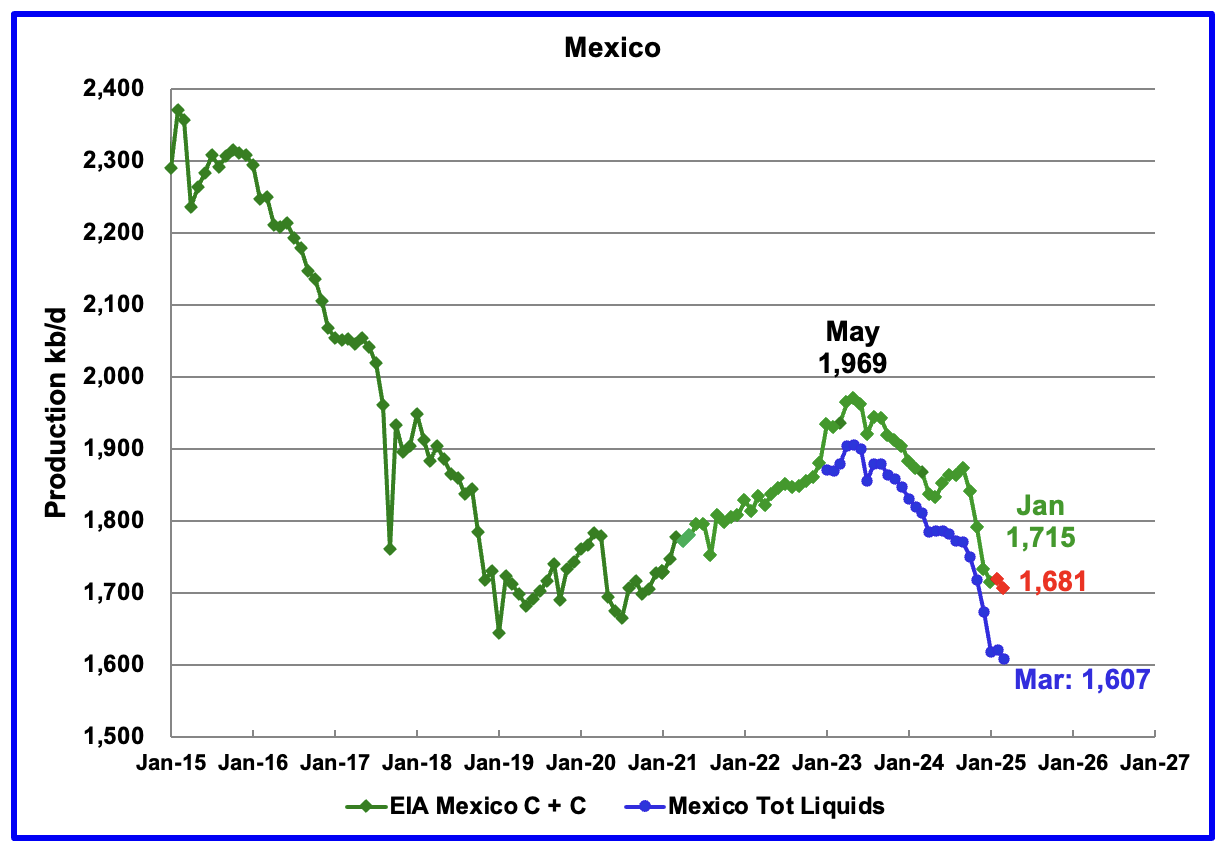
According to the EIA, Mexico’s January output dropped by 18 kb/d to 1,715 kb/d.
In June 2024, Pemex issued a new and modified oil production report for Heavy, Light and Extra Light oil. It is shown in blue in the chart and it appears that Mexico is not reporting condensate production when compared to the EIA report.
In earlier reports, the EIA would add close to 55 kb/d of condensate to the Pemex report. However for October and November it was increased to 122 kb/d and 117 kb/d respectively. For December, the condensate addition returned close to its original increase of 55 kb/d. The January addition was 98 kb/d.
For February and March production, 98 kb/d have been added to Pemex’s production to estimate Mexico’s February and March C + C production, red markers. Note that Mexico’s production, according to Pemex, has continued to fall every month since May 2023, except for one month.
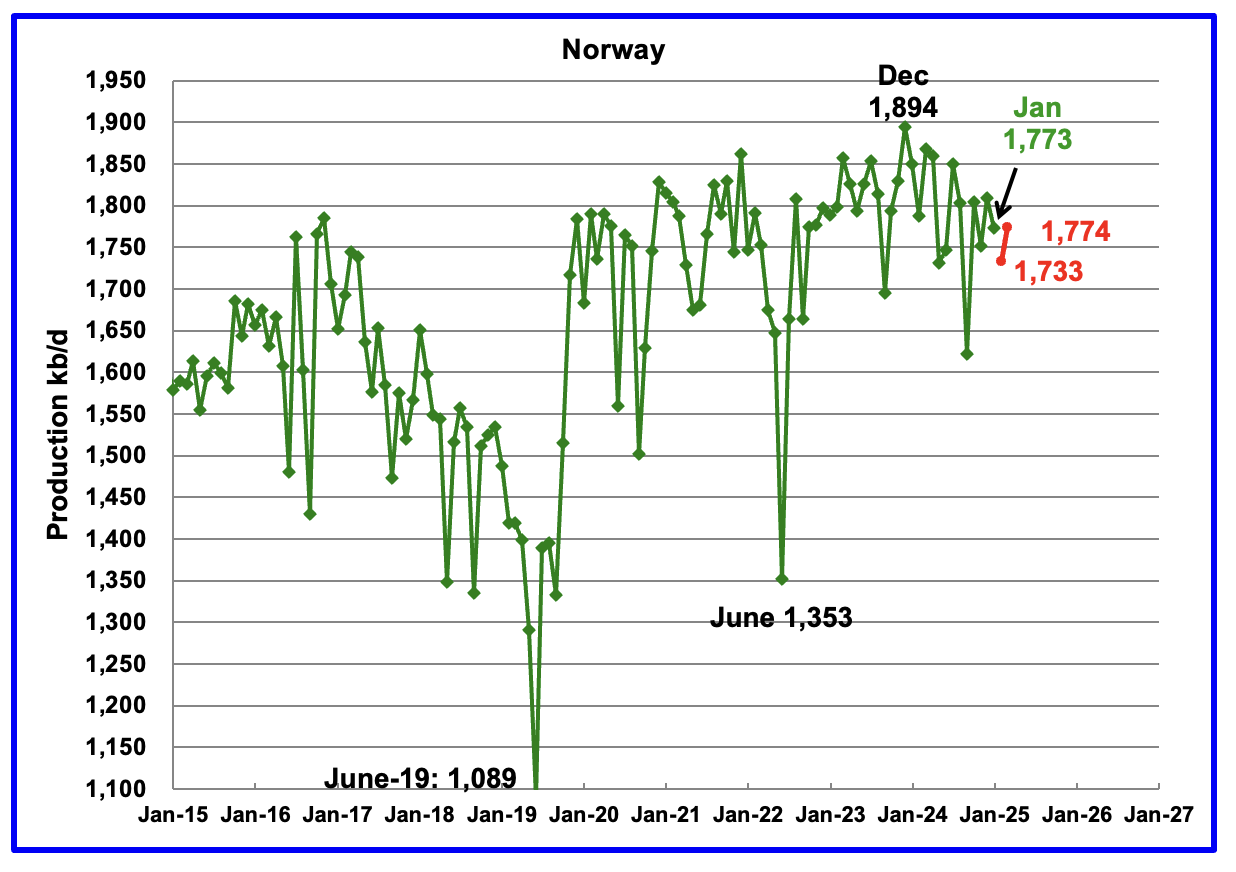
The EIA reported Norway’s January production declined by 37 kb/d to 1,773 kb/d.
Separately, the Norway Petroleum Directorate (NPD) reported that February production dropped by 40 kb/d to 1,733 kb/d and March rebounded to 1,774 kb/d, red markers.
The Norway Petroleum Directorship reported that March’s oil production was 4.2% above forecast.
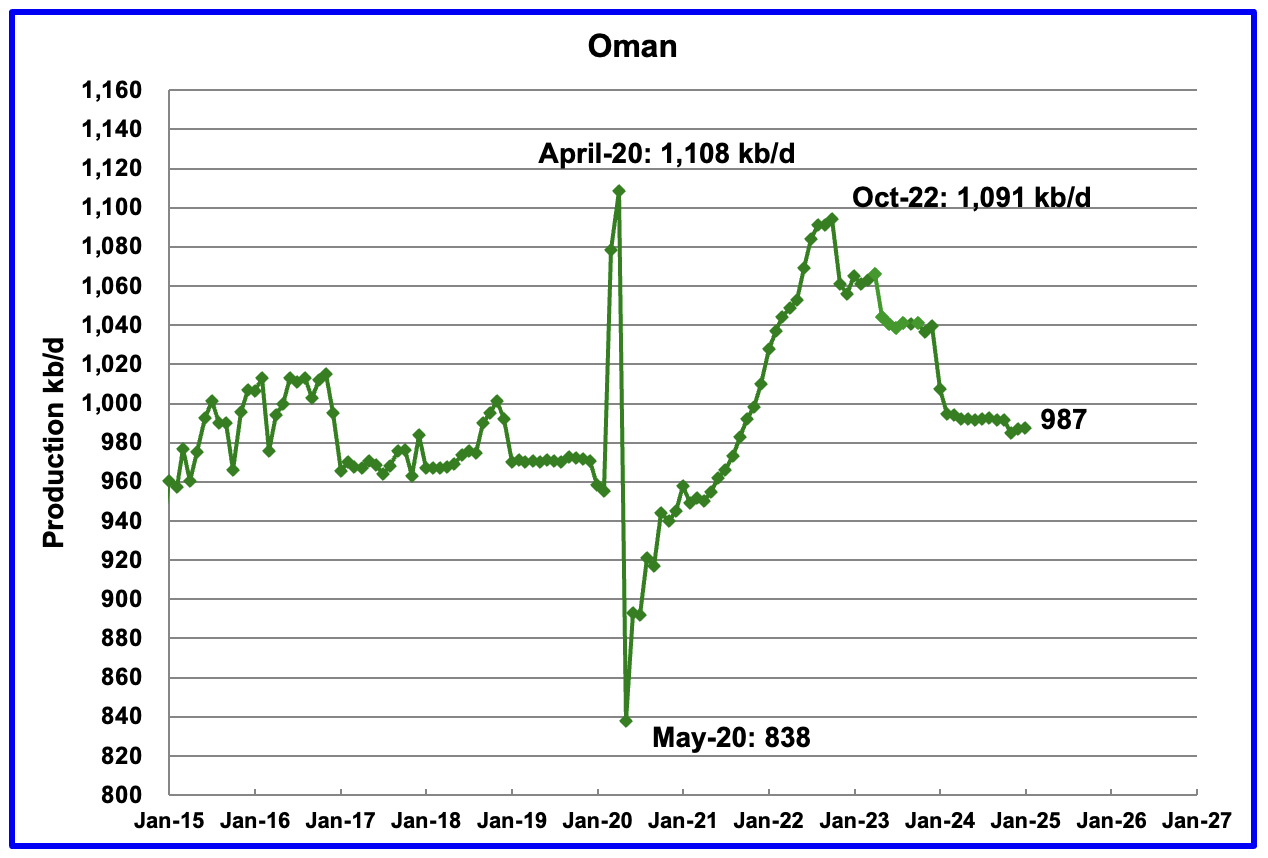
Oman’s production had risen very consistently since the low of May 2020. However production began to drop in November 2022. According to the EIA, January’s output rose by 1 kb/d to 987 kb/d.

The EIA had been reporting flat output of 1,322 kb/d for Qatar since early 2022. However the EIA revised down all of the previous production data up to April 2024. May 2024 production reverted to 1,322 kb/d. Qatar’s January output was reported again to be 1,322 kb/d.
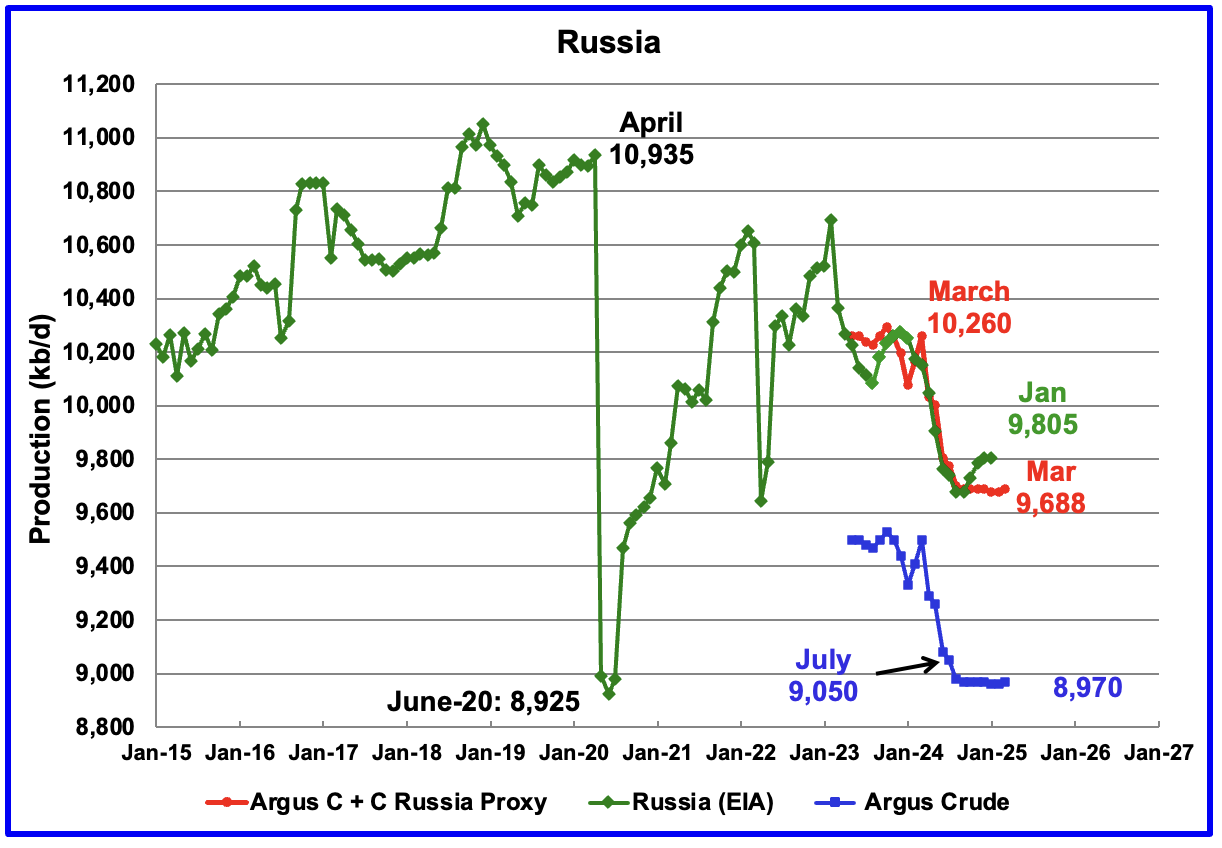
The EIA reported Russia’s January C + C production was flat at 9,805 kb/d and was down 455 kb/d from March 2024. It is also 128 kb/d higher than the Argus Russia proxy estimate of 9,677 kb/d for January.
Russia’s new required crude production for June is 9,161 kb/d. It will interesting to see if their production will rise starting in May 2025.
For comparison: This chart was posted May 3 and used the April STEO forecast.

The forecast portion of this production chart is very different to the one published last week in the US update post. For this chart the STEO forecast portions of the two graphs have been updated using the May 2025 report.
There has been a significant drop in expected production between March 2025 and December 2025. Regardless, I think there is more hopium than reality in the forecast up to December 2025.
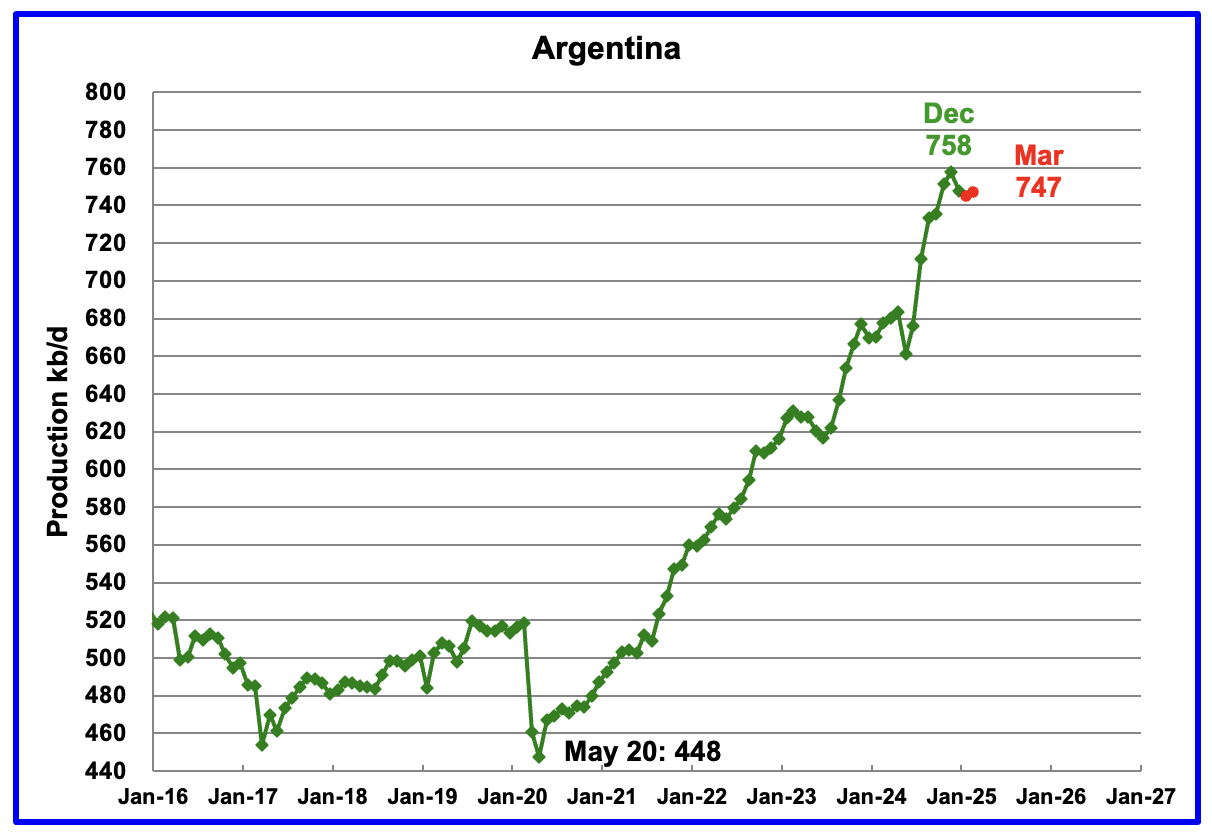
Normally, Argentina’s oil production is not reported because its production is lower than 1,000 kb/d. However production has been steadily rising over the last five years due to the startup of shale oil and gas production in the Vaca Muerta basin.
For January, the EIA reported Argentina’s production dropped 10 kb/d to 748 kb/d.
The Argentinian Energy Secretariat reported oil production in March rose by 2 kb/d to 747 kb/d.
The two previous production drops occurred in July 2023 and June 2024. Is Argentina’s production growth about to slow on its way to an expected 1,000 kb/d a few years down the road?
Great post and charts Ovy, thanks.
U.S. Oil Production Has Peaked! Or so says Diamondback.
This link was posted on the last thread but I will post it again just to make sure everyone sees it. Bold theirs.
“We Are At A Tipping Point”: Shale Giant Diamonback Says US Oil Output Has Peaked, Slashes CapEx Amid OPEC Price War
The OPEC price war has made landfall in the US.
Following our report earlier that Saudi Arabia has declared a new price war on OPEC+ quota-busters such as Kazakhstan, and non OPEC+ members such as US shale producers, today after the close Diamondback Energy, the largest independent oil producer in the Permian Basin, made a historic pronouncement today when it said that production has likely peaked in America’s prolific shale fields (something we also mentioned earlier in the day) and will decline in the months and years ahead after crude prices plummeted.
Separately, the Texas company trimmed its own full-year production forecast Monday, and said that itexpects onshore oil rigs across the entire US industry to drop by almost 10% by the end of the second quarter and fall further in the months after.
“This will have a meaningful impact on our industry and our country,” Diamondback Chief Executive Officer Travis Stice wrote. “We believe we are at a tipping point for U.S. oil production.”
Ron
Thanks
Attached is a similar article from the CEO of Oxy. They are also cutting capex.
“Occidental is reducing the midpoint of its annual capital spending guidance for 2025 by $200mn on the back of further efficiency gains. The US independent also plans to trim domestic operating costs by $150mn.”
What is surprising is that the CEO thought that Permian production would continue to grow through 2027.
https://www.argusmedia.com/pages/NewsBody.aspx?frame=yes&id=2686612&menu=yes
Thanks for the nice post, OVI!
Argentina Vaca Muerta has seasonal winter plateau slow down in TIL, you could find more details here,
https://app.powerbi.com/view?r=eyJrIjoiNDQ1OGQ4MGMtYmQyYi00NzYxLWFlNTMtOGI0ZjRhZGE4NTBkIiwidCI6IjVmMThiN2ZhLTdmMmQtNDQ5ZC1hZjhkLTliZTNiM2ViZmFhYSJ9
here are some numbers:
1. total VM oil wells, 2890, total oil production 411KBOPD, GOR 0.983 MCF/bbl, compared to NOVI July 2023 Permian’s 45K wells producing 5.2Million BOPD, GOR @ ~4MCF/bbl
2. total VM gas wells, 769, total gas production 60Million m³ or 2.1BCFPD 35K BOPD; compared to NOVI 2023 PA’s 11K wells producing at 20BCFPD, and no oil; or NOVI 2023 Haynesville’s 7K wells at 15BCFPD.
Key takeaways: Gas production rise fast in condensate block of LaC, with GOR about 6~10MCF/bbl; and oil production in low GOR black shale oil also rising fast.
The champion lateral BPO 2801, less than 5K ft long, already produced over 1.2Million BO in less than 400 days, with GOR at less than 0.4 MCF/bbl,now the best IP 12mon well in Argentina history, conventional included.
Sheng Wu
Thanks for the info and the comparison with the Permian.
I use a different source for Argentina production. It is a spreadsheet which I download from the attached site and gives monthly production. I have compared their numbers with those from the EIA and they are the same.
At the top of the 2019 sheet one can select any year. Attached is a Table that shows results for the last three months of 2024 which are the same as the EIA’s.
http://datos.energia.gob.ar/en/dataset/produccion-de-petroleo-y-gas-tablas-dinamicas
Yes, OVI,
Argentina’s portion of shale oil and gas in the nation total oil and gas production will be heading to the same numbers as in US, with shale oil and gas currently at ~60% and ~50%, and will reach >80% and >70% in 2030 when VM production reaches 1Million BOPD, and gas over 100million Cubic meter PD. The higher oil numbers shows the nature of VM which features more oil than gas.
a mistake, Novi PA actually produce some oil from Marcellus and or Utica, about 10~18KBOPD
D C,
Here is the overlap of WV PA gas (including Marcellus and Utica, but Utica is minor at no more than 1.3BCFPD) withdraw plot till Feb 2025 and Saputra 2024 paper prediction (actual production ends at 2020).
The deviation obviously comes from lower estimate of the EUR and productivity improvements for 2020 wells.
here is overlap of NOVI Haynesville and Saputra prediction,
The deviation here for Haynesville is also huge for Saputra and actual production is mainly due to the sudden spike of realized well-head price in Haynesville, and almost double of rigs and wells drilled and completed since 2022. This increase of well-head price also prompt non-core wells to be drilled and TIL; while we should also note that the improved productivity per foot and EUR also helped the “non-core” laterals minimizing its difference to “core” laterals.
Besides the gap in post 2020 laterals’ productivity & EUR per foot between Saputra2021 prediction and actual production data, the deviation for Marcellus is huge also due to the improved economic in WV wet gas and condensate and the resulting more laterals TIL, and a less extent by the gas price hike due to war in Ukraine 2022 as in Haynesville.
This is evidenced by the number of wells TIL each year in PA after 2019 has been slightly decreasing, while production actually slightly increase or held constant. At the same time, the number of wells in WV should be increasing obviously, but not that significant and they are mainly due to increase in productivity & EUR per foot.
Here is an overlap of the Saputra forecast for Permian and actual production (Novi July 2023), and it also shows obvious gap although smaller than Marcellus and Haynesville.
It seems that the gap is mainly a result of sudden bounce back of rigs after 2021 and further sharp increase of rigs, and hence sharp number of wells completed each year in Permian from 2022, compared to Haynesville and Marcellus. This will foreward loading the production, or squeeze Saputra forecast of “core” laterals, resulting earlier peaking and faster fall-off.
One obvious flaw I just found from Saputra forecast for Permian is that they put a GOR number too low and almost no change from actual.
Saputra estimate/forecast of GOR for “base Core” laterals almost fixed at 4MCF/bbl from 2020 to 2030, and this caused their “base Core” oil and gas URR at ~32.2GBO and only 120TCF and GOR ~3.7MCF/bbl, by adding “non-core”, the oil and gas URR will be 54.4GBO and 246TCF and GOR ~4.6MCF/bbl).
Sheng Wu,
The differences are primarily due to different levels of wells completed per month vs the a
levels assumed by Saputra. For Permian they assumed 400 wells per month for core areas, actual levels have been close to 480 wells per month, in addition there were increasing lateral lengths which caused some increase in average well productivity. No doubt there were also changes in lateral length and productivity in Marcellus and Haynesville along with different levels of completion in reality compared to what was assumed when the papers were initially written in 2018. For Haynesville they assumed a 20 well per month completion rate, but the actual completion rate was about 42 wells per month from July 2022 to July 2024.
For Haynesville Saputra et al assumed a completion rate of 20 wells per month from 2020 to 2025, actual rate from 2020 to 2023 was about 40 wells per month, also productivity increased after 2019, probably due to longer lateral length.
Sheng Wu,
The Gas estimate may be low, for a scenario with similar total completions as their base plus core, I get about 37 Gb C plus C and 180 TCF of natural gas.
For Marcellus from 2020 to 2022 Novi has completion rate of 50 wells per month in PA only, when WV wells are added the number would be higher, perhaps 70 per month total. This is the main difference.
Also The WV Marcellus had about 20 completions per month in 2020, so the guess of 70 wells per month for PA and WV may be low, perhaps 80 would be a better guess.
here are the 2023, 2022 WV report,
http://www.wvgs.wvnet.edu/www/datastat/Marcellus/reports/WVGES2023MarcellusandUticaPtPleasantProductionSummary.pdf
http://www.wvgs.wvnet.edu/www/datastat/Marcellus/reports/WVGES2022MarcellusandUticaPtPleasantProductionSummary.pdf
so, 2023, 2022 HA6 laterals are at 2944, 2712, so 232 laterals added in 1 year from 2022 to 2023, average lateral length only increased ~145′ from 12,741′ to 12886′, and gas production increased ~0.8BCFPD. The 2023 report page 4 gave the number of HA6 completed as less than 190, 170, 150, and 100 in 2022 and 2023 respectively, and average lateral lengths increase has been much slower too, only from 11,800 to 12,886′.
Obviously, the produtivty & EUR per foot increased significantly for WV Marcellus since 2020 when 2024 Saputra paper used the data up to 2020 (submitted May 2021 using data up to end of 2020). No wonder WV USGS Boswell gave the URR so high, especially in WV, where recovery over 100% OGIP (Original Gas in Place) is common.
Other years from 2020 to 2021 have different method of counting total laterals than 2022, and 2023.
So 232 wells completed in 2023 in WV Marcellus or about 20 per month, so perhaps 70 per month for PA and WV, that is 40% more than Saputra model and accounts for higher actual output than their scenario.
here is an overlap of all wells till 2019 in Bakken predicted by Saputra (https://www.mdpi.com/1996-1073/13/8/2052) and actual from NOVI (2018 is red color), and Saputra predicted 4.5GBO for all wells till 2019, and actual probably delivering EUR at 5.1~5.3GBO? or averaged EUR for each lateral at 335~360K BO?
Sheng Wu,
The Saputra et al model may be a bit pessimistic, my model has URR of about 4.9 Gb for same number of wells through November 2019. An average of 329 kb per well. The average 2019 well for my model has EUR of 365 kbo.
What matters is diesel
22 Apr 2025
Australian Diesel imports update January 2025 data. Preparing for surprises in the Strait of Taiwan
https://crudeoilpeak.info/australian-diesel-imports-update-january-2025-data-preparing-for-surprises-in-the-strait-of-taiwan
This post contains Taiwan scenarios of several US think tanks
lots of the bunker fuel and marine diesel along with trucks on the road will be replaced by LNG, gas rich Australia might work with Singapore and S. Korea to build more LNG trucks and ships.
Sheng Wu,
The U.S. tried that LNG Trucking Route and gave it up years ago. Two LNG facilities were at opposite exits in the town I used to live in, and both were taken down. The BLU facility was dismantled and a Car Wash and Tesla Charging stations were put up in its place. And the other LNG Facility located at the Flying J Truck stop, never used, was also dismantled.
UPS used the BLU LNG Facility at the first exit for years until the company decided to return to diesel, since you need 40% more LNG in volume to provide the same energy as a gallon of diesel. I spoke to some of the UPS drivers, and most of them couldn’t stand using LNG because they were constantly worried that there wouldn’t be enough fuel to get them back due to the lack of LNG facilities.
While China has transitioned more of its Trucking Fleet to LNG, I don’t see this as a big game changer for the world.
I find it interesting that individuals think we can just PLUG & PLAY some other energy source to fill a peak elsewhere.
At some point in time, HUMANS will have to wake up to the fact… that we will join many of past civilizations that PEAKED and COLLAPSED due to Resource constraints.
But… until then… many will continue to believe in PLAN B.
steve
I seriously believe LNG and CNG in US truck and cars are rigged by oil refineries and big oil companies.
The kit to convert cars from gasoline to CNG is only $200 in China and Iran, and cylinder cost another $200. Yet, majority US states prohibit modification. CNG only survive in green extreme states like California, used in buses and waste disposal trucks.
Sheng Wu,
You believe in an Oil & Refining Industry Great Conspiracy against LNG & CNG? I see…
Regardless… when talking to Truck Drivers who use LNG, you get a different story. Diesel is safe and doesn’t ignite easily…. It’s oily. When filling LNG in a truck, you need a special Plastic Mask to keep the supercold fuel splashing in your eyes.
LNG Tanks have to be 40% larger to have the same capacity as diesel tanks. Moreover, LNG Semitrucks cost 20-30% more than typical diesel trucks.
I doubt the Oil & Refining Industry needs to waste time in a Grand Conspiracy against LNG when the Logistics and Economics were the DEATHKNELL..
steve
there is another big thing that big oil and refineries did to kill LNG or CNG, the price!
The price for CNG is not much less than gasoline when comparing the same 100 miles consumption. The CNG price at the city pump is about 2.5~5X at HH.
Sheng Wu,
You do realize the U.S. consumes roughly 8.5 Mb/d of gasoline. If we decided to transition that to CNG, that same 8.5 Mb/d of gasoline would take about 50 Bcf/d of Natgas to make CNG.
Even if it CNG was more efficient, we don’t have another 30-40 Bcf/d of natgas lying around to make CNG.
steve
The biggest drawback to LNG usage in long-haul transport–other than the important one Steve mentioned–is the fact that unless the vehicle is moving all the time, drawing down the LNG tank and necessitating frequent refills, you have to vent the tank to get rid of boil-off gas. That’s basically like venting a shale oil well: you’re sending a stream of pure methane into the atmosphere, a concept that would last about as long as a fart in a whirlwind with the clean energy group (for good reason). The LNG tankers use that boil-off gas for their own propulsion upon the water, so the trip is free from the standpoint of fuel. Diesel is a great fuel and we can refine it from the middle distillates of good LTO. At some point, when we’ve run through most of the LTO and still have NG in abundance, then CNG will be a sensible choice, but as long as there’s diesel, well, I wouldn’t hold my breath. And CNG is used in LA buses mainly in highly congested areas (airport shuttles) with nearby facilities for refueling. The late T. Boone Pickens devoted the last decade of his life advocating for CNG. He was well connected to Big Oil and refineries. The cost of carriage of CNG and for new infrastructure just isn’t there; Cummins has tried for well over a decade. As to why China would use CNG or LNG when they have two-billion barrels of crude oil in storage, well, I imagine they are storing up crude for a specific purpose.
Australia is squandering most of its gas in LNG exports. In fact, there is a gas shortage on the East Coast because Victoria’s conventional gas production has peaked
28 Mar 2024
Peak gas in Victoria, Australia
https://crudeoilpeak.info/peak-gas-in-victoria-australia
and the coal seam gas is exported in Gladstone, made expensive by global LNG prices.
25/7/2018
Australia is exporting itself gas poor, plans LNG import terminals
http://crudeoilpeak.info/australia-is-exporting-itself-gas-poor-plans-lng-import-terminals
27/3/2017
Howard’s energy super power stuck in domestic gas shortages
http://crudeoilpeak.info/howards-energy-superpower-stuck-in-domestic-gas-shortages
7/4/2015
Australia’s alternative transport fuel: The East Coast gas-ship has sailed
http://crudeoilpeak.info/australias-alternative-transport-fuel-the-east-coast-gas-ship-has-sailed
Ovi
You constantly show a peak in PRODUCTION in November 2018.
What I have read is much of the October and November increase was not production but Saudi Arabia selling large amounts of oil they had in storage.
https://www.opec.org/assets/assetdb/momr-january-2019-1.pdf
https://www.opec.org/assets/assetdb/momr-november-2018.pdf
There is no way Saudi Arabia suddenly increased production by 600,000 barrels per day in a month or so and then production suddenly fell back.
A 12 month moving average is far less likely to be twisted by storage releases as storage has its limits.
Using a 12 month moving average will give a new high by November if OPEC produces what it says it will.
Loads of Oil,
It was not just KSA, it was all OPEC plus producers. It is well known that OPEC plus had decided it would establish new quotas at the end of 2018, the month before this meeting all members produce at capacity as this number is the basis for quotas. That is the reason Nov 2018 was the peak, along with high output by non-OPEC.
I agree the 12 month average is more useful.
Loadsofoil
As Dennis mentions, there were a number of factors that came together at that time.
Looking at the big 3 chart above, it first peaked at 34,097 kb/d in November 2018. Note how production actually started to rise sharply in June 2018.
On a country basis from August 2018 to November 2018, here are some of the bigger contributors.
– Iran: -825 (yes negative)
– Kazakhstan: 258
– Saudi Arabia: 580
– UAE: 190
– US: 524
The total increase over those 3 months was 1,371 kb/d. I think that Iran was hit with sanctions then and that was another reason OPEC decided to raise production to offset their drop. As for Saudi Arabia’s increase, some could have come from inventory.
Attached also is the first chart with a bit of a 12 month CMA added. Doesn’t look peaky enough for me.
I have analyzed the 2018 peak in Fig 2 (peak shaping countries) in my post:
25 Mar 2025
Post-Covid crude production in world outside the US still lower than end 2018
https://crudeoilpeak.info/post-covid-crude-production-in-world-outside-the-us-still-lower-than-end-2018
There are 3 peak shaping processes:
1. one or more countries increasing and then reducing production in the given period (Libya, Saudi Arabia)
2. countries with increasing production (Russia, Kazakhstan, UEA. Iraq, US, Kanada)
3. countries with decreasing production (Iran, Venezuela, Mexico)
These countries explain about 92% of the 2018 peak.