By Ovi
The focus of this post is an overview of World oil production along with a more detailed review of the top 11 Non-OPEC oil producing countries. OPEC production is covered in a separate post.
Below are a number of Crude plus Condensate (C + C) production charts, usually shortened to “oil”, for the oil producing countries. The charts are created from data provided by the EIA’s International Energy Statistics and are updated to January 2025. This is the latest and most detailed/complete World oil production information available. Information from other sources such as OPEC, the STEO and country specific sites such as Brazil, Norway, Mexico, Argentina and China is used to provide a short term outlook.

World oil production decreased by 231 kb/d in January to 82,184 kb/d, green graph. The largest decrease came from the US, 305 kb/d. February’s World oil production is projected to increase by 400 kb/d to 82,584 kb/d.
This chart also projects World C + C production out to December 2026. It uses the May 2025 STEO report along with the International Energy Statistics to make the projection. The May STEO report notes its forecast only partially incorporated the world’s new tariff conditions.
For December 2026, production is projected to be 83,820 kb/d. The December 2026 oil production is lower than the November 2018 peak by 772 kb/d. December 2026 production has been revised down by 116 kb/d from the previous report.
From December 2023 to December 2026, World oil production is estimated to increase by 804 kb/d.
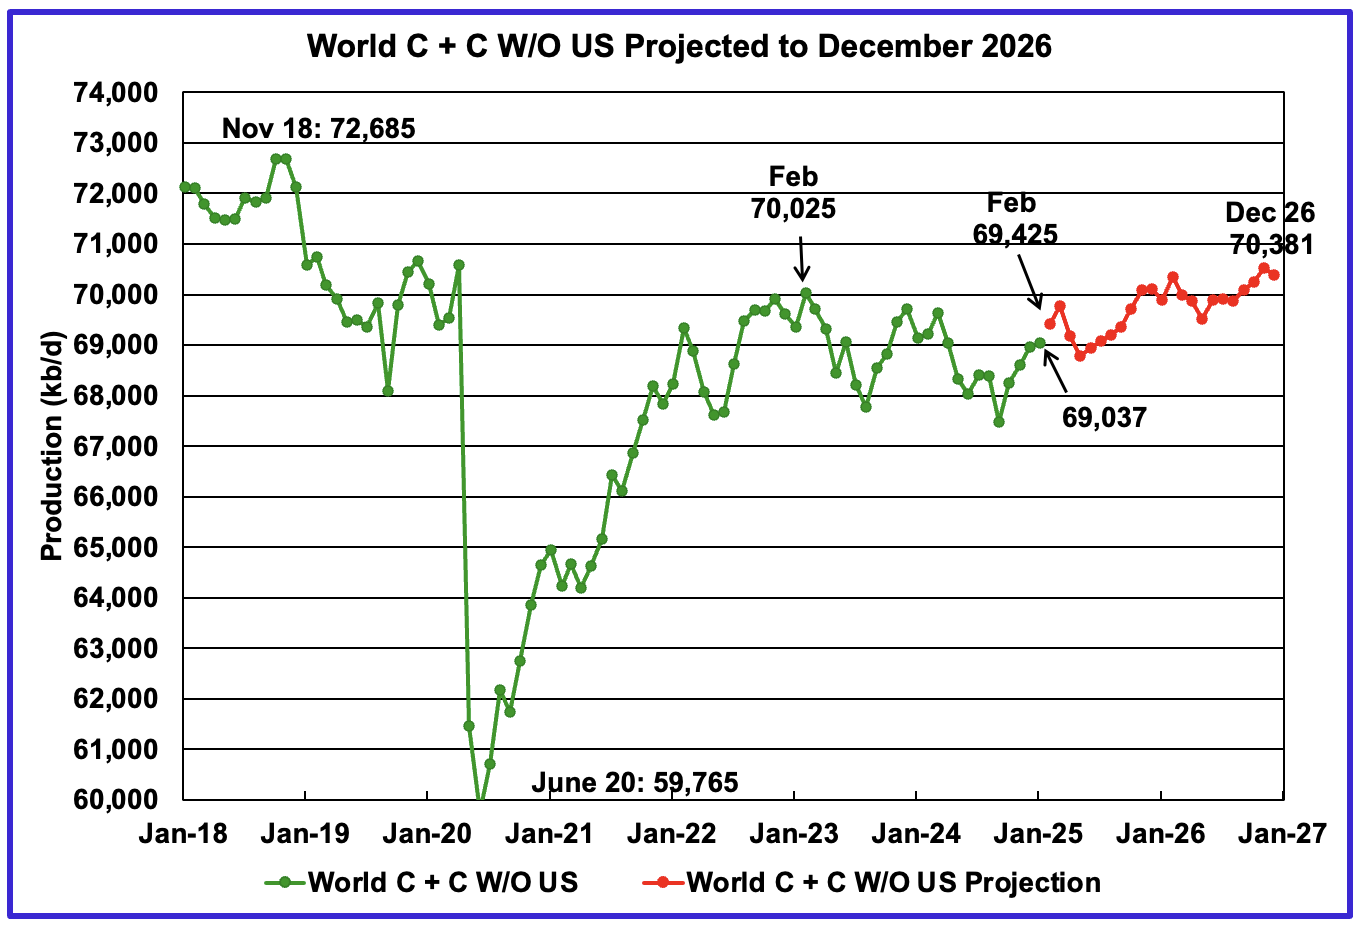
January’s World oil output without the US increased by 74 kb/d to 69,037 kb/d. February’s production is expected to increase by 388 kb/d to 69,425 kb/d.
The STEO is forecasting that December 2026 crude output will be 70,381 kb/d. Note that the December 2026 output is 2,304 kb/d lower than the November 2018 peak of 72,685 kb/d.
World oil production W/O the U.S. from January 2025 to December 2026 is forecast to increase by a total of 1,344 kb/d.
A Different Perspective on World Oil Production
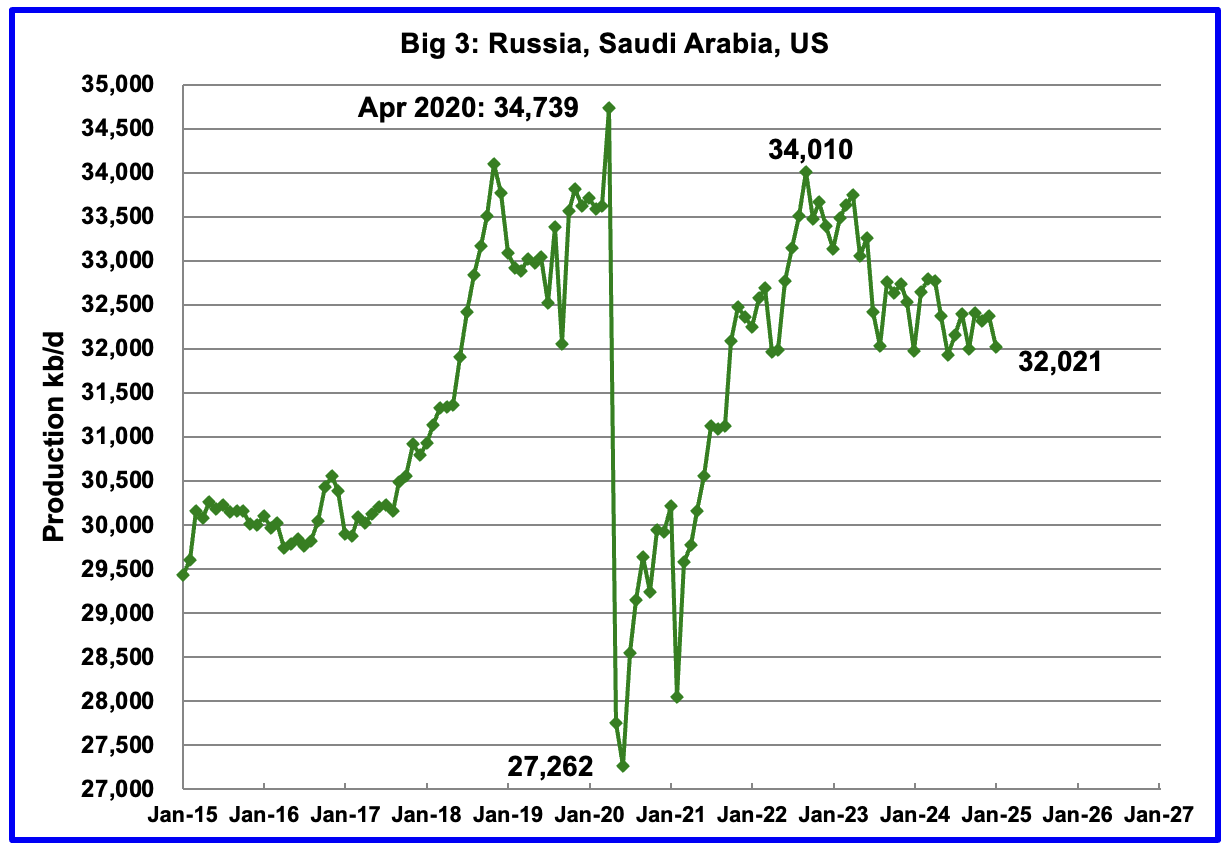
Peak production in the Big 3 occurred in April 2020 at a rate of 34,739 kb/d. The peak was associated with a large production increase from Saudi Arabia. Post covid, production peaked at 34,010 kb/d in September 2022. The production decline since then is primarily due to cutbacks by Saudi Arabia and Russia.
January’s Big 3 oil production decreased by 355 kb/d to 32,021 kb/d. Of the 355 kb/d decrease, the US accounted for 305 kb/d. Production in January was 1,989 kb/d lower than the September 2022 post pandemic high of 34,010 kb/d. OPEC has announced it will start increasing production in May so the 1,989 kb/d drop should start to get smaller.
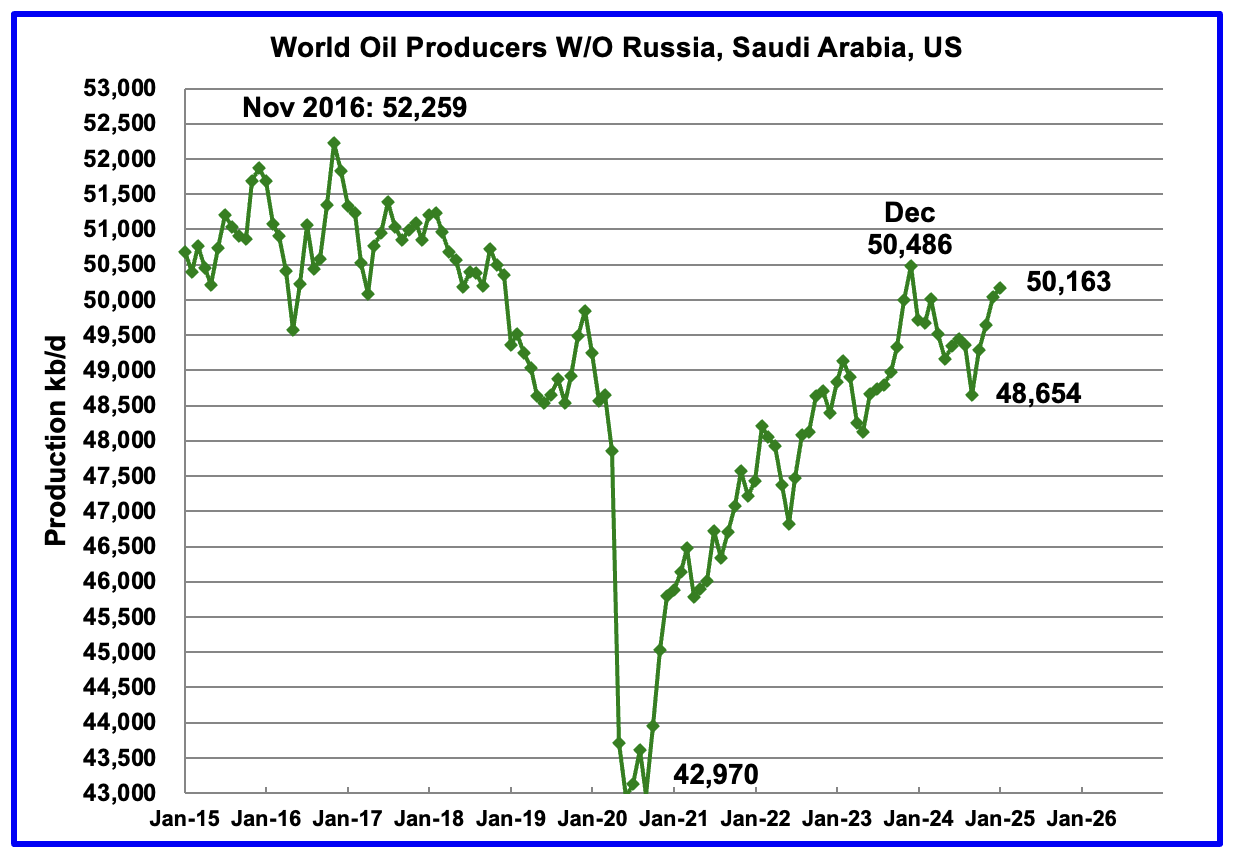
Production in the Remaining countries had been slowly increasing since the September 2020 low of 42,970 kb/d to December 2023. Production has risen for the last four months and output in January increased by 124 kb/d to 50,163 kb/d and is now 323 kb/d lower than December 2023.
Countries Expected to Grow Oil Production
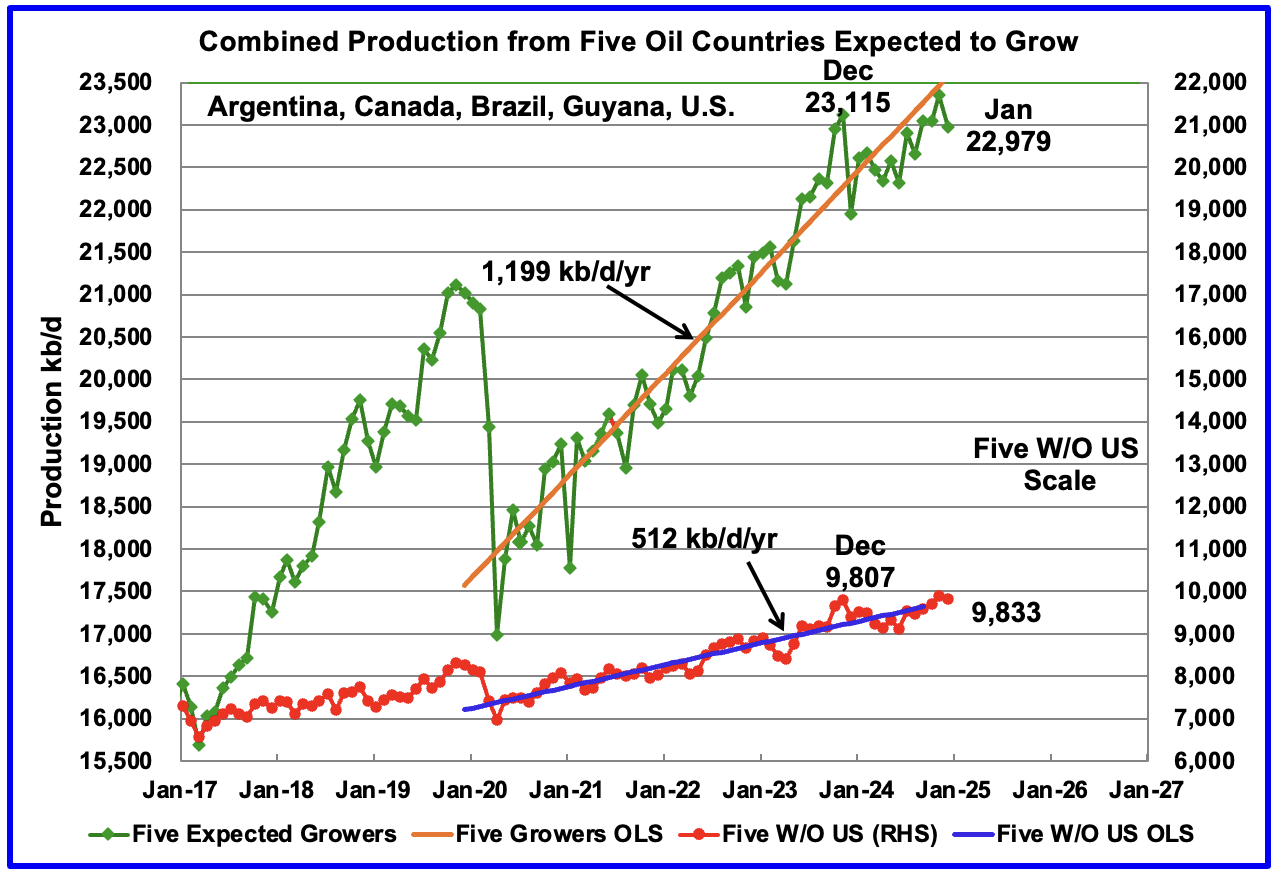
This chart was first posted a few of months back and shows the combined oil production from five Non-OPEC countries, Argentina, Brazil, Canada, Guyana and the U.S., whose oil production is expected to grow. These five countries are often cited by OPEC and the IEA for being capable of meeting the increasing World oil demand for next year. For these five countries, production from April 2020 to August 2024 rose at an average rate of 1,199 kb/d/year as shown by the orange OLS line.
To show the impact of US growth over the past 5 years, U.S. production was removed from the five countries and that graph is shown in red. The production growth slope for the remaining four countries has been reduced by 687 kb/d/yr to 512 kb/d/yr.
January production has been added to the five growers chart, down 370 kb/d to 22,979 kb/d. For the Five growers W/O U.S. January production dropped to 9,833 kb/d, down 65 kb/d from December 2024 and is 26 kb/d higher than December 2023.
The OLS lines have not been updated and will not be updated going forward unless additional production data provides a strong indication that production is rising/changing.
Production up to December 2023 may be a situation where the past is not a good indicator of the future. In this case it may be more important to focus on what has happened to production after December 2023 rather than before.
Countries Ranked by Oil Production
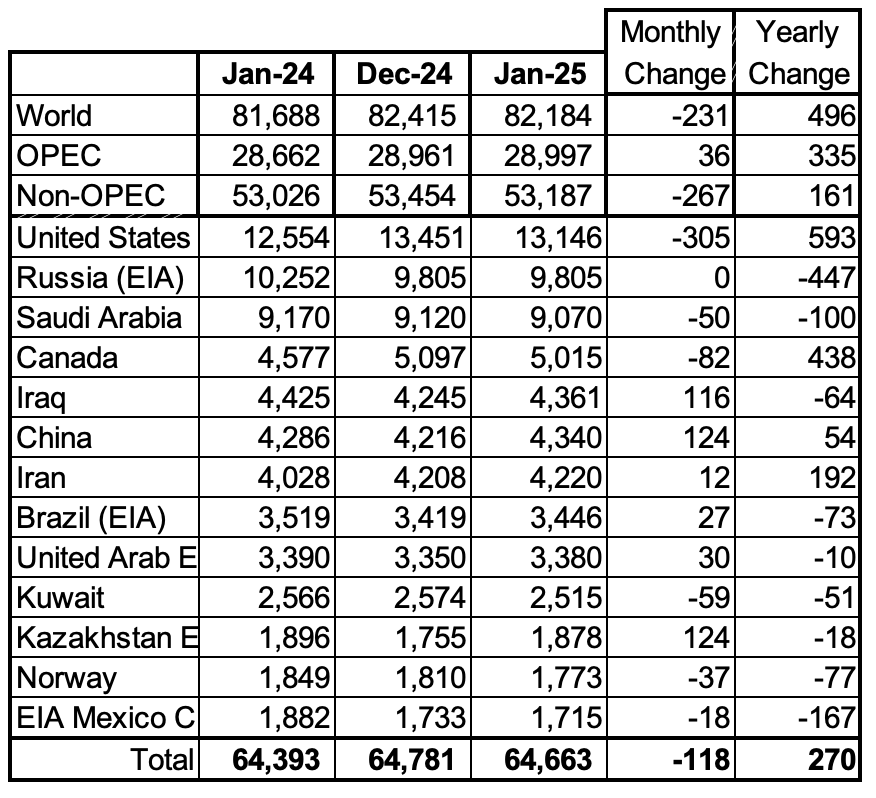
Above are listed the World’s 13th largest oil producing countries. In January 2024, these 13 countries produced 78.7% of the World’s oil. On a MoM basis, production decreased by 118 kb/d in these 13 countries while on a YOY basis, production rose by 270 kb/d.
January Non-OPEC Oil Production Charts
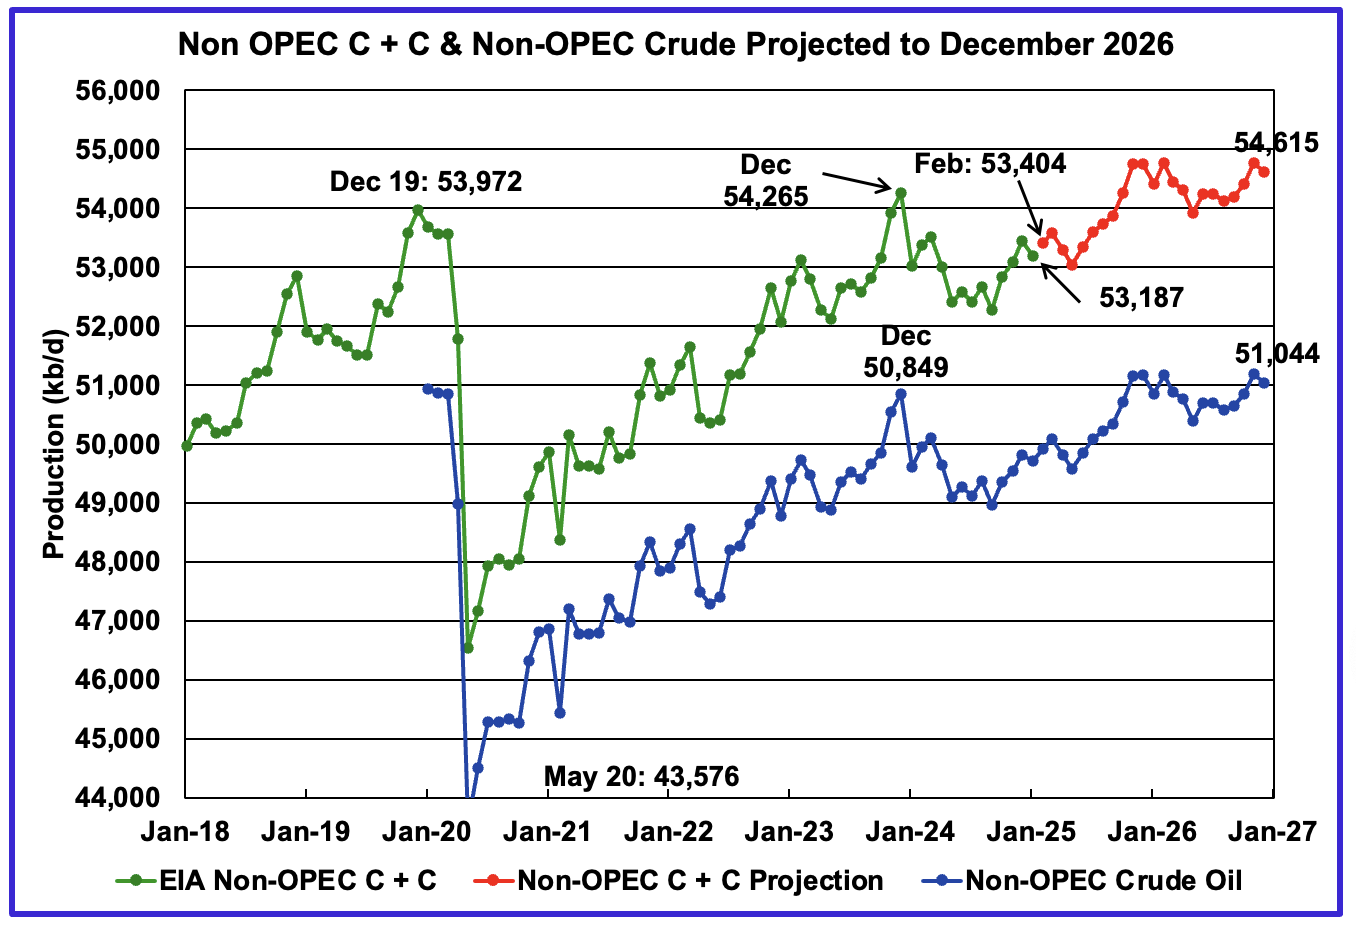
January’s Non-OPEC oil production decreased by 267 kb/d to 53,187 kb/d. February is expected to add 217 kb/d to 53,404 kb/d.
Using data from the May 2025 STEO, a projection for Non-OPEC oil output was made for the period February 2025 to December 2026. (Red graph). Output is expected to reach 54,615 kb/d in December 2026. December 2026 was revised down by 230 kb/d from the previous report.
From January 2025 to December 2026, oil production in Non-OPEC countries is expected to increase by 1,428 kb/d.

January’s Non-OPEC W/O US oil production rose by 37 kb/d to 40,040 kb/d. February’s production is projected to rise by 205 kb/d to 40,245 kb/d.
From January 2025 to December 2026, production in Non-OPEC countries W/O the U.S. is expected to increase by 1,137 kb/d. December 2026 production is projected to be 7 kb/d higher than December 2019, essentially no growth over seven years. December 2026 production was revised down by 165 kb/d from the last report to 41,177 kb/d.
Non-OPEC Oil Countries Ranked by Production
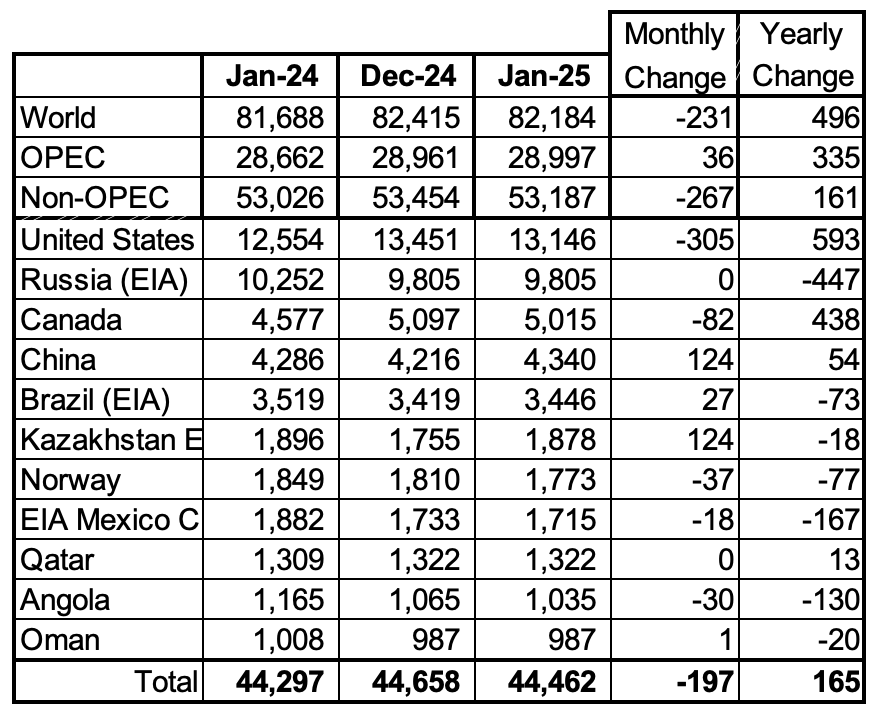
Listed above are the World’s 11 largest Non-OPEC producers. The original criteria for inclusion in the table was that all of the countries produced more than 1,000 kb/d. Oman has recently fallen below 1,000 kb/d.
January’s production decreased by 197 kb/d to 44,462kb/d for these eleven Non-OPEC countries while as a whole the Non-OPEC countries saw a yearly production increase of 161 kb/d to 53,187 kb/d.
In January 2024, these 11 countries produced 83.6% of all Non-OPEC oil.
Non-OPEC Country’s Oil Production Charts
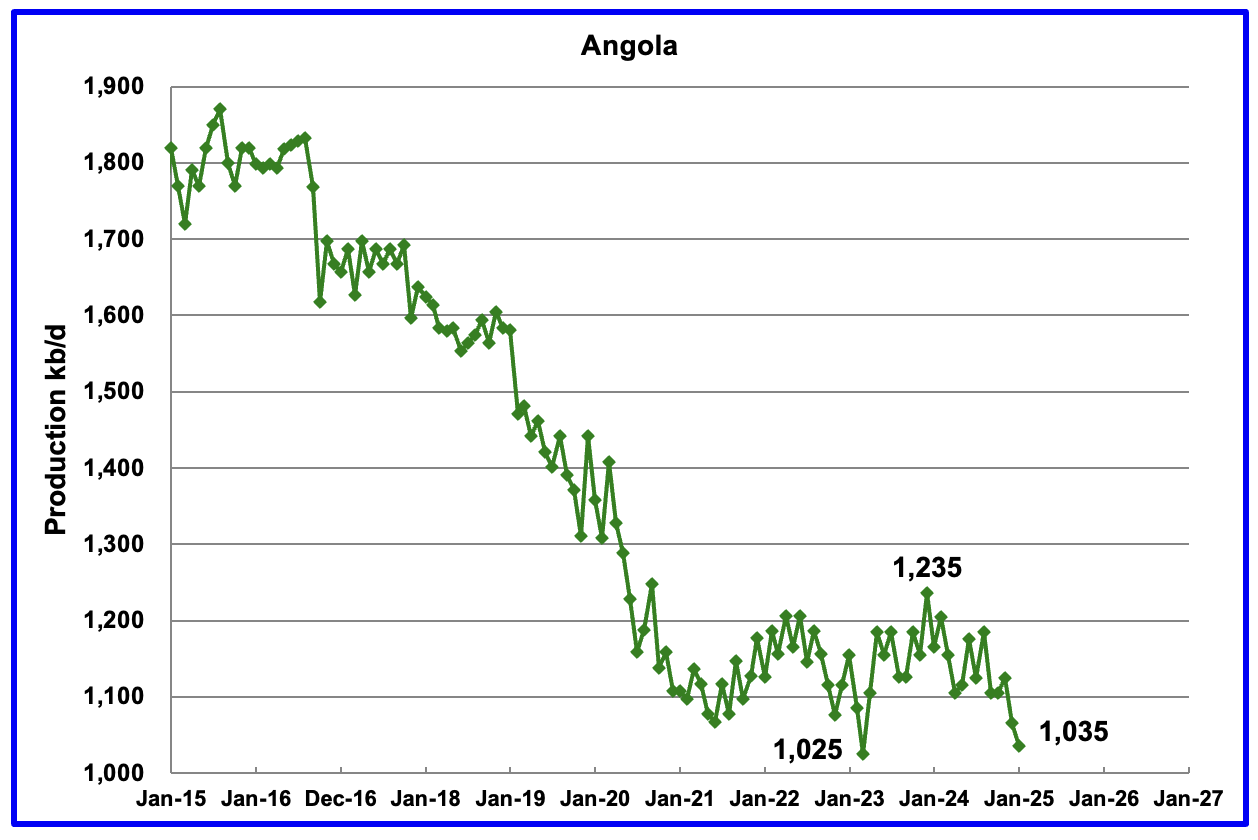
Angola’s January production dropped by 30 kb/d to 1,035 kb/d. Since early 2022 Angola’s production settled into a plateau phase between 1,100 kb/d and 1,200 kb/d. However December and January brought a drop below the lower plateau.
According to the March OPEC MOMR: “Growth is set to be driven by the US, Brazil, Canada and Norway, with the main decline anticipated in Angola. Angola output has now dropped for two months and is just 10 kb/d above its previous low.
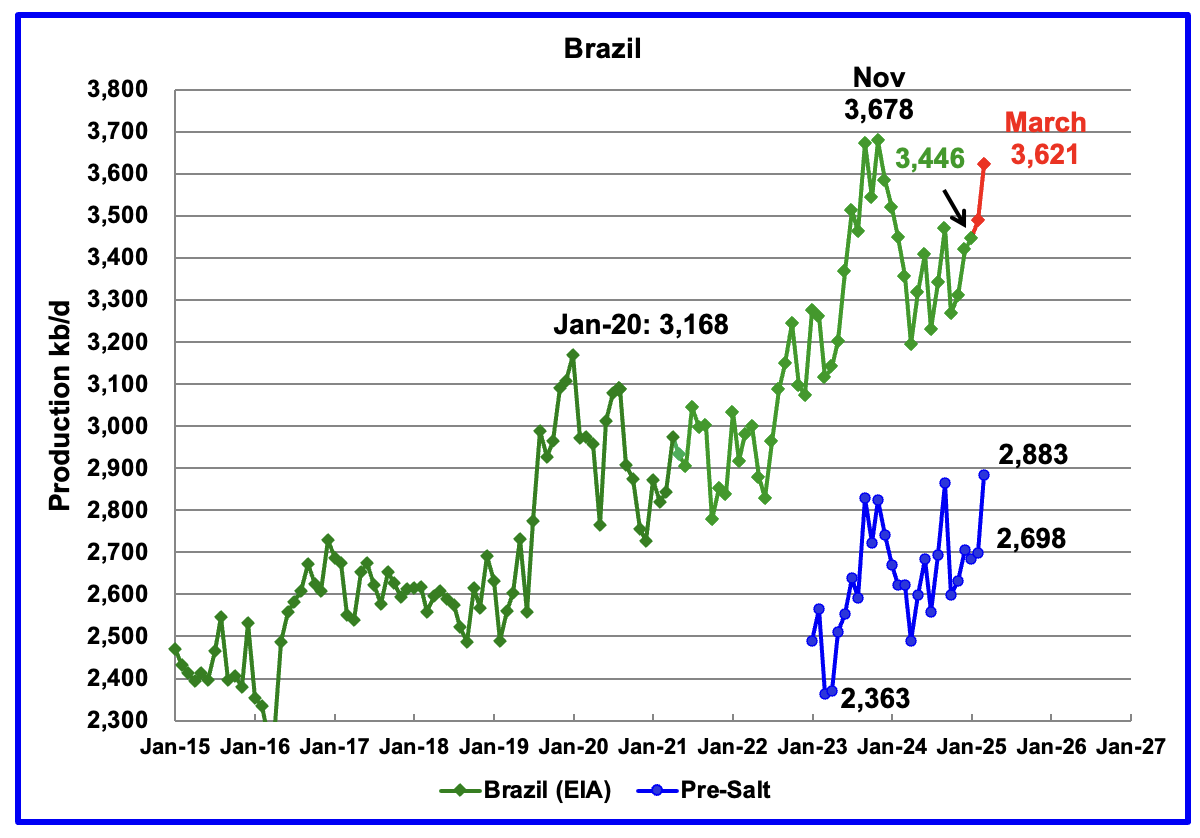
The EIA reported that Brazil’s January production increased by 27 kb/d to 3,446 kb/d.
Brazil’s National Petroleum Association (BNPA) reported that production increased in February and March to 3,621 kb/d. The pre-salt graph tracks Brazil’s trend in the oil graph. For March, pre-salt production increased by 185 kb/d to 2,883 kb/d, a new high.
The February to March increase could be related to the addition of the two new floating platforms. The December OPEC report states that two new floating production storage and offloading (FPSO) platforms came online in November. It also mentions operational issues and slow ramp-ups in several offshore platforms continue to be an issue. Perhaps this explains the delayed March production ramp up.
The March OPEC report states “Petrobras initiated production from the FPSO Almirante Tamandaré (Buzios 7) in mid-February at the Buzios field, located in the pre-salt layer of the Santos Basin, as the sixth production system in this field.” It also states that scheduled startup of planned new platforms could be delayed, “Nevertheless, operational issues and unplanned disruptions could potentially delay some scheduled start-ups from the platforms.”
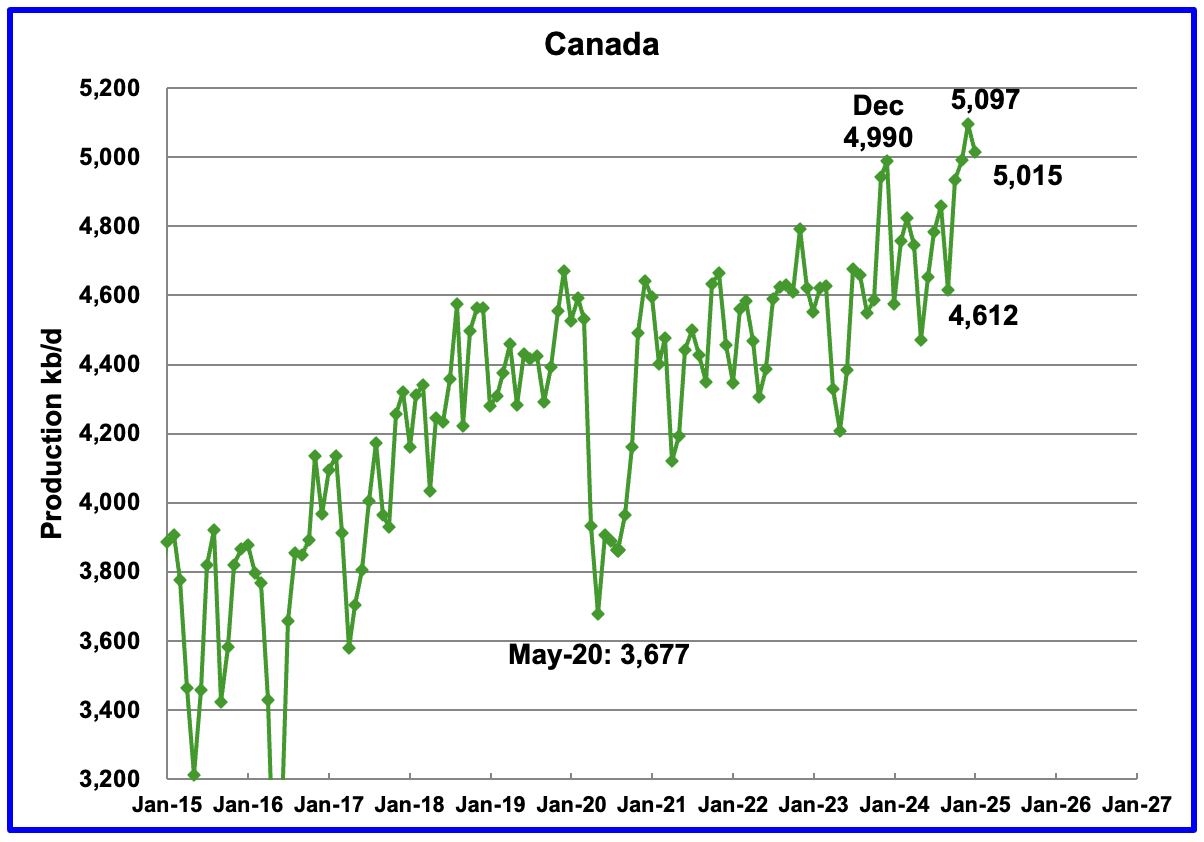
Canada’s production decreased by 82 kb/d in January to 5,015 kb/d after hitting a new high of 5,097 kb/d in January. Oil sands operations in February in the very cold Fort McMurray region are very difficult.
The Alberta premier is asking that the new Prime Minister Carney ease the anti oil sands policies of the previous government. If they don’t a referendum on separating from Canada could be held according to this Article.
Canada will be entering the LNG market in Mid 2025 according to this Article. The article also shows how the anti-FF policies of the previous government hampered the start of Canadian LNG projects.
“Canada and the United States both began proposing LNG export facilities at roughly the same time in the early 2010’s. In typical ‘let’s not wait around fashion’, the United States seized the moment and has become the world’s largest LNG exporter in the world since then. Canada has exported zero. Nothing.”
Travel time from Kitimat to Asia is close to 10 days vs 20 days from the US Gulf. This could result in more US LNG being shipped to Europe. Also it will reduce the amount of NG Canada sends to the US and could possibly support NG prices in the US as it may consume more internally, according to this Article.
“This milestone is pivotal for Canada’s energy sector, as LNG Canada represents the nation’s inaugural LNG export facility. Upon completion, the plant is projected to export 14 million metric tonnes per annum (MTPA) of supercooled natural gas, opening up new avenues for Canadian energy resources beyond the traditional reliance on the U.S. market.”
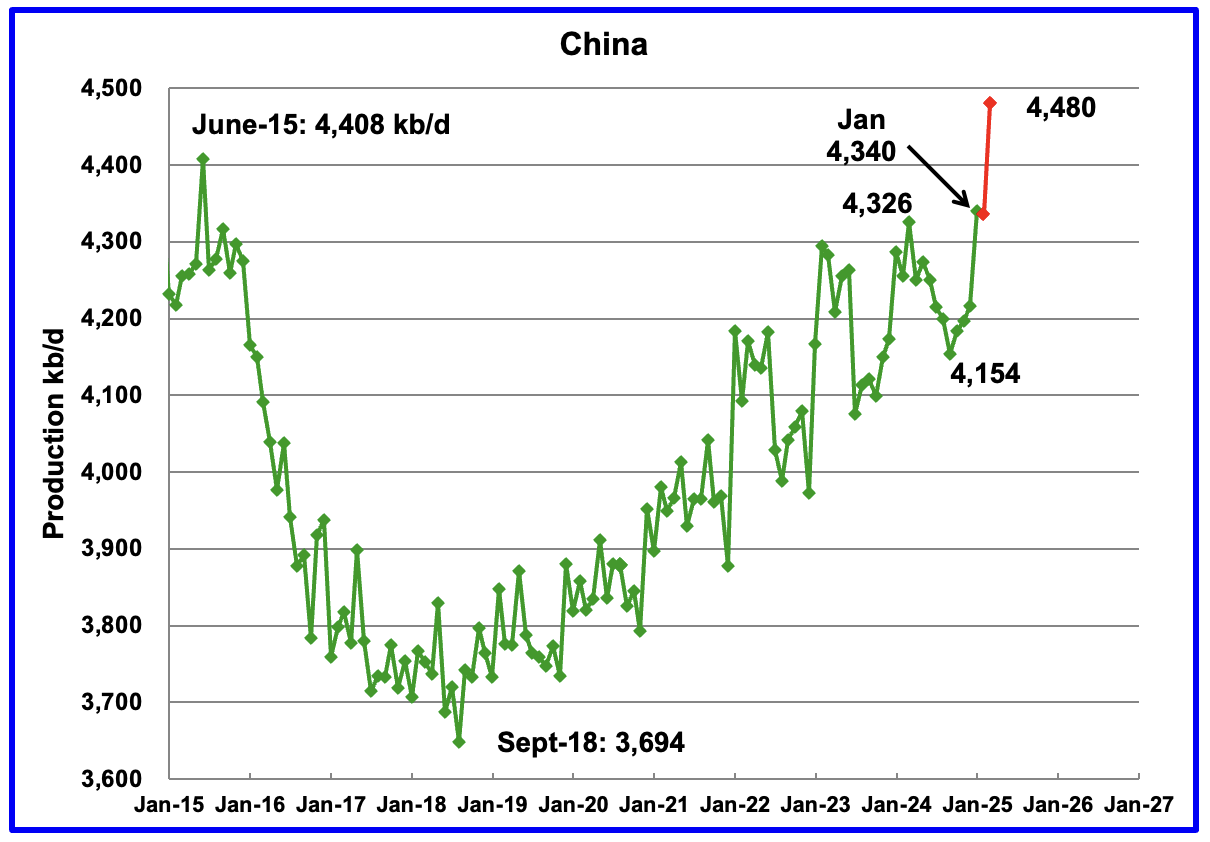
The EIA reported China’s January oil output increased by 124 kb/d to 4,340 kb/d.
The China National Bureau of Statistics reported average production for January and February of 4,335 kb/d, very close to the EIA’s January report. For March the Bureau reported that oil production surged to a new high of 4,480 kb/d. On a YoY basis, China’s production increased by 154 kb/d from the year ago high of 4,326 kb/d.
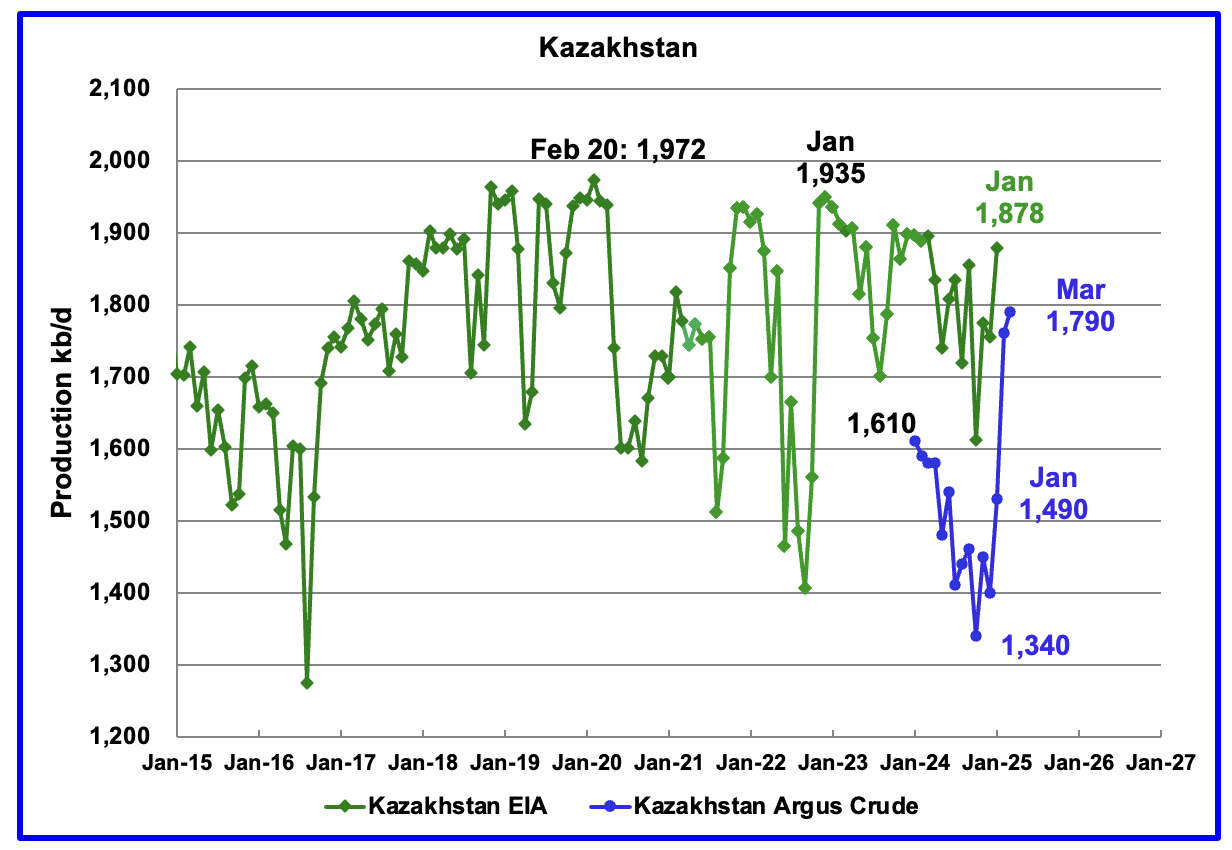
According to the EIA, Kazakhstan’s oil output increased by 124 kb/d in January to 1,878 kb/d.
Kazakhstan’s recent pre-salt crude oil production, as reported by Argus, has been added to the chart. In October pre-salt crude production dropped by 120 kb/d to a low 1,340 kb/d. Since then production has risen by 450 kb/d. March production came in at 1,790 kb/d due to a New Field coming online. Note this is crude whereas the EIA numbers are C + C.
Kazakhstan’s June OPEC crude production target is 1,500 kb/d. At 1,790 kb/d, Kazakhstan is 290 kb/d over their target. According to this Article, Kazakhstan says it has no plans to cut oil production this month (May) after massively exceeding its Opec+ target in March.
Since Kazakhstan’s reduction promises have not materialized, OPEC announced it would “accelerate plans to revive halted supplies in May and June, with an increase triple the size originally scheduled of 411 kb/d in each of May and June”.
Combined with the Trump tariffs the production increase announcement dropped the price of WTI/Brent by $10/b over two days. OPEC is trying to send a message to Kazakhstan to comply with its production target.
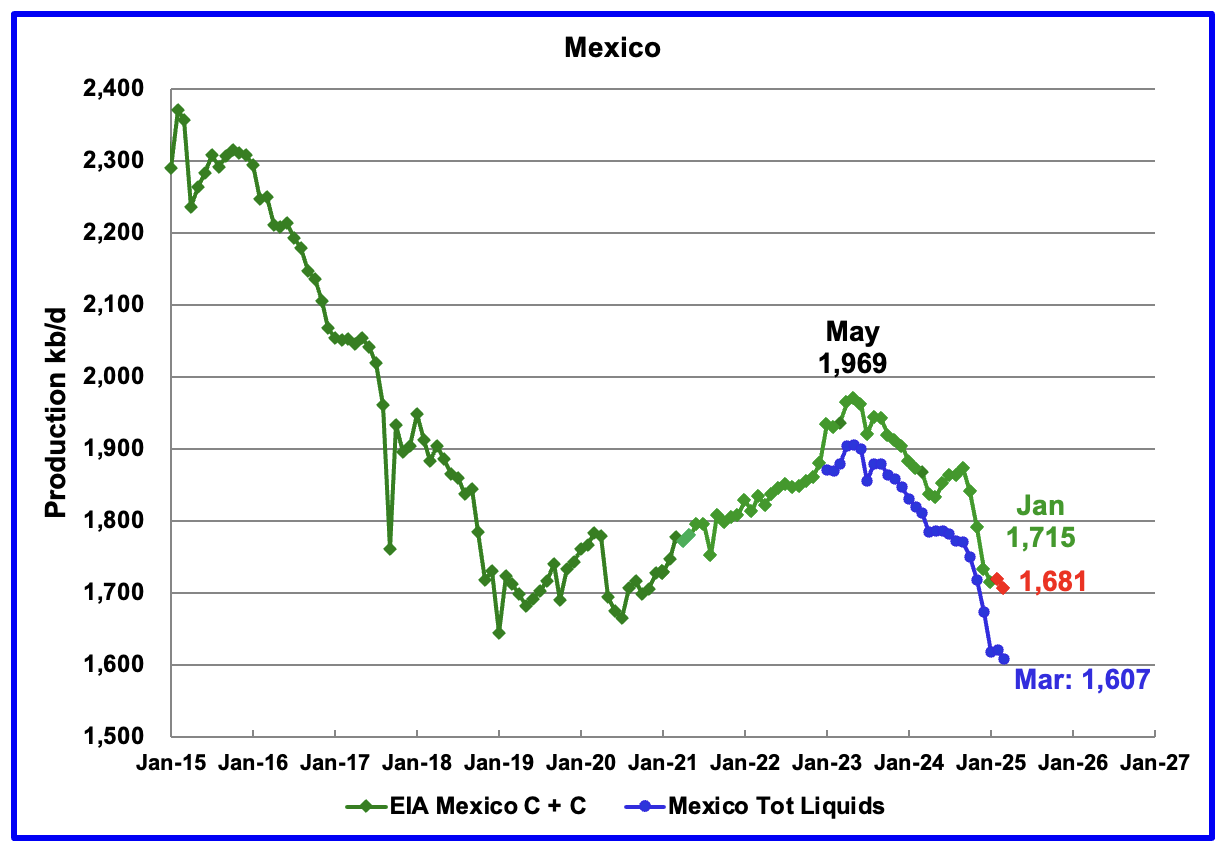
According to the EIA, Mexico’s January output dropped by 18 kb/d to 1,715 kb/d.
In June 2024, Pemex issued a new and modified oil production report for Heavy, Light and Extra Light oil. It is shown in blue in the chart and it appears that Mexico is not reporting condensate production when compared to the EIA report.
In earlier reports, the EIA would add close to 55 kb/d of condensate to the Pemex report. However for October and November it was increased to 122 kb/d and 117 kb/d respectively. For December, the condensate addition returned close to its original increase of 55 kb/d. The January addition was 98 kb/d.
For February and March production, 98 kb/d have been added to Pemex’s production to estimate Mexico’s February and March C + C production, red markers. Note that Mexico’s production, according to Pemex, has continued to fall every month since May 2023, except for one month.
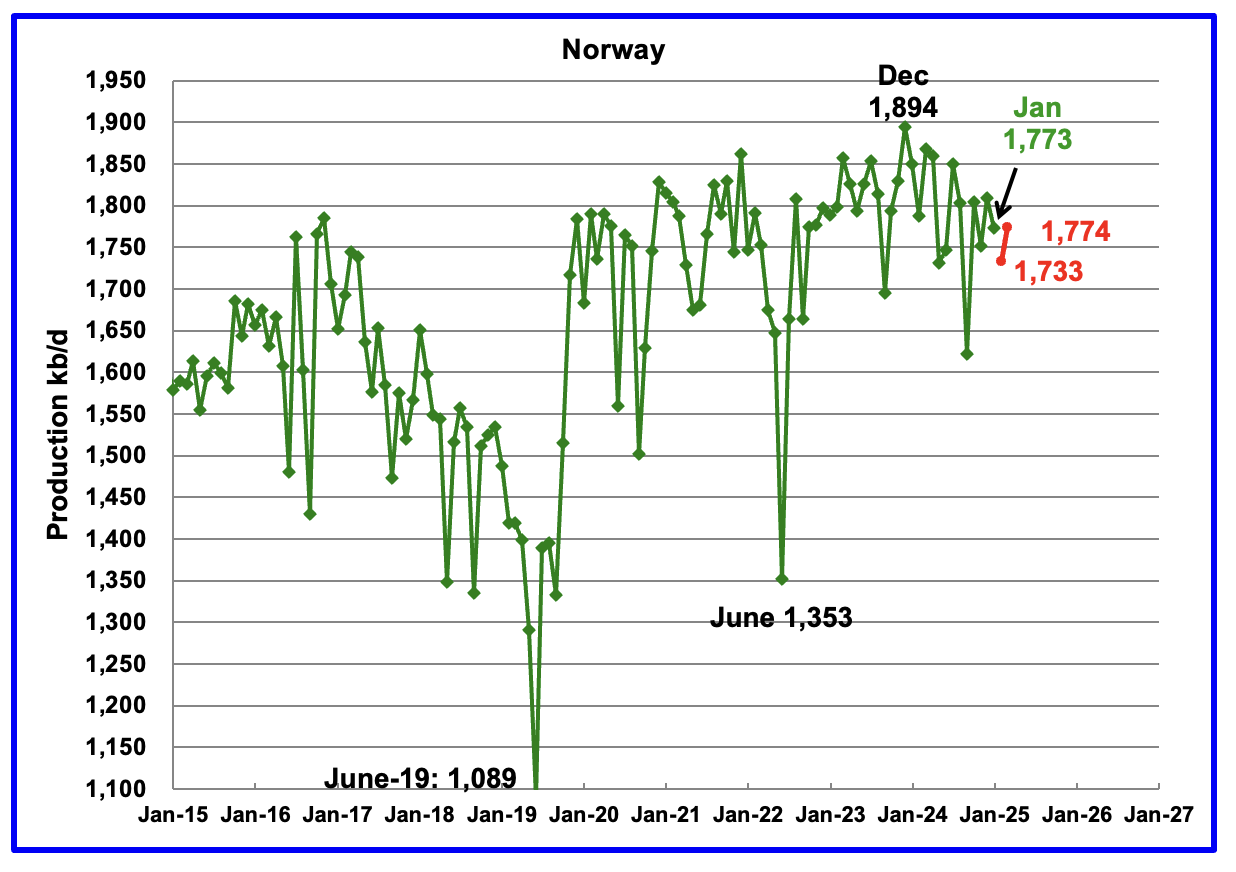
The EIA reported Norway’s January production declined by 37 kb/d to 1,773 kb/d.
Separately, the Norway Petroleum Directorate (NPD) reported that February production dropped by 40 kb/d to 1,733 kb/d and March rebounded to 1,774 kb/d, red markers.
The Norway Petroleum Directorship reported that March’s oil production was 4.2% above forecast.
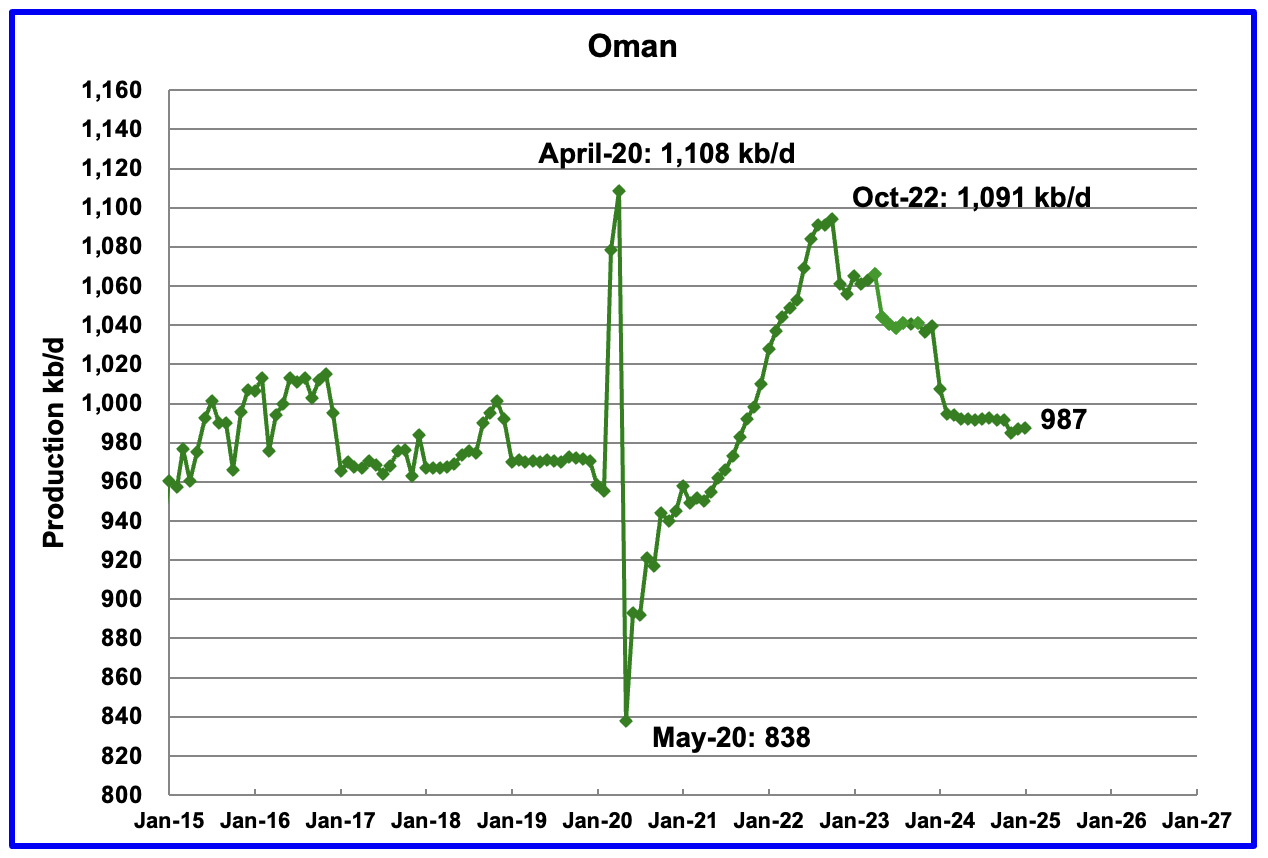
Oman’s production had risen very consistently since the low of May 2020. However production began to drop in November 2022. According to the EIA, January’s output rose by 1 kb/d to 987 kb/d.

The EIA had been reporting flat output of 1,322 kb/d for Qatar since early 2022. However the EIA revised down all of the previous production data up to April 2024. May 2024 production reverted to 1,322 kb/d. Qatar’s January output was reported again to be 1,322 kb/d.
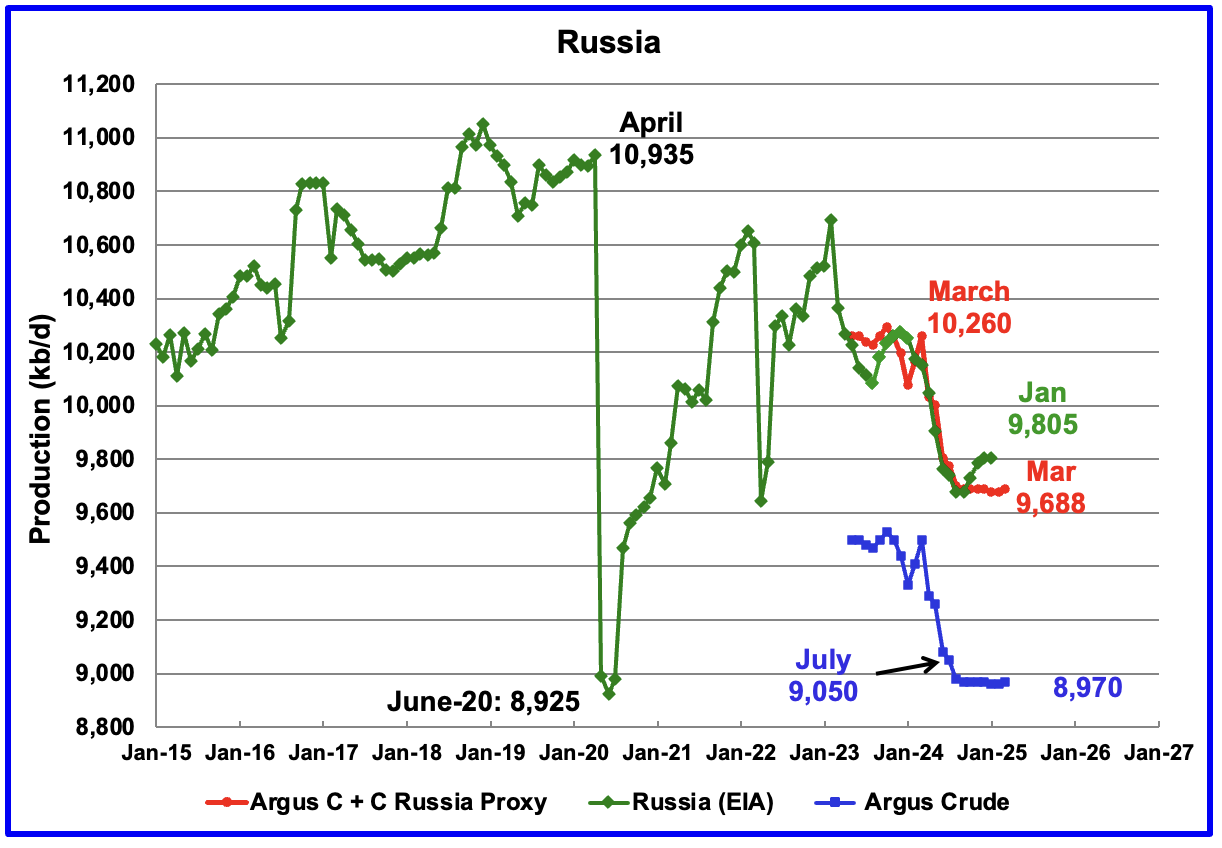
The EIA reported Russia’s January C + C production was flat at 9,805 kb/d and was down 455 kb/d from March 2024. It is also 128 kb/d higher than the Argus Russia proxy estimate of 9,677 kb/d for January.
Russia’s new required crude production for June is 9,161 kb/d. It will interesting to see if their production will rise starting in May 2025.
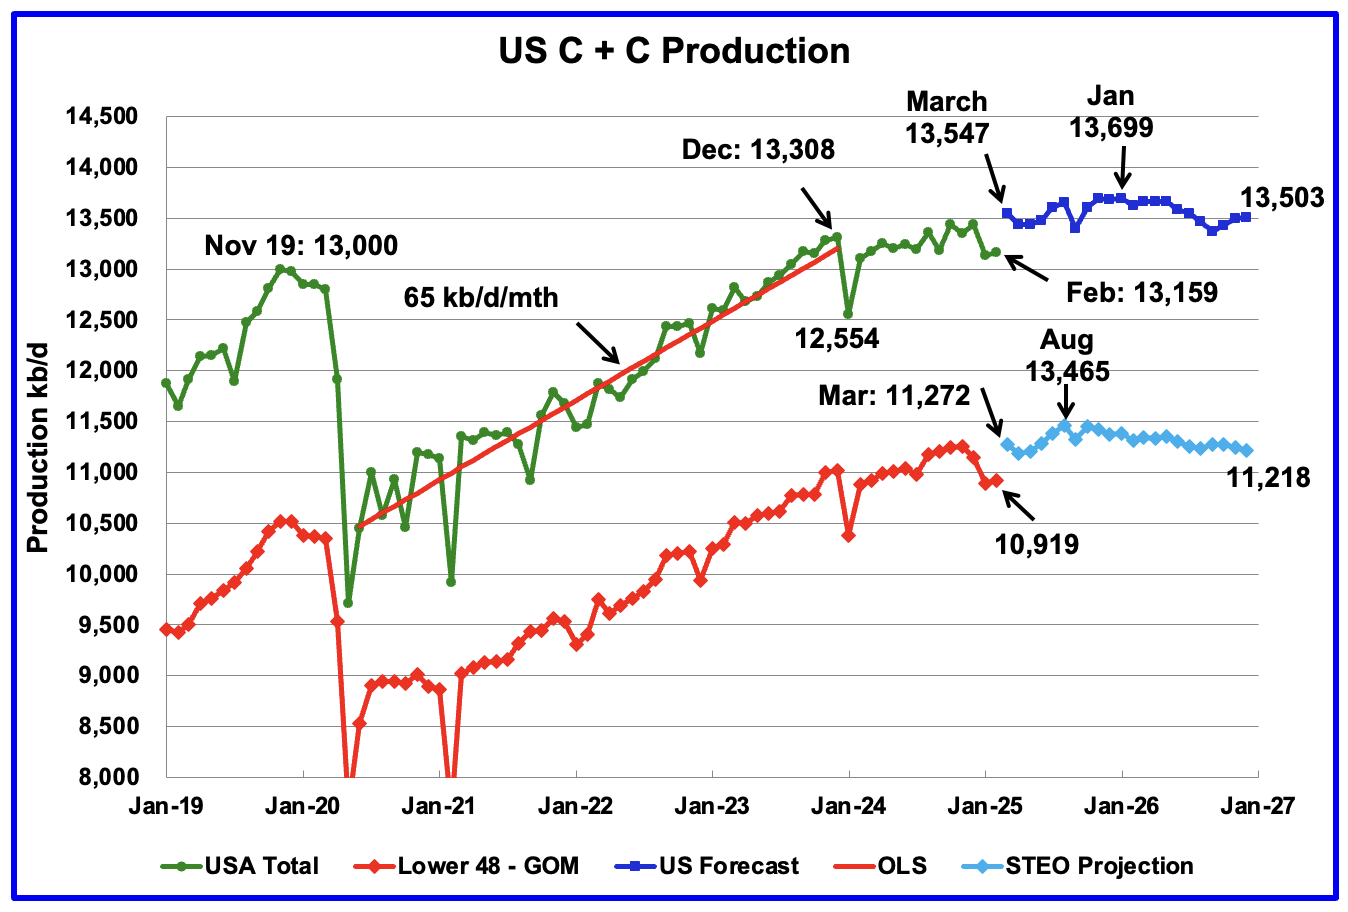
For comparison: This chart was posted May 3 and used the April STEO forecast.

The forecast portion of this production chart is very different to the one published last week in the US update post. For this chart the STEO forecast portions of the two graphs have been updated using the May 2025 report.
There has been a significant drop in expected production between March 2025 and December 2025. Regardless, I think there is more hopium than reality in the forecast up to December 2025.
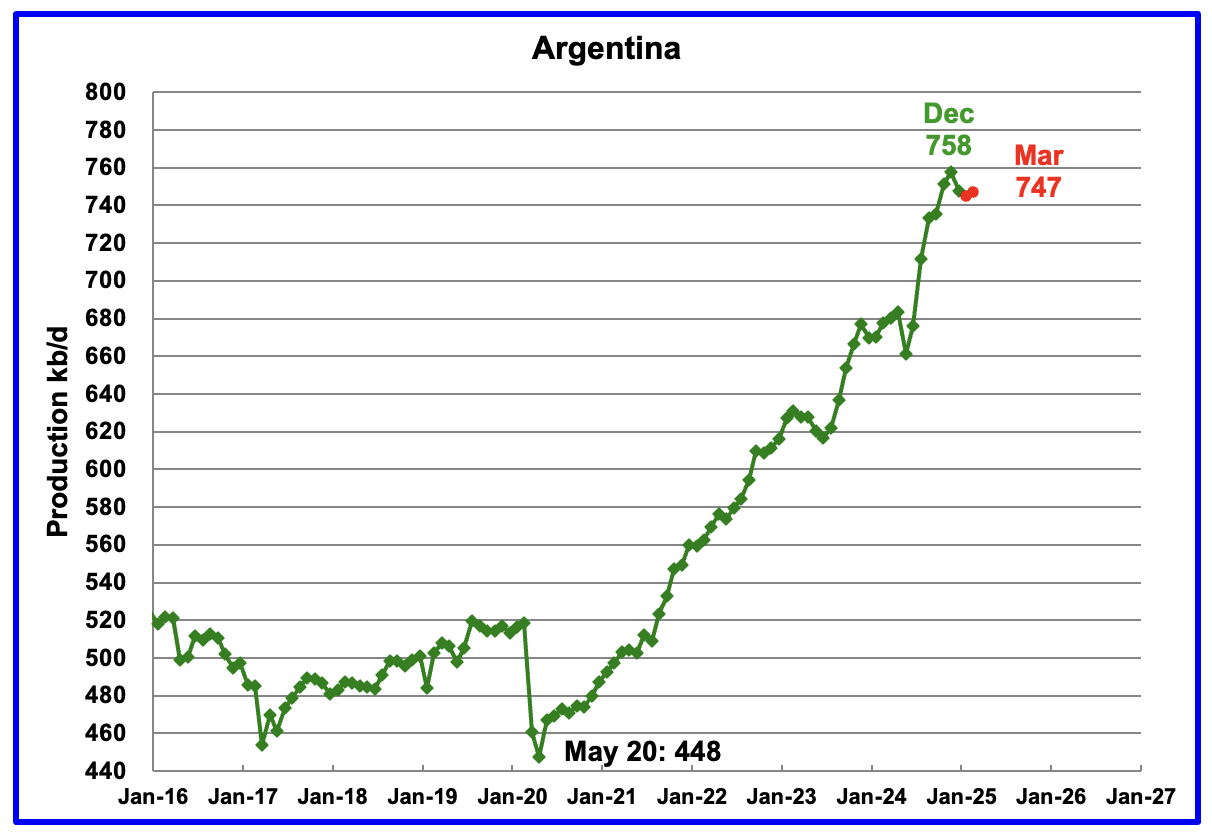
Normally, Argentina’s oil production is not reported because its production is lower than 1,000 kb/d. However production has been steadily rising over the last five years due to the startup of shale oil and gas production in the Vaca Muerta basin.
For January, the EIA reported Argentina’s production dropped 10 kb/d to 748 kb/d.
The Argentinian Energy Secretariat reported oil production in March rose by 2 kb/d to 747 kb/d.
The two previous production drops occurred in July 2023 and June 2024. Is Argentina’s production growth about to slow on its way to an expected 1,000 kb/d a few years down the road?
Great post and charts Ovy, thanks.
U.S. Oil Production Has Peaked! Or so says Diamondback.
This link was posted on the last thread but I will post it again just to make sure everyone sees it. Bold theirs.
“We Are At A Tipping Point”: Shale Giant Diamonback Says US Oil Output Has Peaked, Slashes CapEx Amid OPEC Price War
The OPEC price war has made landfall in the US.
Following our report earlier that Saudi Arabia has declared a new price war on OPEC+ quota-busters such as Kazakhstan, and non OPEC+ members such as US shale producers, today after the close Diamondback Energy, the largest independent oil producer in the Permian Basin, made a historic pronouncement today when it said that production has likely peaked in America’s prolific shale fields (something we also mentioned earlier in the day) and will decline in the months and years ahead after crude prices plummeted.
Separately, the Texas company trimmed its own full-year production forecast Monday, and said that itexpects onshore oil rigs across the entire US industry to drop by almost 10% by the end of the second quarter and fall further in the months after.
“This will have a meaningful impact on our industry and our country,” Diamondback Chief Executive Officer Travis Stice wrote. “We believe we are at a tipping point for U.S. oil production.”
Ron
Thanks
Attached is a similar article from the CEO of Oxy. They are also cutting capex.
“Occidental is reducing the midpoint of its annual capital spending guidance for 2025 by $200mn on the back of further efficiency gains. The US independent also plans to trim domestic operating costs by $150mn.”
What is surprising is that the CEO thought that Permian production would continue to grow through 2027.
https://www.argusmedia.com/pages/NewsBody.aspx?frame=yes&id=2686612&menu=yes
Ovi,
She said that previously she thought it would grow at the 2024 average completion rates, not surprising in my view and very much in line with my analysis.
With current prices and lower completion rates that will result she thinks output might grow slightly this year at best, also similar to my best guess. So her engineers may be seeing what I see.
Thanks for the nice post, OVI!
Argentina Vaca Muerta has seasonal winter plateau slow down in TIL, you could find more details here,
https://app.powerbi.com/view?r=eyJrIjoiNDQ1OGQ4MGMtYmQyYi00NzYxLWFlNTMtOGI0ZjRhZGE4NTBkIiwidCI6IjVmMThiN2ZhLTdmMmQtNDQ5ZC1hZjhkLTliZTNiM2ViZmFhYSJ9
here are some numbers:
1. total VM oil wells, 2890, total oil production 411KBOPD, GOR 0.983 MCF/bbl, compared to NOVI July 2023 Permian’s 45K wells producing 5.2Million BOPD, GOR @ ~4MCF/bbl
2. total VM gas wells, 769, total gas production 60Million m³ or 2.1BCFPD 35K BOPD; compared to NOVI 2023 PA’s 11K wells producing at 20BCFPD, and no oil; or NOVI 2023 Haynesville’s 7K wells at 15BCFPD.
Key takeaways: Gas production rise fast in condensate block of LaC, with GOR about 6~10MCF/bbl; and oil production in low GOR black shale oil also rising fast.
The champion lateral BPO 2801, less than 5K ft long, already produced over 1.2Million BO in less than 400 days, with GOR at less than 0.4 MCF/bbl,now the best IP 12mon well in Argentina history, conventional included.
Sheng Wu
Thanks for the info and the comparison with the Permian.
I use a different source for Argentina production. It is a spreadsheet which I download from the attached site and gives monthly production. I have compared their numbers with those from the EIA and they are the same.
At the top of the 2019 sheet one can select any year. Attached is a Table that shows results for the last three months of 2024 which are the same as the EIA’s.
http://datos.energia.gob.ar/en/dataset/produccion-de-petroleo-y-gas-tablas-dinamicas
Yes, OVI,
Argentina’s portion of shale oil and gas in the nation total oil and gas production will be heading to the same numbers as in US, with shale oil and gas currently at ~60% and ~50%, and will reach >80% and >70% in 2030 when VM production reaches 1Million BOPD, and gas over 100million Cubic meter PD. The higher oil numbers shows the nature of VM which features more oil than gas.
a mistake, Novi PA actually produce some oil from Marcellus and or Utica, about 10~18KBOPD
D C,
Here is the overlap of WV PA gas (including Marcellus and Utica, but Utica is minor at no more than 1.3BCFPD) withdraw plot till Feb 2025 and Saputra 2024 paper prediction (actual production ends at 2020).
The deviation obviously comes from lower estimate of the EUR and productivity improvements for 2020 wells.
here is overlap of NOVI Haynesville and Saputra prediction,
The deviation here for Haynesville is also huge for Saputra and actual production is mainly due to the sudden spike of realized well-head price in Haynesville, and almost double of rigs and wells drilled and completed since 2022. This increase of well-head price also prompt non-core wells to be drilled and TIL; while we should also note that the improved productivity per foot and EUR also helped the “non-core” laterals minimizing its difference to “core” laterals.
Besides the gap in post 2020 laterals’ productivity & EUR per foot between Saputra2021 prediction and actual production data, the deviation for Marcellus is huge also due to the improved economic in WV wet gas and condensate and the resulting more laterals TIL, and a less extent by the gas price hike due to war in Ukraine 2022 as in Haynesville.
This is evidenced by the number of wells TIL each year in PA after 2019 has been slightly decreasing, while production actually slightly increase or held constant. At the same time, the number of wells in WV should be increasing obviously, but not that significant and they are mainly due to increase in productivity & EUR per foot.
Here is an overlap of the Saputra forecast for Permian and actual production (Novi July 2023), and it also shows obvious gap although smaller than Marcellus and Haynesville.
It seems that the gap is mainly a result of sudden bounce back of rigs after 2021 and further sharp increase of rigs, and hence sharp number of wells completed each year in Permian from 2022, compared to Haynesville and Marcellus. This will foreward loading the production, or squeeze Saputra forecast of “core” laterals, resulting earlier peaking and faster fall-off.
One obvious flaw I just found from Saputra forecast for Permian is that they put a GOR number too low and almost no change from actual.
Saputra estimate/forecast of GOR for “base Core” laterals almost fixed at 4MCF/bbl from 2020 to 2030, and this caused their “base Core” oil and gas URR at ~32.2GBO and only 120TCF and GOR ~3.7MCF/bbl, by adding “non-core”, the oil and gas URR will be 54.4GBO and 246TCF and GOR ~4.6MCF/bbl).
Sheng Wu,
The differences are primarily due to different levels of wells completed per month vs the a
levels assumed by Saputra. For Permian they assumed 400 wells per month for core areas, actual levels have been close to 480 wells per month, in addition there were increasing lateral lengths which caused some increase in average well productivity. No doubt there were also changes in lateral length and productivity in Marcellus and Haynesville along with different levels of completion in reality compared to what was assumed when the papers were initially written in 2018. For Haynesville they assumed a 20 well per month completion rate, but the actual completion rate was about 42 wells per month from July 2022 to July 2024.
For Haynesville Saputra et al assumed a completion rate of 20 wells per month from 2020 to 2025, actual rate from 2020 to 2023 was about 40 wells per month, also productivity increased after 2019, probably due to longer lateral length.
Sheng Wu,
The Gas estimate may be low, for a scenario with similar total completions as their base plus core, I get about 37 Gb C plus C and 180 TCF of natural gas.
Gas estimate for Permian by Saputra may be too low.
For Marcellus from 2020 to 2022 Novi has completion rate of 50 wells per month in PA only, when WV wells are added the number would be higher, perhaps 70 per month total. This is the main difference.
Also The WV Marcellus had about 20 completions per month in 2020, so the guess of 70 wells per month for PA and WV may be low, perhaps 80 would be a better guess.
here are the 2023, 2022 WV report,
http://www.wvgs.wvnet.edu/www/datastat/Marcellus/reports/WVGES2023MarcellusandUticaPtPleasantProductionSummary.pdf
http://www.wvgs.wvnet.edu/www/datastat/Marcellus/reports/WVGES2022MarcellusandUticaPtPleasantProductionSummary.pdf
so, 2023, 2022 HA6 laterals are at 2944, 2712, so 232 laterals added in 1 year from 2022 to 2023, average lateral length only increased ~145′ from 12,741′ to 12886′, and gas production increased ~0.8BCFPD. The 2023 report page 4 gave the number of HA6 completed as less than 190, 170, 150, and 100 in 2022 and 2023 respectively, and average lateral lengths increase has been much slower too, only from 11,800 to 12,886′.
Obviously, the produtivty & EUR per foot increased significantly for WV Marcellus since 2020 when 2024 Saputra paper used the data up to 2020 (submitted May 2021 using data up to end of 2020). No wonder WV USGS Boswell gave the URR so high, especially in WV, where recovery over 100% OGIP (Original Gas in Place) is common.
Other years from 2020 to 2021 have different method of counting total laterals than 2022, and 2023.
So 232 wells completed in 2023 in WV Marcellus or about 20 per month, so perhaps 70 per month for PA and WV, that is 40% more than Saputra model and accounts for higher actual output than their scenario.
Sheng Wu,
I think it is far from clear that Marcellus productivity increased after 2020, I think the main reason that actual output is higher than the Saputra et al scenario is that they underestimated the completion rate at 50 per month when the actual rate was around 70 per month. Higher output is due to more wells being completed rather than higher productivity per well.
here is an overlap of all wells till 2019 in Bakken predicted by Saputra (https://www.mdpi.com/1996-1073/13/8/2052) and actual from NOVI (2018 is red color), and Saputra predicted 4.5GBO for all wells till 2019, and actual probably delivering EUR at 5.1~5.3GBO? or averaged EUR for each lateral at 335~360K BO?
Sheng Wu,
The Saputra et al model may be a bit pessimistic, my model has URR of about 4.9 Gb for same number of wells through November 2019. An average of 329 kb per well. The average 2019 well for my model has EUR of 365 kbo.
Sheng Wu,
Note that the Saputra chart is Marcellus Only. Here is Marcellus Dry Gas output.
Marcellus Model that assume 50 wells per month completion rate after Aug 2020 (similar to Saputra scenario for Marcellus.
Modified Marcellus scenario with 60 well per month completion rate from Sept 2020 to Dec 2024 and 55 wells per month completed from Jan 2025 to Dec 2027.
What matters is diesel
22 Apr 2025
Australian Diesel imports update January 2025 data. Preparing for surprises in the Strait of Taiwan
https://crudeoilpeak.info/australian-diesel-imports-update-january-2025-data-preparing-for-surprises-in-the-strait-of-taiwan
This post contains Taiwan scenarios of several US think tanks
lots of the bunker fuel and marine diesel along with trucks on the road will be replaced by LNG, gas rich Australia might work with Singapore and S. Korea to build more LNG trucks and ships.
Sheng Wu,
The U.S. tried that LNG Trucking Route and gave it up years ago. Two LNG facilities were at opposite exits in the town I used to live in, and both were taken down. The BLU facility was dismantled and a Car Wash and Tesla Charging stations were put up in its place. And the other LNG Facility located at the Flying J Truck stop, never used, was also dismantled.
UPS used the BLU LNG Facility at the first exit for years until the company decided to return to diesel, since you need 40% more LNG in volume to provide the same energy as a gallon of diesel. I spoke to some of the UPS drivers, and most of them couldn’t stand using LNG because they were constantly worried that there wouldn’t be enough fuel to get them back due to the lack of LNG facilities.
While China has transitioned more of its Trucking Fleet to LNG, I don’t see this as a big game changer for the world.
I find it interesting that individuals think we can just PLUG & PLAY some other energy source to fill a peak elsewhere.
At some point in time, HUMANS will have to wake up to the fact… that we will join many of past civilizations that PEAKED and COLLAPSED due to Resource constraints.
But… until then… many will continue to believe in PLAN B.
steve
I seriously believe LNG and CNG in US truck and cars are rigged by oil refineries and big oil companies.
The kit to convert cars from gasoline to CNG is only $200 in China and Iran, and cylinder cost another $200. Yet, majority US states prohibit modification. CNG only survive in green extreme states like California, used in buses and waste disposal trucks.
Sheng Wu,
You believe in an Oil & Refining Industry Great Conspiracy against LNG & CNG? I see…
Regardless… when talking to Truck Drivers who use LNG, you get a different story. Diesel is safe and doesn’t ignite easily…. It’s oily. When filling LNG in a truck, you need a special Plastic Mask to keep the supercold fuel splashing in your eyes.
LNG Tanks have to be 40% larger to have the same capacity as diesel tanks. Moreover, LNG Semitrucks cost 20-30% more than typical diesel trucks.
I doubt the Oil & Refining Industry needs to waste time in a Grand Conspiracy against LNG when the Logistics and Economics were the DEATHKNELL..
steve
there is another big thing that big oil and refineries did to kill LNG or CNG, the price!
The price for CNG is not much less than gasoline when comparing the same 100 miles consumption. The CNG price at the city pump is about 2.5~5X at HH.
Sheng Wu,
You do realize the U.S. consumes roughly 8.5 Mb/d of gasoline. If we decided to transition that to CNG, that same 8.5 Mb/d of gasoline would take about 50 Bcf/d of Natgas to make CNG.
Even if it CNG was more efficient, we don’t have another 30-40 Bcf/d of natgas lying around to make CNG.
steve
The biggest drawback to LNG usage in long-haul transport–other than the important one Steve mentioned–is the fact that unless the vehicle is moving all the time, drawing down the LNG tank and necessitating frequent refills, you have to vent the tank to get rid of boil-off gas. That’s basically like venting a shale oil well: you’re sending a stream of pure methane into the atmosphere, a concept that would last about as long as a fart in a whirlwind with the clean energy group (for good reason). The LNG tankers use that boil-off gas for their own propulsion upon the water, so the trip is free from the standpoint of fuel. Diesel is a great fuel and we can refine it from the middle distillates of good LTO. At some point, when we’ve run through most of the LTO and still have NG in abundance, then CNG will be a sensible choice, but as long as there’s diesel, well, I wouldn’t hold my breath. And CNG is used in LA buses mainly in highly congested areas (airport shuttles) with nearby facilities for refueling. The late T. Boone Pickens devoted the last decade of his life advocating for CNG. He was well connected to Big Oil and refineries. The cost of carriage of CNG and for new infrastructure just isn’t there; Cummins has tried for well over a decade. As to why China would use CNG or LNG when they have two-billion barrels of crude oil in storage, well, I imagine they are storing up crude for a specific purpose.
Gerry,
Does anybody do refrigerated LNG trucks?
Sheng Wu/Gerry
There is a major difference between converting a car engine to NG vs converting a heavy duty diesel engine to NG.
I was the coordinator of a consortium that developed the first North American NG gas transit bus that ran on compressed NG in the late 80s and early 90s. The consortium consisted of Cummins Engine, Ontario Bus Industries, Alusuisse (20 ft long 3000 psi aluminum cylinders), a compressor company and a NG supplier. A transit bus was chosen because it returned to base every night to be refuelled and used a lot of NG.
The motivation at the time was alternative fuels, environment (no particulates) and cost savings ~$Cdn10,000/yr.
The major issue was how to convert the Cummins heavy duty (HD) diesel into a spark ignited NG engine, very costly and complicated because of the requirement to meet strict US emission standards. There was a major efficiency loss in going from the diesel cycle to a spark ignited (SI) cycle but with NG so cheap, the economics ruled. After a couple of years in the research phase, Cummins took the project in house to convert the NG HD SI diesel engine into more durable every day working engine. One hundred buses were produced and operational problems developed but in the end it was a success and Cummins is now a major supplier of NG HD diesel engines.
Having done that and having an SI HD diesel engine, one bus was converted to LNG and a few trucks were converted to propane. As I recall on a technical level they both worked but there were operational problems in terms of LNG and propane supply and availability.
The LNG tank on a truck/bus is not vented. It is a pressurized (max ~ 200 psi) dual walled cylinder capable of standing for a minimum of seven days before venting. Unfortunately if it does vent, it is massive vent because the LNG is above -160 C. The liquid phase boils until it releases all of its heat and gets back down to close to -160 C, depending on the pressure relief valve setting .
On a LNG carrier ship, the vented NG is fed into a pilot injected diesel engine as part of the air stream. A small amount of diesel fuel is injected into the cylinder to ignite the NG, hence the name pilot injection.
So yes the technology is there to run diesel engines on LNG, CNG and propane but in general it is not simple, not convenient and costly. There is no conspiracy to keep the technology out of the market. The technology is readily available to use NG in vehicles and as far as I can see the most useful way is to use CNG in transit buses. However now the new push appears to be to move to battery powered transit buses.
https://aashtojournal.transportation.org/massdot-helps-transit-fleet-buy-cng-powered-buses/
https://ir.allisontransmission.com/news-releases/news-release-details/king-long-china-delivers-cng-buses-equipped-allison-automatics#:~:text=Natural gas-powered vehicles emit,operate than diesel powered vehicles.
https://www1.eere.energy.gov/vehiclesandfuels/pdfs/success/natural_gas_buses.pdf
The thinking that we can just switch to natural gas for transport is in correct, just like oil the natural gas resource is limited. World Natural Gas will peak by 2030 to 2035, creating infrastructure to switch from oil to natural gas will be a waste, the investment will be stranded.
we will join many of past civilizations that PEAKED and COLLAPSED due to Resource constraints.
Not really. The civilizations that you’re thinking of were agricultural. Empires then were mostly exercises in exploitation and looting. They were Ponzi schemes, that were bound to collapse. Modern empires, like British and Japanese, ended and left the citizens better off.
Solar energy drops 130,000 terawatts 24×7 on the earth. The earth gets more solar energy in a month than all of the FF ever burned by humanity.
Humanity is still in a juvenile state of psychological and political development, and vested interests are fighting the transition away from FF tooth and nail (exhibit A: Trump), but there’s no geological or technological reason we can’t get there.
A bit more:
Pre-modern civilizations were primarily agricultural, and had very, very low growth rates. So, agricultural productivity was key, and empires with high growth rates were essentially Ponzi schemes: when the underlying economic growth rate is .01% per year, an empire can only grow temporarily by stealing. The core of the empire exploits (loots) the periphery. The periphery expands until the empire becomes too large, and then it collapses due to the lack of new victims. Agricultural products include food and wood, and a common symptom of collapse is Peak Wood, as observed for both Athens and Rome.
Any analysis of the growth and decline of pre-modern civilizations has very, very limited application to modern times.
Modern empires are different. Japan, the UK, even Russia are all far more affluent now than they ever were during the heyday of their empires.
On resistance to change:
As we’re seeing right now in the US, billionaires want to cripple government and the class of knowledge professionals, because those two threaten their power. Government is the tool used by the middle and working classes to maintain some share of power vs the “owning” class, so it must be crippled. Science tends to give power to knowledge professionals. Billionaires can’t tolerate this competition, so science must be crippled.
Just one example: there are many trillions of dollars of potential stranded assets if fossil fuels were to be replaced because of climate change science. Preventing that loss is a key element of Republican policy.
Good grief Nick, don’t you think that civilizations based on renewable resources like grass, grains and wood are far more likely to survive longer term than one based upon non renewable mined resources of fossil fuels, metals and minerals??
The 130,000TW of sunshine is irrelevant to your argument as it’s the lower and lower grades of ores that must be mined to access any of it, if we are to ditch grains, grass and wood, as the basis of civilization.
If you could show just one example of where we, as in humanity, use solar, wind and batteries exclusively to build any of modernity, via industrial processes, that is commercially viable without any subsidies, you might have a case, but as of present there are zero. This despite the constant incorrect rhetoric of ‘renewables’ being cheaper forms of electricity.
Reality is a bitch, they are not cheaper, hence why no company has bothered to take there high energy uses to exclusive renewables, let alone all the processes/uses that require the heat and products from fossil fuels.
Good grief Nick, don’t you think that civilizations based on renewable resources like grass, grains and wood are far more likely to survive longer term than one based upon non renewable mined resources of fossil fuels, metals and minerals??
Good god, no.
Civilizations based on agriculture are extremely vulnerable to droughts, flood, pests, etc. They’re extremely poor. Life is hard and precarious.
Fossil fuels are obviously not reliable, but solar, wind, etc are. Metals like iron, aluminum, magnesium have enormous resource bases (iron is 5% of the earth’s crust, aluminum is 8%, magnesium is 2% and is abundant in seawater) and are recyclable.
Exxon and Germany: they have concluded that a transition away from FF is entirely feasible. Saudia Arabia clearly believes that it’s inevitable. You don’t need an argument from authority to know this – it’s clear from technical sources – but these are pretty good authorities on this subject.
Nick G wrote<=: Civilizations based on agriculture are extremely vulnerable to droughts, flood, pests, etc. They’re extremely poor. Life is hard and precarious.
Now that ocean fisheries are almost depleted and there are no wild animals are left to hunt, ALL cavillations are based on agriculture.
Well, some Africans survive on bush meat, but that will all be gone soon.
ocean fisheries are almost depleted.
“almost four-fifths (79%) of fish catch is sourced sustainably. 21% of the catch comes from overfished populations.
Overall, two-thirds of assessed fisheries are sustainable, providing four-fifths of our seafood.”
” although around two-thirds of assessed fisheries are below the biomass that would give us the maximum sustainable yield, catch is now within or even below sustainable levels in 7 of the 10 studied ecosystems. In other words, while many stocks are still in a poor state, things are improving across many ecosystems.”
“…Mirrors the UN FAO’s assessment of fisheries. It estimates that around one-third of the world’s fish stocks are overexploited: these populations are declining because we’re catching more fish than can reproduce. The other two-thirds, though, are sustainable and not in decline. The share that is overexploited has been relatively stable in recent decades. It has not continued at the rates predicted.
The most recent analysis of global fish stocks – published by the same group in 2020 – reaffirms this result.11 There are certainly fish stocks that are of major concern. But overall, the majority of regions where we have high-quality data are at least stable.12
To be clear, this does not undermine the fact that some of the world’s fish populations are struggling. Many are in trouble and are at risk of collapse if we do not take action.
But the notion that the world’s fisheries will collapse within decades is wrong. Even the original authors do not stand by this statement.13 The extrapolation of this original claim to the “oceans will be empty by 2048” is nonsense that does not reflect the science that underpins it.”
https://ourworldindata.org/fish-and-overfishing
World fish and seafood production is at an all time high:
1961 (tons) 38,803,070
2022 179,369,000
absolute change 140,565,930
% growth 362%
https://ourworldindata.org/fish-and-overfishing
first table, set to world
Nick,
I’m going to kick this over to the non-petroleum thread, as this seems to be a continuation of a prior discussion there.
Nick G
“Fossil fuels are obviously not reliable, but solar, wind, etc are.”
Unbelievably naive or simply comedic relief??
How is a coal fired power station, sitting next to a large reserve of coal, which is fed via conveyor belt to the power plant, supplying 24/7 power all year long not reliable?
Nick G …. “Metals like iron, aluminum, magnesium have enormous resource bases (iron is 5% of the earth’s crust, aluminum is 8%, magnesium is 2% and is abundant in seawater) and are recyclable.”
You just don’t get it at all!! It’s not about the metals, nor the solar and wind…
It’s all about the energy and machines required to turn all the low grade resources into products that are useful.
None of the renewables have provided a shred of evidence they provide enough energy to reproduce themselves, which is what I’ve been arguing for years. It’s why I keep asking you for evidence of any of it happening.
None of the EROEI studies are close to accurate as they all have boundaries that exclude the largest energy content of their mining, processing, transport, manufacture and deployment…
Including only the energy throughput of an Aluminium smelter and the diesel used at the bauxite mine and in the trucks transporting the bauxite as an example, while excluding all the people involved that all use energy in their everyday lives, plus the roads, ports, processing plants and smelter itself, is just junk research, yet it’s what we use to tell ourselves nice fairy tales, and you have fallen for it hook, line and sinker.
Every aspect of modernity suffers from entropy and dissipation, so none of it is ever 100% recyclable, another simple fact from physics you simply ignore.
Perhaps one day you will do some real research to answer the question of why no aluminium smelter has never chosen to go with a captive solar, wind and battery operated plant, if these renewables were actually cheaper than coal, whereas they are doing so with coal power right now…
How is a coal fired power station, sitting next to a large reserve of coal, which is fed via conveyor belt to the power plant, supplying 24/7 power all year long not reliable?
There are two problems with coal plants. First, they’re complex, persnickety creatures (coal has a lot of contaminants, and a lot of these plants are very old), and they’re down a lot, often unexpectedly. Also, they’re fairly big plants, so the loss of one is a significant problem for the grid. 2nd and more importantly, coal is depleting and can’t be relied upon in the longterm.
Oil is worse: the models that DC and others use for oil supply isn’t called Oil Shock model for nothing: oil supply problems have cause enormous economic shocks in the past.
It’s not about the metals…it’s all about the energy
Ah. Nice to clarify that you’re not really arguing that metal scarcity is relevant here.
So. The world’s utilities, the mainstream scientific and engineering communities, they’re all wrong about solar and wind being cheaper and cleaner? All those Systems Operators, all those grid analysts, they’ve all been snookered by those con men selling photovoltaic snake oil? The fact that the world’s utilities are investing primarily in renewables…they’ve just all gone crazy?
Nick G, once again you deliberately miss the whole point…
If solar wind and batteries were really cheaper and better than fossil fuels, then the world would turn to them without any subsidies, tax credits, grants or mandates. None of it would be necessary as they would quickly become the mainstream due to economic pressures.
If an off grid stand alone Aluminium smelter running on solar, wind and batteries could produce the cheapest Aluminium, it would quickly put out of business every coal fired plant run aluminium smelter…
But it’s just not happening, anywhere…
How are you so blind to not see this simple reality??
Meanwhile they are building new captive coal plants to just run aluminium smelters in Indonesia. Why would this be happening if solar, wind and batteries were cheaper?? It would be an absolutely stupid economic decision, yet they are doing it….
Nick G ….. “So. The world’s utilities, the mainstream scientific and engineering communities, they’re all wrong about solar and wind being cheaper and cleaner? All those Systems Operators, all those grid analysts, they’ve all been snookered by those con men selling photovoltaic snake oil? The fact that the world’s utilities are investing primarily in renewables…they’ve just all gone crazy?”
How many people in this world believe in a deity that will give them a better life after they die, which rationally makes no sense at all, yet believed by billions. Humans are irrational creatures, so yes there can be mass delusion on anything.. In the 17th century just about every doctor believed blood letting was the answer for most ailments, again a mass delusion.
Do the math on it all for yourself instead of believing papers and research for a change, work out the capital and operating cost to keep a 1GW Aluminium smelter operating for 25 years on solar and batteries, for such industrial applications require continuous power, including enough back-up batteries to last a couple of days without sunshine, which often happens everywhere.
Do it for the equator like where Adaro are building a coal power station, that has a consistent 5.5 hours/d of sunshine without the variation of a sun shortened winter, using today’s costs, to see how expensive solar/batteries really are (It’s a low wind area)
This is for your benefit, not mine, I’ve done the figures over and over, it’s NOT cheaper than a new coal fired power station!!
Until you actually do the research for yourself, you will not believe it, but head in the sand is one approach….
Hideaway —
If you could show just one example of where we, as in humanity, use solar, wind and batteries exclusively to build any of modernity, via industrial processes, that is commercially viable without any subsidies, you might have a case, but as of present there are zero.
The IMF reckons fossil fuel subsidies hit $7 trillion worldwide in 2022. These subsidies are distributed across all countries and territories surveyed by the fund.
This proves by your logic that fossil fuels are not a viable source of energy. If they are, why do they need subsidies?
Alimbiquated ….
“The IMF reckons fossil fuel subsidies hit $7 trillion worldwide in 2022. These subsidies are distributed across all countries and territories surveyed by the fund.”
Who are these ‘subsidies’ going to, the users of the fossil fuels or the producers of fossil fuels?? Do some research…
Fossil fuels producers mostly pay royalties to governments, it’s what keeps many governments afloat, because of the huge energy surplus the production of fossil fuels has been over the last 250 years.
We built our modern civilization on the back of fossil fuels, without them we don’t produce anything industrially in the modern world, despite decades of subsidies to renewables and nuclear power. Fossil fuels are dirty, destroying our Holocene stable climate period, but without them we have no modernity, yet now have over 8.2B humans on the planet.
We are in deep deep overshoot, with a fossil fuels based civilization, which are soon to leave us due to depletion.
Think of the huge subsidies the Saudi’s give their population by allowing them to purchase fuel well below international prices. Without them the govt would likely be overthrown as the disparities in wealth between the house of Saud and the rest would be overwhelming. Please tell us in who’s interest it is to stop such subsidies??
For renewables and nuclear, there are large subsidies, yet they do not pay royalties on the energy produced, why not?? If any of the rhetoric was accurate about how cheap solar was, at industrial use type scale, then solar could pay high taxes on every MWh produced, just like fossil fuels do just about everywhere..
Australia is squandering most of its gas in LNG exports. In fact, there is a gas shortage on the East Coast because Victoria’s conventional gas production has peaked
28 Mar 2024
Peak gas in Victoria, Australia
https://crudeoilpeak.info/peak-gas-in-victoria-australia
and the coal seam gas is exported in Gladstone, made expensive by global LNG prices.
25/7/2018
Australia is exporting itself gas poor, plans LNG import terminals
http://crudeoilpeak.info/australia-is-exporting-itself-gas-poor-plans-lng-import-terminals
27/3/2017
Howard’s energy super power stuck in domestic gas shortages
http://crudeoilpeak.info/howards-energy-superpower-stuck-in-domestic-gas-shortages
7/4/2015
Australia’s alternative transport fuel: The East Coast gas-ship has sailed
http://crudeoilpeak.info/australias-alternative-transport-fuel-the-east-coast-gas-ship-has-sailed
Matt,
The US is not far behind and will come to this realization around 2030 as natural gas output starts it’s decline.
Like Australia, US also forbids the LNG from Gulf of America to ship to New England, and piped NG from Appalachian to New England, let Appalachian shale operators lose money, and New England import expensive pipe NG from Canada, and LNG from EU (some originated from Russia).
If New England replace all import NG and LNG with NG from Appalachian, the wellhead price in Appalachian could be doubled to close to HH?
Ovi
You constantly show a peak in PRODUCTION in November 2018.
What I have read is much of the October and November increase was not production but Saudi Arabia selling large amounts of oil they had in storage.
https://www.opec.org/assets/assetdb/momr-january-2019-1.pdf
https://www.opec.org/assets/assetdb/momr-november-2018.pdf
There is no way Saudi Arabia suddenly increased production by 600,000 barrels per day in a month or so and then production suddenly fell back.
A 12 month moving average is far less likely to be twisted by storage releases as storage has its limits.
Using a 12 month moving average will give a new high by November if OPEC produces what it says it will.
Loads of Oil,
It was not just KSA, it was all OPEC plus producers. It is well known that OPEC plus had decided it would establish new quotas at the end of 2018, the month before this meeting all members produce at capacity as this number is the basis for quotas. That is the reason Nov 2018 was the peak, along with high output by non-OPEC.
I agree the 12 month average is more useful.
Loadsofoil
As Dennis mentions, there were a number of factors that came together at that time.
Looking at the big 3 chart above, it first peaked at 34,097 kb/d in November 2018. Note how production actually started to rise sharply in June 2018.
On a country basis from August 2018 to November 2018, here are some of the bigger contributors.
– Iran: -825 (yes negative)
– Kazakhstan: 258
– Saudi Arabia: 580
– UAE: 190
– US: 524
The total increase over those 3 months was 1,371 kb/d. I think that Iran was hit with sanctions then and that was another reason OPEC decided to raise production to offset their drop. As for Saudi Arabia’s increase, some could have come from inventory.
Attached also is the first chart with a bit of a 12 month CMA added. Doesn’t look peaky enough for me.
I have analyzed the 2018 peak in Fig 2 (peak shaping countries) in my post:
25 Mar 2025
Post-Covid crude production in world outside the US still lower than end 2018
https://crudeoilpeak.info/post-covid-crude-production-in-world-outside-the-us-still-lower-than-end-2018
There are 3 peak shaping processes:
1. one or more countries increasing and then reducing production in the given period (Libya, Saudi Arabia)
2. countries with increasing production (Russia, Kazakhstan, UEA. Iraq, US, Kanada)
3. countries with decreasing production (Iran, Venezuela, Mexico)
These countries explain about 92% of the 2018 peak.
Matt
Oil released from storage to fulfill contracts is not production.
Saudi Arabia hold field by field production as state secrets. The best we can do is look at annual production for countries like that.
Thanks Ovi
As you have shown Iran, US and Kazakhstan cancel each other out.
My main point being Saudi Arabia production figures. In my mind and from what I have read is the figures are not production figures but rather sales contract figures.
Saudi Arabia has vast storage facilities which it fills up and then able to sell at a moment notice.
https://www.reuters.com/article/markets/currencies/saudi-arabia-had-at-least-731-million-barrels-of-crude-stored-in-early-septembe-idUSKBN1W11Z9/
Oil is often contracted to sell months in advance and usually at current price of contract signing. Saudi Arabia would not increase production by 600,000 per day, which is very costly when oil prices were falling by $20 or $30. Then cut production over the next couple of months. This is classic storage release.
They were releasing oil from storage to fulfill deliveries of contracts signed in previous weeks or months. That is what the 73 million barrels storage is used for.
If Saudi Arabia want to grab a higher percentage of market share they will have a sustained production increase over at least a year. I think this time they will manage to bankrupt a good number of U S producers.
Loads of Oil
I really don’t like adding gasoline to the fire but here it goes.
Attached is a chart that shows SA oil stocks from the period preceding November 2018. Using the same period as before August 2018 to November 2018, SA stocks dropped by 18,370 kb. Over 91 days that converts to a decline in stocks of 201.87 kb/d.
This chart only shows stocks going down and makes it impossible to say for sure that these barrels were counted as production. SA uses crude to power their power stations and it is winter in November.
Just saying.
Loadsofoil wrote:
My main point being Saudi Arabia production figures. In my mind and from what I have read is the figures are not production figures but rather sales contract figures.
I have no idea where you read such a thing. Saudi production numbers include domestic consumption as well as exports. The OPEC MOMR simply states that they get their production data from “secondary sources.”
From Google AI
OPEC’s “secondary sources” are independent organizations that provide production data, and are not directly part of the OPEC organization. They include: S&P Global Commodity Insights (formerly S&P Global Platts), Argus Media, Energy Intelligence Group, Wood Mackenzie, Rystad Energy, and IHS Markit. OPEC also uses data from the U.S. Energy Information Administration (EIA) and the International Energy Agency (IEA), though the IEA data is no longer used as a secondary source as of March 2022.
Ron
Do you have the field by field production data for Saudi Arabia for November 2018 to March 2019.
It would be interesting to see where Saudi Arabia was pumping up to an extra 2 million barrels per day of water into which fields order to maintain reservoir pressure.
https://www.meed.com/riyadh-explores-oil-recovery-methods/#:~:text=Saltwater%20travels%20through%20a%20pipeline,between%20Saudi%20Arabia%20and%20Kuwait.
The 73 million barrels of oil they have in storage is just sitting there for exactly when there is a spike in contract deliveries.
It is good to see that 20 years after first concerns about peak oil became better known, that prices are so low and Saudi Arabia can still produce over 11 million barrels per day.
Dennis
Look at the data
https://www.opec.org/assets/assetdb/momr-april-2019.pdf
Do you really think Saudi Arabia over a period of 10 months increased production by 900,000 barrels per day and then cut production by 1.1 million barrels per day. While they got 73 million barrels in storage?
Saudi Arabia produces oil at the most cost efficient possible, increasing and decreasing oil production like that is the most costly.
They produce a consistent 10 million barrels per day placing some into storage. The violent fluctuations you see is storage release or refill. The data they give out is probably delivery data.
Loadsofoil,
The report say production data, neither of us knows what actual production is, the US also stores oil, as do most nations, changes in storage levels are measured separately. The 78 million barrels stored would amount to 213 Mb/d over a year’s time and a system cannot operate when storage levels fall to zero, the logistics would be impossible. The typical storage levels are 90 days of forward demand for most nations with fluctuations of plus or minus 10 days.
Mistake in comment above, 213 Mb/d should be 213 kb/d.
Dennis
Thanks I did wonder.
Obviously Saudi Arabia will increase and decrease production but only enough to keep their storage within acceptable limits. Contracts fluctuate, a delivery of two million barrels from their SPR can be refilled over a few weeks without undue cost.
Refinery throughput was 81.6 Mb/d in 2018 in 2024 it was 81.1 Mb/d.
Variations throughout the year are catered for with either storage drawdown or storage increases. Not running around like headless chickens.
2025 could very well see new highs of refining throughput. 12 months moving average obviously
Loads of oil,
Also prices fell in the fall of 2018 which led to lower output after Nov 2018 from some non-OPEC plus producers. Also Trump sanctions on Iran and Venezuela were ramped up about this time.
D C,
The way Saputra simulate and forecast each basin is to train their shale oil and gas production/flow GEV Model using existing wells’s data so that their GEV Model repeats the existing wells’ dataset first, then they project/forecast production using the trained GEV Model for both existing wells and new wells.
To better train GEV Model, they also have to divide a basin into sub-groups as each will follow a different set of GEV Model parameters.
In case of Haynesville and Permian, we could see their trained GEV Models seem to forecast the next 3 years production of existing wells at the time of the paper was written up quite accurately, i.e. error within eye-ball or <3% when overlap with NOVI dataset/plot.
But, in case of Bakken, the deviation is as large as 10~15%.
In case of Marcellus (PA+WV), there is no readily available NOVI dataset for PA+WV to overlap, so I spent some efforts to extract some plots.
From NOVI PA production (March 2023), we could extract the Marcellus only, and overlap with Saputra GEV Model projection (Red&Green color) trained with actual production dataset to July 2020 (WV+PA Marcellus). See attached,
We could see in March 2023, when production for wells prior to July 2020 dropped from 24BCFPD to 12.3BCFPD; and the NOVI PA Marcellus only production for wells prior to July 2020 dropped to 10.0BCFPD, this means only 2.3BCFPD production left for WV wells prior July 2020 Marcellus. Yet, the WV wells prior July 2020 had production about 6.6BCFPD, and should decline to ~3.3BCFPD, and therefore there is a gap of ~1BCFPD, or ~10% under estimation using trained GEV model. This is mainly the result of changed production model for wells after 2019, where the type curve improved a lot with minimal lateral length increase.
Sheng Wu,
Perhaps you are correct, note that how the curve decreases depend on the mix of wells from different areas and that well profiles change shape over time as well (from one year to the next as the mix of wells completed changes. So I think it is not as simple as your method suggests, also note the PA wells drop from about 18 to 12 or to about 67 % of level in June 2020, the Saputra Model drops from 23 to 12.5 or by about 54%. I have about 5 BCF from WV in June 2020 (23-18). If we assume the drop is 54% that would be 2.7 BCF so a total of 12 plus 2.7 or 14.7 BCF for PA and WV. The Saputra model has a bigger drop to 12.5 BCF/d suggesting their model may be too conservative, which I have suggested on many occasions. Still not clear the Marcellus wells have become more productive since 2020, certainly not true for PA Marcellus wells, WV output may be higher due to higher completion rates rather than improved productivity.
D C,
I have been long puzzled by the high productivity of WV Marcellus wells.
They have been hiding under the radar with low profile.
According to 2023 WV GES report, the 2,944 HA6 laterals produced 2.7 TCF gas (Dry) plus 136.7 million bbls of liquid (oil and NGL) and ~50K BO PD (EIA data, condensate API>50deg), or 0.92BCF each year and 2.51MMCF per day gas, and 46K bbls a year and 126bbls liquid (17bbls of condesate) per day for each lateral!
For comparison,
Permian (Novi July 2023) has ~42,500 laterals producing 5.3Million BO, and 21BCFPD of gas (dry plus NGL) or 125 bbls oil and 494 MCF of gas per day for each lateral.
PA Marcellus has 9,870 laterals (NOVI March 2023), and producing 19.5BCFPD, or only 0.72BCF each year and 1.98MMCF per day for each lateral.
Sure, WV laterals are younger and longer compared to PA, but their Marcellus shale thickness is also much thinner. They also have shallow depth <7K~8Kft, and usually with high GOR over 8MCF/bbl, and usually such GOR at such low TVD suffer PVT recondensation, and hurt both liquid and gas production as demonstrated in EF and Permian.
The under-estimate by Saputra in Marcellus probably is caused by the improved productivity in WV wells post 2019, and WV gross gas (dry plus NGL? by EIA) production has increased from 7.05 BCFPD to 9.78BCFPD (dry gas is lower and this include Utica HA6 which is only ~0.3BCF PD in 2023) from June. 2020 to Feb. 2025, while the number of completed laterals has shrunk from over 200 to barely over 100 in 2023, and average lateral length increase also slowed down significantly.
A second look into Bakken seems to suggest that Saputra under-estimate is also a result of more refracs in Bakken than they used in 2019 dataset. So, the more realistic EUR prior 2019 Bakken wells should be under 5 GBO as D C projected at 4.9 GBO, but still higher than the 4.5 GBO estimated by Saputra in 2020.
Sheng Wu,
Probably makes more sense to use dry gas than Gross gas or perhaps marketed gas. Gross gas includes gas that is flared and reinjected, along with other gas that is not hydrocarbon. Marketed Gas is probably better, but EIA has Marcellus Dry Gas, you can deduct PA Marcellus using Novi data through Dec 2023 to get WV, there isn’t much Ohio Marcellus production so that can be ignored.
Sheng Wu,
For the most recent 3200 PA Marcellus wells they produced an average of 4.5 MMcfpd vs about 2.6 MMcfpd for WV wells.
There are people on this website who say OPEC has hardly any spare capacity.
Yet when I question Saudi oil production figures they get all uppity.
Ok I will agree with you just for a moment.
https://momr.opec.org/pdf-download/res/pdf_delivery_momr.php?secToken2=accept
According to this data which nobody is allowed to question, Saudi Arabia is producing 8.9 million barrels per day in January, February and March 2025.
Just over a year ago it was producing over 11 million barrels per day for over 5 months. So if you accept this data unquestioningly you believe that Saudi Arabia alone must have 2 million barrels of daily spare capacity.
Make up your mind which is it?
Loadsofoil,
I tend to agree 12 month averages are more useful, I use that to evaluate spare capacity, The Saudi capacity for recent 12 month peak is about 10.5 Mbpd and Saudi spare capacity is about 1.6 Mbpd in my opinion.
There are many opinions on this.
Dennis
As you know Saudis have claimed 12.5 mb/d, I think that is unlikely. They almost certainly can do 11 for an extended period of time. If they had to.
https://www.cnbc.com/2025/05/03/opec-agrees-another-accelerated-oil-output-hike-for-june-sources-say.html
If this is correct then we will have a new 12 month moving average high by August or September.
Most countries that produce oil are seriously dependent on the revenues it brings in. They will be forced to produce more in a desperate attempt to make up for the price fall.
Think of Iran, Iraq, Libya, Brazil, Argentina, Nigeria.
China and India will be very happy as they tend to buy when prices are low and they have vast spr facilities to fill up.
Loadsofoil wrote:
If this is correct then we will have a new 12 month moving average high by August or September.
You probably meant by August or September 2026! It would be near impossible to reach such an average by September 2025. That increase doubled, one in April and another in June, would put them at almost the high 12 month average. However they would have to hold that level for 12 months to hit a new 12 month high average. And we will not know that until next July or so.
Peak Mo …Peak Avg
84,592 … 82,961 Peak
82,184 … 81,875 January 2025
-2,408 … -1,086
Loadsofoil,
Saudi claims are not believable. I will believe Saudis can produce at 11 Mbpd when they do it for C plus C for a 12 month average output. Anything else is only talk.
Just updating my previous comment that Manufacturing is a loss leader.
https://www.zerohedge.com/markets/aaaaand-its-gone
Why did China buckle? Hmmmm
Dollar is king because of the debt demand. No way out. Bye gold bye BRICS
Loadsofoil,
I tend to agree 12 month averages are more useful, I use that to evaluate spare capacity, The Saudi capacity for recent 12 month peak is about 10.5 Mbpd and Saudi spare capacity is about 1.6 Mbpd in my opinion.
There are many different opinions on this.