Comments not related to oil or natural gas production in this thread please. Thanks.
Read MoreCategory: Uncategorized
Open Thread Non Petroleum, April 1, 2021
Comments not related to oil or natural gas production in this thread please. Thanks.
Read MoreOpen Thread Non Petroleum, March 24, 2021
Comments not related to oil or natural gas production in this thread please. Thanks.
Read MoreOPEC Update, March 2021
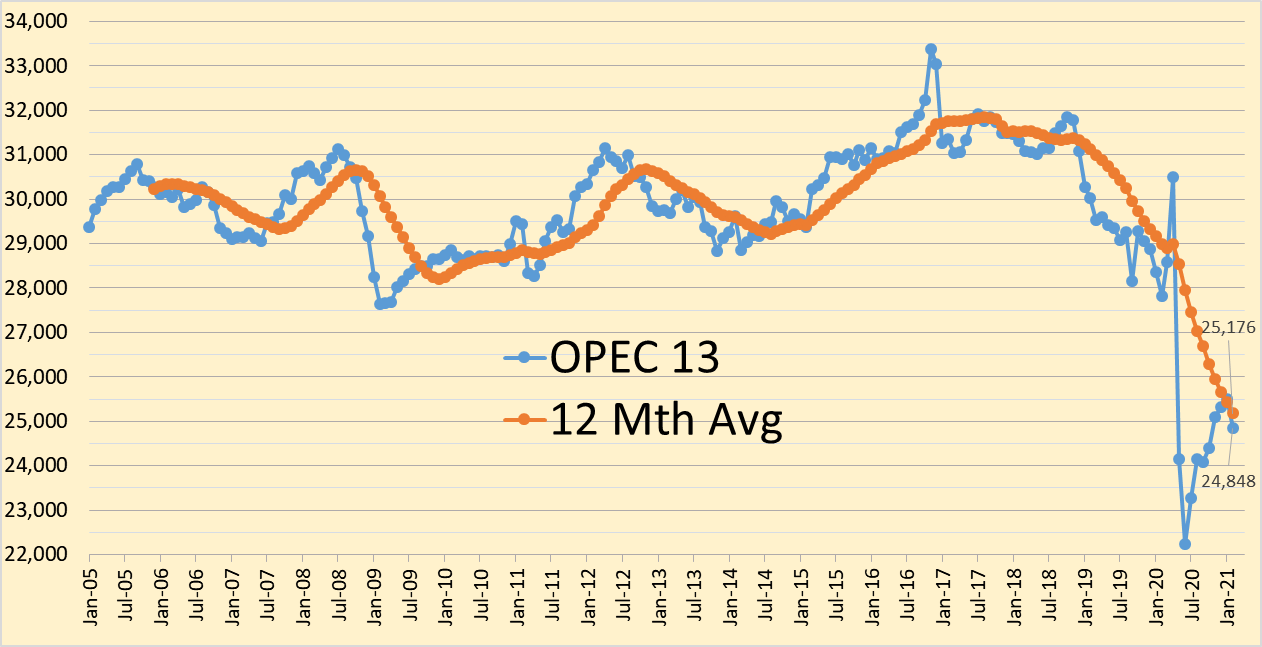
The OPEC Monthly Oil Market Report for March 2021 was published this past week. The last month reported in each of the charts that follow is February 2021 and output reported for OPEC nations is crude oil output in thousands of barrels per day (kb/d). The numbers at the left side of the graphs show February 2021 output (and in some cases the trailing 12 month average output).

Open Thread Non-Petroleum, Feb 27, 2021
Comments not related to oil and natural gas in this thread please. Thanks.
Read More