Comments not related to oil or natural gas production in this thread please. Thank you.
Read MoreCategory: Uncategorized
Open Thread Non-Petroleum, December 2, 2022
Comments not related to oil or natural gas production in this thread, please. Thank you.
Read MoreThe EIA’s Short-Term Energy Outlook
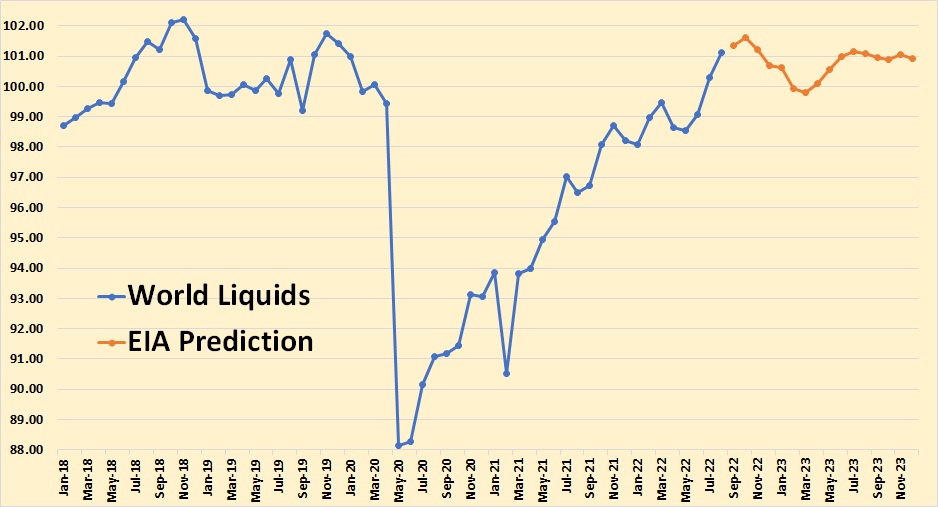
The EIA’s Short-Term Energy Outlook gives the USA data as C+C as well as total liquids, OPEC as crude only, but the rest of the world is Total Liquids only. All data in the charts below are million barrels per day.

The known data is through August 2022, the rest, in red, in million bp/d, is the EIA’s estimate. However, this is Total Liquids, not C+C. And Total Liquids is not a good indicator of oil production as the below table shows.
Read MoreOpen Thread Non-Petroleum, Nov. 25, 2022
Comments not related to oil or natural gas production in this thread, please. Thank you.
Read more: Open Thread Non-Petroleum, Nov. 25, 2022OPEC Update, November 17, 2022
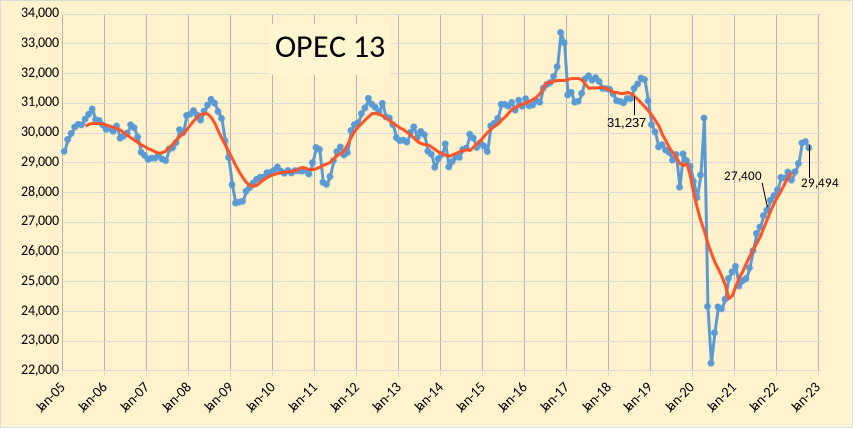
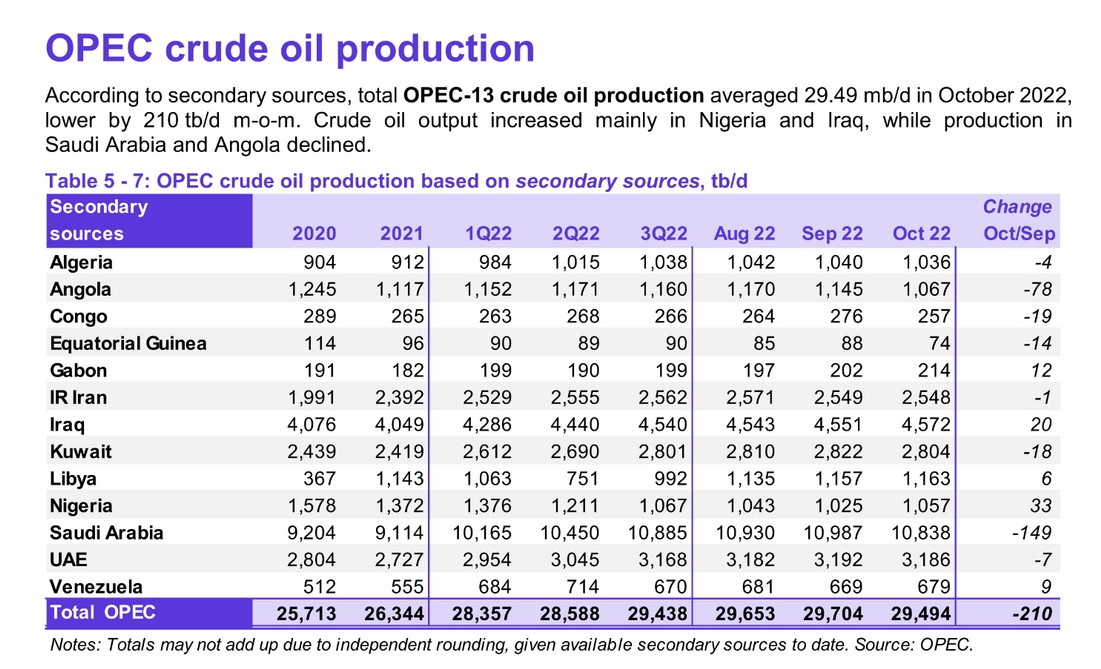
The OPEC Monthly Oil Market Report (MOMR) for November 2022 was published recently. The last month reported in most of the OPEC charts that follow is October 2022 and output reported for OPEC nations is crude oil output in thousands of barrels per day (kb/d). In most of the OPEC charts that follow the blue line is monthly output and the red line is the centered twelve month average (CTMA) output. I also show a number of charts from the recent World Energy Outlook 2022, published by the IEA in October. I focus on a selection of charts from Chapter 7 of that report which covers oil.

