Comments not related to Oil or Natural Gas production in this thread please. Thank you.
Category: Uncategorized
OPEC Update, April 2023
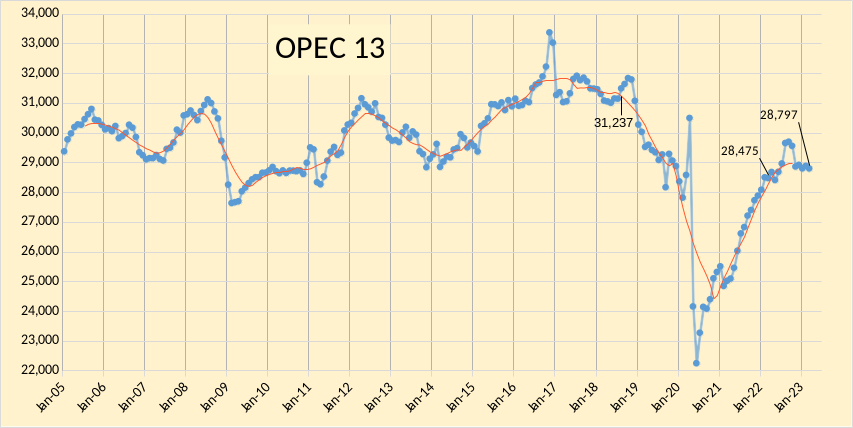
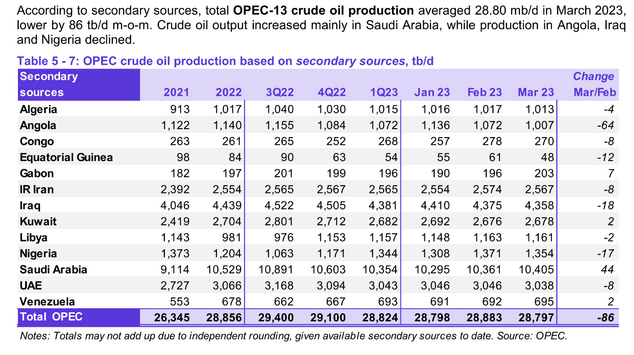
The OPEC Monthly Oil Market Report (MOMR) for April 2023 was published recently. The last month reported in most of the OPEC charts that follow is March 2023 and output reported for OPEC nations is crude oil output in thousands of barrels per day (kb/d). In many of the OPEC charts that follow the blue line with markers is monthly output and the thin red line is the centered twelve month average (CTMA) output.


Open Thread Non-Petroleum, April 19, 2023
Comments not related to oil or natural gas production in this thread please, thanks.
Open Thread Non-Petroleum April 11, 2023
Comments not related to oil or natural gas production in this thread please. Thanks.
Read MoreOpen Thread Non-Petroleum April 3, 2023
Comments not related to oil or natural gas production in this thread please. Thanks.
Read More