By Ovi
The focus of this post is an overview of World oil production along with a more detailed review of the top 11 Non-OPEC oil producing countries. OPEC production is covered in a separate post.
Below are a number of Crude plus Condensate (C + C) production charts, usually shortened to “oil”, for the oil producing countries. The charts are created from data provided by the EIA’s International Energy Statistics and are updated to November 2025. This is the latest and most detailed/complete World oil production information available. Information from other sources such as OPEC, IEA, STEO and country specific sites such as Brazil, Norway, Mexico, Argentina and China is reported to provide an extra one or two month outlook.
The EIA March STEO report has made significant and major revisions to the projected World oil production due to the US/Iranian war. Also US projected production has been significantly revised upward. See US chart at the end.
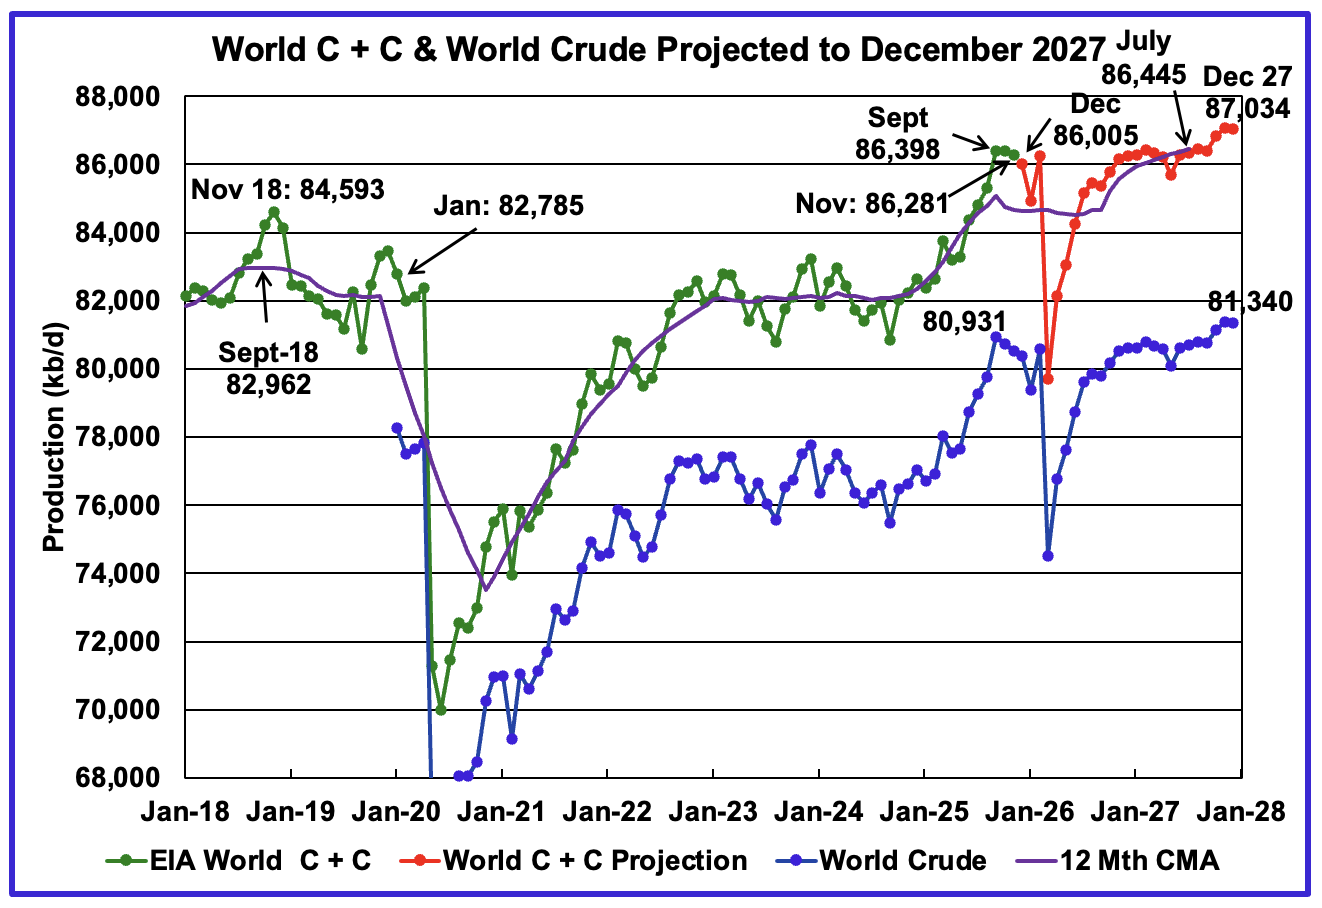
The World’s November oil production decreased by 109 kb/d to 86,281 kb/d.
September 2025 is the new World Peak Oil at 86,428 kb/d for the next year and a half when in late 2027 more oil production is brought online. Note that after the March output crash, oil production only gets back to the November 2025 production level in November 2026.
This chart has been updated using the March 2026 STEO to project World C + C production out to December 2027. It uses the STEO report along with the International Energy Statistics to make the projection. Production in December 2025 is projected to decrease by 276 kb/d to 86,005 kb/d. March production drops by more than 6,000 kb/d due to the Iran/US war.
The 12 month Centred Moving Average shown at July 2027 is 86,445 kb/d vs the September 2018 12 month CMA of 82,962 kb/d.
For December 2027, production is projected to be 87,034 b/d, a new projected high and an upward revision of 674 kb/d from the previous report. Most of that increase is from the US. See US chart below.
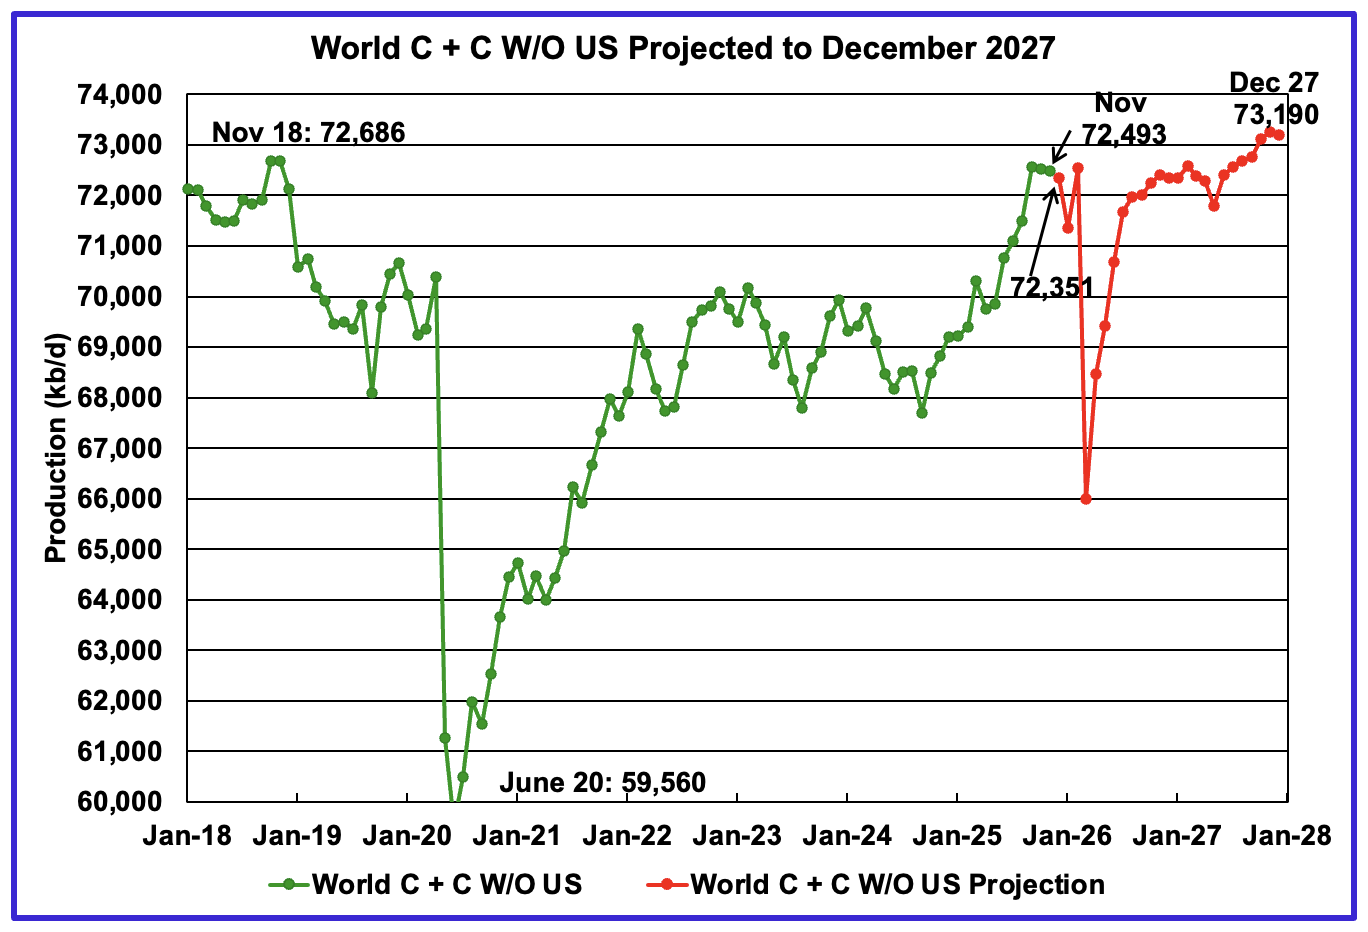
November’s World oil output W/O the US decreased by 33 kb/d to 72,493 kb/d. December’s production is expected to decrease by 142 kb/d to 72,351 kb/d.
The projection is forecasting that December 2027 World W/O US oil production will be 73,190 kb/d, an increase of 697 kb/d from November 2025.
A Different Perspective on World Oil Production
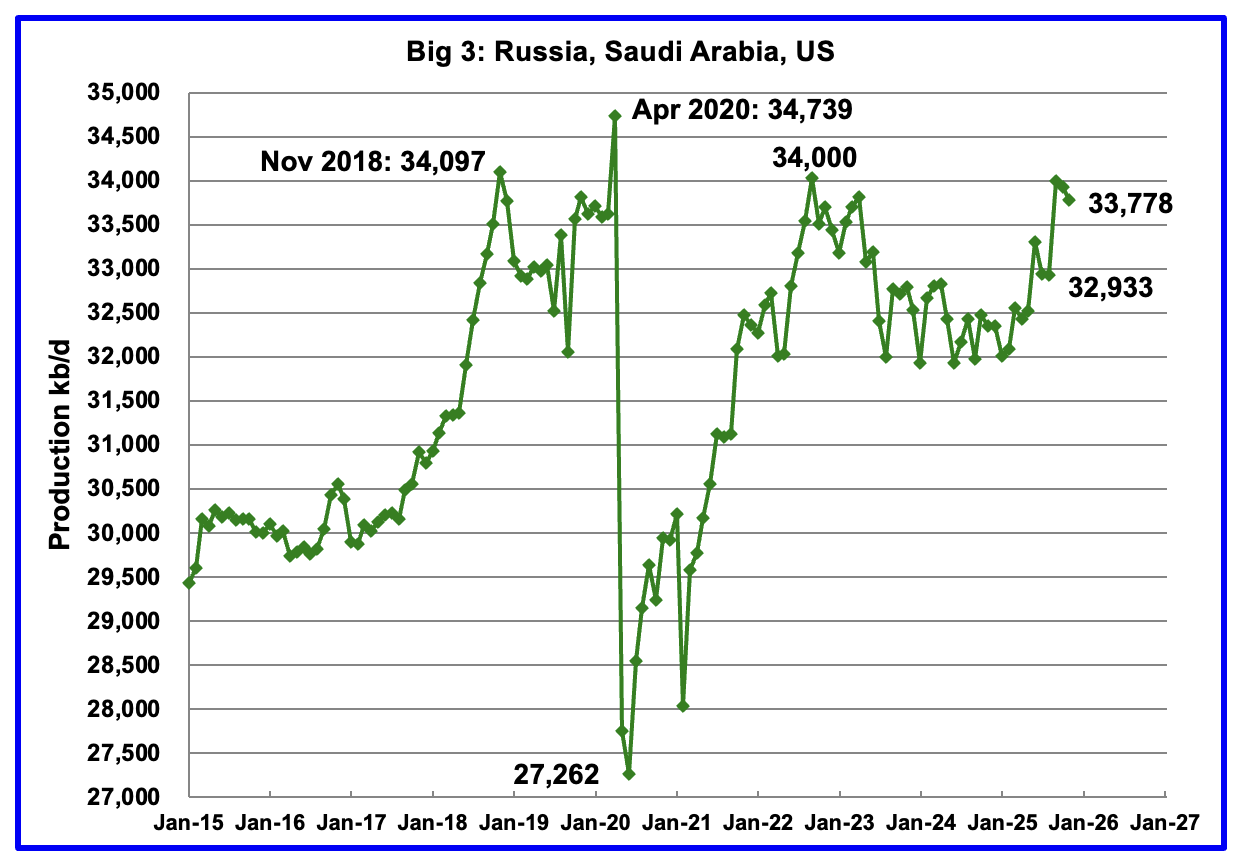
November’s Big 3 oil production decreased by 150 kb/d to 33,778 kb/d.
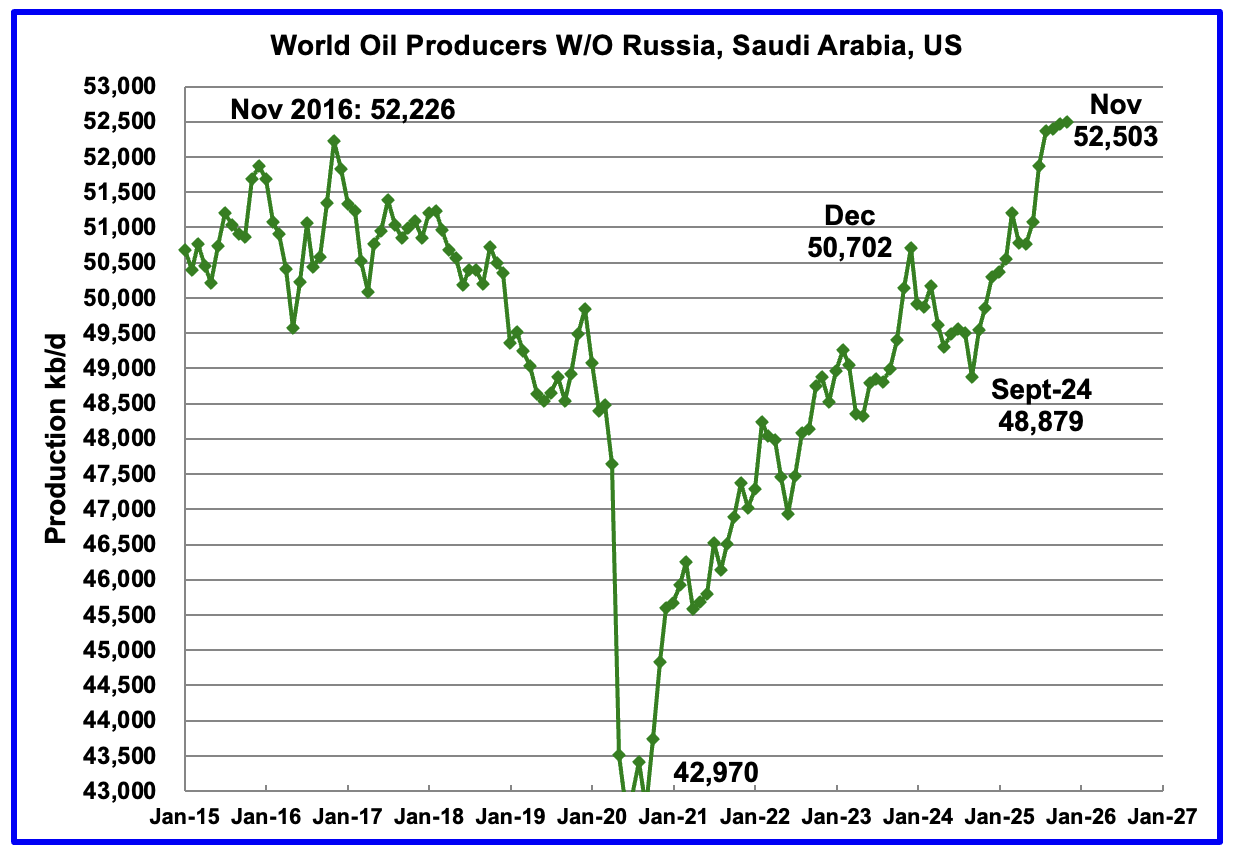
Production in the remaining countries has been slowly increasing since the September 2020 low of 42,970 kb/d. Production rose in November 2025 by 41 kb/d to 52,503 kb/d.
Countries Expected to Grow Oil Production
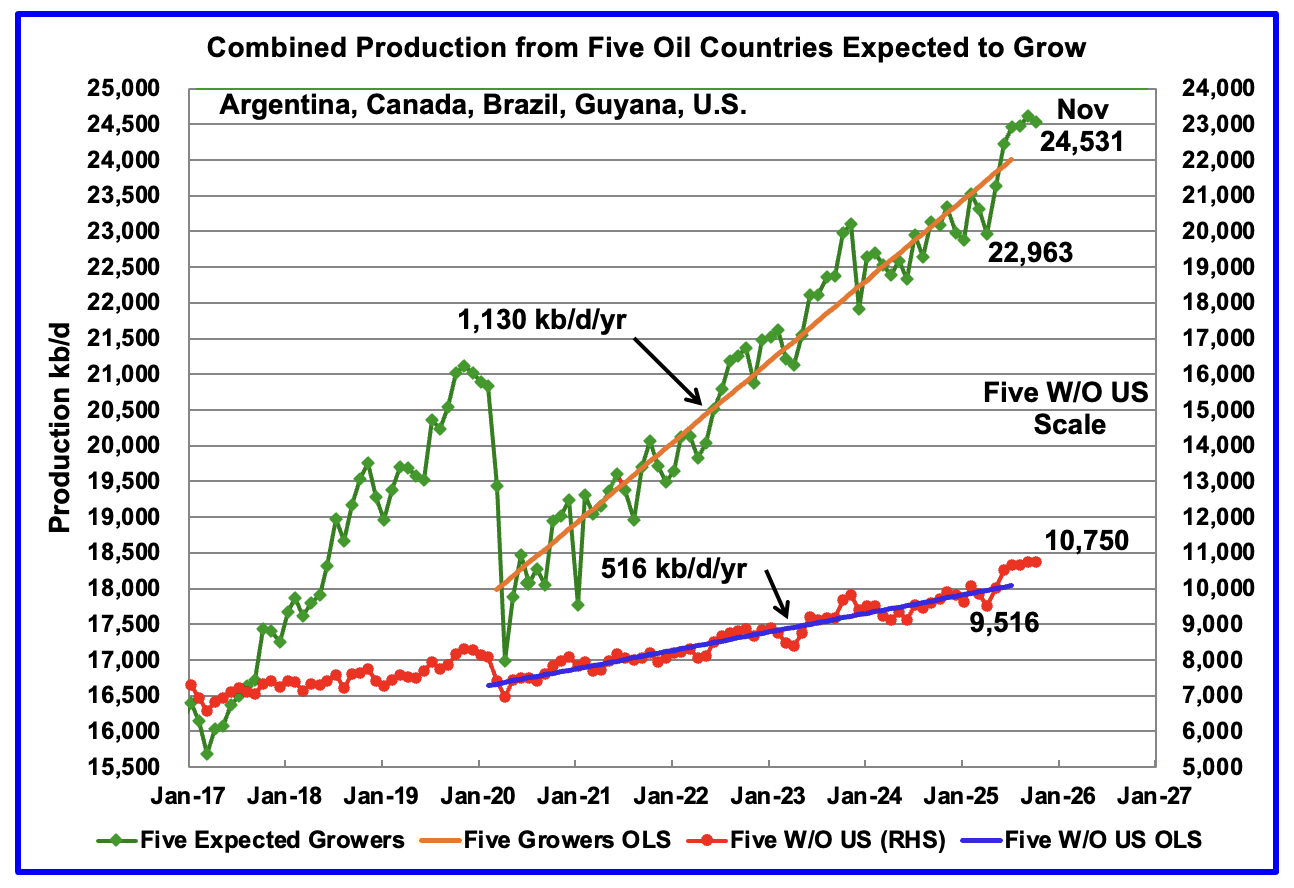
This chart shows the combined oil production from five Non-OPEC countries, Argentina, Brazil, Canada, Guyana and the U.S., whose oil production is expected to grow. These five countries are often cited by OPEC and the IEA for being capable of meeting the increasing World oil demand for next few years. For these five countries, production from April 2020 to July 2025 rose at an average rate of 1,130 kb/d/year as shown by the orange OLS line.
To show the impact of US growth over the past 5 years, U.S. production was removed from the five countries and that graph is shown in red. The production growth slope for the remaining four countries has been reduced by 614 kb/d/yr to 516 kb/d/yr.
November production has been added to the five growers chart and it dropped by 90 kb/d to 24,531 kb/d. November’s production drop was a mix of small gains and declines. For the Five growers W/O U.S., November production dropped by 7 kb/d to 10,750 kb/d.
December production for the five countries is expected to be up a bit and then drop in January,
Note: The OLS lines are updated to July 2025.
World Oil Countries Ranked by Production
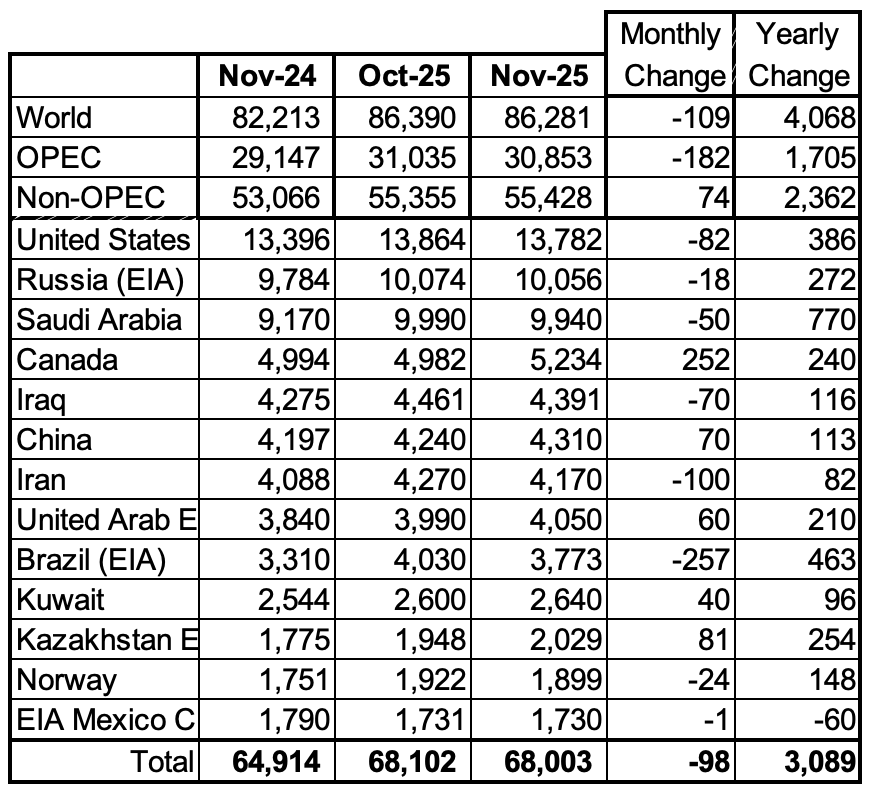
Above are listed the World’s 13th largest oil producing countries. In November 2025 these 13 countries produced 78.8% of the World’s oil. On a MoM basis, production decreased by 98 kb/d in these 13 countries while on a YOY basis production rose by 3,089 kb/d. Note the large YoY increases from Saudi Arabia, Brazil and the US..
November Non-OPEC Oil Production Charts
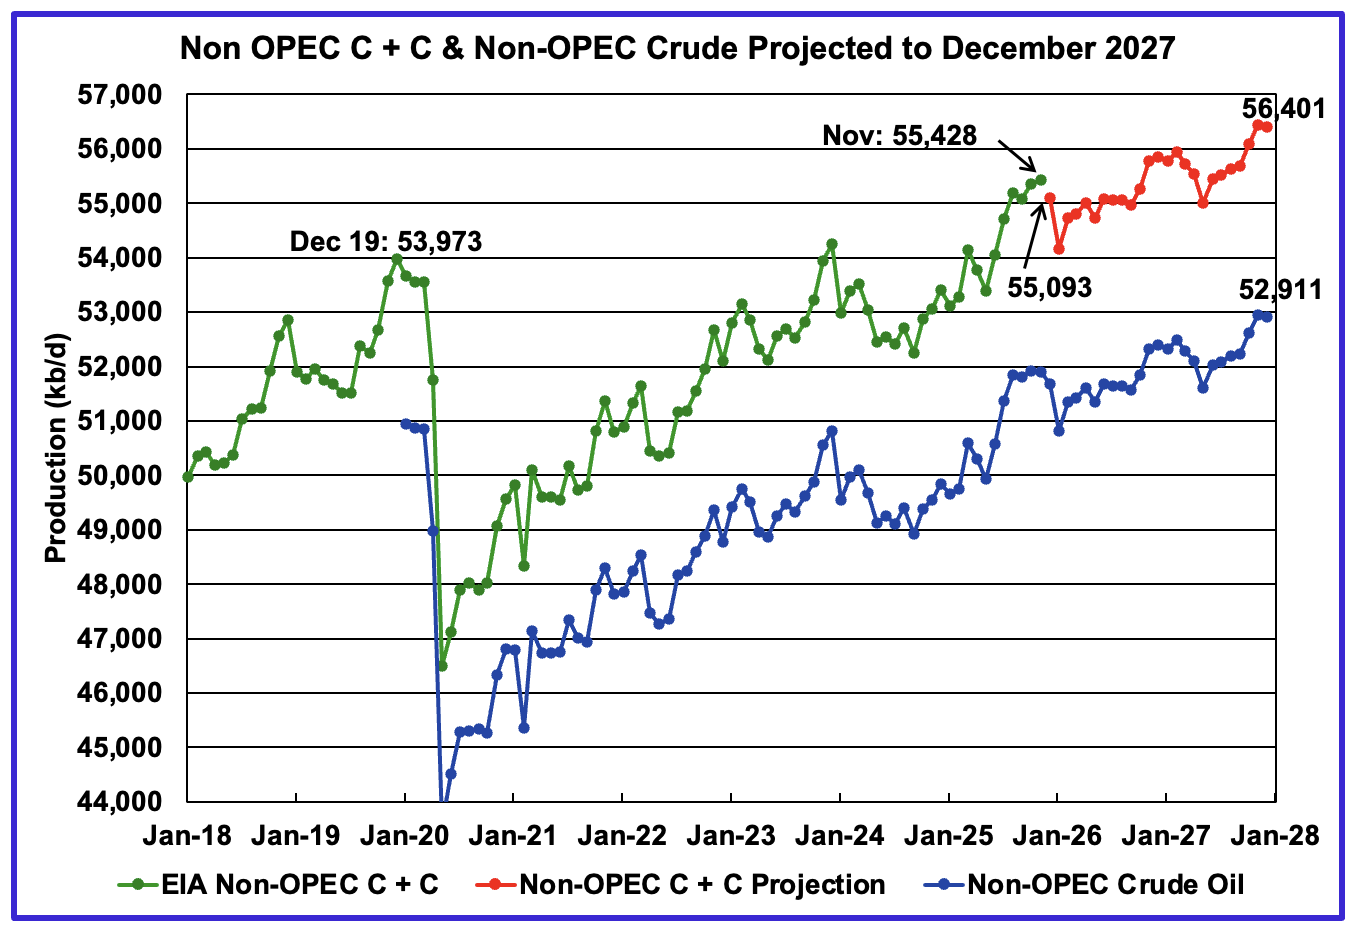
November’s Non-OPEC oil production increased by 74 kb/d to 55,428 kb/d. December is expected to drop by 335 kb/d to 55,093 kb/d. A much lager drop of 935 kb/d to 54.157 kb/d in expected in January.
Using data from the March 2026 STEO, a projection for Non-OPEC oil output was made for the period December 2025 to December 2027. (Red graph). Output is expected to grow by 973 kb/d from November 2025 to reach 56,401 kb/d in December 2027.
December 2027 production was revised up by 681 kb/d from 55,720 kb/d. The increase came mostly from the US.
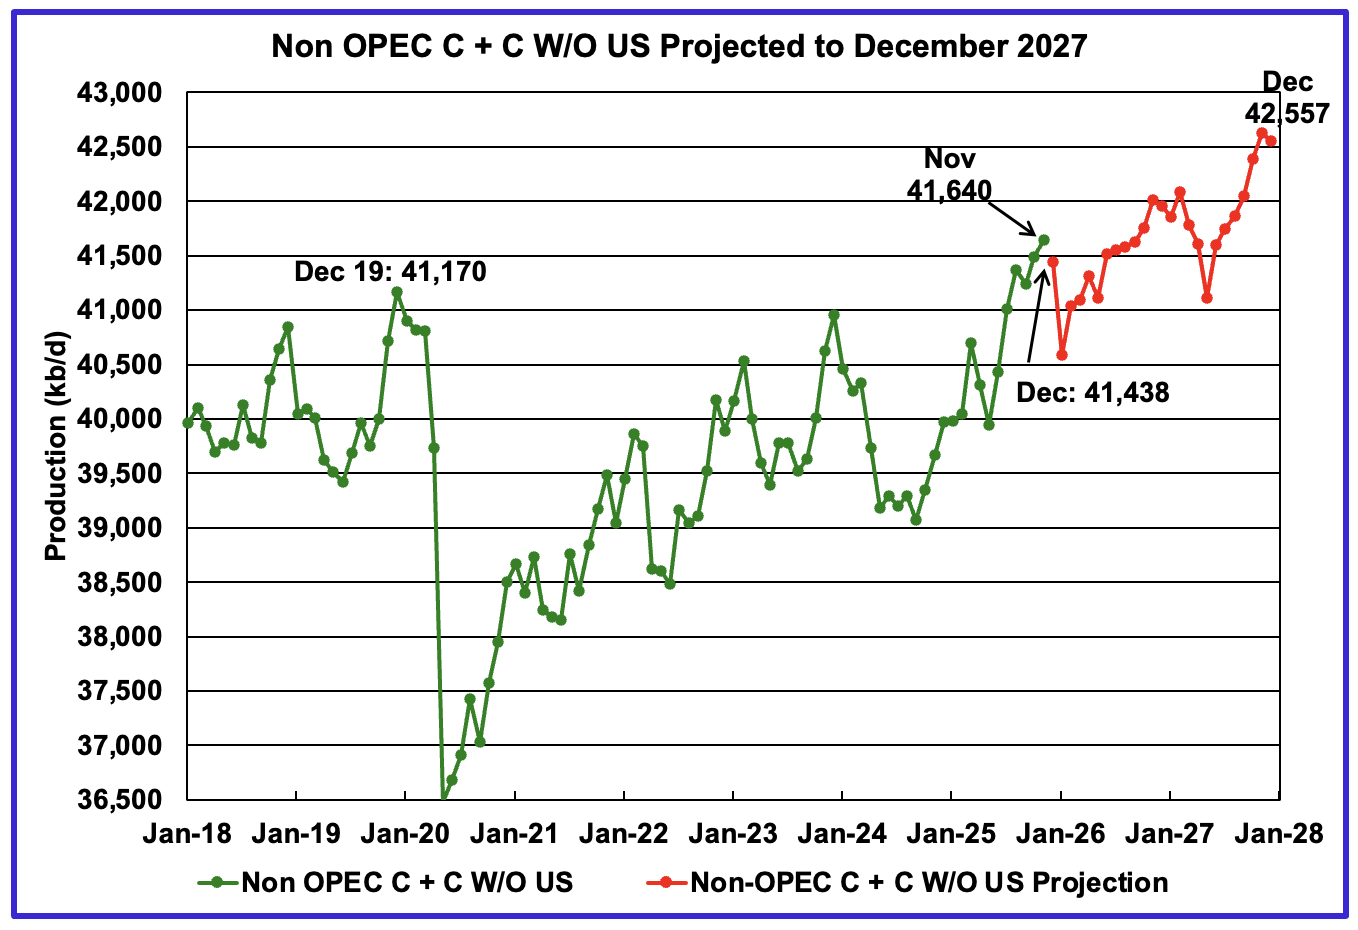
November’s Non-OPEC W/O US oil production increased by 149 kb/d to 41,640 kb/d. December’s production is projected to drop by 202 kb/d to 41,438 kb/d.
From November 2025 to December 2027, production in Non-OPEC countries W/O the U.S. is expected to increase by 917 kb/d to 42,557 kb/d.
Non-OPEC Oil Countries Ranked by Production
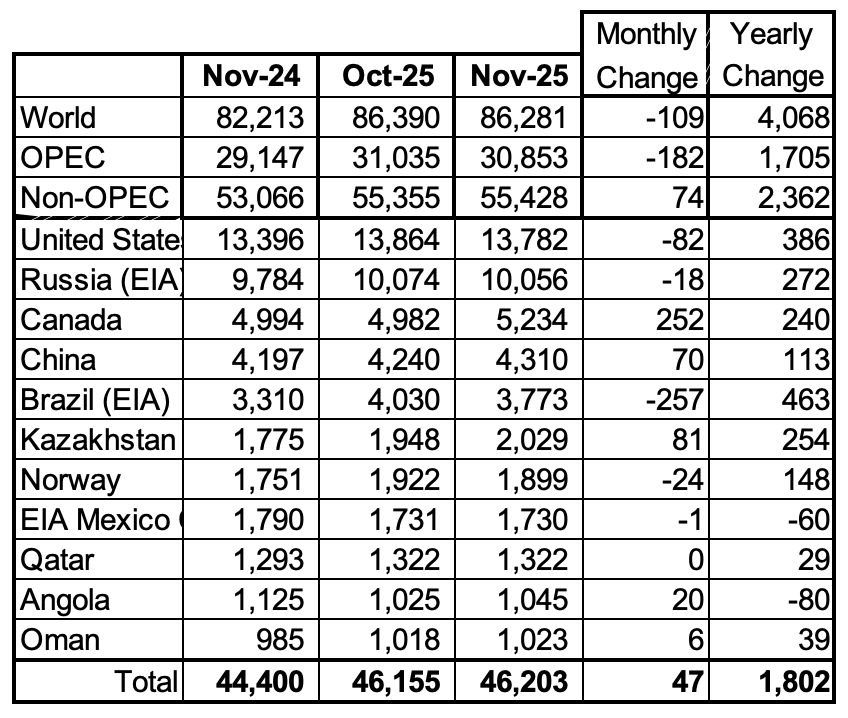
Listed above are the World’s 11 largest Non-OPEC producers. The original criteria for inclusion in the table was that all of the countries produced more than 1,000 kb/d.
November’s MoM production increased by 47 kb/d to 46,219 kb/d for these eleven Non-OPEC countries while as a whole the Non-OPEC countries saw a yearly production increase of 2,362 kb/d to 55,428 kb/d. Major yearly gains came from Brazil and the U.S.
In November 2025, these 11 countries produced 83.4% of all Non-OPEC oil.
Non-OPEC Country’s Oil Production Charts
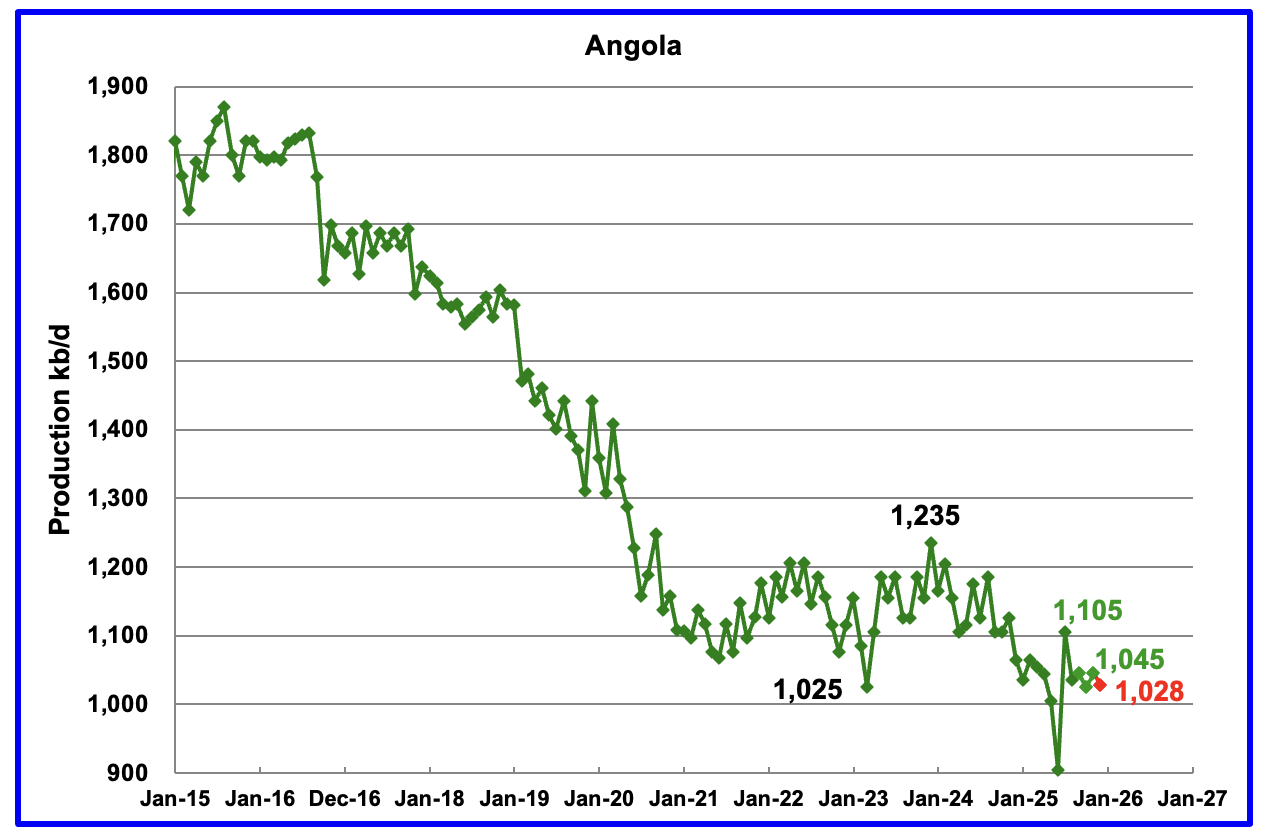
The EIA reported Angola’s November oil production rose by 20 kb/d to 1,045 kb/d.
According to Angola’s National Agency for Petroleum, December’s production was 1,028 kb/d, red marker.
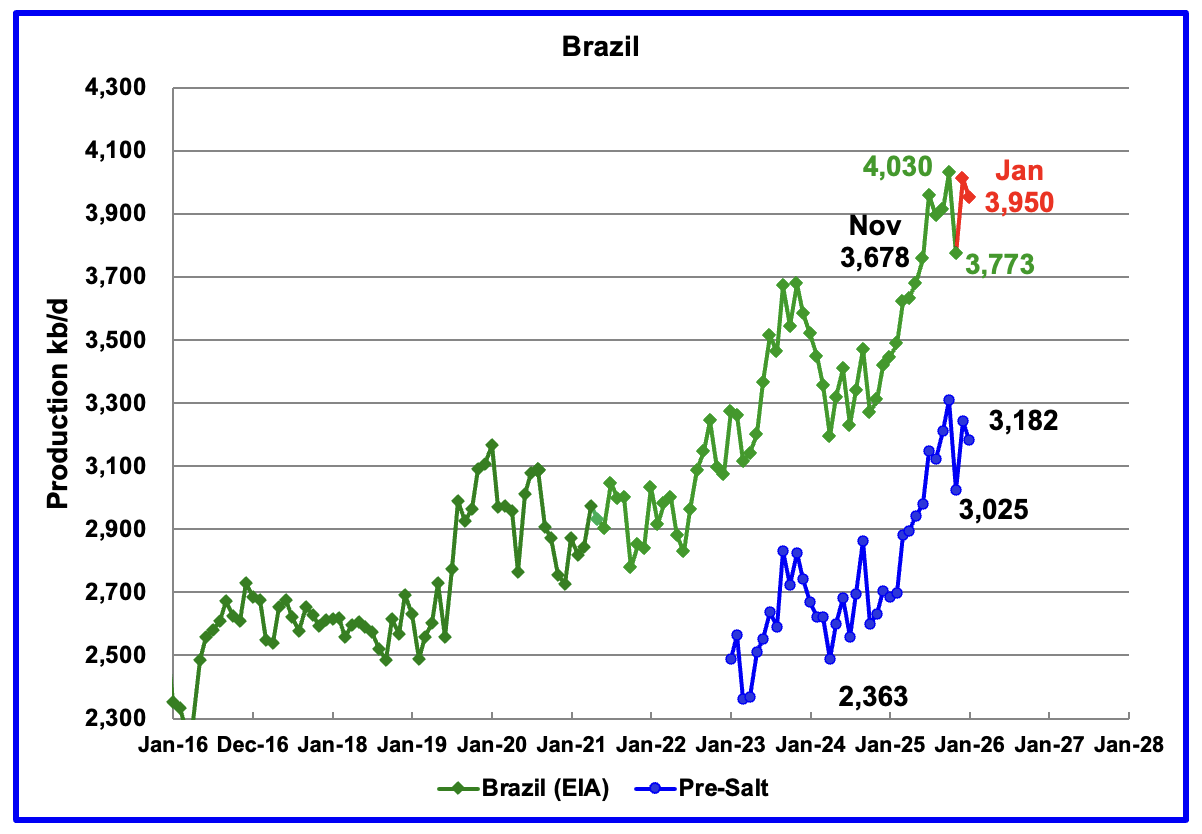
The EIA reported that Brazil’s November production dropped by 257 kb/d to 3,773 kb/d. According to this article, the November Production drop was due to platform outages at offshore fields.
Brazil’s National Petroleum Association (BNPA) reported that production rose in December and dropped to 3,950 kb/d in January. December production rebounded to 4,012 kb/d. Pre-Salt production was a major contributor to December’s rebound. Pre-salt production decreased by 61 kb/d in January to 3,182 kb/d.
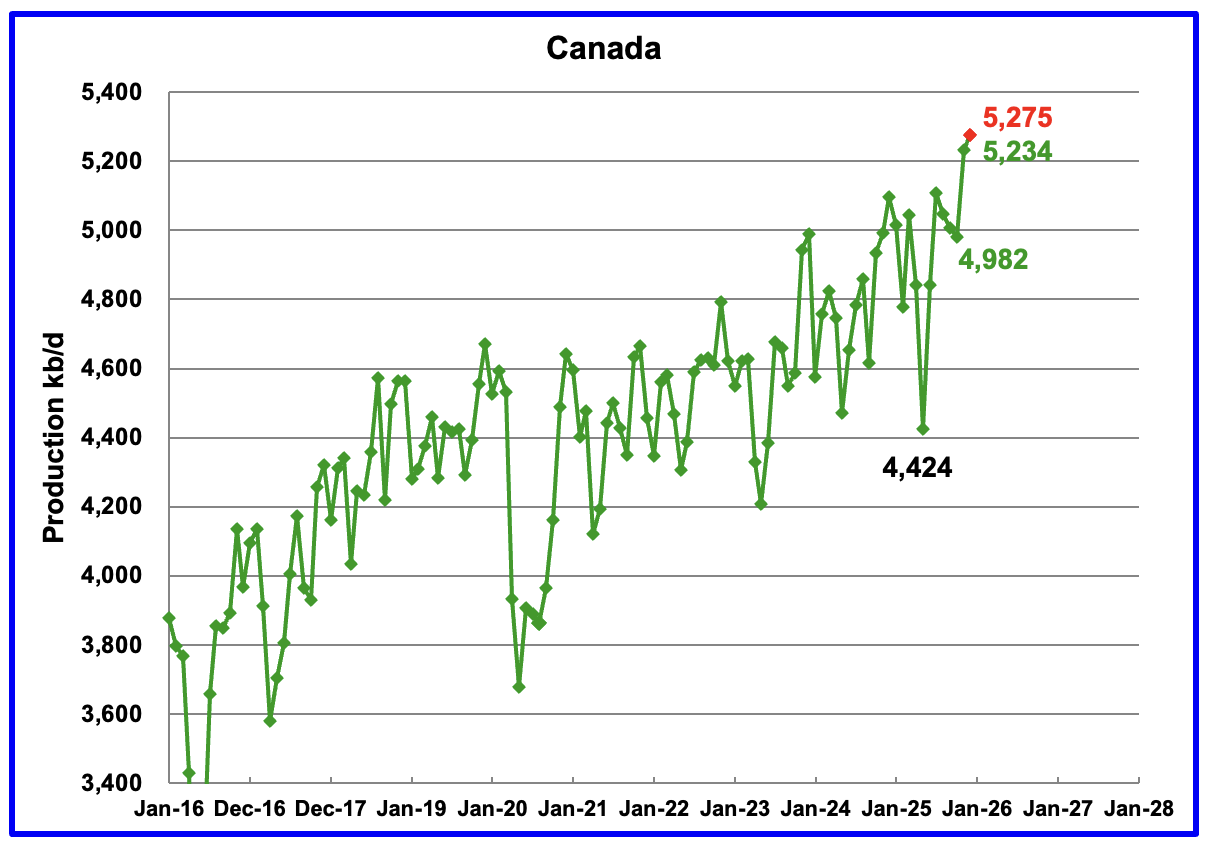
Canada’s oil production increased by 252 kb/d in November to 5,234 kb/d.
A projection has been made for December production based on preliminary production provided by the Canada Energy Regulator (CER). December’s projected production rose to 5,275 kb/d, a new record high, red marker. The CER estimate contains some NGLs which have been removed from the projection. On average the EIA reduces the CER’s monthly production by 375 kb/d which was also done for the December estimate.
According to this Article Canada has agreed to “do its part” to help the IEA release of oil reserves.
“Hodgson said Wednesday Canada will support those efforts but didn’t say what form that would take.” In a later release he said he would ask oil companies to release oil from their reserves.
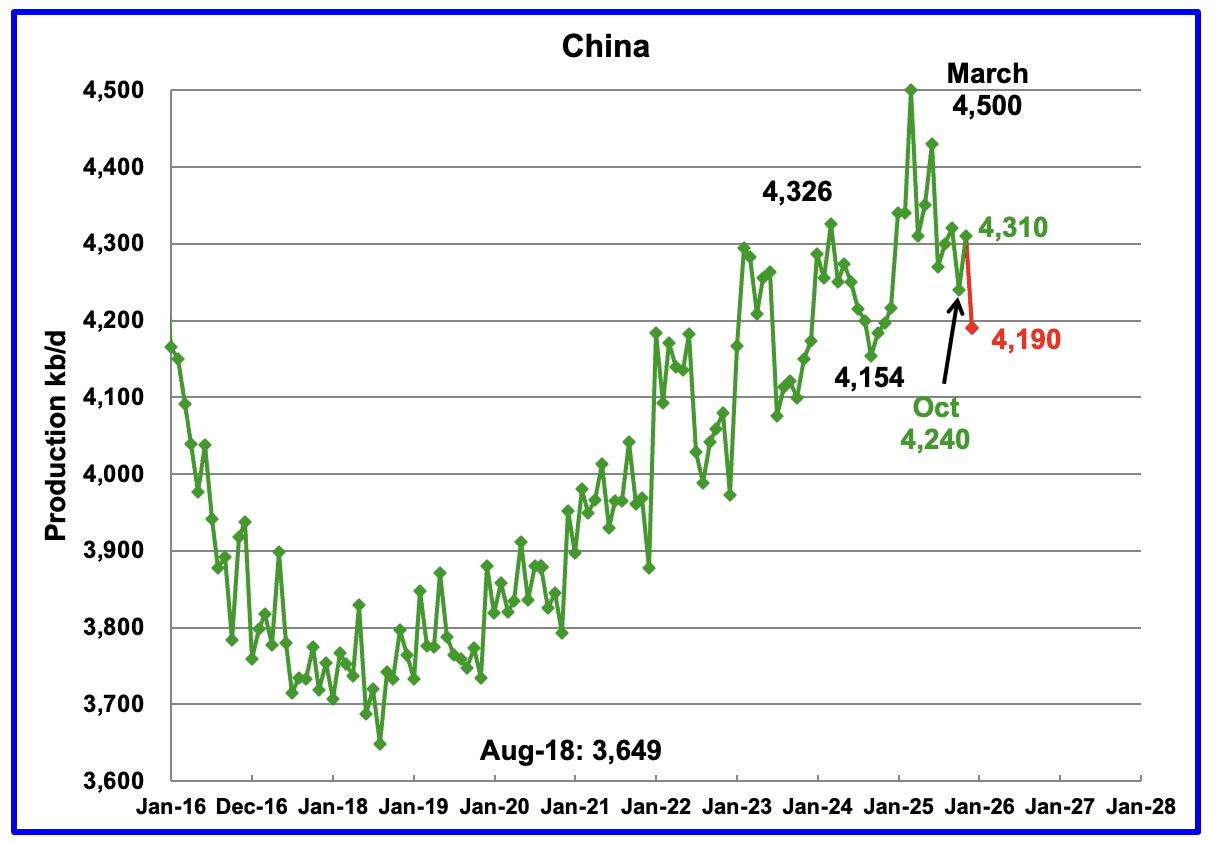
The EIA reported China’s November oil output rose by 70 kb/d to 4,310 kb/d.
The China National Bureau of Statistics reported December production dropped by 120kb/d to 4,190 kb/d. No report is available for January due to Chinese New Year.
On a YoY basis, China’s November production increased by 113 kb/d to 4,310 kb/d.
Note the large drop of 310 kb/d from March 2025 to December 2025. That appears to be a record drop over those nine months.
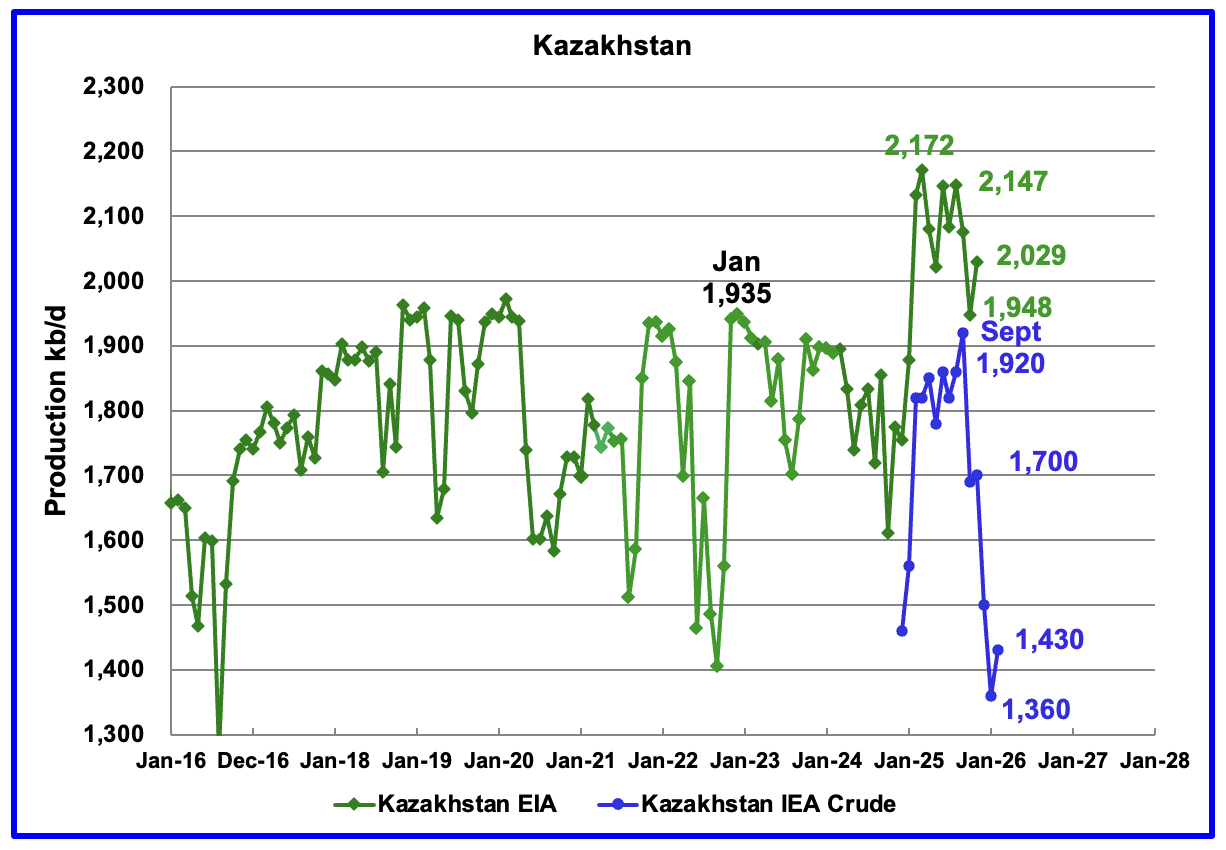
According to the EIA, Kazakhstan’s November oil output increased by 81 kb/d to 2,029 kb/d.
Since Argus no longer reports OPEC + crude production, production data for Kazakhstan will now be taken from the monthly IEA reports. In December 2025 pre-salt crude production was 1,500 kb/d. The March IEA OMR reported January 2026 production was 1,360 kb/d and February rose to 1,430 kb/d.
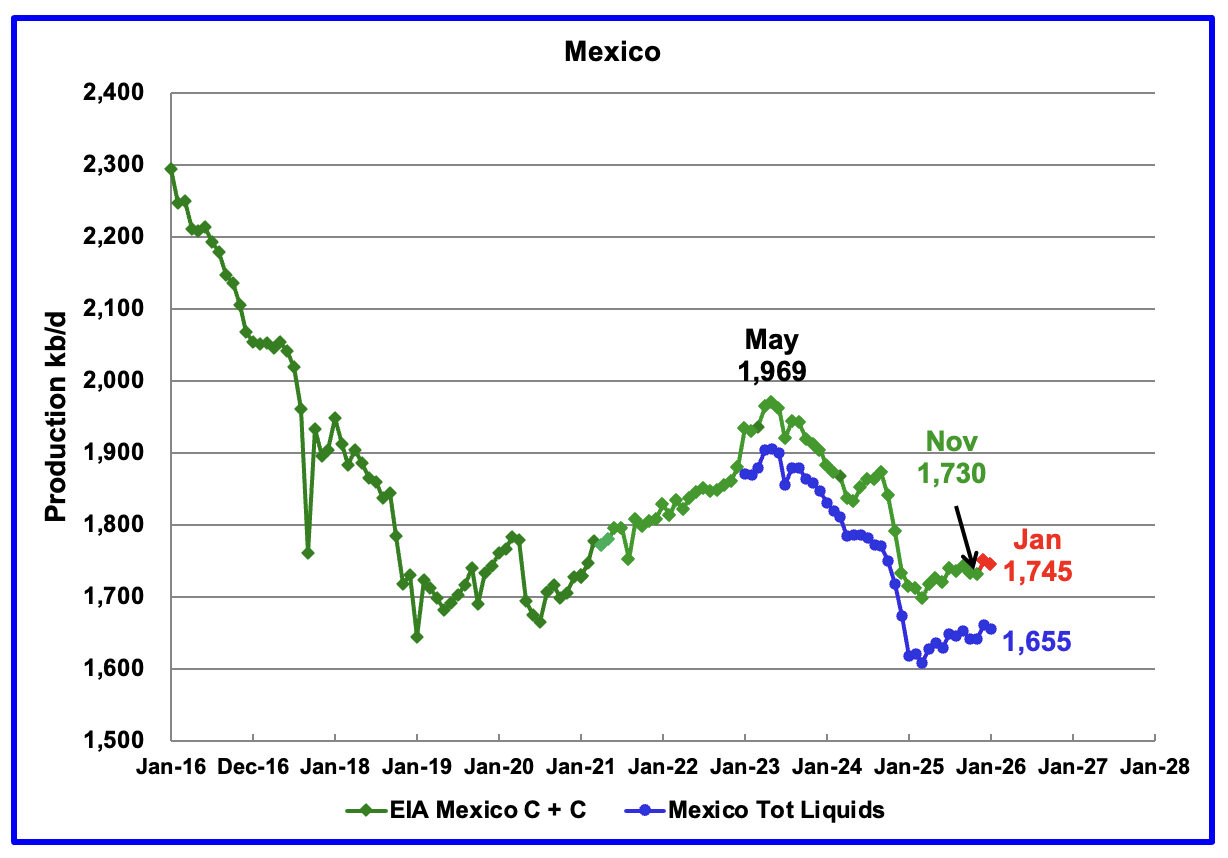
According to the EIA, Mexico’s November output dropped by 1 kb/d to 1,730 kb/d.
In June 2024, Pemex issued a new and modified oil production report for Heavy, Light and Extra Light oil. It is shown in blue in the chart and it appears that Mexico is not reporting condensate production when compared to the EIA report.
In earlier EIA reports, they would add close to 55 kb/d of condensate to the Pemex’s “Total Liquids” report. More recently the EIA has been adding 90 kb/d of condensate to Mexican production. For December and January production, 90 kb/d have been added to the Pemex report. January’s production is estimated to be close to 1,745 kb/d. Note that Mexico’s production, as reported by Pemex for the last seven months has stabilized around 1,650 kb/d.
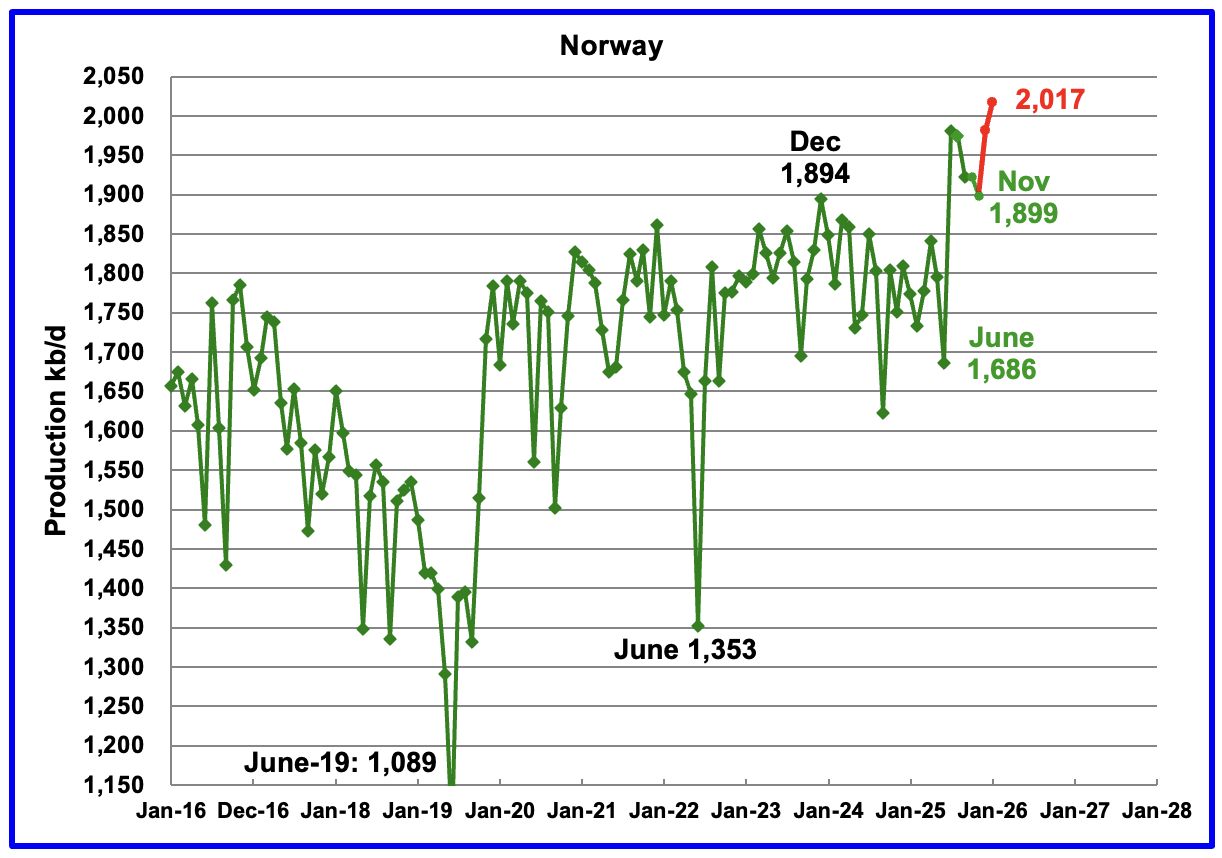
The EIA reported Norway’s November production dropped by 24 kb/d 1,899 kb/d.
Separately, the Norway Petroleum Directorate (NPD) reported that January’s oil production rose to 2,017 kb/d, a new high, red markers.
The Norway Petroleum Directorship also reported that January’s oil production was 6.3 % above forecast.
According to OPEC’s March MOMR: “Norwegian liquids production is forecast to drop by about 40 tb/d to average 2.0 mb/d in 2026. Several projects are scheduled to ramp up through the year, including Balder/Ringhorne, Heidrun, Gina Krog, Maria, and Snohvit.
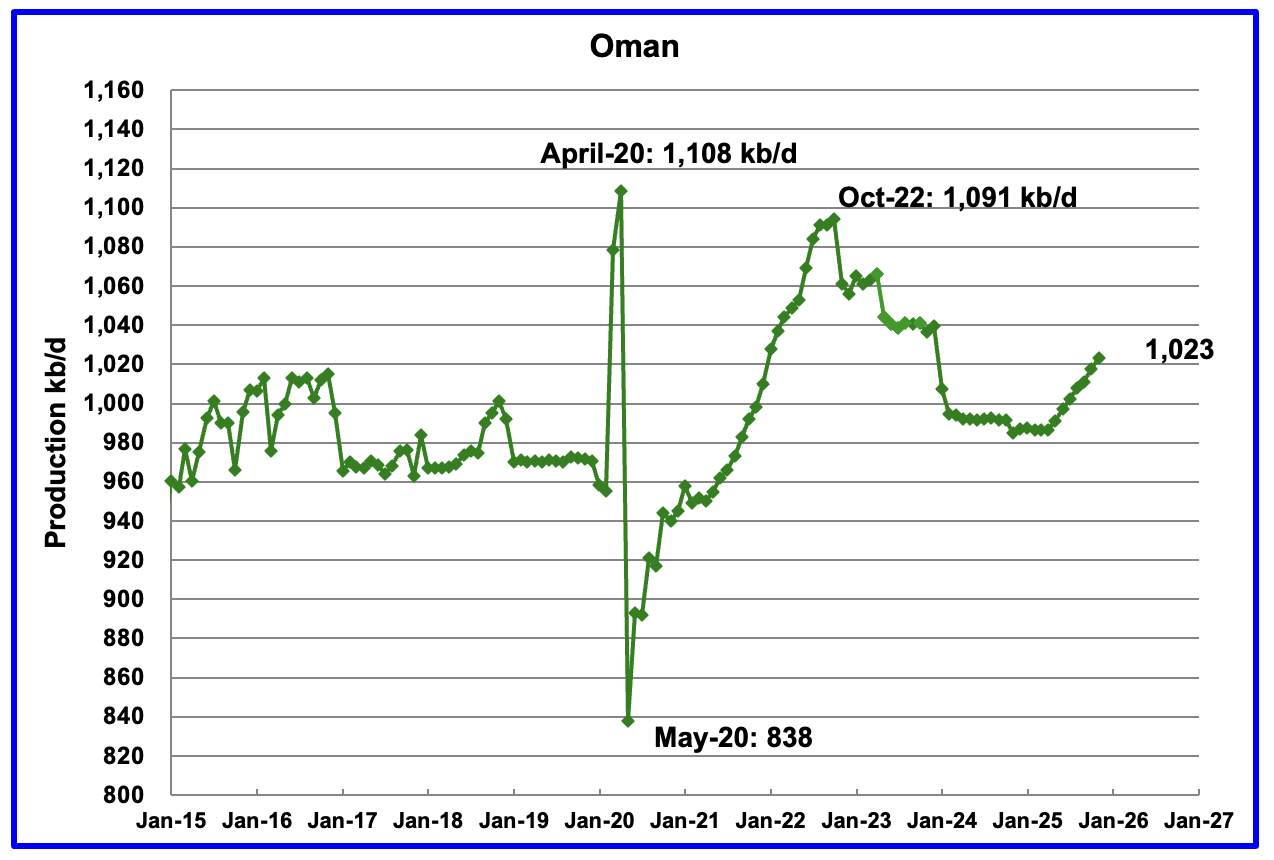
According to the EIA, November’s output rose by 6 kb/d to 1,023 kb/d and appears to have started a budding growth phase. Previous production peaked in October 2022.
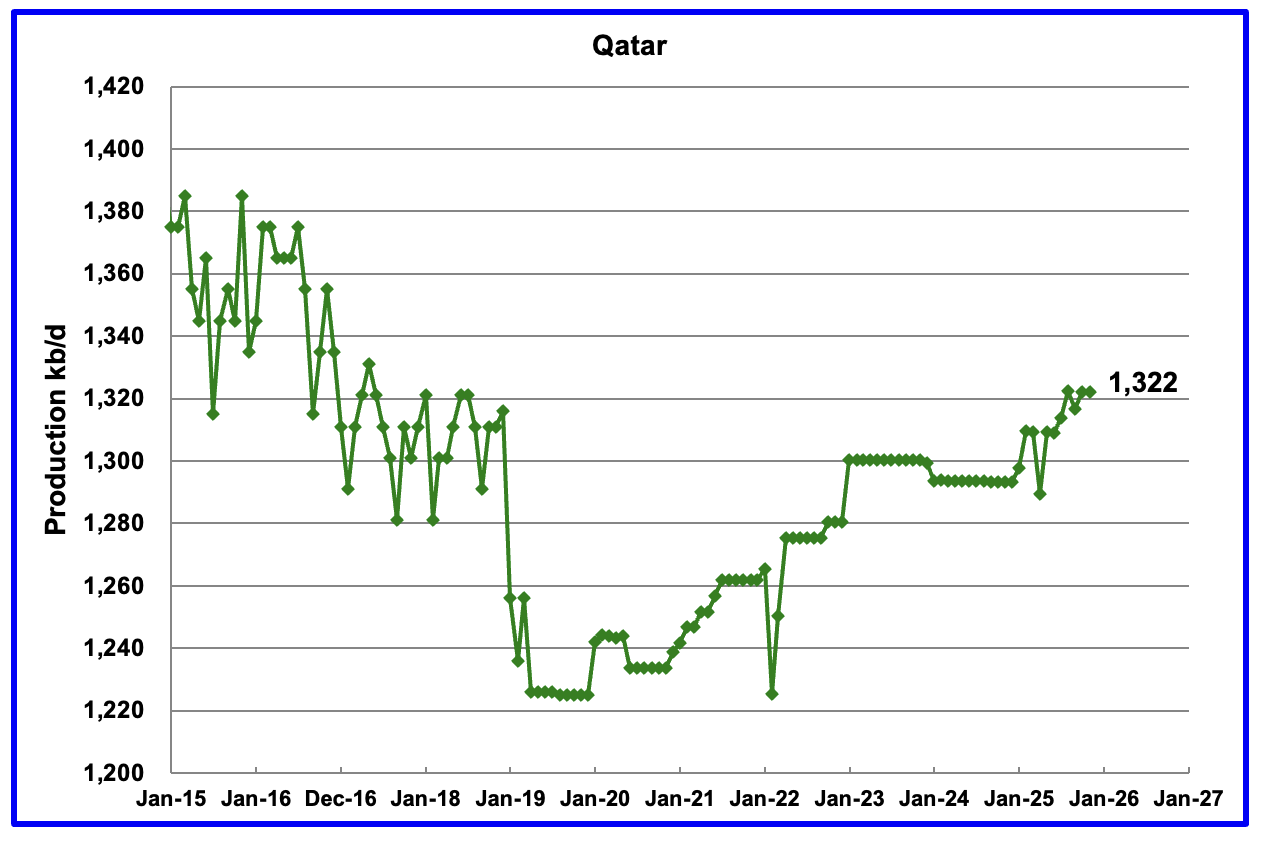
Qatar is now providing the EIA with monthly updated oil production back to January 2025. Qatar’s November output was reported to be 1,322 kb/d, unchanged from October.
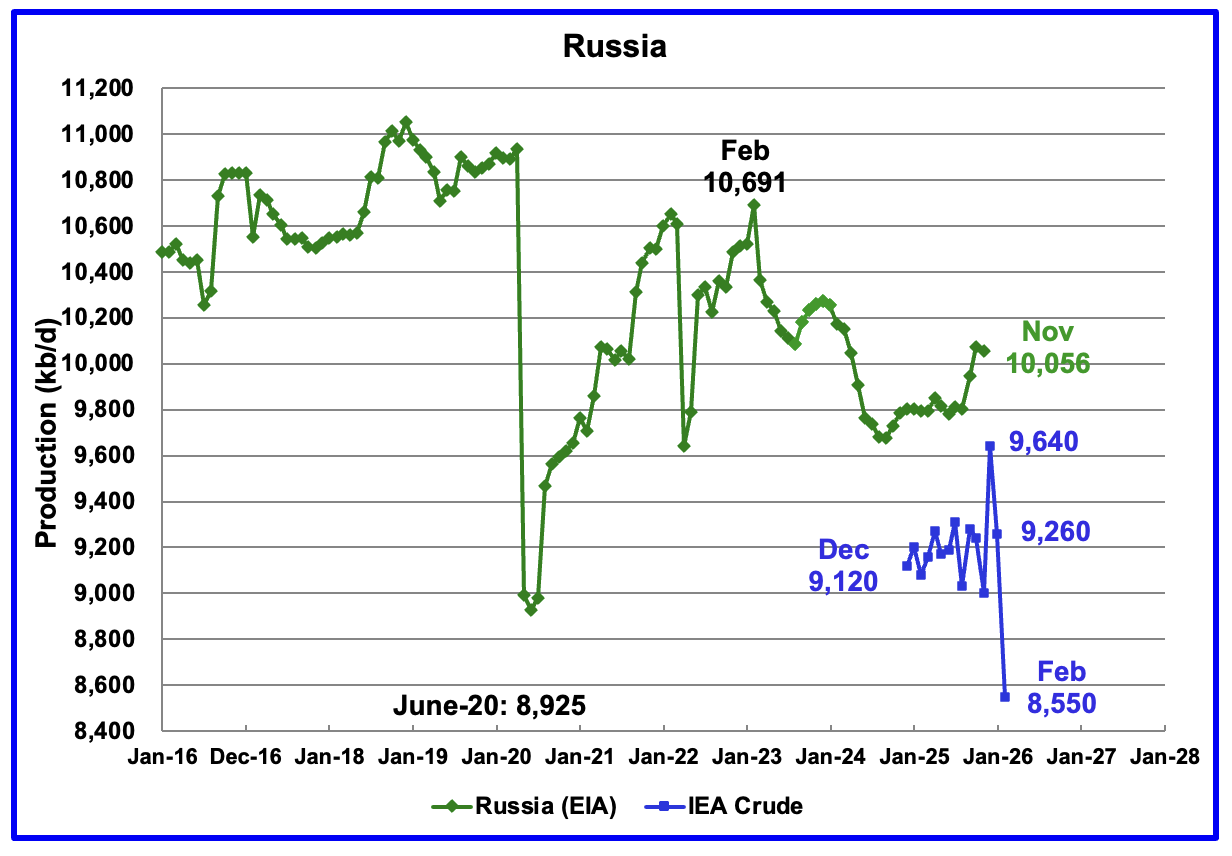
The EIA reported Russia’s November C + C production decreased by 18 kb/d to 10,056 kb/d and was up by 253 kb/d from August 2025.
Up to August 2025 Argus Media used to report OPEC + crude production. That monthly report has now been discontinued. The above chart now also shows Russian production as reported by the IEA. It is difficult to assess the accuracy of the IEA report but over the last few months before publication stopped the IEA’s Russian production had been around 100 kb/d to 150 kb/d higher than Argus’ Media. The best that can be done at this time will be to compare the production trends between the EIA and the IEA. I think that Russian oil production continues to be a major state secret at this time because of the damage being caused by the heavy bombing to its related crude oil processing facilities.
According to the IEA’s February report, December production rose by 640 kb/d to 9,640 kb/d. The March IEA OMR is reporting that Russian crude production dropped to 9,260 kb/d in January and then hit a new February low of 8,550 kb/d. This is the first clear indication that Russian production is being affected by the Russia/Ukraine war. The March OPEC MOMR is reporting Russian February crude production was 9,184 kb/d, a new recent low.
According to this Article, Russia’s ability to store oil is nearing its limit since the majority is on ships and very little is stored on land.
Russian seaborne crude exports fell to 3.4 million barrels per day (bpd) in January from 3.8 million bpd in December, and are currently tracking around 2.8 million bpd in February, according to analytics firm Kpler.
At the same time, the volume of Russian oil held on ships has climbed to a record high above 150 million barrels in recent months, while many tankers have also slowed their speeds – both signs of weaker buying.
The size of Russia’s onshore storage capacity is unclear, as the government does not publish data, but the amount remaining appears limited. Onshore oil inventories stand around 16 million barrels, or about 51% of capacity, based on satellite monitoring of tanks, according to Kpler senior crude analyst Naveen Das.
For Comparison: US production in last post.
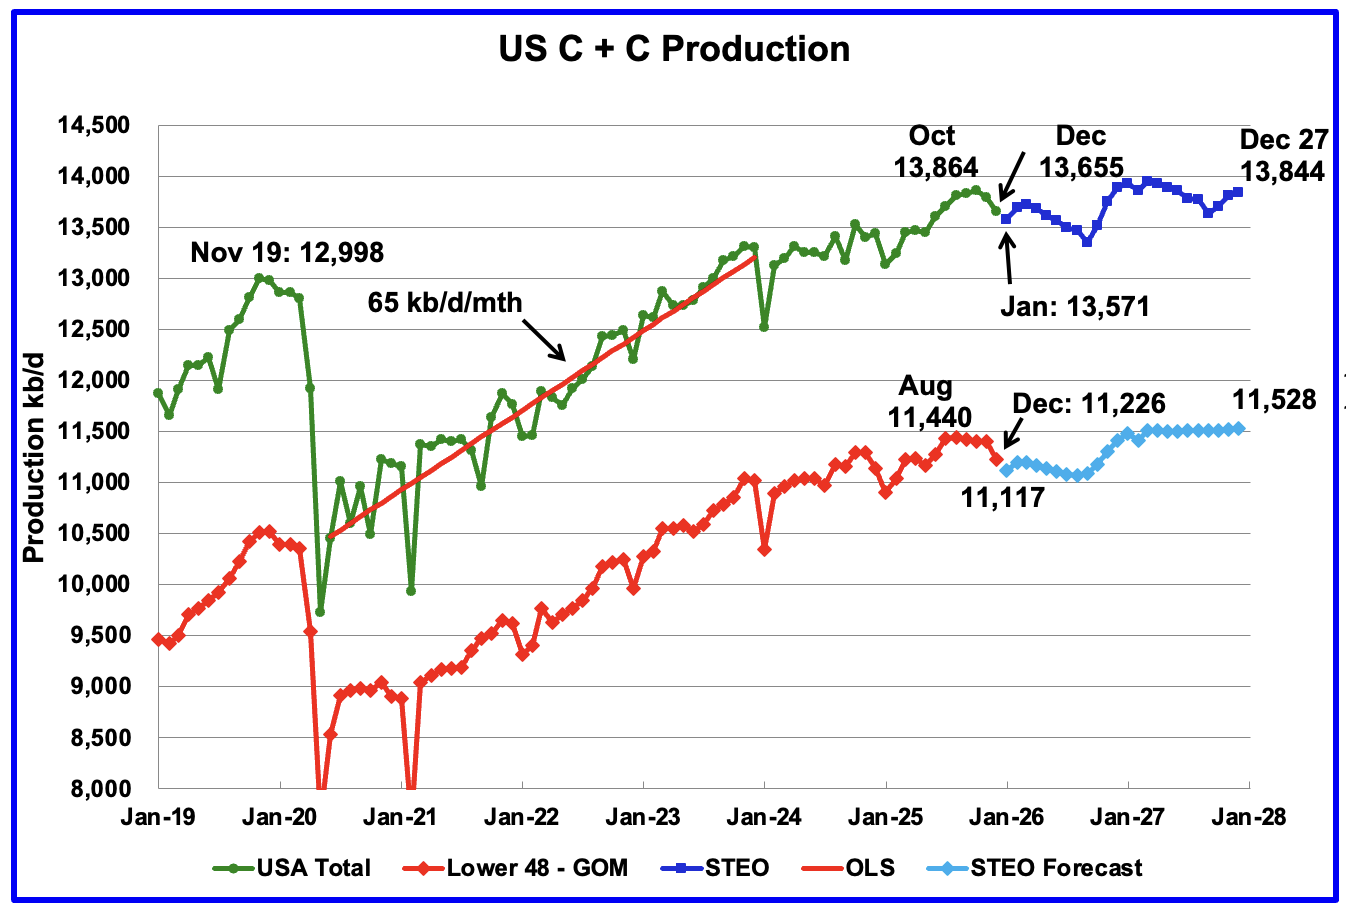
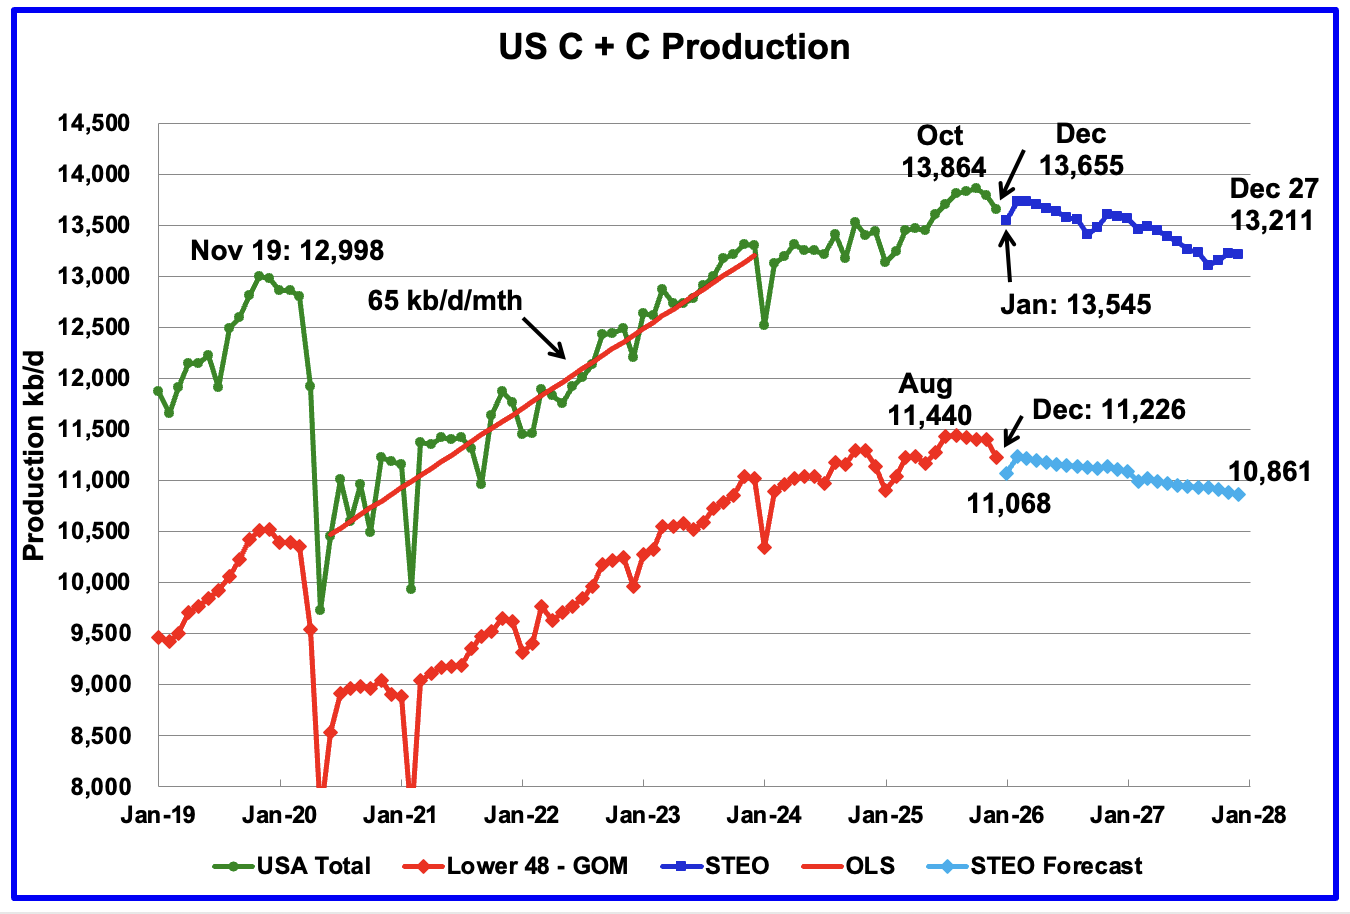
This US production chart up to December 2025 is the same as the one published last week in the US update. However the projected portions of the two production graphs have been updated according to the March 2026 STEO.
This is a case where a picture is worth a 1,000 words. Last week’s chart is posted above for comparison. US total production for December 2027 is expected to be 13,844 kb/d which is an upward revision of 633 kb/d from least week’s US report.
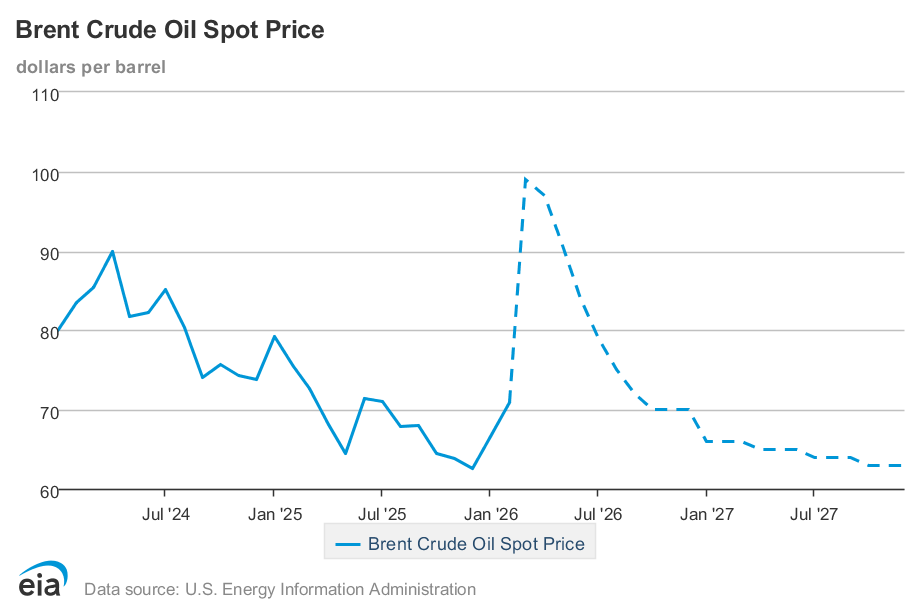
What happened/changed between the February and March STEO’s? Was a new field discovered? Were more oil rigs activated in the STEO model in late 2026? Were five mile wells developed and made operational in late 2026. Was there a significant price increase in WTI. See Brent price chart below which was posted by Dennis in the comments in the previous post. After the March 2026 price spike, the price returned to $62/b in December 2027, same as December 2025.
We will need to track the upcoming weekly rig counts and we will keep a close eye on them. The oil rig count started to increase two weeks ago.
U.S. January projected production is expected to drop to 13,571 kb/d. January’s drop to 13,545 kb/d reflects the severe storms that hit the mid US and the Permian basin.
216 responses to “November World Oil Production Slides”
Here is my lay person’s retrospective on “peak oil.” It was finished before the current war, so I’m sure it seems a little quaint already. I’ve tried simply to be even-handed and detached in my approach to the failed predictions of PO. Thank you for the permission for charts, POB and Mr. Mushalik.
https://3quarksdaily.com/3quarksdaily/2026/03/world-oil-production-has-surpassed-another-peak-alls-good-no.html
Thanks Mike, very nice work.
Here is a shock model I did for World C+C in November 2025, my best guess at that point in time. Future extraction rates and discoveries are not known, so this is likely (or certain) to be incorrect. The scenario has a plateau in World C+C output between 85.1 and 85.8 Mb/d from 2026 to 2032.
See chart linked below.
shock2511c
Ovi, I take it that the huge dip in oil production prediction is March 2026. And it shows oil production rebounded in April. That means the war will be over later this month.
I really don’t think so. Perhaps the EIA felt that if they did not predict that oil production would increase, Trump would fire them.
Also, the decline they show for March is approximately 9%, then declining in percent each month after that. That seems overly optimistic. Is the EIA getting political with their predictions?
Ron
Yes that big dip is March. I don’t think the rise in April, May or June says anything about the war. I think it is related to Saudi Arabia’s ability to shift its oil exports to their Red Sea port, which as best I recall can export around 5,000 kb/d. Not sure how much is used now and how long it will take to redirect the flows.
I would agree that the production estimates after July are questionable.
Hi there Ovi, thank you for the thorough work as usual. There isn’t a more useful source on petroleum production.
Regarding the war on Iran, you project a decline of 4 Mb/d this month, and an immediate rebound. Apparently you are only counting with Iran’s production being affected, and for a short time. We know now Saudi, Iraq, Kuwait and the UAE are also shutting in production. And after such destruction, Iran is unlikely to return to 4 Mb/d any time soon. In contrast, sanctions on Russia have been lifted, it will be able to move all that floating petroleum.
Not criticising, just would like to understand the rationale behind the projection. Best.
Luis, these are not Ovi’s predictions. That crime belongs to the EIA. Ovi just posts what the EIA predicts. And your guess is probably as good as his as to the EIA’s rationale in making these predictions.
Luis
Thanks, much appreciated.
Ron is partially correct in saying that these are not my predictions. The EIA predictions are for World Crude, the Blue graph. Dennis and I have developed a methodology to convert those crude numbers into C + C.
This is just wishcasting by people who are about to understand that material reality still exists.
Possible Answer to rising US oil Production in 2027
In the comments under the US Chart, I raise the question of what causes US production to begin to rise in late 2026 into 2027.
The headline in the attached article gives a possible answer. More gas pipelines out of the Permian.
US natgas prices at Waha Hub in Texas remain negative for record 25th day
“Longer-term, energy firms will likely boost Permian output when more gas pipes enter service as soaring oil prices from the Iran war encourage oil and associated gas production, and as gas demand rises to feed fast-growing U.S. liquefied natural gas (LNG) exports and to produce electricity for power-hungry data centers running artificial intelligence (AI) technologies.
Analysts have long said negative prices, which force some energy firms to pay others to take gas associated with their oil production, were a sure sign that the Permian region, which spans West Texas and eastern New Mexico, needs more gas pipes.
More pipes are on the way this year, but not soon enough to handle all the gas currently coming out of the ground.”
https://boereport.com/2026/03/12/us-natgas-prices-at-waha-hub-in-texas-remain-negative-for-record-25th-day/
Ovi.
In the STEO report they say:
“U.S. crude oil production
Higher crude oil prices lead to more U.S. crude oil production in our forecast. We expect crude oil production in the United States will average 13.6 million barrels per day (b/d) in 2026 and 13.8 million b/d in 2027. Our 2027 forecast is an upward revision of about 0.5 million b/d (4%) from last month’s Short-Term Energy Outlook (STEO). The West Texas Intermediate (WTI) crude oil price in our forecast is substantially higher than last month, averaging $74/b in 2026 and $61/b in 2027, compared with $53/b and $49/b, respectively, in the February STEO. ”
So basically their higher price forecast results in higher production for this month’s report compared to last month.
See page linked below
https://www.eia.gov/outlooks/steo/report/petro_prod.php
Dennis
I saw that comment but I could not square it with the price of WTI that they reported in the STEO tab 2. December 2025 $57.97/b. December 2027 $59.00/b. Negligible change. Seems like they are banking on the average price.
I recognized your quote from the STEO document. The link you attached did not get me the quote I was looking for but it did provide this gem that corresponds to the article I attached.
From your link:
“The higher prices support increased drilling activity across most basins, and expanded pipeline capacity in the Permian region allows more associated natural gas to be brought to market, further supporting oil-directed operations. We increased our forecast for crude oil production in the Permian region by 6% in 2027 as new pipeline capacity and price incentives support growth.”
Maybe the increase in gas pipeline exits may be the more critical factor.
I also asked Mike for his thoughts on the article and the STEO forecast.
He said: “For the Permian Basin to grow 633K BOPD by 2027, that is to say that the Permian Basin will actually have to increase tight oil production by 3.1 MM BOPD by 2027. That includes the annualized decline rate of existing Permian production that must be replaced, before growth of 633K BOPD can occur. ”
https://www.oilystuff.com/groups
Ovi,
I doubt the EIA STEO forecast is correct and agree with Mike that it is doubtful that the Permian will see a 600 kb/d increase, certainly not with the oil prices that have been forecast in the most recent STEO.
I agree more gas pipelines and higher gas prices at WAHA will help a bit, along with higher oil prices to increase profits in the Permian. The big question is whether producers believe the higher prices will be sustained. If we see a significant increase in horizontal oil rig counts in the Permian basin, then perhaps output increases a bit (maybe 100 kbo/d for Permian tight oil output by Dec 2026.) We will see. No increase in Permian horizontal rig count this week, producers may be taking a wait and see approach.
Thanks Ovi. I googled Saudi exports via the Red Sea and this is what I found:
Saudi Red Sea oil exports to hit record high in March, shipping data shows
Yanbu loadings rise to 2.2 million bpd, could reach 4 million bpd
Saudi used to export 6 million bpd via Hormuz
Production cuts spread across Middle East
LONDON/OSLO, March 10 (Reuters) – Saudi Arabia’s oil shipments via the Red Sea are on course to hit record highs in March although they are still far below the levels needed to compensate for the drop in flows from the Strait of Hormuz, shipping data showed on Tuesday.
The kingdom relies on the Red Sea port of Yanbu to help it boost exports to avert steep production cuts as its neighbours Iraq, Kuwait and the United Arab Emirates have already reduced output amid the U.S.-Israeli war with Iran.
Ron
Thanks.
So they are exporting 2.2 million barrels per day today and it sounds like exports will be rising.
The first chart above shows a production rise of 4 Mb/d by June.
Another Pipeline that Avoids the Strait
Wondering whether Iran might attack a Saudi pumping station.
https://www.youtube.com/watch?v=AjRdQ9Hudt8
Given the biggest oil shock of our lifetimes, do you think you could do a post that focuses on that? If not maybe just shut down the website at this point. Thanks!
A common argument against renewables is what is referred to by the German word Dunkelflaute — a prolonged period when the sun doesn’t shine and the wind doesn’t blow. Something similar happens to oil from time to time. The causes tend to be political instead of meteorlogical.
Maybe you can do the work got2surf.
Dennis, Ovi and Ron do this for free.
Not pushing a biased solar panel agenda because got2surf gets paid for that.
got2surf,
Feel free to write the post, send it to [email protected] and if it is worth publishing, it will be published. If you don’t like the site, don’t visit.
Here you go got2surf :
https://geoenergymath.com/2026/03/15/claude-code-oil-shock-model/
This took me a minute to create a Claude Code prompt, and then it brewed on a solution for 2 minutes.
I ran the resultant Python program from a terminal console and it created 3 nice plots that look reasonable (should check tho).
Give it a try.
Here’s a repo for the simulation software:
https://github.com/pukpr/OilShockModel
Two versions: One created by Copilot and one by Claude
https://makisw.substack.com/p/breaking-news-grok-admits-it-had?utm_source=post-email-title&publication_id=1385328&post_id=190801490&utm_campaign=email-post-title&isFreemail=true&r=1igaa&triedRedirect=true&utm_medium=email
AI “Hallicinates” and damages thousands of Cancer patients
FYI As of oil price today.
As of today, the price of Brent crude oil is $99.19 per barrel and the price of WTI crude oil is $95.49 per barrel.
As of 6 PM Eastern US time Brent futures at $104/b and WTI futures at $99/b.
Futures curve falls to less than $70/b by March 2031 and falls to less than $80/b by Feb 2027 (as of 6 PM eastern time US on March 13, 2026.)
“Iran is considering allowing a limited number of oil tankers to pass through the Strait of Hormuz, provided that the oil cargo is traded in Chinese yuan”
Trading in a currency doesn’t mean much. The oil importer uses dollars (or whatever) to buy yuan, uses it to buy oil, and the oil exporter sells the yuan for dollars (or whatever they want). The seller ends up with the currency they normally want, held in whatever bank they want. A little more bother and cost for the currency conversion. Not a big deal.
@Nick G
Many countries have swap agreements with China. So, allowing only tankers traded in Chinese Yuan is a direct thread to the petrodollar. Actually, a large number of decisions/actions taken/started by the current POTUS are leading to a decrease of the dollar as worldwide exchange currency. We see this accelerating quickly.
Meanwhile China is preparing the future with some sort of gold backed currency or similar. Remember which one it was until the early 1970s…
At 7 PM Eastern time, Trump announced a massive bombing of Kharg Island, although the oil infrastructure was not hit.
He declared that if Hormuz was not promptly ‘opened’, the next step would be complete destruction of the facilities.
I suppose we ‘all’ have been following recent events closely and may have varying perspectives on what is unfolding.
I strongly feel that we are on the cusp of the unfathomable as …
1. Iran will absolutely NOT acquiesce to Trump’s demands (even though selective passages will continue)
2. Should Iran’s oil infrastructure be damaged, I GUARANTEE that a large percentage – as in approaching 100% – of the region’s hydrocarbon producing/refining/transporting capabilities will come to an abrupt halt.
For a long, long time.
keerist
Coffee. Surely USA will not bomb the oil and gas infrastructure on Kharg Island. Huge economic AND environmental issues.
Yes.
This president is very well known to bluff, exaggerate and not follow through – it would be foolish of the Iranians to believe him. Even if they did, it’s very hard to imagine that Iran would acquiesce. And, very large damage to Iranian oil infrastructure will almost certainly cause the Iranians to do as much damage to their neighbors.
This president is astonishingly incompetent. Every time we think we’ve seen the worst of his incompetence, he tops himself.
The world is full of economists and military strategists who know that the Strait of Hormuz is important. I was discussing it 2-3 weeks ago on POB, just before this war started. And yet, somehow this president, his sycophant loyalist staff and the military that he and his secdef have molded didn’t know it.
Wow.
The US has confirmed that 2500 marines are in transit (by sea) from the far east to the middle east. The clear threat is that if Iran does not capitulate, the US will perform a sea born invasion of Tharg Island, and hold 90% of Iran’s oil exports to ransom, Venezuela style, presumably until the Iranian regime agrees to Trump’s commands, which I fully expect will involve very large oil redevelopment and repair contracts for US corporations at very favourable rates.
It seems clear to me that economic control of, and profit from the Iranian oil reserves was and is from day one the only US war aim of this special military operation.
With my political /theocratic hat on, I predict that any attempt to seize control of the island will
1. Cost a lot of US military lives
2. Face continuous drone and missile attacks from Iran
3. trigger Iran to attack ALL oil production/refinery or transport infrastructure within the range of their remaining missiles and drones
4. trigger global depression within weeks
and potentially
5. trigger collapse of the global financial system.
From this point on we are past economic peak oil as I see no way of re-instating the lost transit of oil out of the gulf region without major conflict and damage to the infrastructure. We are at risk of a major step down towards the post oil age of the human species.
Ralph,
Re ‘storming’ Kharg …
Military analysts would ask on what transports would the 2,500 jarheads embark/invade?
How fast do said transports travel?
Waterborne distance to be traversed?
As China/Russian/possibly Iranian satellites would be tracking every movement by this proposed expedition, how is the element of surprise to be effectuated?
Supplies of water/food/ammo to be delivered how to any surviving, landed Marines?
No, Ralph, your conclusions are, tragically, spot on in regards to likely directions in which this tragedy may continue to devolve.
A step-downwards of the escalation ladder goes nukes<desalination plants<power-electric plants<hydrocarbon infrastructure.
We are demonstrably on the verge of widespread destruction of oil/gas facilities which – as horrific as these ripple effects will be – are only a prelude to further degradation of the human condition … globally.
And yet, here we are.
Since the attack was completely unprovoked and Trump’s behavior is getting more and more erratic as he panics about the midterms and Epstein, “capitulating” would do Iran no good whatsoever.
You can’t rely on any promise he makes. Remember he ran on publishing the Epstein files, reducing fuel prices and no new wars. Recall how quickly he reneged on the trade deal with the EU.
There’s no point in giving in to Trump at all, because it just encourages him to demand more. He even humiliated the sycophants in his cabinet by making them wear clown shoes. Laughing at all his “jokes” and defending his lies in public just encourages him.
Defy him and he loses interest, as in Greenland and Canada.
Iran’s only sensible choice is to create as much pain for Trump as possible and wait till he decides on another hobby, maybe invading Cuba or something. It’s not a great strategy, but they don’t really have any other choice.
It seems to be working.. Trump is now claiming Iran wants to negotiate, but he doesn’t want to. This is an old trick of his. He once called the Washington Post calling himself “John Miller” and told them Madonna was “rabidly” chasing him, but that he had “zero interest”. He’s feeling the pain.
So I think the blockage of the Strait will last a month or two.
Alim, Iran basically said normality as it was pre-28 February for the strait is not coming back, so here we are. They’re going to be forced to relinquish it, or it stays in this state.
And there’s nothing stopping a few ballistics and drones hitting those fields outright if they have got go mediaeval.
Rig Report for the Week Ending March 13
The rig count drop that started in early April 2025 when 450 rigs were operating dropped this week. Drilling continues at a steady rate of 365 ± 5 rigs per week since August 2025 while WTI settled at $98.71/b today
– US Hz oil rigs dropped by 2 to 369, down 81 since April 2025 when it was 450. It was also up 7 rig from the low of 362 first reached in the week ending August 1. The rig count is down 18% since April 2025.
– New Mexico Permian was rose by 1 to 92. Eddy added 1 rig to 34 while Lea held steady 58.
– Texas dropped 1 to 169. Midland dropped 1 to 20 while Martin was unchanged at 23. There were minor changes in a few of the smaller oil producing counties
– Eagle Ford added 1 to 32.
– NG Hz rigs added 2 to 114.
A Rig
Thanks Ovi,
The key number for me is Permian Basin Horizontal rig count, no change. Brent (which is a better proxy for World oil prices than WTI) closed at about $104/b on Friday March 13.
Dennis
I also find it so amazing that NM has been very close to 92 rigs since October 2025.
Frac Spread Report for the Week Ending March 13
The frac spread count rose by 2 to 172. From one year ago, it is down by 40 spreads and is down by 43 since March 28.
A frac
World Oil Specialist on Supply Cut due to Strait Blockage
World supply cut by 11 Mb/d even after allowing for Saudi re-direct to Red Sea.
https://www.cnbc.com/video/2026/03/10/high-oil-prices-could-force-a-u-s-pivot-in-the-iran-war-says-energy-aspectsa-amrita-sen.html
Ovi,
Saudi can redirect about 5 Mb/d around Hormuz with the east west pipeline to the red sea. UAE can use its pipeline to redirect about 1.5 Mb/d around Hormuz. Combined this is 6.5 Mb/d of C+C, in 2025 the average level of OPEC C+C exports through Hormuz (excluding Iran) was about 13.3 Mb/d, so subtracting the 6.5 Mb/d of pipeline work arounds we have roughly 6.8 Mb/d of reduced exports through Hormuz. The IEA SPR release is about 3.3 Mb/d over 120 days, so the World remains short by 3.5 Mb/d (about 4% less than 2025 average output of 84 Mb/d for World C+C).
Dennis
Not quite sure why the average flow through the Strait in 2025 was so low compared to previous years. According to this chart the average passing through the straight has been closer to 14.2 Mb/d.
So using your figures and Q1-25, the world remains short by 4.4 Mb/d. That extra 0.9 Mb/d is significant increase when supplies are tight.
Trump is certainly changing his tune from “We won in the first Hour” to demanding help from Nato and China to open the strait. It’s becoming clearer every day T did not anticipate what would happen. His top General did.
https://finance.yahoo.com/news/trump-demands-help-other-countries-001639208.html
A Str
Hi Ovi,
See link below from IEA on C+C through Hormuz
https://www.iea.org/about/oil-security-and-emergency-response/strait-of-hormuz
All C+C is 15 Mb/d with 1.7 Mb/d from Iran, net of 13 .3 from nations that are not Iran. IEA says 3.5 to 5.5 Mb/d can avoid Hormuz using pipelines, so less than my 6.5 Mb/d estimate, if we assume 5.5 Mb/d we would have 7.8 Mb/d of oil taken off market, then subtract 3.3 Mb/d from SPR release (400 Mb over 120 days) and the World would be short by 4.4 Mb/d. Note also that output in 2025 may have been 2 Mb/d above demand fro crude, which would suggest only a 2.4 Mb/d deficit. Higher oil prices may hasten the transition to electric transport which may reduce demand in 2026 compared to 2025.
Dennis
Sounds like we agree. “The World would be short by 4.4 Mb/d”
“
Ovi,
I have read that Saudis can transport 5 Mb/d to Red Sea and UAE can move 1.5 Mb/d by pipeline to the sea south of Hormuz, if that is correct, the shortage is reduced to 3.4 Mb/d. If there was a surplus of output of 2 Mb/d in 2025 above demand for C+C the shortage is reduced to 1.4 Mb/d (if demand remains at 2025 level). There might also be increased output from Canada, Guyana, Brazil, and Argentina in response to higher crude oil prices and perhaps lower demand than 2025 also due to higher oil prices.
We will see, but the predictions of $150 to $200/b may not be accurate. Futures market expects $75/b for Brent by July 2027 (and under $80/b by Jan 2027). See link below and click on futures next to live price.
https://oilprice.com/futures/brent/
https://oilprice.com/Energy/Crude-Oil/Futures-Market-Misreads-the-Hormuz-Oil-Shock.html
Physical crude prices are much higher than futures market. Many analysts see crude oil reaching $150 to $200/bo.
See
https://oilprice.com/Latest-Energy-News/World-News/Banks-Hike-Oil-Price-Forecasts-and-Some-See-150-Crude.html
To keep this in perspective, nobody is going to bomb Kharg Island. It would create the mother of all environmental messes, bring about the wrath of the world, and serve no pragmatic purpose. That said, I do believe that the U.S. has to abide by the Pottery Barn rule. That means occupying Kharg Island, and, alas, probably also occupying Iran. I’m talking about a full-scale invasion.
We were assured by Israel and our U.S. experts that Iran was insistent upon producing a nuclear bomb, and also the ICBM’s to send nuclear devices to both Israel and the U.S. They kept chanting Death to Israel and Death to America. Well, somebody had to stop that. For decades, U.S. presidents have been saying, We can’t allow Iran to develop nuclear. No one did a thing. Until now. Stopping these tyrannical idiots is a massive service to all humanity.
The Iranian shoreline with the Persian Gulf is 600 miles. The Strait of Hormuz is a hundred miles long. There is another 500 miles of shoreline with the Gulf of Oman. That’s 1,100 miles of Iranian shoreline along the world’s most important waterway. If left to its own devices, lashing out, Iran could cause this to be a killing zone for years, and upset the world economy. So whether we like it or not, the U.S. is going to have to occupy and police Kharg Island and displace the Islamic Revolutionary Guard. Knowing how Mr. Trump operates, I imagine we’ll charge a toll for keeping the place operational.
Until the above is implemented, oil could very easily reach $200/barrel. Not because it’s that scarce but because it trades on a goofy inelastic commodities scale, and even a five-million bopd supply shortage would create chaos. If this happens, a global recession will follow.
Even hiding behind your cute little aliases, some of you lefty guys are showing your ass. I don’t have the faintest idea where some of you guys are from but you obviously hate America, and it has messed up your moral code. It’s up to Mr. Coyne whether or not you get to spew your hatred, but you’re going to have to live with the knowledge that you’re not worth much as a man.
Gerry, the US doesn’t have sufficient forces or popular support to occupy a nation of 90 million people.
Cheney and the neocons had 9/11 to build on. Donald doesn’t have a similar real life event to work from. His gas lighting doesn’t work against real adversaries.
Gerry,
It was this kind of behavior that created a nuclear threat in Iran: the US invaded Iran in 1953, destroyed a new, promising democracy and installed a dictator (the title was Shah). That bloody dictatorship lasted until 1979 when a newly radicalized country rejected that dictator and turned, as newly radicalized people often do, to a new bloody dictatorship.
Now we’ve probably lost Iran for another long period, probably at least 50 years, and if this president were to follow the insane advice that we find in your comment, we would probably have another Vietnam, Iraq and Afghanistan all rolled into one.
There is one rule for how to unite a country under its leadership, no matter how bad the leadership is: have an external enemy. Bush had an apparent external enemy after 911, and it allowed him to invade Afghanistan and Iraq. This president doesn’t have that.
On the other hand, the Iranian leadership has, in its lexicon, the mother of all external enemies, the Great Satan itself, making itself as evil as possible. What will happen? It will unite Iranians against the US.
And, what’s the lesson in this war? We’re not attacking countries that have nuclear weapons, like N. Korea. We’re not attacking Pakistan or India. We got LIbya to agree not to pursue nuclear weapons, and then…we attacked it. The US and Russia got Ukraine to give up nuclear weapons, and Russia promptly attacked it (and the US under this president hasn’t been helping Ukraine lately and even worse we just released Russia from oil sanctions). We’ve attacked Iran twice, and both of its next door neighbors Iraq and Afgahanistan. We negotiated an agreement with Iran to limit nuclear development, and then this president killed the treaty in his first term. Obviously, the lesson that this teaches is that the US is dangerous and can’t be trusted, and the solution for self-defense is to obtain nuclear weapons quickly and secretly.
Invading was a bad idea. It happened, in part, because process matters. This president doesn’t believe that – he thinks he can improvise his way through – but democratic process matters because it produces better decisions.
Ask yourself – if agreeing with your president means that you love America, and disagreeing means that you don’t, then…did you agree with everything Biden did, because he was your president?? When you disagreed, were you spewing hatred? Were you less of a man?
It’s not about being left or right, it’s about being in touch with reality.
Nick,
Agree it’s not left or right, but thinking differently, which may in fact be more realistically. Who else does this kind of math? The state of geology, geophysics, Earth sciences, even climate science is stuck in the stone age and the media doesn’t realize this.
Gerry,
We have bombed Kharg Island already.
See link below (hopefully not too left wing for you)
https://www.foxnews.com/politics/trump-says-u-s-obliterated-targets-strike-key-iranian-oil-hub
Old men shouldn’t decide what causes young men should die for.
We can let the Israeli’s invade Iran.
The people claiming that Iran was intent on pursuing a nuclear weapon are Trump’s real estate cronies, they are far from experts.
The Israeli’s should not be deciding US foreign policy in my view.
Just read through all comments. Seems you think any criticism of Trump should be considered hatred of America.
Trump makes very bad decisions and he should be called on it. Most Americans do not support this war, it was a dumb move in my view and is likely to make matters worse rather than better.
We have a son who still has over one year IRR left as an Army Reservist. A lot of IRR’s were called back into duty during The Global War on Terror.
So we are nervously watching this. He already served a 10 month deployment and his 6 years, just has the clock running on the 2 year IRR. He married and then left 3 months later on that deployment. He’s a police officer and a volunteer firefighter, living a life of service.
Please keep all of our military in your prayers during this difficult time of war.
Shallow sand,
I hope no US service members are killed or injured. Not getting involved in a war of choice would be a way to reduce this risk.
I hope Trump is smart enough not to choose a ground assault, but his choice of advisors has not been good in his second term, Hegseth in particular seems moronic.
Shallow Sand,
Your situation is exactly why everyone should have a vote, regardless of their age, education, etc.,: anyone who can be called to war, or who has loved ones who could be called, should have a voice in whether we go to war.
The US is not invading Iran. It would literally be the world’s biggest suicide pact if the Pentagon even tries.
Kleiber,
You’re assuming a rational commander in chief, advised by experienced and rational military advisers.
If that existed, this war wouldn’t have happened.
Let’s not forget another one of Andre’s brilliant predictions,
General Mad Dog Mattis ( Trump loved the name ) was Trump’s first Secretary of Defense.
Led a team, that predicted Peak Oil in 2015 and likely by 2018.
That predictiion was wrong, but appears sensible.
How did Trump interpret that information? Are we finding out now?
Venezuela and Khang Island?
What about child slave labor in the Congo for cobalt? No oil there!
Trump may be distracting from Epstein and Israel.
But he got his oil ideas from Mad Dog Mattis.
Mad Dog resigned. Said it was because of how Trump was managing long term Middle Eastern relationships.
Trump f****s everything up!!!
Given the British report today that confirms the Omani negotiations report, it is very likely that Witkoff and Kushner are in league with Israel and forced Trump to go down this route. Treasonous behaviour given it’s leading to the US getting kicked out of the ME and the petrodollar being at risk.
Let’s not forget that from 1992 conventional oil growth over a 16 year period was more than 2% each year (1.1 mbpd annually).
Something peculiar happened for the next decade. Growth was much less, only around 1/3 of the previous rate.
2015 thru 2018 marked the conventional crude peak, since then we have steadily lost 0.5 mbpd of conventional crude oil production each year.
We can expect the decline rate to accelerate, one might argue that it already has…
Dennis: “We have bombed Kharg Island already.”
Not the oil facility, which was the subject of the hysteria.
We merely took out the Kharg Island military implants, presumably so we can occupy the place.
Non-oil comment.
Gerry, Occupying the island doesn’t do anything without securing facilities on shore and a free flow of traffic through the straits.
Donald has said that Kharg was demolished. Now that might mean anything from a guy known to misrepresent the truth 24/7 but what it doesn’t do is bring stability to an already unstable situation.
. https://www.theguardian.com/world/2026/mar/16/oil-prices-rise-after-trump-claims-us-totally-demolished-irans-vital-kharg-island-export-hub
The US president claimed on Saturday that US strikes had “totally demolished” most of Kharg Island, telling NBC News that its military may hit site “a few more times just for fun”.
It’s time for the tired old folks carrying the last generation’s tired old dogma and thinking to fade away, and let the new people take over.
The idea that Israel is an ally, that Israel needs protection, or that Israel is anything but a vicious and lawless state that deserves what it gets is old thinking.
For people who know that war crimes are bad and perp’s need punishing, just where to set up the gallows to start hanging the Israeli leaders is the primary question.
We do all agree that war crimes are bad – right Gerry?
And before you blow a gasket talking about Iran’s ‘war crimes’, you should start closer to home, and with what everyone else is looking at, not some old 20th century crap you’re fixated on that the rest of the world has rightly moved on from.
If you think the USA can get a ship within a hundred miles of the gulf, you’re on drugs.
Gerry,
I was responding to what you wrote, that is “nobody is going to bomb Kharg Island”.
You are correct that the oil facilities were not bombed, though Trump has threatened to do so if his demands are not met. Hopefully he is bluffing, though Iran may call his bluff.
Does this military action help to extinguish the Iranian theocracy, and its ultimate goal of creating the United Islamic Republic across the Muslim world?
Doubtful- they have a firmly entrenched authoritarian power structure within Iran and will do anything it takes to hold its grasp over the country.
As I said before, it would take a massive ground invasion or a civil war to displace the regime of the Islamic republic of Iran. Neither scenario is likely, and neither would be guaranteed success. Both would likely degrade the capacity to export oil, nat gas, fertilizer, aluminum from all the Gulf countries for a very long time.
“Approximately one-third (roughly 30-33%) of the world’s seaborne fertilizer trade passes through the Strait of Hormuz”
Ironic that Trump has kicked mud in the face of a dozen countries that had long been reliable US military allies, acted as an arrogant bully on the world stage and imposed harsh tariffs on our ‘partners’,
and yet now pleads for their help to rectify a problem he created (warships to capture the Gulf waterway).
This irony is not lost on the citizens of world. Is it lost on the Americans who voted for Trump?
.
Yes. See Gerry, above.
Follwup comment- I think Trump is seriously considering sending in the Marines to take Kharg Island, as the only way to avoid being seen as a loser (his worst fear).
If he can’t force the IRI to comply, he can shut off their revenue source.
No doubt his circle is being tasked with coming up with the pros and cons.
“POLITICO poll taken last month found that 57 percent of Canadians would prefer their country depend on China instead of Trump’s America, [up from 19% prior to Trump presidency]”
God help the fools and children!
For the record, Iran is currently exporting as much or more oil than before any of this began. Iraq isn’t, nor is the UAE, Bahrain, Oman or Kuwait. The Saudis have diverted close to 5mbopd through their east-west pipeline to the Red Sea and Iraq is sending what they can through a pipe to Turkey. The UAE has a pipe to take their much-desired Murban crude to a loading port on the shore of Oman, well below Hormuz, but they’re afraid to use it right now. So while nobody else in the Gulf is exporting oil, Iranian exports have gone untouched. That speaks volumes for Mr. Trump’s intentions.
A massive array of pipes bring over two million barrels of oil from the (untouched) Iranian oil fields each day. These pipes dive into the Strait of Hormuz, travel on the floor of the Strait for about 15 miles, then emerge to fill a battery of storage tanks on Kharg Island. From there they supply several loading docks from an unusual jetty, which is both unique and fragile in the extreme. When built, it was also a brilliant piece of work, because the main channel of the Strait of Hormuz is 200-300 feet deep and needs no maintenance dredging. The jetty at Kharg Island in no way interferes with normal traffic in the Strait.
Also for the record, I use my true name, am a registered Republican, but am not a huge fan of Mr. Trump. I do not, for example, endorse his every move. But from what I understand, the mullahs that took charge of Iran some 47 years ago have created an incessant mantra: “Death to America.” Couple that with a dogged determination to create a nuclear weapon in facilities 60 feet in the ground and superlative ability at making missiles that travel further and further each year, and I can see where it might be best to destroy their evil endeavor before they succeed in their mission.
To wit, however, it would be sheer unadulterated craziness to destroy the Iranian oil facilities. The Iranian people, in general (at least the ones I’ve worked with), are good people who deserve prosperity. They are smart and make good partners. It’s the damn mullahs that destroyed the country of Iran. The young people have no jobs, no hope, no income. They are oppressed. I am almost never in favor of one country deciding another country’s leadership. However, we can’t have them trying to build a bomb to destroy America.
When this is all over, the 70-million Iranian people will need the income from this oil; it’s almost 60% of their GDP. The world will need their oil. Right now, a few radicals are throwing a temper tantrum. They will, by hook or by crook, be put out of commission. And the Strait of Hormuz will be reopened. And tankers will be able to load at the dock of their choosing. I strongly suspect an invasion will be necessary to ensure this. I sell oil and gas but I don’t want excessive prices. The world needs $80-$90 oil and $4-$5 NG. The inelastic trading platform for oil and gas is a joke, and manufactures these extreme prices by sheer algorithm action.
Gerry,
The idea that Iran wants to destroy the US with nuclear weapons is highly unrealistic. Here is a pretty good AI summary:
Iran’s “Death to America” (Marg bar Amrika) chant is a 1979 Islamic Revolution slogan, often understood as “Down with the USA,” aimed at ending U.S. hegemony rather than wishing death on individuals. It reflects deep resentment over the 1953 U.S.-backed coup, support for the Shah, decades of economic sanctions, and perceived interference in the region.
Key reasons for the rhetoric include:
Historical Grievances: The 1953 CIA-backed coup that overthrew Iran’s democratic leader to restore the Shah, followed by decades of support for his authoritarian regime.
The 1979 Revolution & Hostage Crisis: The revolution fundamentally defined itself as anti-imperialist, viewing the U.S. as the “Great Satan” interfering in Iran’s sovereignty.
Hostile Policies: Iran cites U.S. support for Iraq during the 1980s Iran-Iraq war, the 1988 shooting down of an Iranian passenger plane, and ongoing economic sanctions [12].
Regional Conflicts: The stance is reinforced by U.S. military presence in the Middle East and support for Israel, which Iran deems an existential threat [13, 16].
Political Identity: The ruling elite uses this rhetoric to maintain ideological unity and support its network of regional allies, although many citizens consider the chant outdated [15].
The chant is not directed at the American people but rather at American foreign policy and government leadership.
————————————-
The importance of the bullet point called Political Identity can’t be overstated: both the US and Israel are essential bogeymen/external enemies, which provide a reason for the current regimes existence. The problem here is that both the US and Israel have provided plenty of ammunition for this role. Sadly, this amunition was beginning to fade with time, and now this war provides infinitely larger support for it.
Like many of the projects of the current president, this war is deeply counterproductive.
Kharg Island and the Strait are 300 miles apart.
Gerry,
You are right, around 70% of Irans population weren’t even born when the 1979 revolution happened. They find it extremely hard to relate to a 7th Century ideological death cult. They have no future under this barbaric regime. They are cheering on the bombings which are weakening the regime piece by piece.
Irans regime is an oligarchy. A handful of families control most of the wealth and apart from lining their own pockets with luxurious assets worldwide, they fund terrorist organisations domestically and abroad, while the Iranian people struggle to make ends meet.
Trump did not want to go to war with Iran. He tried to avoid it as much as possible, but when the Iranian foreign minister Aragchi allegedly told Witkoff that Iran has 440kg of 60% enriched uranium, enough for 11 nuclear weapons, he realised there is no dealing with these spastics. Aragchi of course denied this, but anyone familiar with the regime knows this is something they would do, boasting and taunting.
Israel attacked shortly thereafter which got the U.S directly involved too.
Meanwhile what some of the “experts” here fail to mention is the Obama administration which gave Iran $1.7 billion, ( $400 million regimes money + $1.3 billion accrued interest ). Granted it was Iran’s money, but what do you think they used the money for ? Surely not for humanitarian purposes….
Granted regime change will be complicated, but i remain hopeful. Iran has a lot of potential for a bright future given the countries resources and young workforce given the demographics.
One thing that scares me is relationship between al-qaeda and IRGC. There seems to be evidence of cooperation throughout the years, and in Iranian channels there have been suggestions that the uranium has been smuggled out of the country through al-qaeda. I hope it is just rumours. I believe U.S will send commandos into Iran looking for this uranium at some point.
Finally, Russia is benefiting the most from this war at the moment. They would love this to drag out as long as possible.
“ Never,” Robert Pape, a political scientist at the University of Chicago who studies air power and regime change, replied when I asked whether what Washington was doing in Iran had succeeded elsewhere. “Bombings have never led people to take to the streets and topple their leader.”
There are two main reasons why air power has such a terrible record. The first, Pape said, is because bombings often prompt citizens to turn against the domestic opposition — no matter how much they hate the leader. “Even the hint that you are siding with the attacking state is used by rivals to stab you in the back,” he told me. To understand why, he asked liberals to consider how Americans might respond if Iran killed Trump and then encouraged the Democratic Party’s supporters to seize power; conservatives might imagine what would have happened if Iran did the same to Barack Obama. Just because you don’t like your country’s leaders, it doesn’t mean that you want to side with an external enemy who deposes them. The second reason is that bombings by themselves rarely fully decimate a government’s repressive capacity. “In order to save the pro-democracy protesters, you’ve got to be right there,” Pape told me. “You have to have troops on the ground.”
https://www.politico.com/news/magazine/2026/03/01/iran-uprising-trump-khamenei-regime-change-00806179
Gerry,
You said this, “And the Strait of Hormuz will be reopened. And tankers will be able to load at the dock of their choosing. I strongly suspect an invasion will be necessary to ensure this.”
The opening of the Straits of Hormuz would indeed be a good thing for the Global Economy.
However, it seems that the Iranian Ruling Party & the IRGC have implemented what is a Four-Tier Level of Ship flow through the Straits.
In a nutshell, there are those countries that they label as ALLIES of IRAN can have passage through the Straits, while those countries that are not their enemies and ask permission to cross are allowed to cross.
Those who cross without permission have been attacked with Drones, etc.
This is why we are seeing some traffic currently moving through the Straits of Hormuz. Thus, some believe Iran is losing control as ships are making it through the Straits.
Those Iran and IRGC see as enemies will not be allowed to cross the Straits.
So, it will be interesting to see how the U.S. Military is able to use its force to open the Straits, which would be a good thing for the USA and the global economy.
steve
Oil flow from straight of Hormuz
Hormuz
Interesting perspective on Oil prices
https://oilprice.com/Energy/Energy-General/The-Global-Campaign-to-Control-Oil-Prices.html
@ Hickory & DC
FYI
This is an excellent piece on cascading global risks from closure of the strait with a focus on economics and industry.
https://open.substack.com/pub/ctindale/p/systemic-risk-a-12-order-cascading?utm_campaign=post&utm_medium=web
Thank you. Its a good write-up.
The Gulf nations import roughly 70% of the their food through the Gulf maritime route too.
One interesting aspect of this war is that Iran seems to have damaged or destroyed five TPY-2 radar components of American THAAD missile defense systems.
It’s not clear (to me anyway) how many exist worldwide, but maybe 10-15. There were 13 in May 2025.
The manufacturer, Raytheon, can’t import anything from China, as it is is classified as “unreliable” by the Chinese government. This is part of Trump’s trade deal with China, which allows some, but not all, rare earth imports. The devices use gallium nitride chips, and China has a near monopoly on gallium.
It’s also worth mentioning that the radar system alone is said to cost $300,000,000 , and they were knocked out by drones that costs maybe $30,000.
The US and China squabbled about the installation of a THAAD system in South Korea a few years ago, but that system is being partially dismantled and shipped to the Middle East now.
All this is just stuff I read on the internet, I’m not an expert, so feel free to fact check me. But it does suggest that asymmetric warfare based on cheap smart(ish) drones may disrupt modern warfare assumptions outside of Ukraine.
I’ve read an analysis that suggested that the Iranian drones cost only about $4,000 to build.
The AN/FPS-132 costs over a billion, and as there were fewer than a dozen THAAD batteries, it’s kinda academic anyway. They can’t get the rare earths from China for rebuilding, and they’re not rebuilding them in an active warzone and the missile defence dream since Star Wars under Reagan has been, once again, shown to be smoke and mirrors for MIC grift.
This played out in Ukraine, and it was ignored. It is now playing out with Iran, and we are seeing that cheap, mass produced and reliable weapons from a country with industrial capacity will outcompete whatever wunderwaffen the other side has.
If anyone in the West in power still has a functioning brain cell, they will be cutting the private sector capitalists out and renationalising defence and focusing on things that aren’t artisanal superweapons that mean you lose one unit and your forces are combat ineffective or they only have so many munitions or maintenance time for a week of operations tops.
This shit was evident in 2002 with the Millennium Challenge. Col. Van Riper was 100% vindicated.
BLOOMBERG: The Biggest Oil Risk Is at the Bottom of the Barrel
March 15, 2026 at 12:00 AM PDT
Updated on March 16, 2026 at 12:32 AM PDT
By Javier Blas
Fuel oil is now an ultra-expensive commodity due to the Iran war, which is bad news for the global economy.
The shipping industry is sounding the alarm as some key ports may run dry, forcing ships to halt, with fuel-oil supply very low in locations such as Singapore and Fujairah.
The traditional relationship between crude and fuel oil is broken, with fuel oil prices much higher than expected, trading at $140 a barrel in Singapore and nearly $160 in Fujairah.
https://www.bloomberg.com/opinion/articles/2026-03-15/iran-war-the-biggest-oil-risk-is-at-the-bottom-of-the-barrel
————————–
With Singapore, the world’s largest bunker fuel port, handling 55 million tons per year, and Rotterdam, a distant second at 10 million tons per year, the situation for tankers and container ships will become more problematic as the Middle East War continues.
steve
Oil is cheap and flagrantly wasted. Wild swings in the price have cause severe economic pain four times in my life time that I can remember. This is the fifth.
The real problem is short sighted investment that ignores the inevitability of the next crisis. Europe and Japan have done a little better than most. High fuel taxes discourage waste, so price swings are proportionally less significant.
The world is facing a similar crisis to the one the Germans faced in 1916, when the British torched the Romanian oil fields. how long will it take for people to figure this out?
Alimbiquated,
Such a good question. I’ve been reading a pretty good book on that: The Collective Edge, by Colin Fisher. He argues that people generally follow their group’s ideas, and some people are unlucky about what group they’re born into, and they’re in a group with ideas that are…unrealistic, counterproductive.
Currently we have groups that are tied to old religions, to old industries, to obsolete ideas and practices. They’re being manipulated by powerful interest groups – oil, etc., and corporate media. They believe what they’re told.
How do we break the spell of group identification? I don’t know – I’ve had family members killed by their beliefs. They knew it too, but they thought their beliefs were more important than the obvious and and looming risk of dying.
How do you break through beliefs that strong??
And while I’m on a rant, note that Chinese battery makers are betting big on sodium based batteries, because they might not be able to get there hands on lithium.
https://www.reuters.com/sustainability/climate-energy/china-battery-makers-bet-big-sodium-move-away-critical-minerals–ecmii-2026-03-16/
Thinking ahead.
If you buy a gas guzzler on the assumption that fuel will always be dirt cheap, you’re up a creek without a canoe when the price spikes.
Interesting opinion on Iran war
https://www.middleeasteye.net/news/us-israeli-war-iran-founded-two-huge-miscalculations
As of this posting (9:40 AM EDT), the IRGC just announced an evacuation warning for oil/gas production facilities in KSA, Qatar, and the UAE.
This in response to the attack a few hours ago on their South Pars facilities.
While Hormuz blockage is – theoretically – reversible in hours, infrastructure destruction will cause years’ long diminishment of hydrocarbon availability.
The escalation ladder is being implemented this very moment.
Coffee. Any thoughts on why USA/Israel would strike South Pars infrastructure?
Shallow,
I strive to avoid speculation in general and purposefully/strenuously steer clear of online politically tinged discourse.
That said, in respect to all the years of our interacting on this site …
It should be clear that Israel and Iran (the current regime) are locked in an existential struggle. (Reports are that it was the Israelis that attacked both the Tehran oil facilities and now South Pars. Verification in these matters is always tenuous, at best.)
As a life long, serious student of military conflicts throughout history, my ‘take’ is that – absent some near-divine intervention – both of these entities (Israel/Iran) will plunge onwards towards ever expanding kinetic action until it becomes physically impossible to continue.
Use your imagination as to the scenarios implicated by that statement.
My sincere best wishes to you, Shallow, your family and especially your son.
Goes for all of us, actually.
In addition to the South Pars infrastructure being attacked, the nearby Asaluyeh processing plant was also targeted.
Depending upon the extent of the damage, ~75% of Iran’s natgas supply could be offline.
As ~80% of Iran’s electricity generation is from natgas, regional blackouts seem imminent.
Since the IRGC has declared on an ongoing basis that they will respond to attacks in a reciprocal fashion, we could see the ‘unfathomable’ consequences that I highlighted earlier manifest shortly.
Coffee. Thanks. Praying a lot.
I won’t attempt to rationalize any particular action of the war participants, or to justify the existence of any country in the world.
But I will point out a few critical differences in motivations, as an outside observer. Keep in mind that participation in conflict (kinetic or otherwise) is always an existential threat for any particular regime, as are its policies in regard to domestic economic performance. That applies to all governments, even the most authoritarian ones to some degree.
-For Iran, the 47 year Israel destruction project is entirely an optional fundamentalist project, a keystone of the larger plan. This long war is not an existential threat to the integrity of Iran, rather just its government as it now exists. The exception to this is the slight chance of country fragmentation in a severe civil war scenario. Very slight…probably less than most countries considering the geography and very very long history.
-For Israel this long conflict is an existential threat to the current government, but also to the existence of the actual country and population. If one doesn’t understand this, and the very long specific cultural history of living under severe duress, then it will be hard to understand the deep seated sense of desperation that underlies the behavior of that nation and all of its people.
With those motivations/distinctions in mind, don’t be surprised by any act by of the actions of both Israel and Iran. The Iranian regime won’t rest/relent until their project of Israel erasure from the maps is complete. This is intense fundamentalist religious fervor in action, with a huge collective ego stake in the project. And for Israel, the whole of Israel society will struggle to the end to survive. To the very end if that’s what it takes. They will return the favor of attempting to destabilize the Iranian regime, just as the regime has been working to destabilize the nation of Israel for the past 47 years.
The motivations of the rest of the world in this are a very mixed bag. Most simply want stability, and an economic sense of fair play.
Hickory,
I think you might be underestimating the importance of Israel as a convenient external propaganda enemy, used to prop up the legitimacy of the unelected regimes in the ME, including Iran.
I think it’s also possible to forget just how much Netanyahu has been fighting for his political life, and how convenient foreign wars are to someone in that position..
And, of course, the same logic applies to the US president.
Dennis – Please let me know where your models are pointing…mine suggest near-term delcline rates of 7% for around 5 years, then tappering to ~4-5% annually…This would put world production at half of current level in 2040…steep decline will be from the unconventional resources…
Kengeo,
See chart at comment linked below
https://peakoilbarrel.com/november-world-oil-production-slides/#comment-795505
or direct link to chart below
https://peakoilbarrel.com/wp-content/uploads/2026/03/shock2511c.gif
Note that this model is from November 2025, before Feb 2026 US/Israeli attack on Iran.
That will be another oil shock which will reduce World output of C+C for some unknown period of time. Perhaps it will be similar to the 1980s shock due to the last major war in Iran.
Brent futures contract for May 2026 at about $110/bo as of 6 PM US eastern time on March 18.
It occurs to me that the earth is a little overpopulated with fire-apes.
In fact, I think the whole ape thing was/is a wrong wrong wrong turn.
+1
Human civilization has just tipped over the Seneca Cliff.
We will be fighting over the scraps all the way down from here
https://www.youtube.com/watch?v=X_gI1zTYGp8
Gentlemen it is upon us.
My god, I don’t know how this can continue:
https://rayonegro.substack.com/p/la-mayor-crisis-de-la-historia
https://market-ticker.org/akcs-www?post=255104
Another perspective.
Trump must ban all exports now.
For what it’s worth, bold mine:
Peak Gas
Peak gas is the point in time when the maximum global natural gas (fossil gas) production rate will be reached, after which the rate of production will enter its terminal decline.[1] Although demand is peaking in the United States[2] and Europe,[3] it continues to rise globally due to consumers in Asia,[4] especially China.[5][6] Natural gas derived from fossil fuels is a non-renewable energy source that produces significant greenhouse gas emissions.
Natural gas is expected to peak after other fossil fuels.[7] One forecast is for natural gas demand to peak in 2035.
The concept of peak gas follows from Hubbert peak theory, which is most commonly associated with peak oil. Hubbert saw gas, coal and oil as natural resources, each of which would peak in production and eventually run out for a region, a country, or the world.
And Hubbert thought we should pursue solar as a replacement.
Nick —
Solar is now the largest supplier of electricity in Texas, so that is happening.
https://www.reuters.com/sustainability/climate-energy/texas-makes-clean-power-breakthrough-solar-output-overtakes-coal-2025-12-09/
Calm. The Strait of Hormuz will be open soon. It is telling that Iran is the only Gulf country that has been exporting oil right through the conflict. We could hit Kharg Island at any time, and yet it hasn’t been done—due to the explicit orders of President Trump. Warthogs are taking out the remaining Iranian mining vessels. Bank accounts have been frozen. The regime is in tatters, and the smart survivors will be defecting soon. This has come nowhere close to pushing us over the Seneca Cliff. Hell, the price of WTI has fallen like a stone today—does that look like the end of the world? So far this has taken less than three weeks and an awful nuclear threat has been eliminated. We should see WTI of $75 by this time next week (which is too low for long term viability, but ho-hum). LNG prices may remain high because the Iranians did some serious damage to their Arab neighbor, Qatar. I would imagine that, once they’ve had time to think it through, many countries will come forward to see to a welcoming, wide-open Strait of Hormuz. All in all, this has been a very well executed military operation. I continue to be dismayed to read the posts of so many lefties on this site. That economist/activist who singlehandedly kept Austin weird has no sense and no purpose. What do you lefties find so attractive about a peak oil blog? Writing enthusiastically about hunger for all? Going helplessly over some imaginary Seneca Cliff? Holy smokes, boys, enjoy the day, and then tomorrow, and the next day. This has become a blog of nervous nellies and soothsayers, lifting their skirts and twisting their prayer beads. Have a bit of optimism! The U.S. and Israel are leaving the Iranians a way to make a good living once the fighting is over, and once again, they can prosper and move about the world in freedom. What we are witnessing here, in real time, is a rearranging of the Middle East geopolitics for a better future. Rejoice.
Gerry wrote: We should see WTI of $75 by this time next week (which is too low for long term viability, but ho-hum).
Nope, it ain’t gonna happen. This war is a horrible mistake and will cause many thousands of innocent lives before it is over. Over one hundred elementary school girls were killed by one bomb.
The ONLY people who will benefit from this war are oil producers. They are all now happier than a pig in a mud wallower. But we, not just Americans, but everyone on earth will now have to pay higher prices for everything.
Don’t be happy because of Trump’s huge mistake. It will cost you dearly. Well, that is unless you are an oil producer.
Dr. Maddox; from your social media experiences in the past I know you are a doctor of internal medicine; from my personal communications with you in the past I know you to be a sophisticated mineral owner AND, most importantly, a working interest owner in countless oil and gas wells throughout the country, from the Bakken down to Texas. In other words, you place your money where your mouth is. and understand well economics very well. In further words, you know more about oil and gas than any internet expert on this forum. Everybody. Pretty much combined.
But you are making the same mistake hundreds of others before you have made and that is to buck the liberal politics this forum is all about, that Ron Patterson created years ago and passed down to hand picked others.
This is a place of incognito, angry, bitter people who hate America, want desperately for it to fail….so they can tell future people that have entered the country illegally, that are sucking it dry of money, and morality, they told you so.
I have not looked in on this shit hole for two months, I just did, whoa Nellie.
Liberals here are not interested in your oil and natural gas experience, the title of the forum is misleading; they dislike what you have to say, they are trying to control the content of blog, to make it only about their sick way of thinking… they would like you gone.
My father use to say about dog turds; the more you kick them, the more they stink.
You are a brave man, sir, and I appreciate you.
Dr. Maddoux, I sure hope you are correct in your views.
I honestly don’t know how this is going to turn out.
What things make you think this won’t be another long-term occupation in the Middle East?
If it isn’t, and we leave fairly quickly without killing all of the Iranian regime (reportedly over 1 million people) why won’t they just come back out of the woodwork and go after Israel and their Gulf neighbors? Seems like they have been doing that since 1979. They have long freaking memories. Heck, they still hate the Brits as much as us because of the 1953 coup, even though none of the fighters were alive then.
I do agree the WTI market thinks this thing will be over soon. Middle Eastern grades are trading as high as $170. I don’t pretend to understand oil trading. But it seems to me maybe the people trading those Middle Eastern grades might be a little closer to the situation on the ground than the WTI traders? I could be dead wrong on that?
In any event, I’m praying for no boots on the ground and that you are right, that this will be over soon with no US military return (because of things going to hell when we leave.)
As for the right and left stuff, I think we make a huge mistake when we let ourselves get sucked into that. I have to deal with people from all walks of life in my job, and I don’t give a crap about that. I’m going to engage with them regardless.
Personnally I don’t see any contradiction in realizing that this war on the IRGC is, -once it is over-, on the middle/long term :
– good for the Iranian people
– good the overall world C+C production
– good for Israel security
– good for the middle east security
– good for the US and Western oil majors in general
– good for the Iranian economy
– good for western (Israel included) economies
– good for the overall strategic advantage of the US towards China (Carter doctrine 2.0)
But at the same time, the overall “peak oil background” remains what it is (a kind of atrocious banality), and on this subject, having an honest look at the associated oil history, would perhaps rings some bells. Typically realizing that the first oil shock structural cause was first and foremost the US 1970 conventional peak, and the “arab embargo” narrative a great opportunity to “put the blame on the Arabs” (but also for the GCC countries a great opportunity to say “we have done something for the “palestinians””
Overall a major wake up call almost totally missed.
Reminder :
US production and imports around 1970 :
https://iiscn.wordpress.com/wp-content/uploads/2026/03/us_oil_production_and_imports_1920_to_2005-1.jpeg
US production up to now :
https://iiscn.wordpress.com/wp-content/uploads/2026/03/us-oil.jpg
I read somewhere the eia is targeting US tight oil “peaking” or “plateau-ing” in 2027 or 2028, is that correct ? (have to re check)
Note : trying to put two pictures, not sure how to do it, replaced by links
us oil
Some years ago, I was walking with my dog through a wood, and there we met a neighbour armed with a shotgun, a very fine expensive shotgun. He was a wealthy executive and entirely a man of the town, not a countryman, and no understanding of nature, country life, farming, or hunting. But we greeted each other civilly and then he annonced that there was a hornets’ nest further along the path and that he intended to destroy it by blast iting with the shotgun. I looked down at my dog who looked back up at me, and both of us recognising a madman when we saw one. Quickly, I bade goodbye to the lunatic and wI and the dog got out of the vicinity double quick. A couple of seconds later there was a loud BLAMM BLAMM sound as the shotgun was fired, and then a prolonged AAARRRGHGHGH yell/scream whatever. It’s not hard to imagine the effect of discharging a shotgun into a hornets’ nest. And it’s not hard to imagine the effect of the stings of a hundred or more surviving hornets on a crazy fool’s face. Doubtless the queen hornet died, but what of so many of the other sting equipped terrors ……..? I hadn’t thought of this incident for many years until President Trump decided to unleash thye most powerful best equipped formidable fleet of the USN on Iran.
Brent at about $112/b at 4 PM eastern US on 3/20/2026. Kuwait export blend at $153/b 24 hours ago.
See
https://oilprice.com/oil-price-charts/
Dr. Maddoux,
I hope you are correct, but hope is not much of a strategy.
Can you cite an example of where air power has succeeded with no ground troops?
Do you support a ground invasion of Iran by US troops?
I think that would be a mistake.
If the GCC and/or Israel thinks the Iranian regime should be removed, , they can send their troops to do the job.
Gerry maddoux is presenting a supply side view of the war. If you make money selling oil you don’t mind price spikes, because they bring more profit in the short term.
Oil men have had this level of disinterest in the pain caused by swings in oil supply because they are confident that their customers are locked in — there is no replacement for oil.
But that level of detachment for the customer is dangerous in times of rapidly changing technology. the economic damage this war has caused has been immense, and it will increase pressure to reduce oil dependency.
https://archive.md/mK4YZ
This is the lesson one of the world’s leading oil men, Putin, is learning the hard way. The urgency to replace gas with wind and solar and oil-burning cars with Chinese EVs has never been greater.
The remark “All in all, this has been a very well executed military operation” ignores von Clausewitz’s dictum that war is “merely an extension of policy by other means”. Like the claim that the US never lost a battle in the Vietnam war, your claim about execution is irrelevant.
With the Pentagon requesting $200 bn more to fund the war, it hardly seems clear that its political goals have been met. In particular, there is no sign at all that this or the previous two wars Republicans wasted billions on in the Gulf will significantly “rearrange” the politics of the region.
Also it is far from clear that the US can open the Straits of Hormuz. The US Navy has referred to it as a “kill box” and no other countries have shown any willingness to provide support.
The main result seems to be that the US is running out of allies, and the oil industry is seen as less reliable than ever. So oil traders like yourself stand to make some money in the short term, but that may matter less than you think.
I don’t see this discussion as a left/right discussion at all. In fact, non-interventionism is a classic bit of American right wing ideology, and one of the things Trump himself ran on.
Comparing this war to Irak, Lybia or other isn’t right, the Iranian people are truly tired of this regime, there has been at least 3 or 4 uprising periods in the last 15 years, to me it can be compared to the liberation of France from Nazi occupation, some resistance small cells are already forming in iran.
And Iran is really specific in the region : old country, got some form of independence quite early in the Islamic period (around 850), never was part of the Ottoman Empire, didn’t get its frontiers defined by Sykes Picot, already had a form of democratic government through a parliementary monarchy, and perhaps more importantly is far from having only Islam in its “cultural landscape and nation memory”.
Maybe I’m wrong, but I’m quite confident that the people of Iran will be truly instrumental in liberating the country from these Mullahs mafia.
(and I also get that from Iranian friends/acquaintances)
Note : you didn’t make that comparison in your message, but maybe a remark on the overall tone of the comments on this thread.
I see on this thread that “a very well executed military operation” has led to the elimination of an “awful nuclear threat”.
Phew, that’s a relief! Somebody ought to tell the IAEA.
Politics aside, I wonder if Dennis and Ovi could use their knowledge of world inventories to track the war’s impact on oil and gas production, to project the same into the future, and to periodically compare their inventory work to what the EIA will be publishing about world inventories.
Most of the world press, and certainly the markets, have given a shrug and yawn to the oil and gas impacts. But to my pea-sized brain it seems we’ve already lost 200 million barrels of oil–and probably another few hundred million in the future, even under the best-case scenario. Perhaps of more concern, Ras Laffan appears to be significantly offline for 3 to 5 YEARS!?! Those are some big numbers. Would like to see Dennis and Ovi help us better understand them.
PAOil,
Unfortunately the data I have on inventories comes from OPEC and the EIA, there is a huge amount of inventory (non-OECD) that is difficult to track as there is very limited data availability. Maybe Ovi has better insight into this.
The short answer is that oil inventories are difficult to track and I do not have much insight.
Paoil,
Using most recent EIA STEO, I get the following for World Oil Inventories for days of forward suppy. I assume days of forward supply are 90 days at the end of 1998.
See chart at link below.
world oil inventory
Heard Paul Sankey (veteran energy trader) say there have been very large volumes of WTI and Brent contracts (50-100 million barrels) coming through JP Morgan’s trading arm. Inferred US Treasury is intervening.
Last week Doug Burgum was asked about this and was pretty tight lipped. I know Bessent has denied it.
I know almost nothing about oil trading. My limited involvement was buying floors (puts) back in the early 2000’s when my brother and I bought several leases. We never got any $ from them because oil kept going up. They were cheap back then. Around $1 per barrel.
I get energy hedging quotes from Cargill emailed to me. I haven’t paid any attention. I’ll look at them and let you all know what they are, if interested.
As Treasury has at least discussed intervention, I’d appreciate anyone who knows more about energy trading discussing this.
Full disclosure, I have no idea how that would come down. I do think that would be dangerous during a time of tight supply, as it would discourage more production. One of the reasons I’ve been disappointed in President Trump. He wants oil prices that are way too low to encourage enough investment.
This mornings quotes for WTI puts include:
$80 balance of 2026 – $6.87 per barrel.
$60 2027 – $6.63 per barrel.
Still extremely expensive to buy puts.
I assume most are hedging using swaps or collars. We never did that because the margin was just too much for a small producer like us if WTI really spiked.
I would be scared to death right now entering into an $82 swap for calendar 2026. The margin would be huge. Plus, if we had a storm that knocked a lot of our barrels offline and oil spiked, we’d be in huge trouble.
We had a tornado in 2023. It took out the transformers on our second best lease. It took almost 2 months to have them replaced. Oil wells were at the bottom of electrical repair priority as a lot of residential had been destroyed by the tornado.
Sorry guys, but I was a little snockere when I made that post last night. But nevertheless, I meant every word of it. I should have just said it more nicely.
This war is a disaster and destroying America as well as a lot of other places. Hundreds of innocent people are already dead and very soon it will be many thousands. Billions of dollars of property and petroleum infrastructure is being destroyed. All because one man thought it will help him politically.
Every republican in Washington, including Trump, now realizes what a huge mistake it was. But most of them cannot admit it. But they ALL wish they could tke it back.
I am angry at Trump, Damn angry. That is why I wrote what I did. Everyone on earth will suffer because of his very stupid mistake.
And it pisses me off when people say I hate America. I hate no nation and no person. I love everyone. Yes, I let my mouth run off once in a while, but that is because I see so many mistakes being made that will cause so much suffering, so much death to poor innocent people. All those poor school girls that Trump killed were all innocent. They will not be the last children to die because of Trump’s horrible mistake.
I love everyone, even those who make horrible mistakes. They are all brainwashed and cannot help their hatred of other people.
I love you all.
Ron Patterson
Physical market diverging from the paper market according Jeffrey Currie.
https://www.youtube.com/watch?v=q4kWgtIplmA&t=1653s
Here is another view of the motivation for the war. It does not come from government channels so for this reason it is worth pondering about.
https://www.youtube.com/watch?v=fZorjJr4DpA
In addition, gold price diving because of shortage of dollars.
The head of the IEA, Fatih Birol, says the impact of the Gulf Energy infrastructure damage is being underestimated. He is saying will take 6 months to fully resume.
Considering how bearish the IEA has been (potentially for political reasons) prior to the Iran War, I find this noteworthy.
For me Fatih Birol remains the only guy that “saved his ass” from the 1998 IEA team :
https://www.lemonde.fr/blog/petrole/how-the-global-oil-watchdog-failed-its-mission/
or :
https://www.countercurrents.org/badal250510.htm
And the IEA became in the last 10 or 15 years (if not 20) some kind of an IPCC annex, effectively completely obfuscating its initial mission.
The annual WEO analysis done by Antonio Turiel (the oil crash, in Spanish but goes quite well through google translate) are really telling : each year finding a way to present the data that isn’t too alarming.
And I’m not a climate skeptic at all, but obviously for some reason, taking on the “CO2 battle” narrative is much easier than the atrociously mundane “oil finite reserves” and future production target realism perspective that somehow the IEA has more or less put on the side (“peak demand” and all that jazz) ..
Putin is very happy right now. Trump lifted sanctions on Russian Oil. Now Putin will have lots of money with which to continue the war. He will be able to kill a lot of Ukrainians with that extra money.
Washington pivot: Russian oil sanctions lifted amid Middle East energy crisis
The Trump administration has officially suspended sanctions on Russian oil as global energy markets reel from a total shutdown of the Strait of Hormuz. The policy shift follows the launch of “Operation Epic Fury” on February 28, a U.S. military campaign that killed Iranian Supreme Leader Khamenei and targeted key military infrastructure within the Islamic Republic.
Iran’s subsequent retaliatory strikes brought tanker traffic in the Middle East to a standstill, causing global oil prices to surge. In response, the U.S. Department of the Treasury issued a temporary 30-day waiver on Russian oil sanctions on March 5.
While the initial waiver was designed to allow Indian refineries to process Russian crude already in transit, the Treasury expanded the suspension on March 12 to include all nations through April 5.
Data from the tracking firm Kpler indicates that over 130 million barrels of Russian crude were at sea as of March 6. This surplus has become a critical lifeline as traditional Middle Eastern routes remain compromised.
Treasury Secretary Scott Bessent noted in a March 12 podcast that allowing Indian refineries to purchase this oil was an “inevitability,” describing it as a fast-acting source that would simultaneously limit the flow of crude to China. This marks a sharp reversal from January, when Bessent confirmed at the World Economic Forum that the U.S. had pressured India with 25% tariffs to halt Russian purchases.
One bumpy plateau.
Yemeni forces warn of Red Sea strikes targetting warships if US joins Israel against Iran
Last Updated: Mar 20, 2026, 10:17:00 AM IST
The Houthis have issued a stern warning that they will target American ships and warships in the Red Sea if the United States participates in any attack alongside Israel against Iran.
The warning highlights the escalating tensions in the region, reflecting Yemen’s long-standing opposition to Israeli and American policies in the Middle East, and signals potential military action in the strategic waters of the Red Sea should the United States intervene against Iran alongside Israel.
——————-
More possible fun in the Red Sea where oil tankers have been diverted to load oil via Saudi Arabia’s alternative pipeline.
Interestingly, the Houthis (Yemen) shot down 7 U.S. MQ-9 Reaper Drones ($30 million each) in 2025, while Iran has shot down 11 in just the past few weeks.
Iran is using its UAV 358 Rocket at an estimated cost of $100,000 to shoot down one U.S. MQ-9 Reaper Drone which costs over $30 million. According to Google Gemini’s AI, take it with a grain of salt, it takes about three Iranian 358 UAV rockets at $300,000 (Hit-Miss Ratio) to knockout on U.S. MQ-9 Reaper Drone at $30 million a pop.
Simple math suggests a 100/1 Cost Ratio isn’t in the U.S. Favor. Furthermore, the Iranians can build 100 units of the 358 UAV rocket in a month while the U.S. Military can only build 48 MQ-9 Reapers a year.
Unless something changes in the U.S. Military… this is not a good attrition ratio.
steve
Steve, the loading point for the pipeline across Saudi Arabia is quite far north. Suezmax tankers can enter from the north and leave where they came from. Houtis should not be able to influence the tanker traffic from this far north except by drones. The question is whether the drone defense is ready and effective.
I betcha one day the US military discovers that it doesn’t take gold plated weapons to do the job. But that would require necessity driving design parameters.
Using lots of cheap low tech weapons to destroy expensive high tech weapons is an old science fiction trope.
Isaac Asimov wrote about it it in his short story “The Feeling of Power”. The humans are so dependent on automated weapons that they can no longer do basic math. The aliens find workarounds to defeat their automated weapons. Then in “The Machine that Won the War” they realized their AI is broken and end up choosing a strategy based on flipping a coin. They win after all.
This seems accurate, a basic reading and math skills seem to be declining in rich countries, reversing a decades long trend.
Arthur C Clarke’s story “Superiority” humans lose a war against technically inferior aliens by destroying their economy building generation after generation of useless cutting edge weapons until they go broke.
Like Iran shooting down an F35.
Stanislaw Lem goes farther in “The Backwards Evolution”. He predicted that tanks would be replaced by cheap machines the size of large dogs in the 2020s (nailed that in Ukraine), and that by the end of the 21st century, weapons would be so small and numerous that it would be impossible to tell the difference between political problems and bad weather.
These stories seem more and more realistic these days.
‘Houthi missiles have an estimated operational reach of up to
2,000–2,150 kilometers (roughly 1,200–1,300 miles), enabling them to strike targets across the Middle East, including Israel, Saudi Arabia, and the United Arab Emirates. Their arsenal includes Iranian-derived ballistic missiles like the “Tufan” (1,950 km) and long-range cruise missiles such as the “Kuds-4” (2,000 km).’
Not sure how many they have. Wouldn’t count them out after what they’ve already done over the past couple years. Their drones have the range for the whole red sea, and all traffic heading to Asia would be at risk.
https://carnegieendowment.org/russia-eurasia/research/2026/03/russia-oil-situation-assessment
My Final Sermon (in response to the idiotic comments above):
I am a very small player in the world of global oil. I put every penny I make from oil and gas back into drilling for oil and gas, no matter what the prices are at the time of the investment opportunity. To suggest that I’m talking my book is truly ridiculous: I ride the same low and high seas as Exxon, just in a smaller craft. I have lost my ass in a dry hole. I have made it back in a good well. It equals out. If you’re lucky, and careful, you can come out on the plus side.
I imagine most people make comments that have something to do with their families. When Ron mourns this, “All those poor school girls that Trump killed were all innocent,” all I can personally think about is that if Iran had managed to put the 11 nuclear weapons (their envoy bragged about having enough enriched uranium to do so) on Fattah-2 missiles, it would be American school girls that were killed. I don’t believe the mullahs would spare our oil & gas infrastructure, either; I think they’d destroy it in toto.
I can’t stand to read all these liberal comments regarding the fairness or unfairness of life, or the horrible character of Donald Trump. In my world, it speaks pretty well to a fellow’s character that he ordered the oil and gas facilities be spared so the Iranians would have a way to prosper when this is over. Do you fellows have that kind of character? The man did what he thought was right for the country; he sure as hell didn’t do it in order to raise the price of oil and gas; he’s easing the sanctions on Putin and letting Iranian oil get through to China in order to keep prices as low as possible. Do you people think you’re the only person that worries about other people, esp. children? It must be damn satisfying to be perfectly right on something when you know only what you read in the mainstream media, all of which is biased against Mr. Trump. He had the best intelligence in the world, as much of it came straight from Israel. To Mr. Trump, oil is simply a building material, a cost to be kept low. He was told that the Iranians had kept purifying uranium for a nuclear weapon, and their adroitness with missiles speaks for itself. He felt he should stop it before they killed our school children, intentionally.
I hate the political side of this; I’d rather tell you what I know about the geology of the Gulf, which is fascinating. However, I must point out that Mr. Obama (whom I voted for twice because I thought having an African American as president might ease the racial divide) actually had $1.9B (BILLION) loaded on a transport plane and handed over to the very mullahs who had sworn “Death to America.” Do you think that was evenly distributed toward the poor school girls and the sick and disabled, the disenfranchised? Hint: there was a decided uplift in sales of London high-end residential real estate immediately following that idiotic gift. Where were you people then? Did you raise your voices shrilly in the night and I somehow missed hearing them? This site has turned into an angry little propaganda machine, devoid of serious dialogue, with absolutely no room for anyone who might actually be interested in preventing peak oil from occurring.
Well, have at it, boys.
OK, I’ll have it…
Chris, sorry buddy, life is not about you; not about methane emissions costs in your marginal production in the IB, not about fucking corn yields in Illinois, or how many drug addicts there are in your part of the world that have given up and whom are depressing to represent… I personally don’t care. Illinois is a shit hole of liberalism and fraud. Your governor is the brown ring around a bus stop toilet.
Your children I care about, of course. I hope they are not called up, which, truthfully, is about a 1/100th of one percent probability of ever occurring given the success and complete awesomeness of the air war in Iran.
We can discuss, if you wish, the sons of fathers and mothers I know that have already made the supreme sacrifice for their country, in what 10 different places? Lets talk about my friends that gave up their lives in blowouts and fires around the world in the past 50 years, to preserve oil flow, and protect the environment, they were not required to go because they were in the military, they went because that was their job. Yeah, lets talk about them, and their lives. I just went to the 35 year anniversary of Kuwait, nobody was there. We’re all dead.
Remember buddy, I have actually LOST children. Show some fucking respect for others in the nation that have.
The left are pussies. They whine like little girls, do little work, take no risks and bitch when threatened with actually having to defend their country. It disgusts me beyond words.
Alimbiquated, who in the fuck are you? Clearly you are either not an American, hiding behind a fake name, or a one time American living in Europe (England), who does not have the courage to criticize my country, constantly, using your own name. Coward.
Nicki, how do you “break through to a group of people who are set in their idealism, that believe what they do” because they are men and would rather die than NOT be a man?
Be a man yourself. If you can.
Gerry
Looks like I missed it in your sermon and in the news, so please tell me again about how the threat of Iranian development of a nuclear arsenal has been (past tense) “eliminated”.
The Iranian stockpile of enriched uranium and their potential to take the relatively small final step to weapons grade material is (or should be) one of the most important strategic considerations in this conflict. If you can’t get this one fundamental fact right, why should anyone trust anything that you write?
<i<The left are pussies.
Ladies and gentlemen, I present you the dumbest possible reason to lose another brain dead war, except maybe because Jesus wants you to. All your claims about making sacrifices don’t do anything to make dumb things smart.
I am not criticizing America, mike, and it’s not your country. I’m criticizing the current Republican administration, the least popular in history.
I am baffled by the short termism views on this thread.
Do Americans know or remember that the first oil shock primary cause was the US 1970 peak ? Or not ?
https://iiscn.wordpress.com/wp-content/uploads/2026/03/us_oil_production_and_imports_1920_to_2005-1.jpeg
Do they know US tight oil is currently or about to peak ?
https://iiscn.wordpress.com/wp-content/uploads/2026/03/us-oil.jpg
Yves T,
No, most people do not know that US tight oil is currently or about to peak. Also, most people do not know enough to link the 1970s oil shock to the US peak in conventional oil extraction. However, I doubt that this is unique to those of us that live in the US.
Your observation about various responses may be influenced by the fact that US media coverage of this conflict has been notably muted and generally lacking for a number of reasons. I would suggest that a few of these reasons include the hollowing out of quality journalism in the US in recent decades, the pervasive lack of basic math & science skills among journalists, the actions of this administration to destroy a free press and the non-stop propaganda from various outlets like Fox, OAN, Newsmax, Washington Examiner, etc.
T Hill,
For me the situation is extremely peculiar :
If the current “war” (or let’s say an operation to topple the current Islamic Republic regime) succeed, it will be beneficial for pursuing the current “system” a few more years (helped also by the Venezuela operation), but somehow I don’t know whether it is done knowingly for that reason or not, although Trump in his speech after the Maduro story clearly talked about oil much more than he did about drugs (and Maduro as drug kingpin).
And for the vast majority of people (US or not), this aspect (let’s call it “energy security” as the IEA uses to do) is totally avoided, whereas for the second Irak war (2003) it was not (by the journalists, but also by GW Bush saying “The American way of life is non-negotiable.”, or Cheney ?), and having a totally cynical look at the oil aspect (extracting more barrels), this war was a clear success :
https://iiscn.wordpress.com/wp-content/uploads/2026/03/iraq-oil.jpg
Now there is both the “energy independence propaganda” (even though for oil the US is marginally a net exporter), but the same real-politic on the ground, even with the added propaganda “the US wants to disengage from the middle East”, when it remains the main (by far) strategic asset and especially towards China.
And of course in the background, the completely lost opportunity regarding the first oil shock wake up call, which has vanished in the narrative “OPEC cartel, greedy Arabs, whatever ..”
And it is so late anyway ..
But to what extend you would say Trump and his close administration is aware of the overall oil situation ? How can Americans not realize that below is very different from the beginning of oil ?
https://iiscn.wordpress.com/wp-content/uploads/2026/03/midland.jpg.jpg
https://iiscn.wordpress.com/wp-content/uploads/2026/03/shale-horizontale.jpeg
Yves T,
Thanks for the images of the work in the US southwest shale. Thanks also for the reminder that if one chose the very cynical metric of oil production then the last Iraq war might be considered a ‘success’.
Regarding your questions, I cannot speak to what Trump and his close administration are aware of, and can only observe their actions and public statements like most of us. I can provide a bit more anecdotal insight into his supporters based on polling and my daily life. I live in a county where cast votes were more than 70 percent for Trump in 2024, with all surrounding counties at more than 60 percent.
However, before even going there I’ll note that ‘growth’ is essentially gospel in the US. In addition, there is widespread belief that the technology fairy will solve all of our problems and that the only path is up. If I can push a button and have Amazon deliver my package tomorrow then surely there is no physical problem that cannot be solved with technology.
Now, there are a great many people who work very hard simply to get by and are too exhausted at the end of the day or week to do anything but make dinner and go to bed. Real challenges today and every day, not years from now. Some of these might get it if they had time, but I will also note numeracy is sadly lacking across the US. In other words, there are many that simply cannot understand irrespective of party affiliation. Even those with the skills to understand and direct involvement in industries that should expose them to certain physical realities often lack the larger perspective necessary.
Now back to Trump, his administration and his supporters. If you don’t know, you should understand just how important ‘god, guns and gays’ are to many of them, as well as a non-trivial core of racism. Forget about anything else. This is obviously not true for everyone that voted for Trump, but I hear these themes or see the bumper stickers every day. This support is often tribal, not some type of well considered evaluation of issues and facts. Fact resistance is endemic. As one example, there are local areas here that have been repeatedly devastated by climate-change driven severe storm impacts, but they are told it is all make believe. If you haven’t read, watched or listened to the right wing media in the US it would be hard to believe just how bad it is. I shake my head weekly when I hear somebody regurgitate the OAN talking points they ‘learned’ the night before.
Finally, never forget Hanlon’s razor when trying to understand this current US administration.
T HILL,
Thanks for your answer and infos.
Regarding Trump himself (not his electorate in general, or close advisers whom I don’t know well), I think he has a “gutt feeling” or instinct regarding the importance of energy, in his talk at the UN (September 2025), energy was also all over the place, together with climate change denial yes, but it was all over the place (and in some aspects on anti greenwashing, intermittent wind energy and the like, I could also agree with him!).
I am not a climate change skeptic at all, but typically in Europe, Van Der Leyen and others have recently clearly stated than the anti nuclear stance has been a strategic mistake (and in France we also have killed 2 or 3 Gen IV programs over the years, starting in the 80ies).
Somehow I feel like in our time some kind of “cynical rationality” is creeping in, in between huge clouds of morality stances and the like (if it has ever been different).
But regarding Iran, the way the war has started could be discussed to no end, together with the whole UN role being in shambles, however it remains for me both in the interests of the “US/western world” AND the Iranian people, and has much more chance to end in a good way than Irak, provided the Iranian people find a way to be truly instrumental in their country liberation (real resistance cells forming, not demonstrations) and somehow I think it will happen.
(but of course that won’t change the overall medium/long term stark picture regarding oil and resources in general).
https://www.youtube.com/watch?v=cyNsiXoMocs
Secretary of Defense Hegeseth is indoctrinating military that the attack on Iran is because Jesus is returning soon.
And to be a better Christian you must support Israel.
Has anyone ever seen this with evangelical preachers that just want your money?
From the Book of Revelations…where Satan sits on a throne pretending to be Jesus….WTF!
Israel thinks Americans are idiots.
I don’t…but if military generals are buying this BS?
https://www.foxnews.com/politics/chicagos-teetering-debt-stark-warning-left-wing-mayor-fueling-pay-later-doom-cycle-expert
Is this an example of the moral and intellectual high-ground the left holds over the 51% of America that wanted a change?
Pretty much, yeah.
Mike,
Just stick with oil buddy. This is what you are really good at. Dennis and Ovi are doing a great job here w/o any stupid politics, we don’t need that. And you are not the only patriot here.
Agree with Klim. Stick with oil & gas.
If not, at least get your math right. 22.7% of the US population voted for Trump in the 2024 presidential election. That stat becomes 31.6% of eligible voters and 49.8% of total votes cast when we refine the grouping considered.
Mike:
Brandon Johnson’s approval rating amongst Chicago voters is between 14-26%. He won’t be back for another term.
Chicago votes very far left, however Cook County (which also has a lot of wealthy burbs) in 2024 replaced Kim Foxx with a retired Judge as State’s Attorney, who is actually doing the job much more the way it is supposed to be. She ran a law and order campaign against the far left primary candidate and beat him.
I have family who live in McHenry County, which is the only Chicago burb to vote Republican for President in 2024. But it was closer than it has been, and I suspect it will keep heading that way. The wealthy, educated burbs in most parts of the US vote blue, which wasn’t always the case.
In fact, the Illinois governor before JB was a Republican. But now the Illinois Republicans nominate a very conservative candidate from Southern Illinois, and the burbs won’t vote for him in 2026, just like they didn’t in 2022. Not smart if you want to actually win.
Ken Griffin, who is one of the richest men in the US, that nobody has heard of, tried to get a moderate Republican nominated in 2022, but he lost. So Mr. Griffin moved his business and his $60 billion to Miami. He’s a moderate Republican and he’d had enough. He also isn’t a fan of President Trump.
I encourage you to look at a 2024 Presidential map of Illinois by county. You will see what is true over the nation at large, rural America elected President Trump.
As for never ending deficit spending, the United States, under both Democrats and Republicans, going back to Reagan, has been deficit spending. The lone exception was Bill Clinton’s second term.
Both Democrats and Republicans have had many in their ranks say deficits don’t matter. Both have also have had many make claims they were going to get us off the deficit spending track, but they haven’t.
I contend if you think the Democrats are all wrong, or the Republicans are all wrong, you are being duped.
Everytime either party wins an election (always by a slim margin) they think they have some huge mandate and go way too far with their ideology, to the detriment of our country.
I know you are backing President Trump close to 100%. That’s the way most of my friends are. A few are starting to question that, however. But they would never vote for a Democrat either.
Trump lost me with the 2020 election. I sure hope you haven’t bought into the BS that it was stolen. Some of my closest friends still believe that. Guys I’ve known since I was 5. We have discussed that calmly, in detail. I’ve explained how elections work, how election lawsuits work, sent them some of the cases lost, with summaries. I think some still think it was stolen because they just want to believe it so badly. Some admitted it wasn’t stolen, yet voted for Trump in 2024 anyway, in both the primary and general. Admittedly the Democrats did themselves no favors in 2024. Joe and Jill Biden let their egos get the best of them.
Assuming the elections aren’t messed with in 2026 and 2028, we will see Democrats win. They will think they have some huge mandate. Just like the Republicans do.
And the trillion dollar plus deficits will continue. And people will keep watching “their news” and staying in their silos.
And the Middle East wars will continue, over oil that we supposedly either badly need, or don’t need, depending on the day of the week.
And the youngest and bravest among us will risk their lives and limbs fighting these Middle Eastern Wars while us old assholes sit in our comfy homes and argue over politics.
Shallow, I am sorry I got so personal. Forgive me.
I invested 10 years of my time on peakoilbarrel.com trying to teach people about oil and gas, giving them some insight into the future, arguing about reserves, economics, how to interpret data; it was a complete waste of time.
This site has NOTHING to do with oil and gas anymore, nor peak affordable oil, NOTHING. Its originator, and it’s successor in interest, has allowed it to become a piece of ugly shit anti-America, sicko venue for hate, and divineness. Congratulations, Dennis. Well done.
Its fine to debate politics, argue policies, particularly with a current POTUS who is so controversial; that is not what any of this is about. You, Shallow, know that. Its about stupid people that know nothing about oil and gas who found a home to spew hate. Dennis Coyne allowed it.
I wasted my time.
Liberals are pussies. Commenting flagrantly on social media about how BAD America is, particularly if you are NOT American, and live abroad, anonymously, makes you a big coward.
I always like to send this shit to hard-working Americans trying to make ends meet by providing energy to the lazy American left. They love it!
Sorry again for being so personal.
Change the name to Anti-America.com and have fun.
Thank you for commenting Mr Shellman, very entertaining.
Allowing a free exchange of ideas is indeed a terrible thing.
I read many of these comments not as hatred of America, but expecting something better. For the Americans that are commenting I see mostly a concern that Trump may be underestimating the resolve of Iran and that the long term strategy seems to not be well thought out.
Criticism and hatred are not the same thing.
Rig Report for the Week Ending March 20
The rig count drop that started in early April 2025 when 450 rigs were operating rose this week. Drilling continues at a steady rate of 367 ± 5 rigs per week since August 2025 while WTI closed above $95/b.
– US Hz oil rigs added 2 to 371, down 79 since April 2025 when it was 450. It was also up 9 rig from the low of 362 first reached in the week ending August 1. ND and Oklahoma added 3 rigs each to 27 and 40 respectively. The rig count is down 18% since April 2025.
– New Mexico Permian was unchanged at 92. Lea and Eddy held steady at 58 and 34 respectively.
– Texas added 1 to 170. Midland and Martin were unchanged at 20 and 23 respectively. Loving dropped 1 to 17 while Ward added 1 to 7. There were minor changes in a few of the smaller oil producing counties. Two counties, Ochiltree and Pecos, added their first rigs this week. Higher WTI price maybe?
– Eagle Ford dropped 1 to 31.
– NG Hz rigs were unchanged at 114.
A Rig
Frac Spread Report for the Week Ending March 20
The frac spread count dropped by 8 to 164. From one year ago, it is down by 51 spreads and is also down by 51 since March 28, 2025.
A Frac
So Trump is talking of winding down the Iran war, to declare victory and leave. He is DEMANDING that Western allies take over keeping the Strait of Homuz open (which the US has totally failed to do) and will now probably sail his gunboats to a less prickly target – Cuba, which is in total energetic collapse due to a US energy blockade.
The US/Israel has destroyed most of the Iranian conventional military hardware, killed most of the top two layers of political and military leadership but Iran continues to strike Israel, Iraq, and other gulf states, with drones and missiles targeting refining capacity and today fired two ballistic missiles at Diego Garcia, which is 3,800 km from Iran. The state continues to largely function as normal, and is still executing prisoners from the January protests.
The straits are being traversed by shipping, but only in tiny numbers and only by ships which divert into Iranian territorial waters, where they are assumed to be paying million dollar “transit fees”.
Trump has overseen a short war which has failed to topple the regime, failed to find and eliminate the key nuclear threat (enriched uranium) and failed to stop significant missile and drone attacks on allies in the region, leading to long term damage and degradation of their energy exporting facilities and economies. It has provoked Iran to cross several red lines, to effectively close the Strait, and destory 3% of global LNG export capacity. It has made it abundantly clear that it will retaliate in kind to all continued attacks from Israel or US anywhere the US has military presence. The country has clearly showed that it still has the capability of the sub-nuclear option of destroying the desalination plants of its neighbouring nations , which would lead to the entire region becoming effectively uninhabitable and sending tens of millions of refugees around the world, and probably destroying the entire oil and gas production at a stroke. They could do it without warning if they felt their regime was in imminent danger. These are religious fanatics quite happy to murder tens of thousands of their own people for the greater glory of God, they would not let the consequences stop them.
Even if Trump calls a unilateral ceasefire today, there is no indication that either Israel or Iran would stop fighting, the straits will remain effectively closed indefinately, and the world will face recession and food shortages in the coming months and years probably exceeding the depression of the 1930s.
Trump, and his administration is now universally DESPISED in Europe, UK, and most of the world. He has unilaterally destroyed the liberal democratic order of the last 80 years, and he is now seen as more dangerous to world peace than any world leader since Stalin.
https://www.theatlantic.com/magazine/2026/03/trump-national-security-greenland-spheres-of-interest/685673/
Here’s a stark oil and gas reality: The Persian Gulf, especially Hormuz, is going to be placed under a form of martial law. It’s a damn shame it has come down to this but it has. The mullahs are too crazed. They want to hurt everyone who has ever associated with America or Israel.
How will this work? The Gulf will be routinely patrolled by the U.S. Navy, probably with the U.K., France, Germany and other NATO countries, along with Japan, in support roles. These countries have finally realized that a lot of their oil and gas, and fertilizer, comes through the Gulf, and if it remains closed, their economies will suffer financial disaster. Who knows? It is possible that this will all be done free of charge–like parents cruising the streets outside a party house. If the Iranians keep shooting, knowing Mr. Trump’s style, there may well be a surcharge placed on shipping their oil.
If anyone thinks Iran is going to be allowed to continuously sell oil as the only purveyor from the Gulf states whilst also lobbing missiles at their Arab neighbors and Israel, they are dead wrong. They may lob a few more, and they may even hit a few targets, but this thing is just about over. And when it is, there will be safe passage through the Gulf.
When will this happen? Just as soon as the U.S. expeditionary force is readied in the Arabian Sea. I may have missed the mark by a few days regarding the price of oil but it will come down quickly—probably overshooting on the low side—when the insane Iranian shooting gallery is shut down.
For all you anti-American folks out there, cheering for Iran, prepare for a crash landing.
Insightful post Gerry.
I’ll add that Iran can’t hit the US Navy or Air Force with anything.
AEGIS missile defense will detect your about to fire a missile and destroy it before it takes off!!!!!!
That is why they are attacking Dubai and other things.
The problem is that drones make assymetric and guerilla warfare pretty much impossible to completely extinguish..
Its like when the USA armed Afghanistan with Stinger missiles to take out Russian aircraft. Assymetric.
And in a mountainous region like Iran with 90 million population………
Keep your eye on relatively cheap underwater sea drones. Not as a threat to the US Navy.
But to commercial vessels.
The Ukraine sank a docked Russian submarine with one
Gerry,
You seem to see only black or white. Criticizing the action of the US is not the same as hating America. In fact one could claim that cheering a war that may lead to many US soldiers being killed with little chance of a long term improvement in the situation (and perhaps leading to a deteriorating political climate in the middle east) would be the action of someone who would like to see the US stuck in a quagmire like Afghanistan.
Just because someone disagrees with your point of view does not make them an idiot.
Gerry,
Reading recent developments it looks like the Strait of Hormuz may indeed be opened soon. Hopefully this can be accomplished without many US casualties. These kinds of operations are often easier on paper than in reality, Trump seems to be indicating he will leave this job for others. Also Iran seems to have made deals with China, Pakistan, India, and Japan to allow their ships through with Korea currently in talks with Iran. A negotiated settlement on passage through the Strait would be preferred over loss of US military personnel at least in my opinion.
I agree with Dennis, that questoning America does not make you Anti-American.
Shall we just celebrate Trump and Epstein redacted documents.
And Trumps weaponisation of the Justice System to take out his political openents
Yeah, questioning your president. Is the essence of patriotism. It’s democracy in action.
For instance, I think Obama made a large mistake in attacking Libya. He did it without congressional authorization, and it has left Libya in an enormous mess. Does that mean I hate America? No, it means I want to make it better – the essence of patriotism.
DC, Coffeeguyzz,
here is the good overview about OGIP and EUR in Marcellus, and particularly southwest Marcellus
https://www.youtube.com/watch?v=WF59VA4QQGA
Sheng Wu,
With all the unfolding global drama (both Israel’s and Iran’s nuclear facilities at Natanz and Dimona were attacked within the past few hours), it seems like virtually all other events are taking a back seat.
Fascinating presentation you linked by a very bright guy.
The mention of pyrite at the 34 minute mark dovetails in with some of your earlier comments from Greene county tailings.
At some point, I will post some jaw dropping cums from Greene county wells.
Absolutely stunning production numbers.
Thanks for posting.
Iran and Venezuela by Trump are all targeting China
before invasions, China got roughly 2MBOPD from Iran and Venezuela, and yet these two countries are not even on China’s crude import top 10 sources, and yet Malaysia is #3 with over 1.3MBOPD and Brazil at 0.8MBOPD.
Note that Malaysia is a net crude import country.
China probably has been preparing for this and fast piling up SPR in the past 2 years, probably now at over 120 days.
Nice analysis of Hormuz crisis by Robert Rapier at link below
https://oilprice.com/Energy/Energy-General/Why-the-Global-Oil-System-Cannot-Replace-Hormuz-Flows.html
His analysis suggests a shortage of about 10 million barrels per day.
Dennis
I am surprised at the little he said about the east west pipeline.
In the article below, it states: “Saudi Arabia’s oil exports through its Yanbu port on the Red Sea are projected to reach a record high of 3.8 million barrels per day in March after the U.S.-Israeli war on Iran virtually cut off exports via the Strait of Hormuz, Reuters reported on Wednesday. The Kingdom can pump up to 7 million barrels per day through its East?West pipeline, of which 5 mb/d are available for export.”
In the WSJ report it states: “The pipeline—a 750-mile system that transports crude from the Persian Gulf to export terminals on the Red Sea—carried about 2.8 million barrels a day before the Strait of Hormuz crisis stemming from the war in Iran. State oil giant Aramco is now moving to push flows toward its 7 million-barrel-a-day capacity as vessels shift loading operations to the western coast.
“We should be reaching capacity in a couple of days,” Aramco Chief Executive Officer Amin Nasser said Tuesday in an earnings call. “We are at more than double where we started.” The pipeline is used to transport Arab Light and some Arab Extra Light crude grades.
The abrupt nature of the crisis forced a rapid reshuffling of shipping logistics. “This crisis happened all of a sudden and tankers need to reposition to the west coast for loading,” Nasser said, adding that tanker movements and adjustments determine how quickly the company can reach full capacity.”
WTI opened at 6:00 PM EST at $100/b but has now slid back to 98.80/b +0.57. Note that is the May contract.
https://oilprice.com/Latest-Energy-News/World-News/Saudi-Arabias-Red-Sea-Oil-Exports-Jump-To-Nearly-4-Million-bpd.html
https://www.wsj.com/business/energy-oil/saudi-arabia-pushes-east-west-pipeline-toward-capacity-amid-hormuz-disruption-c4925856
https://www.spglobal.com/energy/en/news-research/latest-news/crude-oil/031026-aramcos-east-west-pipeline-to-hit-full-capacity-in-next-couple-of-days-ceo
Ovi,
Rapier’s estimate is an increase in Saudi flows through Petroline of 2 to 3 Mb/d, about 3 Mb/d was already being utilized before the current crisis. So his estimate of actual flows will be 5 to 6 Mb/d. Note that little increase is expected from UAE from their pipeline because the capacity is already being utilized.
Basically there will be a shortage of about 10 Mb/d due to the closing of Hormuz. Seems some nations such as Japan are negotiating for their cargoes to pass, and China and India may also have their ships allowed to pass the Strait. Korea may also be in talks with Iran to allow their cargoes to pass through the Strait. All of these flows may reduce the shortage of crude that passes through Hormuz.
Difficult to keep track of it all, many moving parts.
Sure don’t relish noting these ongoing war events, but – as of ~8 PM EDT Saturday – Trump ‘tweeted’ that Iran has 48 hours to open Hormuz.
Absent that, he threatened to destroy all of Iran’s power generating facilities (aka ‘bombing them back to the Stone age’).
While I believe that spiritual/religious inclinations may not be especially prevalent amongst many participants on this site, the adage ‘no atheists in foxholes’ comes to mind.
We are most definitely stepping into a global foxhole this very minute.
I have a more optimistic outlook. Everything points, imo, to Trump declaring victory and leaving Israel to it tomorrow or the next day.
The evidence is here:
https://www.lauriemeadows.info/conflict_security/Security_Shift_-_The_2026_America_-_Israel_Attack_On_Iran.html#Trumps_Retreat
Iran has laid the groundwork for a Montreaux Agreement, such as Türkiye has, taxing transit of ships. Just as is collected in the Suez Canal, and in the Danish Straits (disguised as ‘pilotage’), by the way.
I list some of the clauses of the Montreaux agreement in the article referenced above.
The amphibs clearly won’t be used in the Gulf unless Trump signs on to the, lets call it ‘Hormuz Agreement’. If it follows the Montreaux agreement, in times of conflict, by agreement with the controlling country (Iran) a non party to the conflict (post his ‘walking away’, remember) may allow ‘light military vessels’ (defined by tonnage) to pass under specified conditions. Such as extraction of embassy staff from the green zone (if land passage is blocked).
Or they could be used by Trump to interdict ships using the Strait that paid in yuan.
We’ll see.
” paid in yuan.”
yuan’s are only used inside China.
Why would anyone want them unless you were in China?
So 12 hours after talking of walking away, Trump has given Iran 48 hours to open the Strait, or see their entire electicity power industry destroyed. Apart from being an obvious war crime, this will trigger Iranian reprisals on the entire gulf region, resulting decades long collapse of the region, and global depression, not to mention deaths on a biblical scale.
This man is unutterably stupid.
Oh, contraire, questioning the tactics of the president when he has discussed this in great detail with our best military & diplomatic minds and has shown restraint in preserving the oil and gas infrastructure of the country we are at war with is the epitome of anti-Americanism.
I’m not sure how this is going to end, but one thing I am willing to bet on: the Strait of Hormuz is going to be opened sometime soon. The getting there may not be pretty, but it’s going to be opened. Discussing ramifications of prolonged closure is academic; it’s an international waterway.
As for your group here, I find it very hard to take seriously a grown man who feels he has to use an alias in order to express an opinion that he would not dare say using his real name. I always feel like I’m watching a Punch and Judy show.
Trump has just threatened to “obliterate” Iran’s electricity production if the Straits aren’t opened in 48 hours. It’s a terrorist tactic he seems to have borrowed from Putin, who has used it unsuccessfully in Ukraine for years. So much for the FIFA Peace Prize an the Board of Peace.
Trump isn’t bombing Iran’s oil sites because he wants to steal the oil. He has made this perfectly clear in Venezuela and he has been on record saying this about Iran and Iraq for more than a decade.
As far back as 2011, he was telling the Wall Street Journal that this was his policy for Iraq. “You heard me, I would take the oil,” he said. “I would not leave Iraq and let Iran take the oil.” And he insisted to ABC News that this did not amount to national theft.
“You’re not stealing anything,” Trump said. “We’re reimbursing ourselves … at a minimum, and I say more. We’re taking back $1.5tn to reimburse ourselves.”
https://www.theguardian.com/us-news/2016/sep/21/donald-trump-iraq-war-oil-strategy-seizure-isis
This also dovetails well with Shengwu’s remarks above that the latest two attacks are directed at China. Trump wants to end America’s trade deficit with China, a goal I agree with. Trump’s solution is to seize power in petrostates supplying China with oil by killing the dictators, stealing the oil and selling it to China.
The problem with this strategy is Trump’ primitive imagination of how the entities in question work. He thinks the American economy the American government, and American companies are all the same thing. He thinks the head of state is the country. The also imagines the Dow Jones is the measure of the economy’s strength.
Oil shipped from Iran to China won’t solve the American problem of chronic overborrowing, and domestic demand suppression by the Chinese government, which are the twin causes of the trade deficit. He is running an illegal offshore slush fund to store Venezuelan oil revenues, but that won’t solve the problem.
Gerry,
Have you heard of the 1st amendment? Nothing is more anti-American than thinking that should be abolished. Criticizing the leaders of the republic creates a better republic.
Trump listens to no one and has surrounded himself with incompetent people as long as they are loyal.
You may be right that Hormuz will be opened soon. Not clear what the cost will be in American soldier’s lives, I hope it is close to zero, but that seems highly unlikely.
“a grown man who feels he has to use an alias in order to express an opinion”
Gerry, I like your posts.
But since you can’t use the reply button correctly, I know you are not a technologist.
You have crossed the rubicon of putting your name out there.
Do you want someone to show up at your house who doesn’t agree with you?
Or the next time you apply for a job someone uses AI to decide you are anti-american before you show up.
Using an alias is intelligent, unless you are about to die.
I actually have a decent reason for not using my name. When that ends, I will use my name.
I have owned working interests in stripper oil wells since 1997. My family has since the 1970’s. I worked in the oilfield in the summer while in undergrad and law school. Part of that was as a hand on a single drum pulling machine.
Admittedly I haven’t since law school. But my money has been on the line for almost 30 years.
I know you support Trump. What do you think of his statement about Robert Mueller? Are you aware of Mueller’s military service?
This is what the President who is unilaterally sending our troops into a war with Iran thinks about a highly decorated Vietnam Veteran. Of course, we knew this way back based on comments he made about John McCain, who was a POW.
I’m no lib either. Far from it. I go to a Christian church weekly. I’m a gun owner. I live in a rural area where the number one employer is a major oil refinery.
My wife and I have a son who is a police officer, volunteer firefighter, and served his 6 years in the Army Reserve. He is on IRR now. We are obviously concerned and watching this closely. As you should be able to tell, we are extremely proud of our son’s service.
You can ask Mike about me.
Shallow sand,
Do you believe there are not any liberal, rural, Christian, gun owning people? I am fairly certain that is not true.
You are a good man, Shallow Sand and in spite of our political differences I respect you and your entire family. I am sorry, once again, I have personally attacked you. That was not correct.
Its OK to question politics and policies, I do it all the time. Its not OK to wish failure on my nation to prove a point and that is what the left is doing. The name calling, the disgusting, vial accusations against half the country for whom they voted, is hard for this old hand to take.
If you are not an American and doing that, piss off. Get a life. Find a job. Grow a garden. Get off the computer.
This morning on Morning Joe, the natural venue of choice for this forum, Scarborough asked Schumer if after 47 years it was a good thing to have decimated Iran and its control over the entire Middle East and the treat is has imposed on that region of the world all this time.
The son of a bitch could not answer. Jesus.
Mr. Coyne, you can write, allow, promote whatever vomit you want; its your blog, man. You were just a numbers, math dude who never understood the oil and gas business anyway and its only the natural scheme of things that you gave up on that and transgressed to whatever was left on social media in current time, Trump hate, and politics. That is what works, gives people a outlet to spew hate….you moved in the only realm you had left to keep the blog going and make yourself, and your community…relevant. Don’t hate me, dude, its just the facts.
Peak oil barrel has nothing to do with oil and natural gas anymore. Its EIA, after the fact, and wrong, BS.
Mr Shellman,
I don’t write the comments, people seemed concerned about the war in Iran. I agree with the concern of Shallow Sand and a majority of US citizens that US lives should not be put at risk to satisfy the wishes of Bibi.
Did you actually watch Morning Joe or were you seeing a clip on Fox that didn’t cover the whole conversation?
Schumer did not like the way Scarborough was framing the question and does not think the military/political divide that Scarborough was proposing is legitimate. The important question in Schumer’s opinion is the ultimate geopolitical result. Does a younger more radical Supreme leader in Iran bode well for future stability in the Middle East? Do you support a large ground invasion by US troops to “finish the job” in Iran as GCC nations are now requesting.
Seems a very bad idea to me.
Gerry- “questioning the tactics of the president when he has discussed this in great detail with our best military & diplomatic minds”
That would be nice if true, but lets all keep in mind that this president has surrounded himself by loyalty…not expertise. His cabinet members and appointees are largely unqualified, inexperienced partisan loyalists who would have never made any short (or long) list under any other presidential administration.
“Oct 16, 2020 — Former White House chief of staff, retired Marine Gen. John Kelly, has told friends that President Donald Trump “is the most flawed person” he’s ever known.”
Who would be loyal to that? And who the hell would vote for it?
Think about what happened last night. Trump, sitting in Mar-a-Lago, without consulting anyone, tweets on Social Media, that he will ‘obliterate’ Iran’s power plants if Strait of Hormuz does not open. Hospitals would be without power. Water treatment plants would shut down. 90 million people be without power.
He is targeting the civilian population. That is a war crime!
We have an idiot running our country. And that should scare the hell out of everyone!
When I think about his behavior/way of thinking I would not be at all surprised if he decides
-to simple declare victory and walk away leaving a huge mess, or
-to send in US troops to occupy Kharg Island… in order to cripple the country economically as we are doing to Cuba. Iran will not submit to occupation without a fight. But the Kharg occupation could end up with an Iranian regime internal overthrow eventually. I have no idea if he has been presented with a viable Kharg invasion plan.
If I had to guess I suspect he’ll yield to the pressure of the severe global economic downdraft that he is creating, and simply cut and run (TACO) leaving the regime relatively unhindered. Of course he’ll admit no responsibility for anything…he never has.
Ron,
Does any of this surprise you though? This is what 77M people voted for.
Hickory,
Agreed that those are both possible paths that Trump may take. Here’s a couple of leading questions in either case –
1. If the enriched uranium remains in-place just a short step from nuclear weapon development, what conclusion will Iranians draw from this experience and what can we look forward to in the future?
2. As others nations look at conflicts in Iran and Ukraine, will they decide to join the nuclear club? For example, Turkey, Poland, Saudi.
T Hill on your nuclear question- Iran’s motivation will be fired up, along with regional players like Saudi and Turkey.
It seems to me that many countries now realize that they need nuclear weapons as a deterrent to being bullied.
Can any country feel assured that the US can be trusted to provide regional deterrence or security?
Not after Trump.
Can any country be assured that the US will abide by treaties and norms of international behavior?
Not after Trump.
Nuclear proliferation has gained a big tailwind.
And of course miniaturized autonomous weapons and cyber warfare as well.
I wonder if the US is considering a blockade on cargo shipping to Iran, for items like steel, electronic components, explosive and propellants precursors.
“ This is what 77M people voted for.”
If there’s any specific policy that MAGA voters wanted, it was no more foreign wars.
Hickory,
Agreed. And, after the attempted Diego Garcia strike we now know that Iran’s ballistic missile range appears to be much larger than previously discussed in public. Much of Europe appears in range.
If you’re not familiar with the history of the 1983 US ‘Proud Prophet’ war game I recommend it. Not reassuring in light of this increased proliferation risk.
Aside from nuclear, I have to wonder how many nation states or even rogue groups without enriched uranium are starting to pair AI with modern biotech methods for weaponized pathogens.
Nick G,
Sure, this change in policy was a complete surprise given Trump’s record of keeping promises and staying the course. 🙂
🙂
T Hill: Sorry. I’m confused. “If the enriched uranium remains in-place just a short step from nuclear weapon development…” Is that a condition that warrants the attacks on Iran?
Paoil,
Sorry, I’ll try to clarify my point.
Within the context of this site we are currently talking about an above-ground, geopolitical constraint on oil (as well as many other critical supply chain elements). Ukraine turned over the nuclear weapons it had in exchange for certain security assurances. Russia invaded. Trump has now brought the US to war against Iran. Iran is or was reportedly very close to having enough weapons grade uranium and tech to create around 10 nuclear weapons.
Nuclear proliferation is a likely outcome of other nations observing these chains of events. It is no great stretch to assume that the Iranians will conclude that this current conflict would not have occurred if they had nuclear weapons. If they retain their enriched uranium, Iranian nuclear weapons seem more likely in the future. I pointed to Proud Prophet as an evaluation that identified the risks of a ‘limited’ or tactical use of nuclear weapons. Whether conventional or nuclear, escalation is an obvious risk in the current conflict.
Expansion of the nuclear club would be destabilizing.
There are different ways this current conflict may play out, many of them also greatly destabilizing.
Welcome to the 21st century. Two military technologies have completely
changed the way wars are fought: cheap drones and hypersonic missiles
(https://militarymachine.com/hypersonic-weapons-explained). The US makes
about 50 patriot missiles a month (sells them for $6 million or more). The
Kiel Institute in Germany estimates that it takes about 30 patriot missiles
to bring down one Russian Iskander missile. There are 3 countries with
hypersonic missiles: Russia, China, and Iran. The Iranian missiles are
domestically designed and produced. Iranian drone technology is so good that
they shared it with the Russians to bring them up to speed for the war in
Ukraine. Note that it takes two SAMs costing about $2 million each to take
out one $35,000 Iranian Shahed drone. The best air defense the US has is the
billion dollar THAAD system. The Iranians have taken out 3 of them so far.
The illegal and unconstitutional US aggression of Iran will go down as the greatest strategic blunder in US military history.
“The Ukraine sank a docked Russian submarine with one”
. . . . and a crude carrier or two, on fire and sinking at a few strategic waypoints would be an issue with navigation.
Trump changes course yet again, this delays the 48 hour ultimatum, by about 4.5 days. Iranians may worry this is another head fake by Trump, hopefully diplomacy will be allowed to settle things. Iran publicly denies any direct or indirect negotiations have occurred, but there is reporting that Turkey, Pakistan, and Egypt are acting as intermediaries. A cynic might say it is just happy talk to get oil prices down and stock markets higher.
We will see. Brent May 2026 futures contract down by about 8% today to $104/b.
https://oilprice.com/Latest-Energy-News/World-News/Oil-Plummets-8-as-Trump-Postpones-Hormuz-Deadline-Threat.html
non-oil
It delays the ultimatum if the ultimatum was real. Given Donald’s integrity in rhetoric it could be real, a way to skim stock market swings, create more confusion and attention, stall for time as Marines come in to participate in Act III of Donald’s manly display of power. Who the hell knows but how could anyone interpret what he says as indicating anything substantial when the people he says he’s had productive talks with deny there has been any contact?
Trump just want a pause in fast and uncontrollable rise in bond interest and oil price, but he is determined to a complete victory.
In the end of this month, US will invade Iran’s Kharg island and take away 80~90% of Iran oil and gas export.
Andre the (?) Giant: “Using an alias is intelligent, unless you are about to die.”
That would be me. However, there has never been a period in my life when I thought I had to sneak around in order to speak what was truly my belief system. The duplicity of this site, the thing that makes it so utterly inauthentic, is that people from all around the world are encouraged to take on a false name in order to ejaculate the ugliest, most hateful venom they can come up with, thinking it to be an intellectual endeavor, and then can simply remove that alias and go sit at the dinner table and go to work saying other things that reflect opposite or very different views. It is impossible, reading here, to ascertain whether you’re just reading the verbal catharsis of some guy who is on the edge, or if it’s something thoughtfully imagined, with merit. Is this a couch, or a though system?
Do you not believe in free speech? Dennis Coyne asks, as usual, completely infuriating me. Well duh, I’m all for free speech, it’s hateful duplicitous speech I don’t like. And when one uses duplicity to “dupe” his readers, then that man has become a part of the agitprop (agitation/propaganda) machine. President Xi’s father was Chairman Mao’s agitprop officer, and Xi studied at his father’s knee. That’s the reason he’s so talented at this. Back during a very dark time in American history, men who were deacons in churches and strong family men pulled on white hoods at night and terrorized the countryside, trying to inculcate a certain “belief” into a large group of enslaved people who couldn’t write down their own beliefs. You fellows pulling on the hood of an alias are talking to untold hundreds of people, spewing “beliefs” that turn out to be only your beliefs when wearing your hoods. What the hell you think when you’re at work, we’ll have to guess at.
When you do stuff like this to change weaker men’s minds, especially when you’re spewing disgusting nonsense about our American president while wearing your fucking hoods, I think that’s anti-American, and contemptible, and cowardly, and despicable, and I don’t give a damn what moniker you’ve chosen to reflect your daytime job, or your opinion of what’s cute, or your choice of a title while at your corner drag queen bar, it’s pretty weak beer in my opinion. Tsk-Tsk, boys.
But hey, have at it. I only posted this so if you wish to show up at my door, or try to harm me because of my beliefs, I want you to know I’ll gladly welcome you, day or night. Even at damn close to 82, I do believe that speaking in one tongue, like Crazy Horse, Geronimo and Sitting Bull did, is the only way to live one’s life—even if it will get you killed. i would like to personally invite all you morons who think you have to pull on your hoods to say what you really feel to understand that one day it won’t make a shit, someone will see you for a fake. In my opinion, this whole thing, except for the charts and graphs, is a fake, a place for small people to go and make absurd accusations and spew unverified information about whomever they don’t like. I doubt that a single one of you would know an anticline from an anthill. Or has the foggiest idea why the Strait of Hormuz exists as a kink in the waterway.
The most patriotic and American thing a person can do, is to call our president a clown, if and when he is in fact a clown.
Sometimes, Gerry, the truth hurts.
The duplicity you decry would come into play if one were to claim the clown was something else, like ‘intelligent’ or ‘caring’ or ‘not a complete dumbf*ck’. That would be nonsense.
Gerry, I would never show up at anyones door.
I was saying one of the reasons I use an alias is I don’t want anyone showing up at my front door.
This is all entertainment for me and a place to express
my insignificant and zero impact opinion.
And I learn things from Dennis, Ovi, Ron, Gerry and other posters
I agree with most of what you say.
With AI and Web Crawling and Big Data architectures, your name can easily be searched for.
I am still a working man, and customers / clients / businesses have software that searches for your social media footprint.
A client turns you down, you are scratching your head why? They don’t like the concept of Peak Oil so they don’t like YOU.
My real name is Ralph and the email I use to register at this site is my full name. I am British, and although my degree was in chemistry, I know enough geology to recognise an anticline and plate tectonics.
I have good friends in the US who are terrified at the moment that their peaceful anti ICE protests will get themselves murdered by anonymous, masked officers. I am advising them on how to reduce their online visibility.
I am male heterosexual but one of my adopted children has chosen their life in a different apparent gender, and they are very happy and no threat to anyone as a result.
I know British men of a similar age and background to you who are equally certain of their scientific knowledge and social and geopolitical views. As someone nearly 20 years younger and from a less openly corrupt administration, I can with fair certainty say that you are a man in deep denial of the evidence of your own eyes, not helped by an utterly complicit and venal media and an education system that has trumped critical thinking with excessive patriotism for at least 70 years. (pun intended).
Not a pun, my father worked researching radar in WW2 in the same ministry establishment as Mr Trump’s uncle did, leading the US contingent, although the US history reads it as the US teaching the Brits how radar worked. My father continued in that establishment for 40 years, my brother worked there for 49 where he established and ran what I later learned from his ex boss was the best electronic intelligence unit in our country. I was at his side when he was still on the phone, working and in extreme pain as the Ukraine war was raging, when the ambulance arrived to take him to his deathbed. At his funeral a personal commendation from the UK chief of staff said his 50 years of service had saved uncounted lives. Imagine how I felt, when Trump junior chose to stop sharing tactical intelligence with Ukraine a few months later, because he thought he could cut a better deal with Putin.
Every political party and the entire media in the UK from far right to far left now disown Trump entirely, Nothing he says is believed, everything he says is explicitly assumed to a lie designed manipulate reality for his personal financial gain. Even by the BBC. He is universally considered to be a narcissistic psychopath.
Trump is evil. You are delusional.
Don’t listen to anything Trump says. He is in cognitive decline and out of touch with reality. Listen to the Iranian leadership. They are far more reliable and hold the escalation cards. The Strait of Hormuz is filtered. According to Alastair Crook to get through you have to purchase the oil in Chinese currency and pay Iran the current equivalent of about $2 million in Chinese yuan. Iran is strategically attacking the petrodollar system.
Financial markets will go through a great deal of turmoil because some are forced to sell out of necessity (for example Gulf wealth funds) while there is strong inflationary pressure because of the lack of oil, LNG, and fertilizer.
I agree not to listen to anything Trump says.
“Iran holds the escalation cards”
You can’t be serious. They can’t hit the US Navy or Air force with anything.
The USA has 80 nuclear stealth (they might not all be stealth) submarines that could turn Iran into an
Ash Tray.
Not to mention complete air superiority.
And please stop with “Oil in Yuan” baloney.
Yuan’s are only spendable in China.
You can’t trade them on the open market.
Why would you want them????
I get it
I guess
Perhaps it is I who doesn’t match the format, not the other way around
I was looking for a place to learn from others, especially about geology, and to hear the reasons why we are at, or not at, peak oil, or perhaps why we will never reach peak oil. I was expecting a Top Hand to write here as a senior scholar.: someone like the late Autrey Stephens, a fellow who had lived through the lows and highs, learned the business from hard knocks, and made a living doing something he loved. That person, in my view, was Mike Shellman, and damned if you all–in your endless quest for one-ups-man-ship in order to put someone else down–didn’t drive him off.
As I examine all the people writing here, I am simply trying to put a round peg in a square hole. I have never been able to suffer fools gladly, and it has gotten worse with age.
Thanks Dr. Maddoux. The nature of the internet is that people generally do not want to reveal their identity. Not clear how I would verify identities in any case, anyone could make up a name, I am not going to chase down identities.
I take the comments for what is written and allow opinions to be expressed that I don’t agree with and only exclude those who become very abusive and resort to ad hominem arguments and name calling to excess.
Curious if you saw Trump’s truth social post about Robert Mueller’s death, see
https://www.foxnews.com/politics/former-fbi-director-robert-mueller-dies-81-trump-reacts
below we have more presidential reactions from Bush and Obama
https://www.nbcnews.com/politics/politics-news/robert-mueller-former-special-counsel-dies-rcna264561
DC
We’ve discussed global per capita oil availability in the past. I look at your latest shock model, BloombergNEF or IEA forecast on EV adoption rates and Wittgenstein (SSP2) population model. Combined, they appear to suggest that the next decade may be pretty flat for this metric. Does this still track with your view?
T Hill,
I do not think there is likely to be an oil shortage, except in cases of a supply shock (as in Hormuz being shut down). Prices of EVs will decrease over time while oil cost will rise to the point where most land transport will become electric. Oil supply will fall as prices fall due to lack of demand and many resources (Arctic, deep water, and tight oil) will be left in the ground as low oil prices will no longer support their extraction. That’s how I see the long run playing out.
DC, if the fuel needed to build EVs goes up in price how can the price of EVs drop?
Seems to me the capability to expend X units of energy driving a couple tons of personal vehicle around for work, fun and beer came entirely from the fossil fuel explosion, esp. oil. That some vehicles can built with batteries and electric motors doesn’t imply the same energy expenditure can continue when liquid fuels increase in cost and decline in volume.
Seems to me a more realistic path is an inevitable decline in energy use enabled by oil. So EVs may continue in sales, especially markets that aren’t saturated with big personal vehiscles but the energy intensive behavior of having and driving a couple tons of vehicle declines. Driving less and fewer vehicles on the roads will be a more economical means to utilizing a declining energy source.
LeeG,
Very little oil is used to build EVs. They’re built in electrically powered factories, and the amount of oil needed to transport parts and finished vehicles is pretty small.
LeeG,
Prices of goods can drop relative to the price of competing goods as the technology becomes more wide spread. It is the relative price that matters. Higher energy costs raise the prices of all goods, ICEVs and EVs would both increase in price due to higher energy costs. ICEVs are old technology which will see less improvement than a newer technology such as EVs where battery costs are coming down rapidly and charging time is decreasing as the technology improves.
The Chinese are way ahead on this technology and the rest of the World is trying to catch up.
“ Higher energy costs raise the prices of all goods,”
A little. Manufactured goods typically have energy costs in the range of 5% of their overall costs, and most of that is relatively stable electricity. If oil & gas rise in price, they might raise manufacturing costs by 1-2%. Not a big deal.
I think it is callous and mean-spirited to say you’re glad for anyone’s death. That is especially poor behavior for a president. I am not a big fan of Mr. Trump; I’ve made that clear. He is abrasive, and a braggart, and I don’t have much use for those attributes.
But we are at war, and my president needs my support. I truly believe that he had solid intelligence that Iran was close to getting the nuclear warhead, and already had the missile. He felt he had to intervene. I support him in that. I don’t think much of his messaging, but his tactics of obfuscating the issue by saying something outrageous and then doing something else outrageous, I understand.
In the world where I worked, words were much less impressive than actions. I listened to many professors who could write well, and even inspire others, but who couldn’t do. They couldn’t operate, or even in many cases put in the long nighttime hours to take care of people. So they talked. And they got good at it. I value that greatly, when it is done seriously.
Mr. Obama is an eloquent speaker and an even better writer. I voted for him twice. But he lost me when he loaded $1.9B on an airplane and gave it to the mullahs. I didn’t go around shouting obscenities about him, because he was my president. But I was dismayed. And I quietly lost my respect for him. Mr. Biden was simply inept, and likely profoundly demented. I was quiet about my feelings, though I was embarrassed for him and felt that he was doing harm to the country.
I get what you’ve tried to put together here. It seems to work for you and Mr. Patterson and even Ovi. It doesn’t work for me. It usually winds up irritating me. But I’m the one at odds with the majority here, and even I can finally appreciate that. I will never think using aliases is any way to achieve a conversation that is to be taken seriously but rather is mostly for either someone to show off something he just learned from the Internet or to vent his rage about someone (Trump), or something (end of the world is coming). I have learned from the experience, and that’s my goal.
Dr Maddoux,
Perhaps Biden also thought allowing Iran access to its money (that the US had frozen) was a bad idea. He seemed to do little to try to reinstate the previous JCPOA.
In my view the JCPOA was not perfect, but was certainly better than nothing. Most intelligence analysts believe that Iran was not close to accessing a nuclear weapon. The “experts” that Trump was listening to were his lawyer and son-in-law, they are not experts.
Trump made a bad decision in going to war in my view, perhaps things will work out for the best as you hope, I also hope you are correct, but recent US history in Iraq and Afgahnistan seems a cautionary tale, perhaps this case will be different, one can hope or pray that a democratic government is elected in Iran and there is peace and prosperity in the Middle East and indeed the World. Sounds unrealistic though.
Dennis.
I’m just saying I’m not. I don’t feel I’m a liberal or conservative.
Of course there are all kinds of people who would consider themselves liberal who are Christians, gun owners and other things the Republicans claim are their constituents. I personally know many in this category, including my father-in-law, who passed less than two years ago. He believed in unions and worked in the power house of a coal fired power plant. He rarely voted Republican. He went to church every Sunday he wasn’t pulling a 12 hour shift. 1/8 Cherokee. Big time outdoorsman. Hunter. Bass fisher. Heck of a man.
I was just pointing out that the people here aren’t some monolithic group. We have distinct views but can generally discuss them civilly.
Hope no offense taken?
I think humans have an instinct to identify with groups – families and extended families of various sorts. But, it’s not really a great idea to go with that tendency.
I also think that humans have the ability work with that instinct, and identify with a very wide range of people – in fact, I think people really can think of all humans as their family.
Human instincts are flexible. Think of adoption – people love adopted children as if they were genetically theirs. Humans are flexible.
I try to not think of myself as a democrat or republican – it boxes in your thinking.
Religion at a certain point extended human identification to a much wider range of people. This was a big advance over tribes and extended families.
But now we need to go further – to countries (patriotism!), and even wider than that. I’m not too good at that yet, but I’m giving it a try.
Shallow sand,
No offense taken at all. I also consider myself as fairly close to the center in my views, perhaps center-left.
Shallow Sand,
I find your perspective to be refreshing. Not on any particular issue but because you do not simply see things in black and white. Plenty of thoughtful nuance. Thanks for that.
I work to be in the same place.
And thanks for sharing your observations from your place in the world. I’ve not lived in the Mississippi watershed except for a 4 year stint in Louisiana (not urban). And have no experience with owning/operating oil wells. It is very useful to hear about parts of the economy and culture that we may not be familiar with, and to know people from many cultures.
One of the gifts of training/working in the medical sector for a long time is that I have had colleges and co-workers from dozens of countries (physicians from Haiti, Korea, Egypt, Vietnam, Nicaragua, Russia, Iran, Thailand,Turkey, as a few examples) and also most religions. It has been certainly enriching, all working together as teammates.
Mike Shellman,
Ovi and Dennis only post about oil and gas.
So it is a pure hubris that you bring all these political stuff at a time when US is extracting more Hydrocarbons than ever. Hence, there is plenty to talk about.
I still believe that you are a high caliber of a person.
https://www.dailymail.co.uk/news/article-15673737/Pete-think-you-one-say-lets-Moment-Hegseth-forces-smile-Trump-suggests-Iran-war-idea-conflict-causes-economic-chaos.html
Trump blames Hegeseth for the Iran war
1) Make irrational, impulsive and bullying decisions.
2) When they inevitably go wrong, blame someone else.
RINSE and REPEAT
https://www.nbcnews.com/news/us-news/large-oil-refinery-explosion-texas-coast-forces-residents-shelter-plac-rcna264853
Large Texas oil refinery explosion
A new post is up.
https://peakoilbarrel.com/short-term-energy-outlook-march-2026/