A guest post by Ovi
All of the oil (C + C) production data for the US state charts comes from the EIAʼ’s Petroleum Supply monthly PSM.
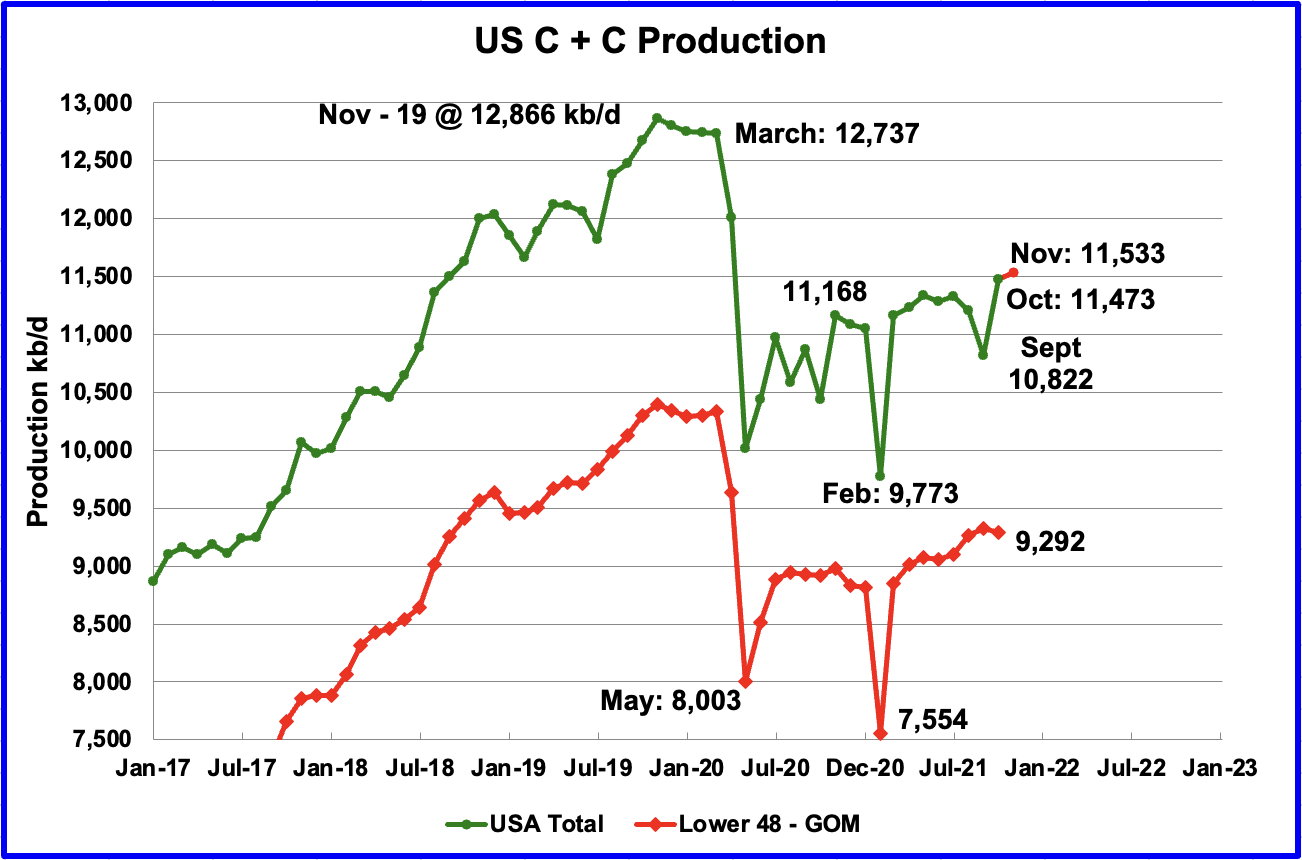
U.S. October production rebounded by 651 kb/d to 11,473 kb/d. The rebound is largely due to increased production in the GOM. GOM output increased by 680 kb/d after the damaged platforms were repaired and brought back on line. The one red marker is the MER’s output expectation for November.
While overall US production was up, a better indication of the health of the US oil industry can be gleaned by looking more closely at the on-shore L48 states. In the on-shore lower 48, October production decreased by 36 kb/d to 9,292 kb/d. The main contributors to the decrease were Texas and New Mexico, partially offset by gains in Colorado and Louisiana.
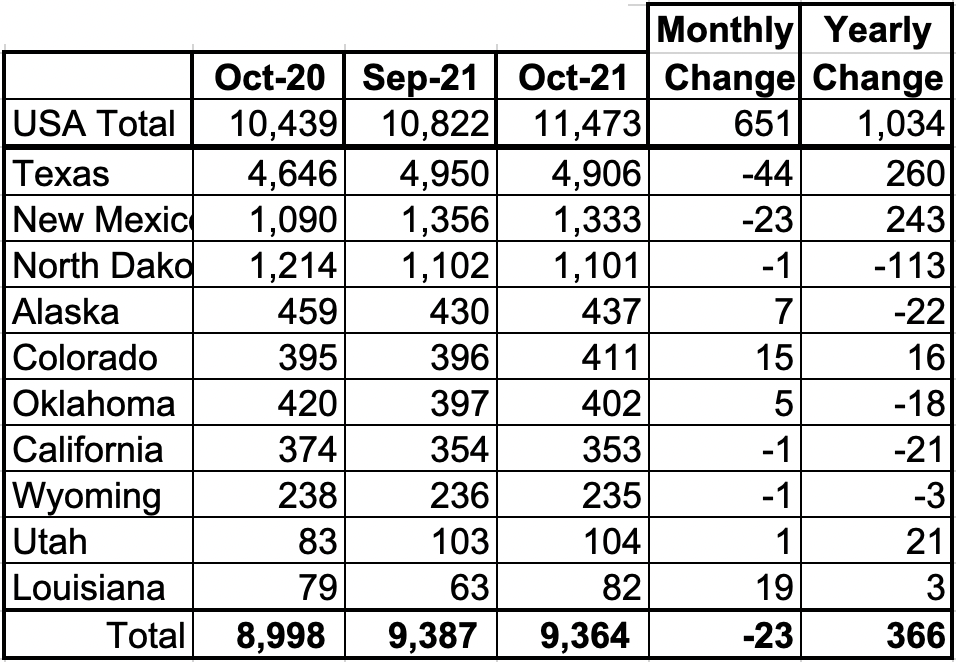
Listed above are the 10 states with the largest US production. These 10 accounted for 81.6% of US production out of a total production of 11,473 kb/d in October 2021.
Of the 23 kb/d MoM decrease from these ten states, the largest drops came from Texas with 44 kb/d and New Mexico with 23, offset by gains in Colorado and Louisiana. On a YoY basis, US production increased by 1,034 kb/d.
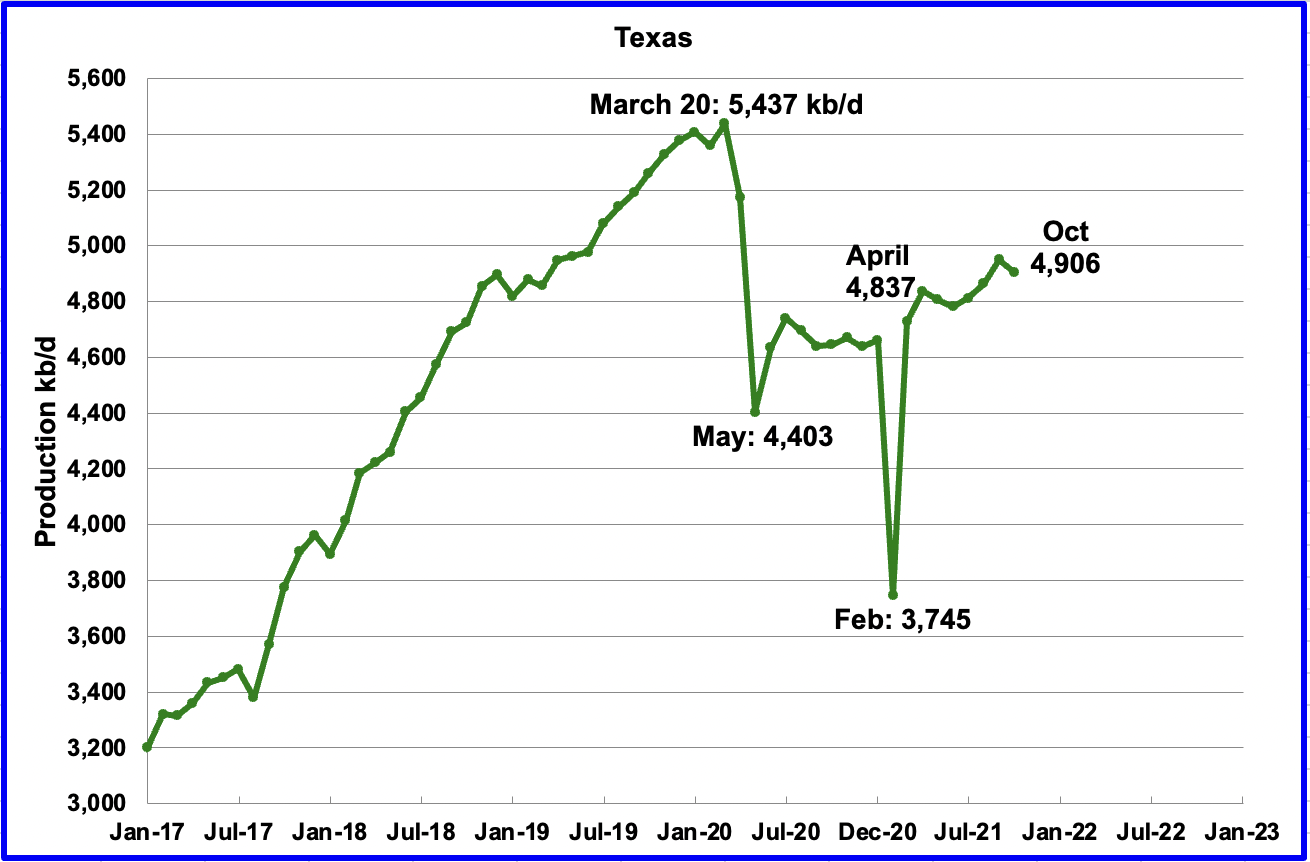
Texas production decreased by 44 kb/d in October to 4,906 kb/d. Relative to April 2021, production is up by 69 kb/d, or an average of 11.5 kb/d/mth.
In August there were close to 211 oil rigs operating in Texas. By the last week of October, 233 oil rigs were operating, an increase of 22 rigs and production was down. Surprising?
At the end of 2022, 253 oil rigs were operational.
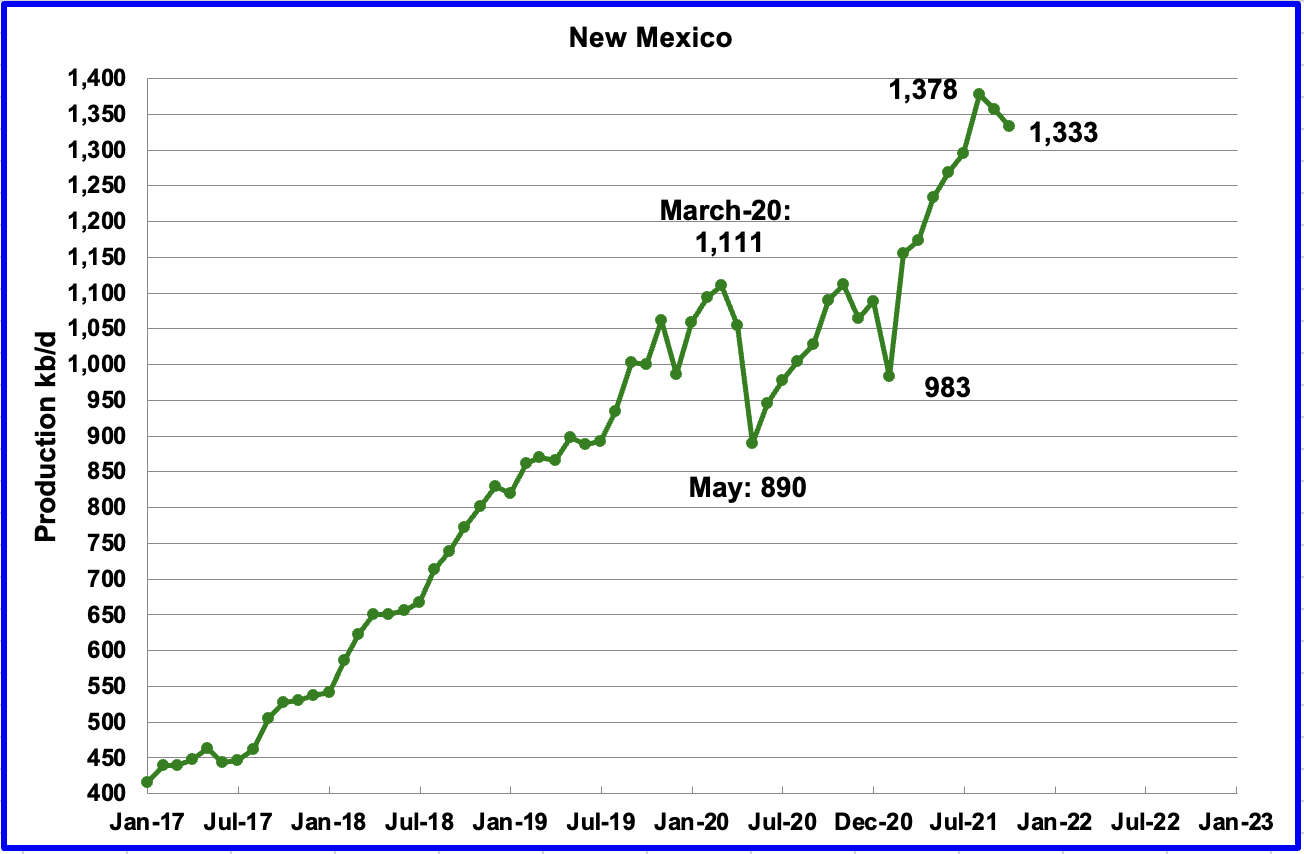
October’s New Mexico production dropped for a second month in a row by 23 kb/d to 1,333 kb/d. While October is showing a drop, it should be noted that August’s original 1,346 kb/d was revised up by 32 kb/d to 1,378 kb/d in today’s PSM.
In July 75 oil rigs were operating. By October they had increased to 85 and to 94 by year end. It is not clear why New Mexico’s output dropped in September and October with the increasing rig count. While there may be future upward revisions, it is unlikely that the two month downward trend shown will change.
There appears to be a disconnect between the DPR/LTO reports which show estimated and increasing production in the Permian and the two months of output decreases in New Mexico and a one month decrease in Texas as reported by the EIA actual production numbers.
Recall the DPR/LTO output data published in the previous post showed no signs of a production decrease in the Permian. For reference recall the next chart that was posted last week in the previous post.
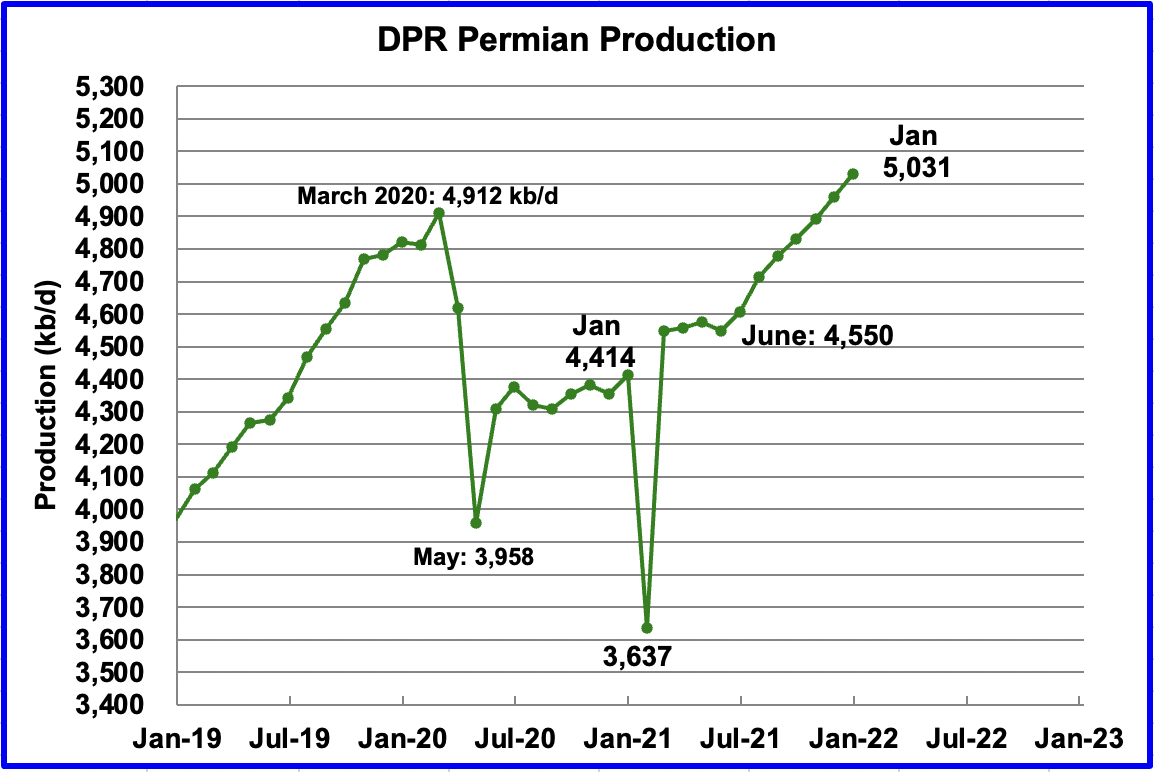
Permian output, as shown in the previous post, is projected to reach a new production high of 5,031 kb/d in January. From June to January production is forecast to increase by 481 kb/d or at an average rate of 68.7 kb/d/mth.
There is a definite disconnect between this chart and the previous two for the months of September and October.
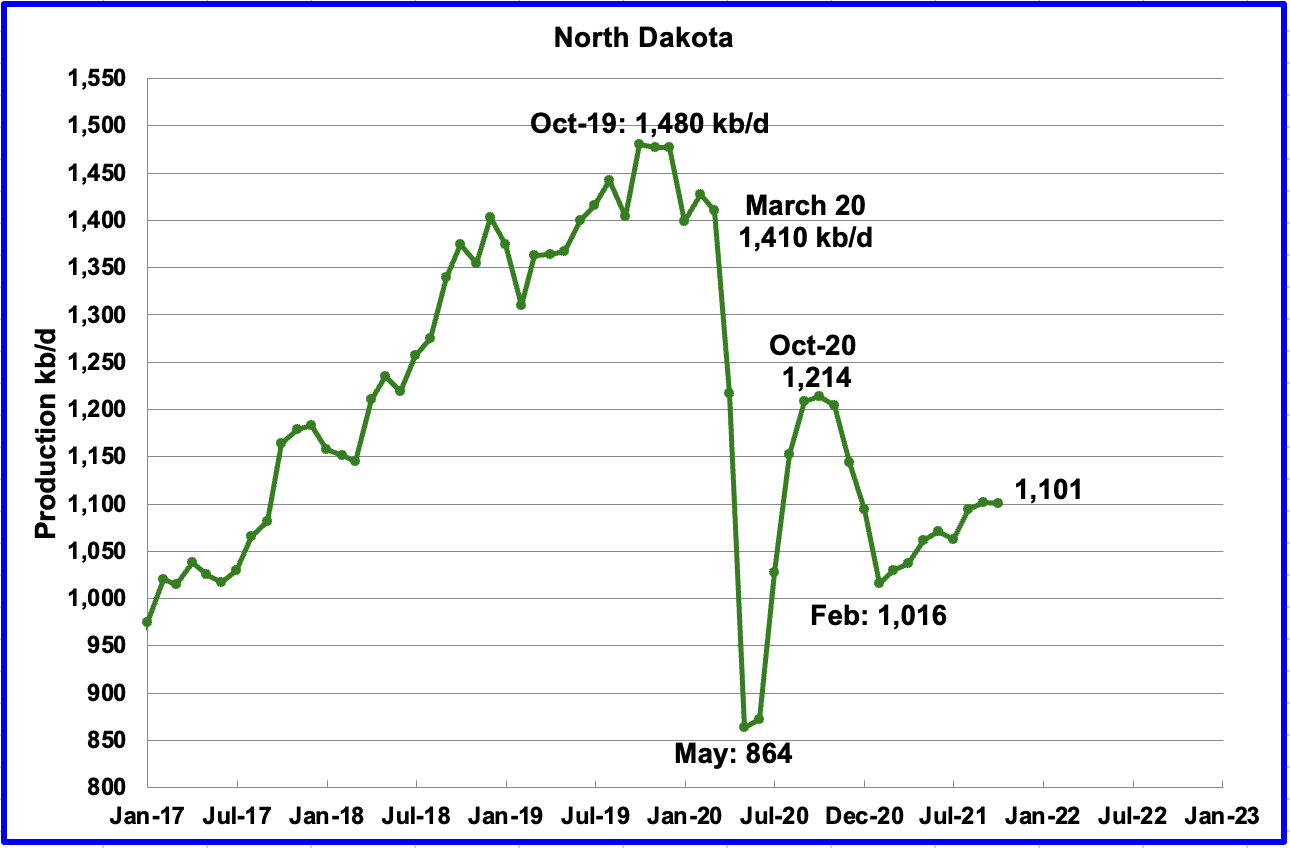
According to the EIA, North Dakota’s October output was 1,101 kb/d, a decrease of 1 kb/d from September. This flattening of output in North Dakota is more consistent with the LTO/DPR reports posted last week.
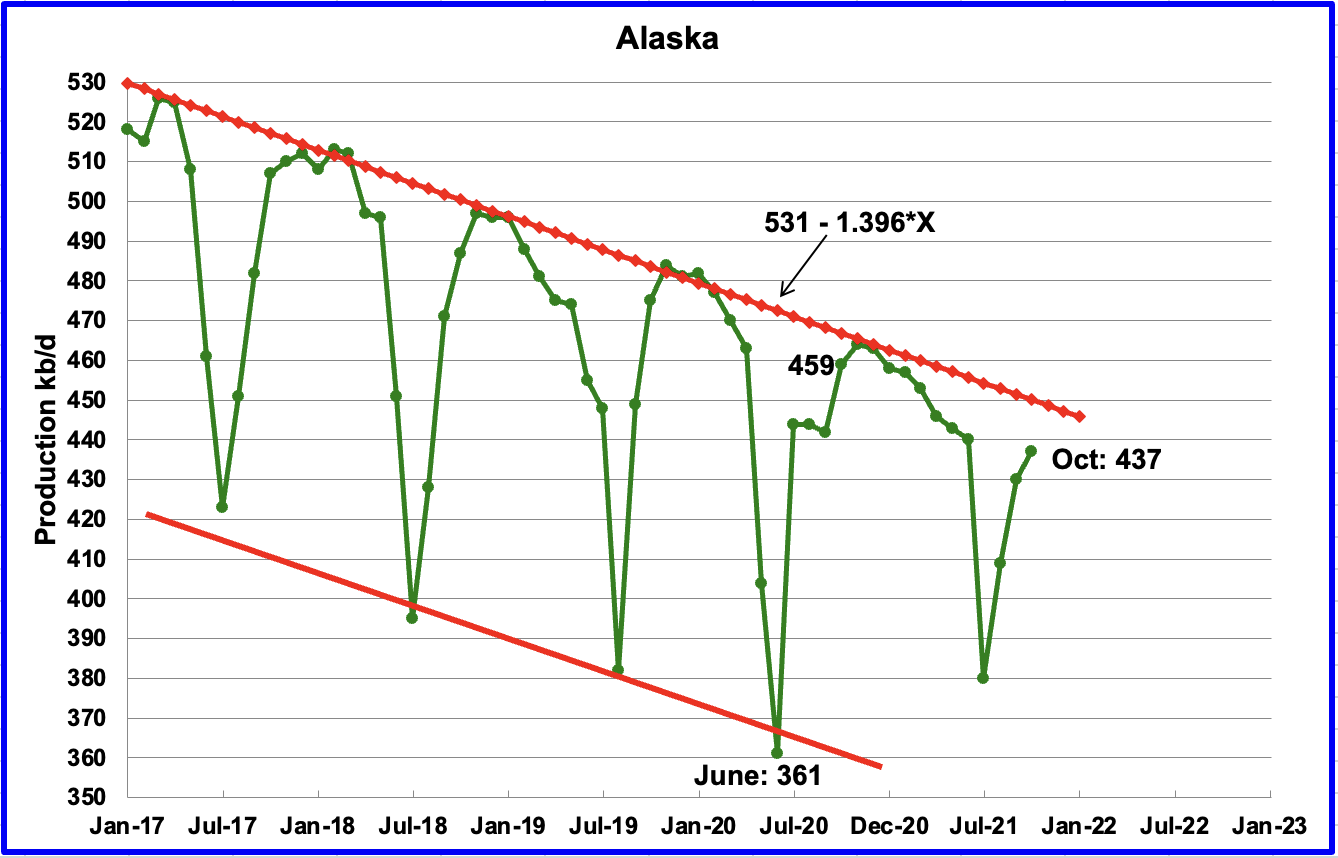
Alaskaʼ s October output increased by 7 kb/d to 437 kb/d as maintenance was completed. One year ago, production was 459 kb/d in October, 22 kb/d higher than this year’s 437 kb/d. According to the red trend lines, the annual drop rate is closer 16.75 kb/d/yr (12 x 1.396).
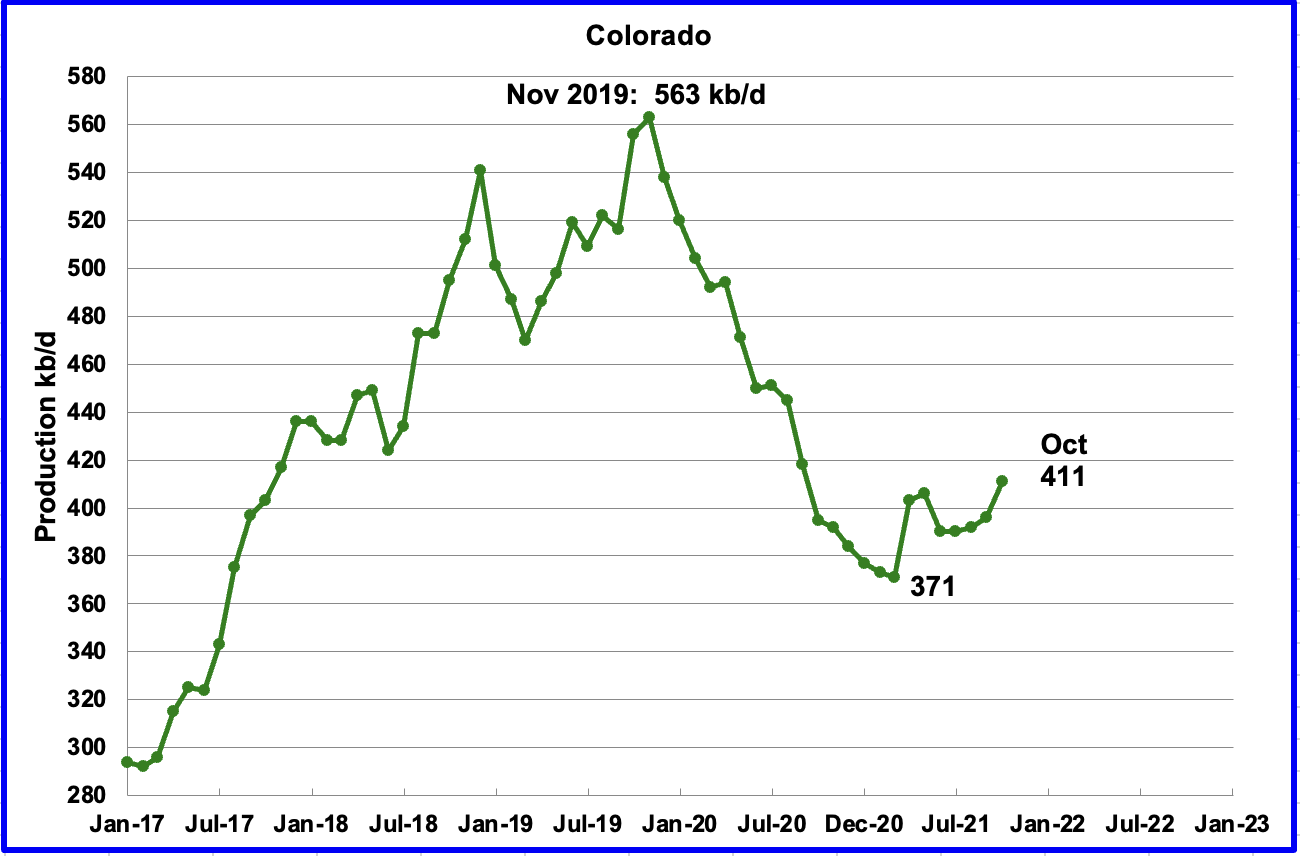
Coloradoʼ s October output increased by 15 kb/d to 411 kb/d. Colorado had an average of 9 rigs operating in October down from 10 in July and production increased.
Here is a headline from. “Occidental’s oil production, drilling pace rise in Colorado as prices and profit return”. Unfortunately it is behind a paywall.
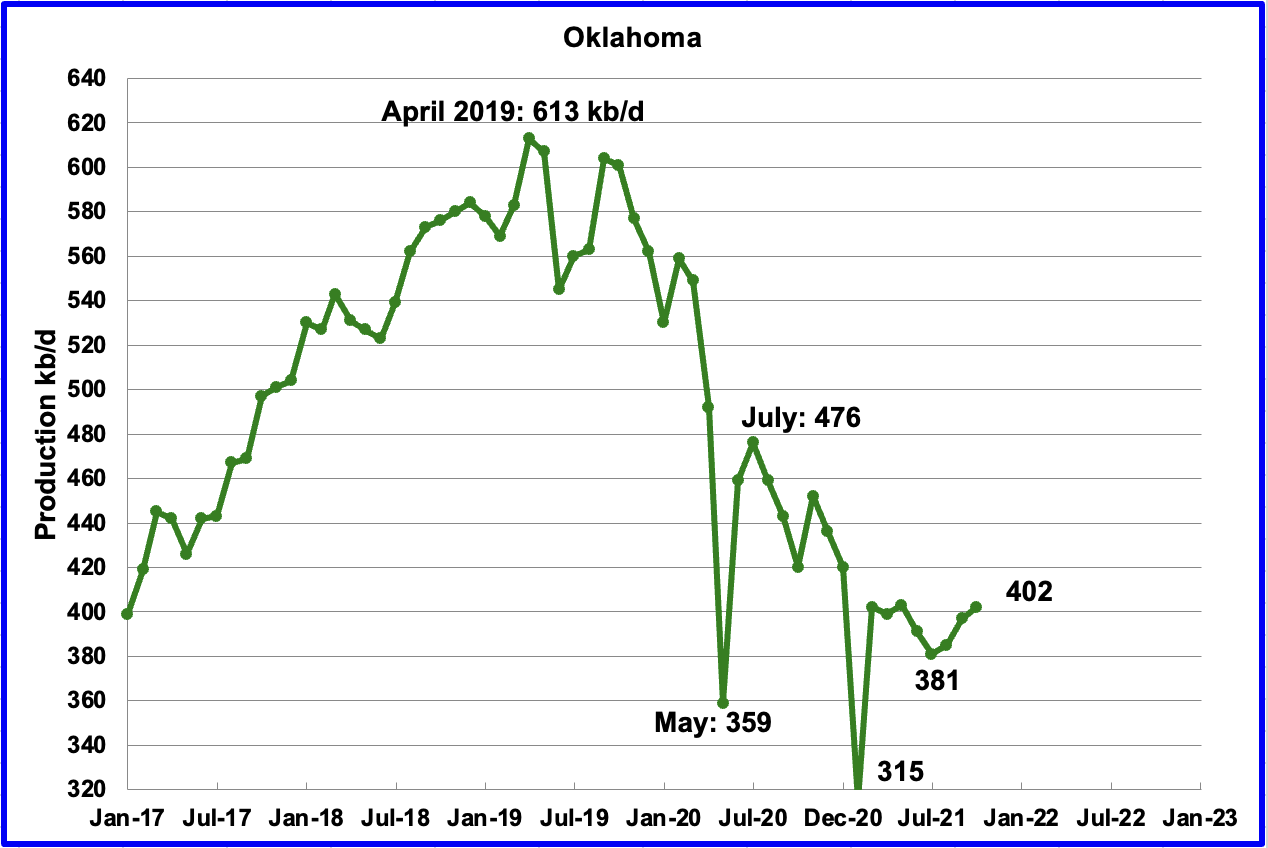
Oklahoma’s output in October increased by 5 kb/d to 402 kb/d.
During August, Oklahoma had 29 rigs operating and by the end of October they increased to 43. By year end 49 were operational. The increase in rigs has managed to turn production around.
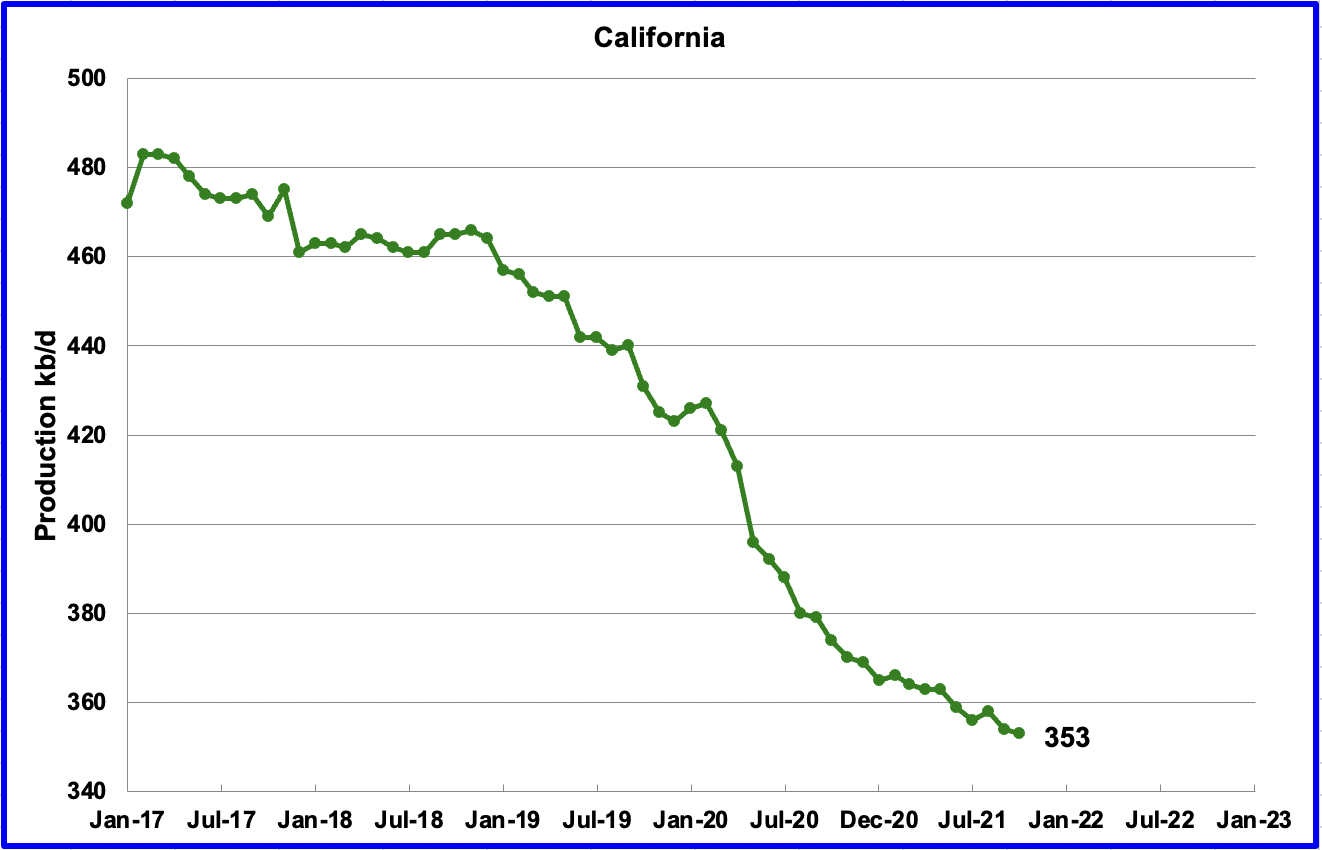
Californiaʼ s slow output decline continued in October. Output decreased by 1 kb/d to 353 kb/d.
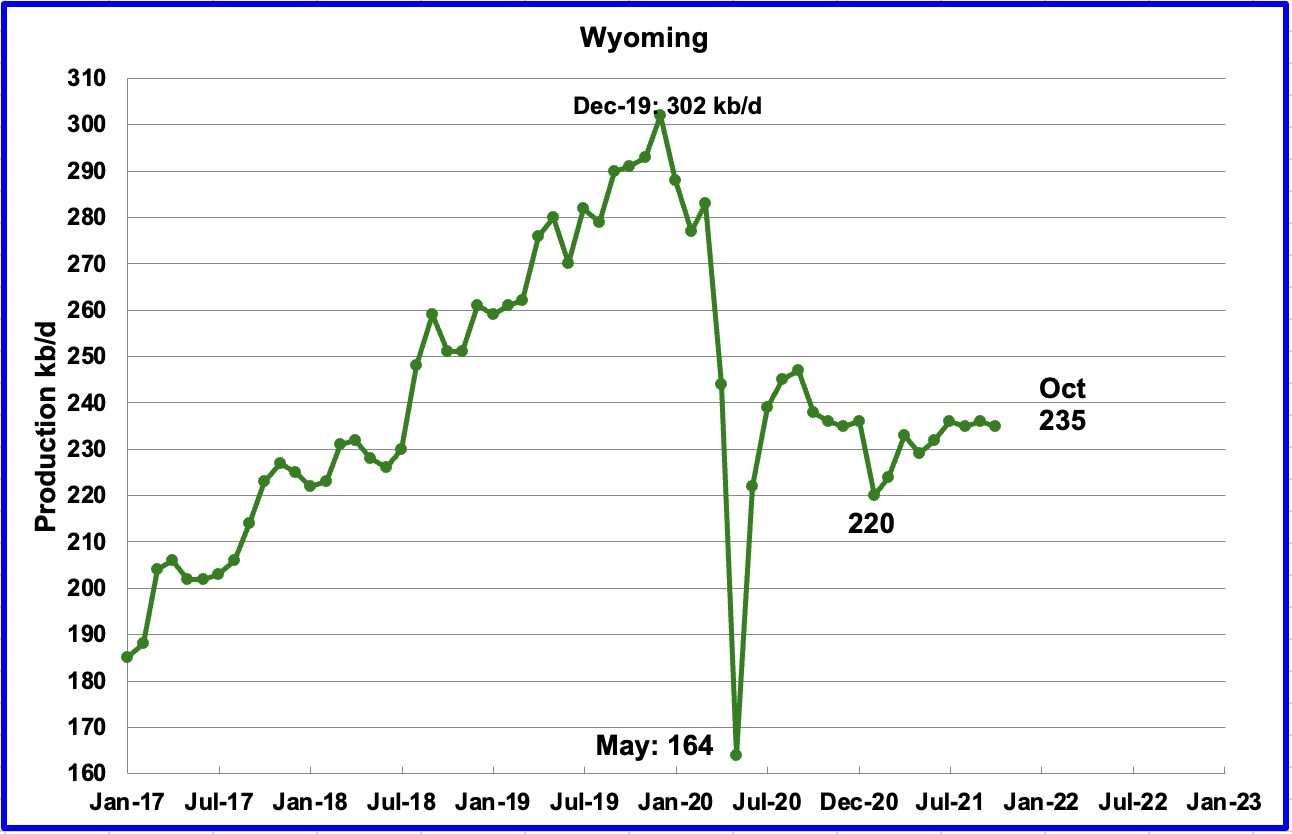
Wyoming’s production has been essentially flat since March. In October output decreased by 1 kb/d to 235 kb/d. Wyoming had 17 oil rigs operating in September but by the end of December had decreased to 13.
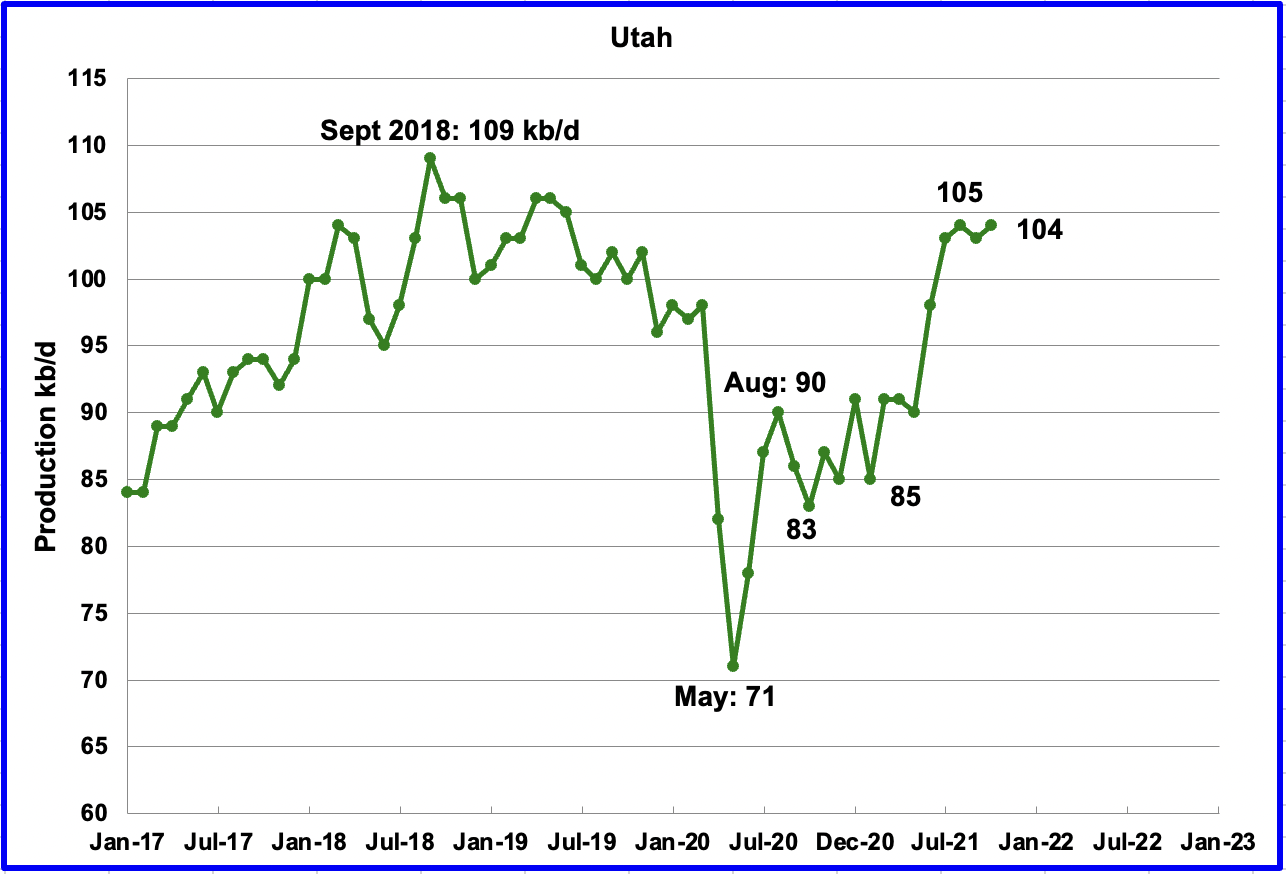
October’s production increased by 1 kb/d to 104 kb/d. Utah had 11 oil rigs operating in September and by December the number had dropped to 8.
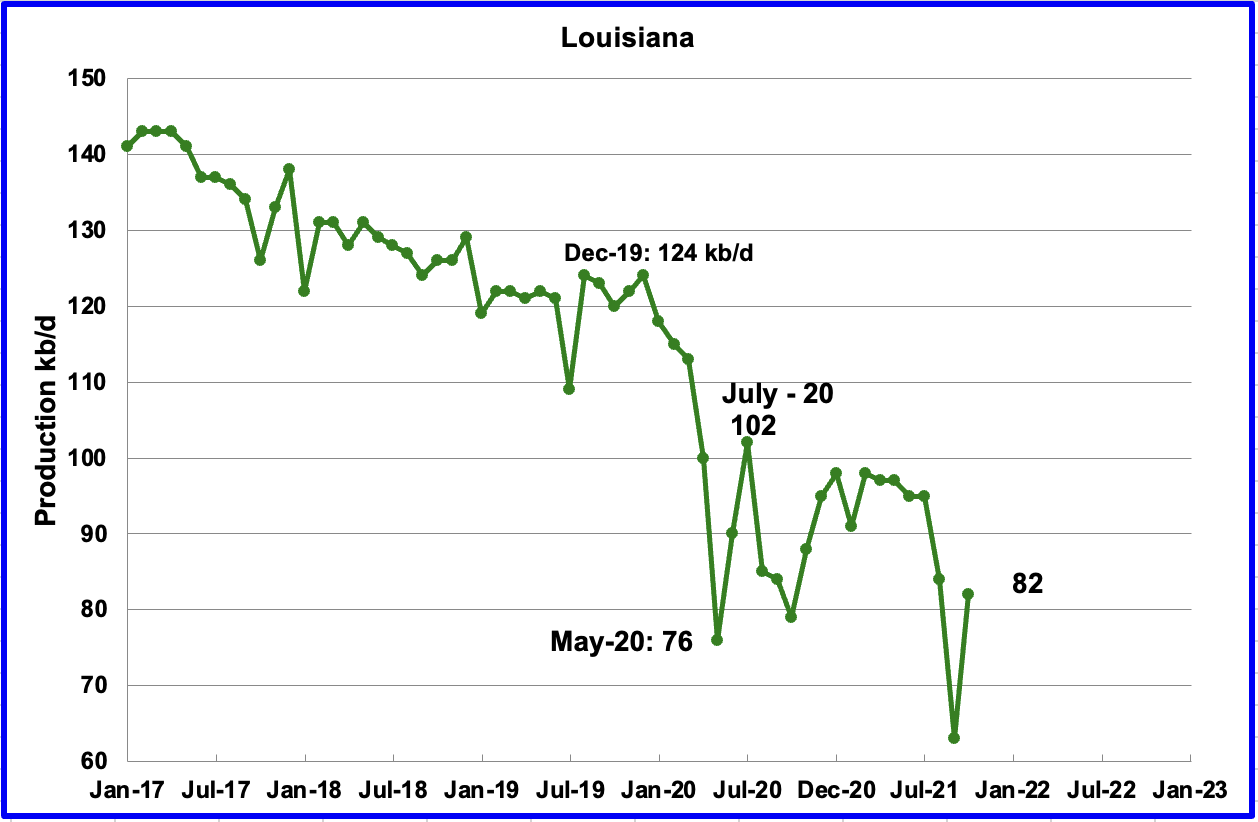
Louisiana’s output increased by 19 kb/d to 82 kb/d in October. Louisiana was one of the hardest hit states by hurricane Ida in late August. October’s output increase indicates that Louisiana is on the road to recovery.
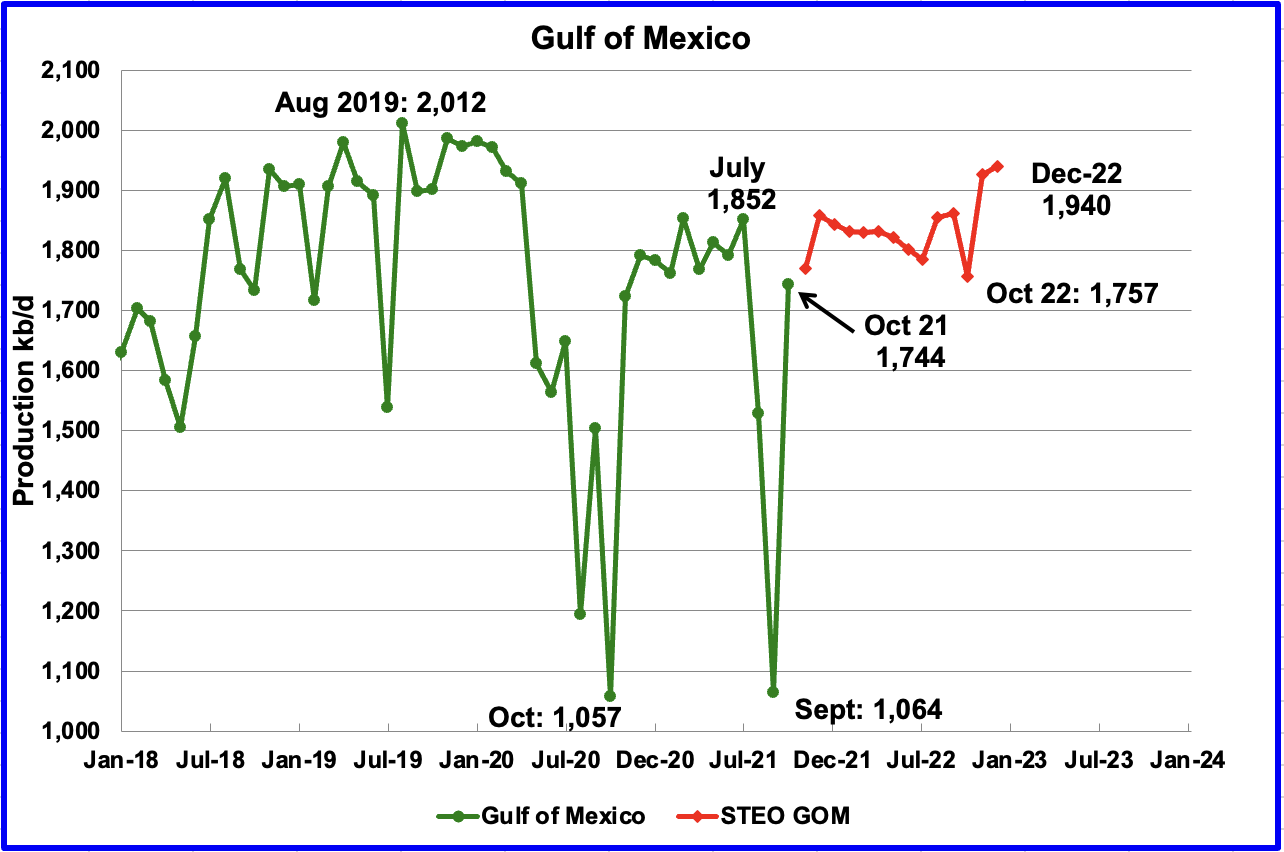
Production from the GOM increased in October by 680 kb/d from 1,084 kb/d to 1,744 kb/d. If the GOM was a state, its production would normally rank second behind Texas.
The December STEO projection for the GOM output has been added to this chart and projects output will be 1,940 kb/d in December 2022. The December STEO forecast for the GOM output for October 2021 was 1,700 kb/d, a very good estimate, off by only 44 kb/d.
A Different Perspective on US Oil Production
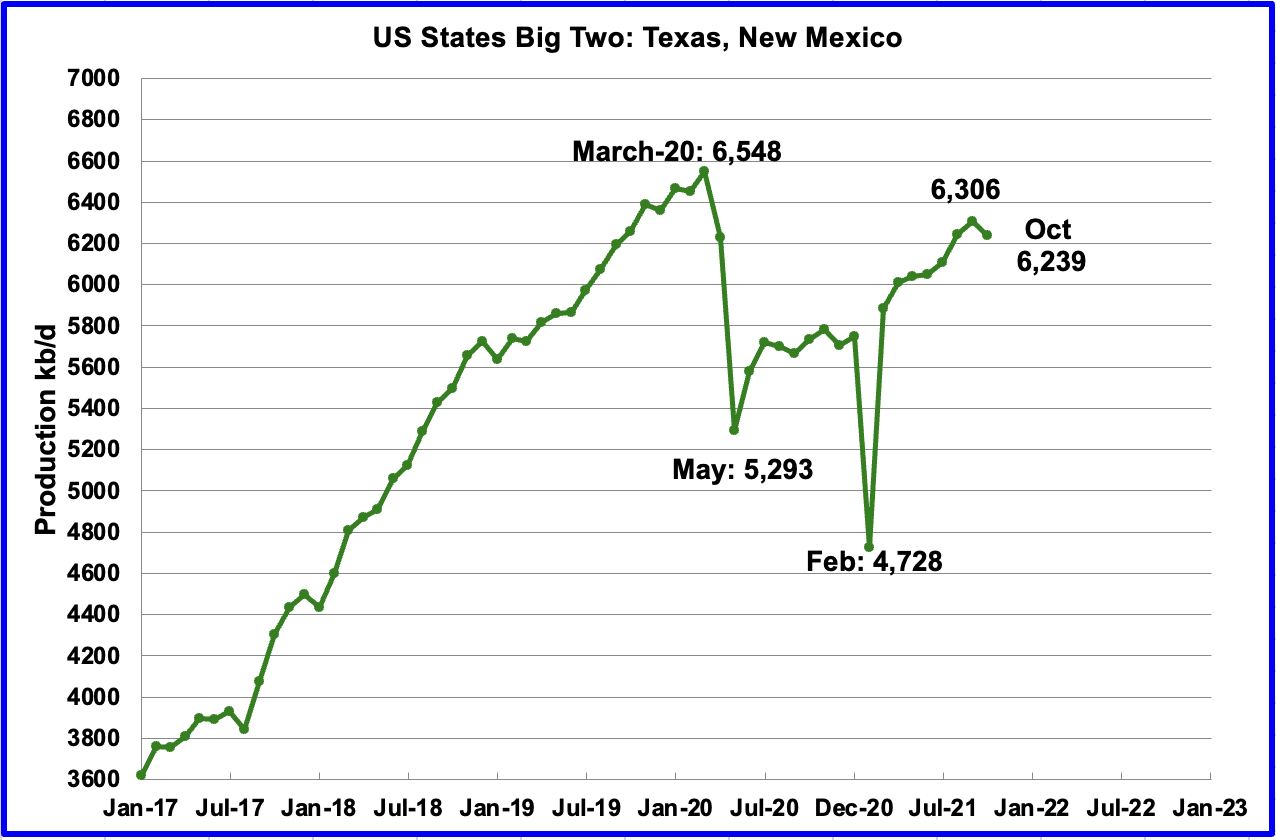
The Big Two states
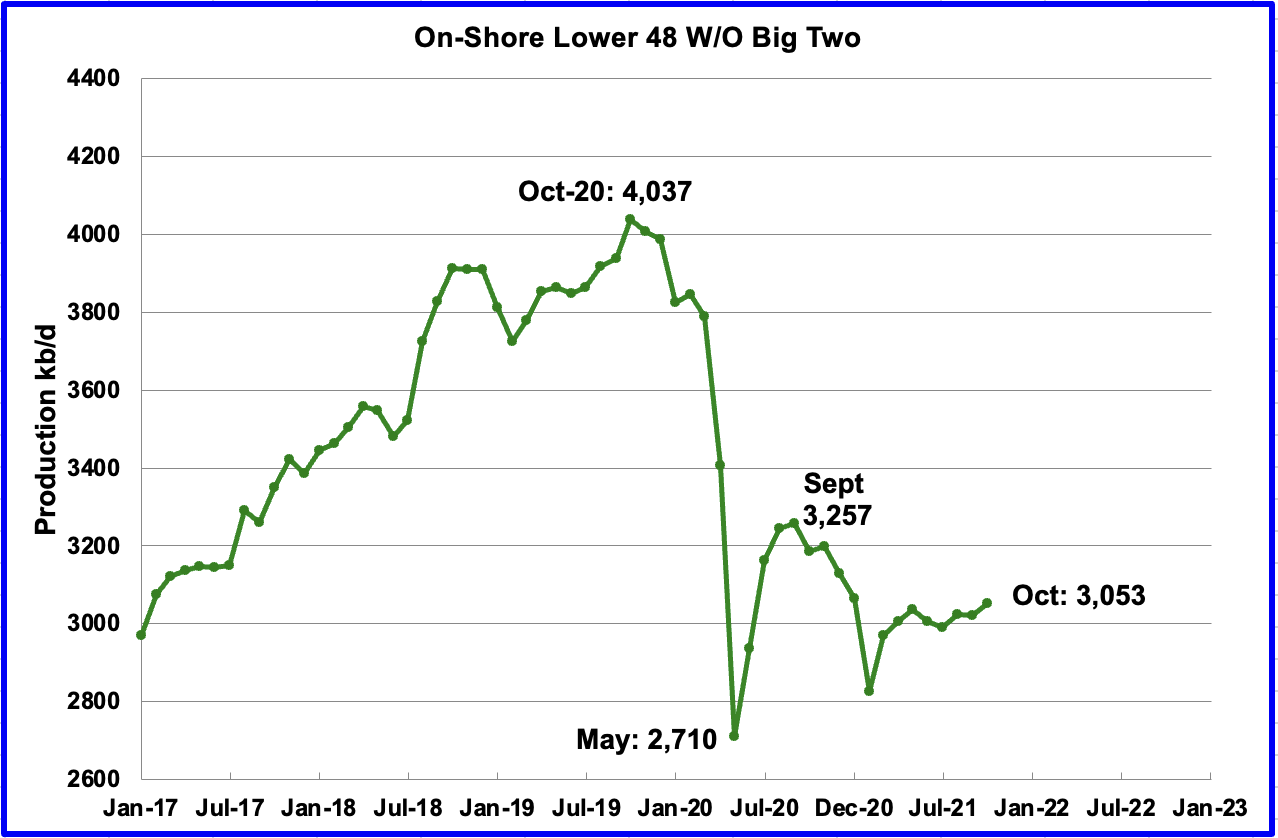
The Rest
To get a different perspective on US oil production, the above two charts have broken US production into “The Big Two” and the “On-Shore L48 W/O Big Two” or The Rest.
The production decrease in the Big Two states is a big shock and surprise. The output from these two states is from the Permian and the Eagle Ford basins. Since the Eagle Ford’s output is essentially flat, the output from these two states reflects what is really happening in the Permian.
The rest of the L48 states show a very small increase of 48 kb/d since April. Of the 31 kb/d increase in October, 19 kb/d came from Louisiana which is recovering from the shut down of wells due to hurricane Ida.
Rigs
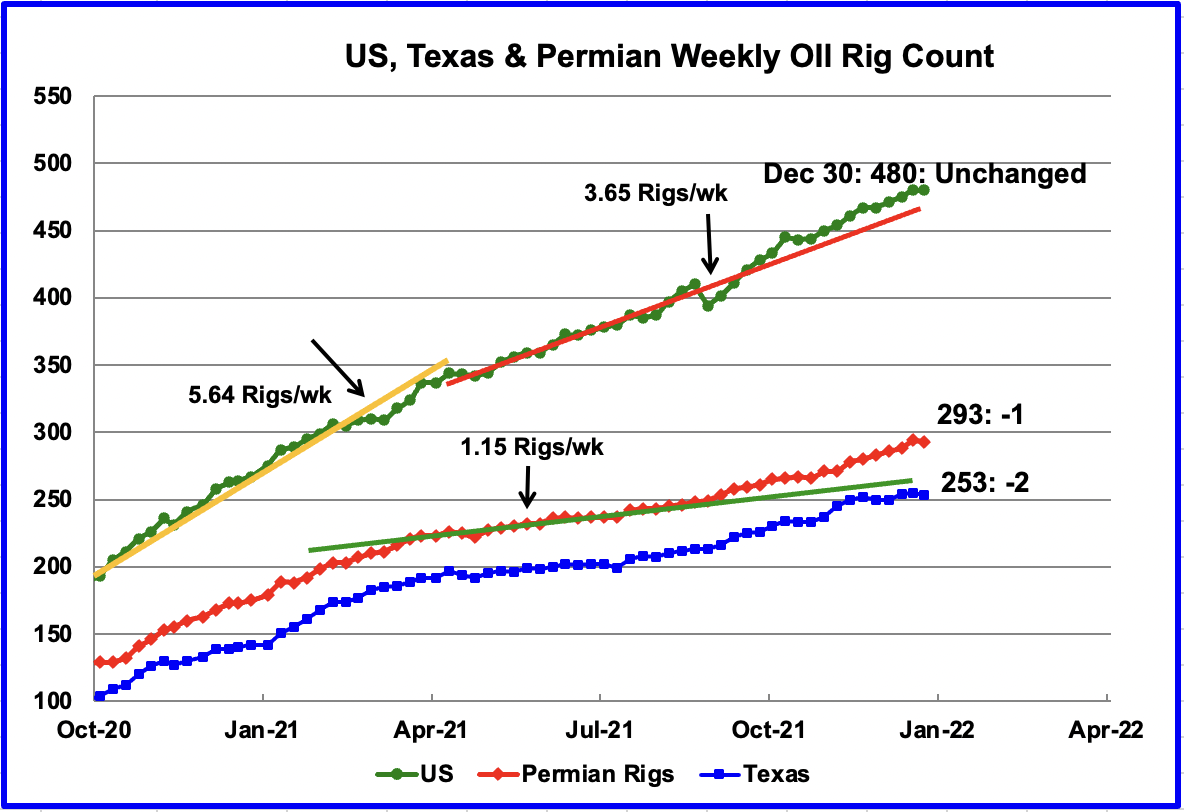
Since the beginning of April, the US has been adding oil rigs at a rate of close to 3.65 rigs/wk. Of these, the Permian has been adding 1.15 rigs/wk over the period April to early September. This means that more rigs were being added in other basins and states. The total oil rig count for the week ending Dec 31 was unchanged at 480.
Since the end of September, the addition of rigs in the Permian basin has accelerated over the average rate as the red graph breaks away to the upside from the green trend line. In the week ending December 31, the Permian rig count dropped by 1 to 293.
WTI
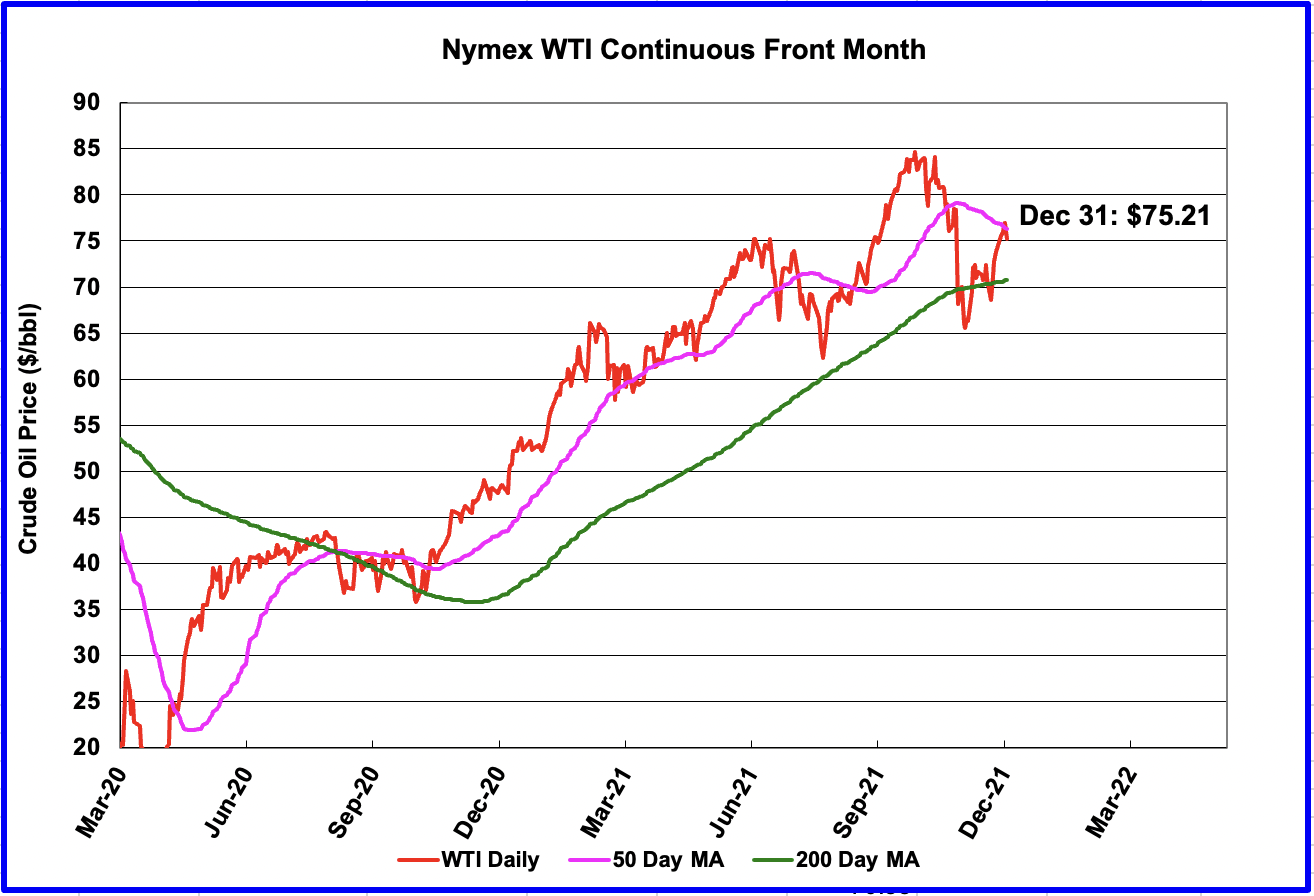
The WTI February contract settled on December 31 just below the 50 day moving average at $75.21/bbl. The recovery from the August low of $62.32/bbl can largely be attributed to the initial over reaction to the Omicron variant and how it would affect the economy and oil demand.
On December 31, after settling above the 50 day MA, WTI dropped below the 50 day MA because the market believed that OPEC + would add an additional 400 kb/d of supply to the market and possibly over supply it. However some OPEC and Non-OPEC participants have not been able to meet their output target and the February increase would help offset OPEC’s + pledge shortfall.
World Oil Production
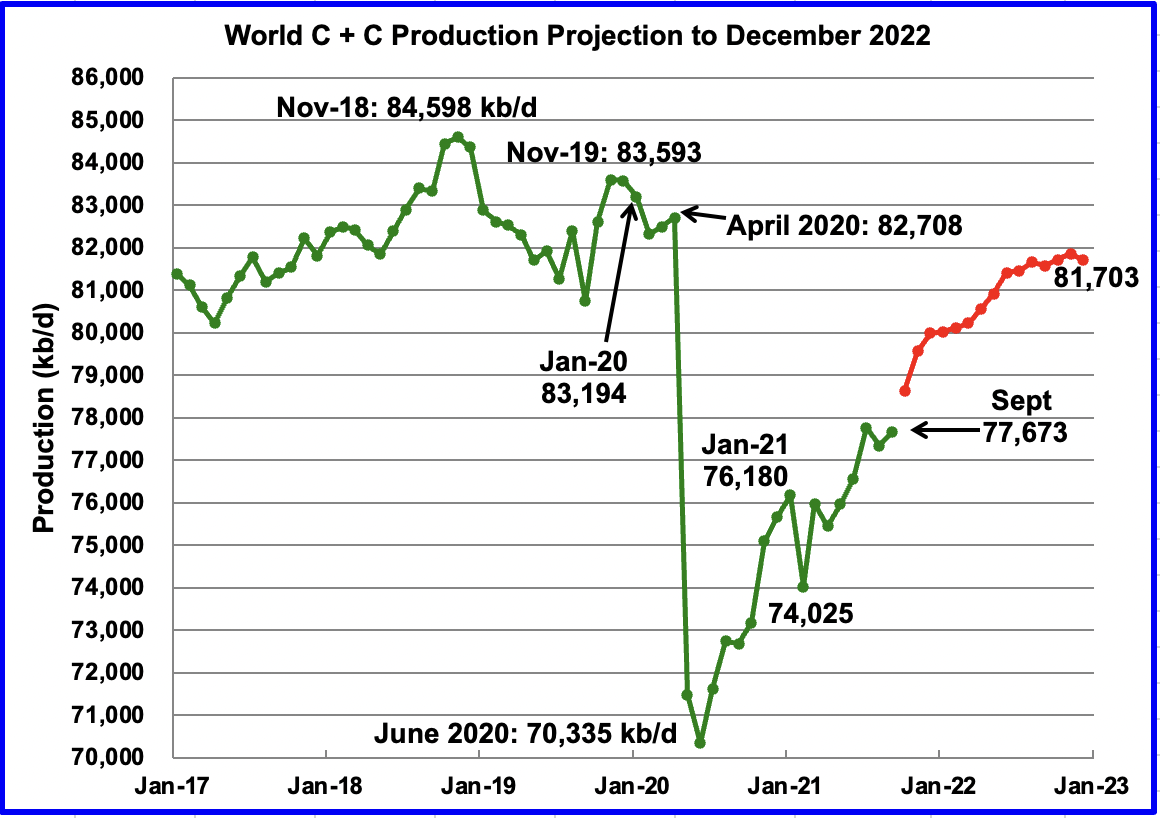
World oil production increased in September by 330 kb/d to 77,673 kb/d according to the EIA. Of the 330 kb/d increase, the two biggest contributors to the increase were Russia 250 kb/d and Kazakhstan 76 kb/d. US output dropped by 381 kb/d.
This chart also projects World oil production out to December 2022. It uses the December STEO report along with the International Energy Statistics to make the projection. (Red markers) It projects that World oil production in December 2022 will be 81,703 kb/d, 1,491 kb/d lower than the January 2020 pre-pandemic output of 83,194 kb/d.

A Happy, Healthy and Prosperous New Year to all.
212 responses to “US October Oil Production Rebounds after Hurricane Ida”
Any idea about what caused the reduced production in the Permian — running out of DUCs and/or sweet spots?
That would have been my first question too, a bit counterintuative with rising rig count and falling production…
My other question would be about the ports in Louisiana, south of New Orleans, they took quite a hit that might influence overall GOM production for quite some time?
Btw. Happy new, brave year to everyone!
Laplander,
I think you’re referring to damage to the West Delta 143 platform in shallow water that is a hub for Shell pipelines that come primarily from their deepwater Mars-Ursa area. The impact has been largely mitigated as of early November,, not sure if all the repairs are completed, or if they found workarounds to get the oil onshore.
Thats one part, but I think there were also quite some damage at the onshore facilities supporting the offshore operations, LOOP was also mentioned during the events.
Laplander,
Thanks, I didn’t know that about LOOP damages.
Just checked it out and it appears that the LOOP has been back on line since about 2 weeks after Ida.
There probably were other damages also, but with GOM production over 1.7 mmbopd for October, I think things are pretty much back to normal.
Thank´s for the info, will keep an eye on the numbers but sounds good.
Albeit we in northern Europe mostly rely on other sources a production drop at this point would still not be optimal for several reasons…
Frugal/Laplander
Dennis has some thoughts below. I am at a total loss.
Each winter seems to have a dip for a few weeks, presumably weather related; last winter it was in mid February, this one started in early December. Only total frac spread numbers are available without paying but most of the activity is in TX and NM so presumably have been heavily impacted. The current dip interrupted a pattern where the numbers seemed t be growing asymptotically to around 290 (red) afer the Covid collapse.
Further back the spread numbers started to decline in early 2018, even as prices (green) bounced around $60. Continuing that decline trend linearly would give numbers about where they are now plateauing. Since the pandemic trough price increments have only had about 60% as much impact on numbers than before, and with the plateauing maybe less than that now.
I wonder if the dip in Frack spreads is due to the holidays, seems to happen for many years around the start of the year. The big dip in February 2021 was the winter storm that knocked out power in Texas.
It appears that DUC inventories have to be kept at 3-4 months as a minimum. As they fall towards this from about 6 months rigs are added. Niobrara was the first area to reach the limit. The difference number shown is completions minus drilled, and over time this would need to average just under zero. The Permian is getting there now and it has been starting to add rigs recently, it will be interesting how it changes after the dip in spreads (i.e. add spreads and more rigs or leave spreads low with fewer new rigs – probably with the expected impact of Omicron deciding). Frac spreads are much more resource intense than rigs so their numbers are more affected by lack of human, capital or material resources.
Permian
Thanks George,
great stuff. Could you check your email please?
Thanks Ovi . Cool . A Different Perspective on US Oil Production now that is what I call a ” performance ” . Peak USA in 2028-2030 etc ? Well my granddaughter believes in the tooth fairy . Who am I to argue ?
Ovi,
Note that the LTO report is not a projection, it is the official EIA estimate of tight oil output. It is possible that conventional production in New Mexico and Texas has decreased, also I disagree that the decline in Texas and New Mexico is likely to continue beyond October. I agree that in the future there will likely be revisions.
Chart below has Texas and New Mexico’s conventional C plus C output. The big drop in October will likely be revised up in the future in my opinion.
Chart below compares shaleprofile.com supply projection with EIA official estimates from March 2021 to November 2021for Texas plus New Mexico tight oil output (units are kilobarrels of oil per day on vertical axis.)
Another comparison of US tight oil official estimate with the shaleprofile.com supply projection for all US tight oil output.
Shale profile estimate from link below,
https://shaleprofile.com/us-tight-oil-gas-projection/
Dennis
I should have been a little more clear where I made that comment “While there may be future upward revisions, it is unlikely that the downward trend will change”
I did not mean it would continue forever. I just meant to say the the revisions would not change the two month down trend. I have made a slight revision to the statement to clarify my intent: “While there may be future upward revisions, it is unlikely that the two month downward trend shown will change”
Ovi,
Yes I misread what you were saying, I thought that you meant that the two month trend was likely to continue into the future, but I misread, my apologies.
I don’t know if future revisions will be higher or lower, but there is a big downdraft in conventional production in New Mexico and Texas in October if both tight oil estimates and PSM estimates for October are correct, both are likely to be revised. Interesting that shaleprofile seems to have even more optimistic estimates for Texas and New Mexico than the EIA, though part of this difference is the “rest of US tight oil” category which may include some New Mexico and Texas tight oil output from other formations besides Wolfcamp, Bonespring, Spraberry, Eagle Ford, and Austin Chalk.
Thanks for a very interesting post Ovi and Happy New Year.
This might exsplain the storage draw. If US shale have peaked at WTI 75 usd breake even price have in few years increased from about 30 usd to 75. As we also know capex will increase in 2022.
What happen when the drilling will be reduced, I doubt GOM will compensate much off that.
Than EIA predict Opec and Russia will solve the energy crizis. Do they have enough spare capacity.
This is a very serious situation and electricity prices in Europe is now treatening industries and many pepole will lost their jobs and homes. The latest news now is the Eu parlament want to add petroleum gas and Newclear energy to the green list. It takes time to build new powerplants or find, set in production new gaz field.
In the case of nuclear, as currently built, it is both time consuming to build and expensive, around 100 E/Mwh, give or take so cheap electricity can be considered a thing of the past (unless you have a windmill nearby).
So a good thing to think about would be negawatts, i.e. less consumption on stupid things…Just a suggestion.
Ps. when there are several transmutional nuclear reactors running, with a fully closed fuel cycle we can discuss that path further. ds.
“The results of the R&D on ADS, together with the progress on critical reactors are preparing the path for transmutation as a possible reality of future fuel cycles. Its implementation will offer our generation the possibility of leaving to future generations a just legacy in terms of resource availability, wastes burden and risk.”
when there are several transmutional nuclear reactors running
When it actually happening (if), we can talk about it.
Or, we can wait 24000 years for the half life——
At least the already installed CANDU heavy water reactor design can burn used fuel from other reactors. India even tries to feed them with thorium to use a completely other fuel cycle.
Energy prices from reactors is mainly a question of mass producing them – this will determine building costs mosts, and with reactors building costs is the main cost.
Laplander , “So a good thing to think about would be negawatts, i.e. less consumption on stupid things…Just a suggestion. ”
Tomorrow the first working day I have to deliver some documents at the EU HQ in Brussels . I will forward your suggestion to Madam Von Der Leyden . Hopefully it will have an impact . Hicks says my holding a placard on the sidewalk worked to frame the new policy . :- ) . Just for laughs .
Freddy —
It seems pretty unlikely that anyone in Europe will be able to finance a new gas-fired power plant. It’s too risky, even if gas is designated as green.
That is the opinion expressed by Leonard Birnbaum, the chairman of the board of the German utility eon in an interview with a local newspaper this week.
The problem is that you need 15 years of operation at high capacity to pay off the investment of a power plant, and there is just too much uncertainty and political opposition for that to be a safe bet.
https://www.ft.com/content/7872a05f-9e38-4740-9b1b-4efc69ca316c
At least something is happening to get lower gaz prices.
Freddy , like I commented in my earlier post ” rearranging the chairs while the Titanic sinks ” . Any way there is a knock at my door and I see It is Mevrouw Von Der Lyden ( President EU ) asking me how my special steel for the nuclear domes was coming up . I told her I got to get a bigger kitchen stove plus an AGA oven to do the annealing . She told me to file an application for funding under the new ” green deal ” . I am going to make hay while the sun shines . 🙂 . Look out for yourself . Take care .
All I can say is that our successive development Permian wells are not setting the world on fire and the average 60 day IP continues to get worse. just sayin’
Well, that’s bad news, since I just bought a new track for one of my snowmobiles, with 2&1/4 inch lugs, and kind of hoped for lower fuel prices… But at least I didn’t trade it in for a new one, with a hefty down payment…
Joke aside, things are really getting interesting now!
Laplander: Snowmobiles are some of the least fuel efficient vehicles in use. There a lot of resistance (energy loss) in the continuously variable transmission belt as well as in the track itself. Maybe get a dog team …. or even better, skis.
Yes, not perfect machines at all, there are however some electric ones under development, both in the US and in Finland. I of course have a few skis, but in isolated areas with a meter or more of snow (3-4 feet) a snowmobile is a good option. And since I burn less fuel in them than the average Stockholmer with his/her boat over the year, I don´t feel too bad about it.
Edit, and even at 18 SEK/litre, around 6,5 dollars a gallon it´s many smiles per gallon. So yes, I`m a hypocrite in some aspects…
Yes and with 5 feet of snow they are much more fuel efficient for travelling in remote areas for singe farms than plowing all this snow to be able to use trucks and cars.
Especially when after every winter storm these 5 foot lay on the street again.
The other possibility is a over the air – by copter or a small water plane with skis.
LTO Survivor
Maybe what you and Mike have been telling us for a while might just be starting to show up in the numbers.
Accounting and artificial lift can’t hide it forever!
Ovi,
I have thought for the the last few months that the completions of the DUCs in excess of the new wells drilled have masked the real issues that we have been experiencing. Our merged company has over 100,000 acres and each successive well is below par. I don’t believe it is just limited to our acreage position. The truth will come out in 2022. I am not by nature a “negative nancy”, I just report what I see.
There will be companies with better acres – but for US total production the median acre counts. The future will tell.
But one thing is sure for the next years: When the US shale stops production (perhaps because of an oil price crash), oil prices will rise as much until it starts production again. There is no additinal source that big, even when Venezuela has small signs of life again.
LTO Survivor,
I had always though that was the nature of the oil business. Don’t companies attempt to drill their best prospects first? If they do so successfully, the natural course of events would be for each successive well to be a bit less productive than the last. I understand of course that each well is unique and there would tend to be statistical variation in well results as the rock varies and the well design changes over time (lateral length, frac stages, proppant loading, etc.) I would think the general trend would be for lower productivity especially if the optimal well configuration has been determined (so lateral length, etc remains relatively stable). Though of course the variation in rock quality will remain.
Dennis,
The shale formations in the Permian are ubiquitous for the most part. There are indeed areas with better rock but what we are really talking about and echoing the youtube video by Leigh Goehring is simply physics. The subsequent wells may have the same amount of “resource in place” but the bottom hole pressures are falling daily and without any significant form of secondary recovery effective in these tight reservoirs, the subsequent wells will be less productive. It is just physics and not geology.
LTO survivor,
Because the porosity is so low in the Permian, I would think the pressure drops are relatively localized, but within a given sweet spot area there will of course be reduced pressure as fluid is removed from the formation, that as you say is basic physics. How fast new well productivity will decline is unknown, so far it seems to be holding up, if indeed average lateral length has started to reach some optimal average value (maybe 9000 to 9500 feet?) by 2020
LTO Survivor,
Interesting, chart below uses peak output for wells (typically month 2 with rare exceptions) by month, data from shaleprofile.com. Data from Jan 2019 to Sept 2021 for all of the Permian basin from well quality tab at link below
https://public.tableau.com/shared/CCPW6F9JS?:toolbar=n&:display_count=n&:origin=viz_share_link&:embed=y
Full post at link below
https://shaleprofile.com/blog/permian/permian-update-through-september-2021/
Dennis,
If they are counting gas as a component, all new wells with higher GORs may not show a dip in the IP numbers. I would prefer to see BOPD only and not BOEPD.
LTO Survivor,
See http://www.shaleprofile.com blog they report in barrels of oil per day, they do not report anything in barrels of oil equivalent at that site. Note the title of my chart, it is bopd, (crude plus condensate only, no natural gas is included).
A problem with this data is that it does not account for increasing lateral lengths, though Mike Shellman mentioned in a post somewhere that lateral lengths have recently stabilized. I believe he has access to that data at shaleprofile.com, I do not so I cannot confirm independently.
The subscription to get that data (and much more) costs $3348 annually (this is a bit much for me).
https://shaleprofile.com/products/
Link below to supply projection from http://www.shaleprofile.com
where it is assumed that rig count, new well productivity, and rig efficiency remain constant from Dec 2021 to December 2029 (this is just a simplifying assumption these all will change, but we do not know how much)
https://public.tableau.com/shared/7HX2GW66B?:display_count=y&:origin=viz_share_link&:embed=y
US tight oil output increases to over 10 Mbopd in 2029 for this scenario.
This is a good interview. It gets very interesting from 30 minutes.
https://youtu.be/5zR3y8z–j0
Lightsout,
Yes indeed. After 34:34 about ‘the best prospects of shale’:
You had a lot of geological resource there. That geological resource now in most of the shales has been all drilled up. That is your best prospects (also called top-tier wells or sweet spots) have been drilled up
For most of what is left you need much higher oilprices and a lot more capital
Doesn’t sound so good for future shale oil/gas production. Indeed, fluid dynamics are more important than total recoverable Gb. As could be expected.
I am a bit skeptical of the statement that this investor group has done its own EROI analysis. They are likely using data by Charlie Hall et al..
Latest from Mike S .
https://www.oilystuffblog.com/single-post/so-much-tight-oil-from-so-few-places?postId=6e49acfd-908f-4328-bd41-feb1aa600b60
Very interesting post, no doubt the capex off shale oil production increase with all thoose challanges and peak will come before 2027 might be it already have peaked and decline will accelerate in future. Than the hope for US might be GOM, activity there will increase soon.
HiH,
Very much resembles the YouTube post from Lightsout.
Doesn’t look good
Good stuff from Mr Shellman.
He mentions that a lot of Texas Permian output comes from Midland county, so I excluded that from the chart below and include output from all other counties producing tight oil in the Texas part of the Permian basin, this is the supply projection from shaleprofile.com through November 2021. The Texas Permian is not declining based on the best estimate by Enno Peters, (note that including Midland county does not change things).
USA Loans Oil to Exxon Again
https://peakoil.com/production/usa-loans-oil-to-exxon-again
The problem is unprofitability and not underinvestment in shale . An eye opener by Mr Shellman .
https://www.oilystuffblog.com/forumstuff/forum-stuff/_duck
US tight oil minus Permian basin from supply projection at http://www.shaleprofile.com at link below
https://public.tableau.com/shared/CD9GF5ZJH?:display_count=y&:origin=viz_share_link&:embed=y
Output at 3401 kb/d in Nov 2021 and projected to be 3472 kb/d in Dec 2022. Permian projection is Nov 2021 at 4488 kb/d and Dec 2022 at 4870 kb/d, both projections assume no future change in rig count, new well productivity, or rig efficiency. My Permian scenario has a slightly bigger increase in Permian output of 350 kb/d vs 280 kb/d for the shaleprofile.com supply projection for the Permian basin over the Nov 2021 to Dec 2022 period.
Ron, your link doesn’t work for some reason.
I think it’s all over for Russia. The only question now is how fast will their production decline.
Russia’s weak December oil production signals lack of capacity
(Bloomberg) –Russia failed to boost oil output last month despite a generous ramp-up quota in its OPEC+ agreement, indicating the country has deployed all of its current available production capacity.
With OPEC+ meeting in two days to consider output policy in the face of the fast-spreading omicron variant, Russia’s lack of growth highlights the limits of the group’s attempt to boost supply if demand continues to recover. Saudi Arabia, Iraq and the UAE can raise output, but others such as Angola, Nigeria and Kuwait are struggling to meet their quotas.
Russian companies pumped 46.11 million tons of crude oil and condensate last month, according to preliminary data from the Energy Ministry’s CDU-TEK unit. That equates to 10.903 million barrels a day — based on a 7.33 barrel-per-ton conversion rate — and is flat to November.
It’s difficult to assess Russia’s compliance with the OPEC+ deal, as the CDU-TEK data don’t provide a breakdown between crude and condensate — which is excluded from the agreement. If condensate output was the same as in November — some 930,000 barrels a day — then daily crude-only production was around 9.973 million barrels, about 37,000 barrels below its December quota.
Russian companies pumped 46.11 million tons of crude oil and condensate last month
Wow, more than 10 times the weight of the heaviest building in the world.
The Palace of the Parliament (Bucharest) is the heaviest building in the world, weighing about 4,098,500,000 kilograms (9.04 billion pounds; 4.10 million tonnes).
Well, perhaps they can increase production. Can we believe Tass? We shall see.
Russia to scale up oil production by 109,000 barrels per day in January 2022
MOSCOW, December 2. /TASS/. December talks of OPEC+ countries ended and the OPEC Secretariat confirmed in its communique that OPEC+ member-states will continue increasing oil production by 400,000 barrels per day.
All the countries agreed to proceed with oil production recovery in January 2022 by 400,000 barrels per day, according to the communique posted on the OPEC’s website. The plan to compensate overproduction of oil is extended until June of the next year.
The next meeting of OPEC+ countries will be on January 4, 2022.
Russia and Saudi Arabia will be able to increase oil production in January by 109,000 barrels per day each to 10.122 mln barrels daily.
For Saudi that would be 364 K barrels more than they produced in November. If that is correct then that means their production increased by 255 K b/d in December. I am doubtful that those numbers are correct.
However, the number for Russia is obviously crude only so there is no way of knowing what their C+C is projected to be. But I just don’t think that OPEC’s can accurately project what Russia will be able to do.
Ron
“Russia and Saudi Arabia will be able to increase oil production in January by 109,000 barrels per day each to 10.122 mln barrels daily”
I read that Tass statement to say that Russia is allowed to increase production by 109,000 b/d. It does not mean/imply that they will.
As for Saudi Arabia, they were close to their November allotment and their increase was also close. In November they produced 9,867 kb/d and their increase was 101 kb/d. Their November allotment was 9,913 kb/d, 46 kb/d higher than actual production. The thing to watch for SA is for how long can they continue to add their allotted monthly increase of 109 kb/d.
Ovi,
Based on OPEC estimate in December MOMR Russian crude output in October was 9920 kb/d and based on Russian Energy ministry estimate of C plus C this implies condensate output of 879 kb/d in October. If we assume the November level of condensate was the same as October (I have no November estimate from any source), that would imply Russian crude output in November 2021 of 9964 kb/d. If the 109 kb/d increase was actually met in December and January, then Russian crude output would be 10073 kb/d and 10182 kb/d for Dec and Jan.
We will wait to see the actual numbers. I expect Russia may reach capacity at about 10200 kb/d of crude and Saudi Arabia at 10400 or 10500 kb/d, further increases in OPEC plus output would need to come from UAE and Iraq. By the end of 2022 all of OPEC plus will lkely be at capacity and oil prices may be quite high ($90/bo or higher). US tight oil, Brazil, Canada, Norway and Guyana may be able to increase output some, but oil prices will need to be high from 2022 to 2028 to balance supply and demand, by 2025 $130/bo for oil is probably a 50/50 shot.
Dennis
The December OPEC report says that November all liquids is estimated to be up by 50 kb/d. See quote below. Since condensate is close to 10% of crude, that would mean close to 45 kb/d of crude, giving November crude output of 9,965 kb/d which is spot on with your estimate.
“A preliminary estimate for Russia’s liquids production in November based on the Ministry of Energy’s production data shows an increase of 0.05 mb/d m-o-m to average”
Using the estimate from Ron’s post above of 10,903 kb/d of C plus C and subtracting 879 kb/d of condensate gives December crude output of 10,024 kb/d, 49 kb/d lower than your estimate. However the world oil report states that condensate was 930 kb/d in December and so crude output was much lower at 9,973 kb/d.
All the numbers appear to be in the right row and section of the ballpark. We don’t know the right seat.
Ovi,
Can you clarify what you mean by the “World Oil Report”? I am using OPEC MOMR published in December 2021 and Russian Energy Ministry data only, I do not know of any specific condensate estimates for Russia. I have a crude estimate from MOMR and C plus C estimate from Russian Energy Ministry for October and have estimated condensate for October 2021 by taking the difference, there is no estimate for Russian crude output for November, December, or January, I am simply speculating that it has remained at 879 kb/d. Note that condensate output is mostly a function of natural gas output, but the Russian Energy Ministry no longer reports natural gas output (data stops in 2016).
In any case, we will find out later in the month what the Russian energy ministry has for Russian C plus C in December in November it was 1488 thousand tonnes per day (10862 kbpd if we assume 7.3 barrels per tonne).
My December estimate was simply assuming Russia increases output by 109 kb/d from the November level, though my C C estimate was too low see comment down thread.
Looks like output was pretty much flat from Nov to Dec (down marginally) based on the Worldoil.com piece, perhaps because Russia was over their quota in Nov 2021.
Dennis, he obviously means a report from WorldOil.com. Most likely this one.
Russia’s weak December oil production signals lack of capacity
Thanks Ron
Thanks Ron.
I see now where the different condensate estimate comes from, I used 7.3 barrels per tonne and most news outlets use 7.33 barrels per tonne, the higher estimate gives higher C plus C output and then when we subtract the MOMR estimate for crude we are left with a higher condensate estimate for October 2021 of 923 kb/d, I will assume the November level for condensate is unchanged (following MOMR) so 923 kb/d in November 2021, according to the Worldoil.com piece Russian output was flat in December, perhaps Russian output may be approaching capacity.
Note however that Russia crude output was above its November 2021 target by 70 kb/d and the lower output in December (37 kbpd below assigned quota) may have been to make up for over production in November 2021 and stay within the OPEC plus agreement. This job (maintaining quota targets) is more challenging in Russia’s case because there are many oil companies rather than a single company as is the case for most OPEC producers.
The one salient theme of the past year’s peakoilbarrel blog in under-investment in reserve replacement. It is not a question of “if” but “when” the SHTF.
Certainly a critical aspect.
I wonder where would fresh/renewed attempts at reserve replacement be targeted- onshore vs offshore/ which regions are still thought to have untapped yet viable resource?
It would be very interesting to see an analysis of yield on investment for exploration efforts over time-
yield not in financial return but in barrels produced /$100 invested or deployed at exploration and development.
With that info it may shed light on how much sense it makes to engage in reserve replacement at current prices, or roughly what price level it would take to make sense.
Indonesia halts January coal exports
The unprecedented move by the world’s biggest thermal coal exporter has fuelled uncertainty in the seaborne market as the decision will block shipments to key consumers such as China ahead of the peak winter demand season, even with deals already concluded to secure prompt cargoes.
When will we see similar decisions regarding oil?
Pollux-
“Mexico plans to halt crude oil exports in 2023 as part of President Andres Manuel Lopez Obrador’s nationalist goal of self-sufficiency in fuel production. … The ambitious endeavor is part of Lopez Obrador’s drive to expand homegrown production of gasoline and diesel that Mexico now mostly buys from U.S. refiners.
There is also another energyform that might be affected by ELM, namely electricity. I have on some occasions here lamented Swedens export of electricity, which is substantional seen over the year. But the prices lately in primarily the south of Sweden, due to even higher prices in Germany, Baltics etc. and subsequent exports has brought this to everyones attention.
So, a bit ironic, it might be mid Europe that freezes in the dark, not the northern part… (We´ll see what Von der Leyen does in that case, however)
https://www.nordpoolgroup.com/Market-data1/Power-system-data/Exchange1/ALL/Hourly1/?view=table
Libya shuts down another 200,000 barrels a day of oil production – Bloomberg
The closures will reduce Libyan production to about 700,000 barrels a day, the lowest in more than a year.
I read that Parshall 1-36 is considered the Bakken discovery well. It was drilled by EOG, who still operates it today. I notice it is shut in. I wonder if it is done.
The discovery well for our field was plugged in the early 1970s, after having produced for over 60 years. An operator leased the tract the discovery well is on and re-drilled it in 2012 and is still producing it now.
As we enter thr new year, we will hit 117 continuous years of oil production from our field in August. Our oldest producing well will hit 117 in December. Most of our old wells will hit 115 this year. Our youngest well will be 8 years old in September. That is considered old in rhr shale basins.
Interesting article with a few nuggets.
By the end of January, the group is left with about 3.4 million bpd of cuts to unwind by the end of September, as per its July 2021 agreement.
While the group has been raising its targets, its production increases have not kept pace as some members struggle with capacity constraints.
OPEC+ oil producers missed their production targets by 650,000 bpd in November and 730,000 bpd in October, the International Energy Agency (IEA) said last month.
It revised the 2021 deficit up by 300,000 bpd to 1.5 million bpd and it trimmed the 2022 surplus from 1.7 million bpd to 1.4 million bpd.
A table in the report shows that the supply/demand balance is in surplus for the whole year. I wonder if the IEA’s expectations are too high for the US.
https://www.reuters.com/business/energy/opec-expected-proceed-with-production-increase-feb-sources-say-2022-01-03/?rpc=401&
Ovi,
The IEA seems to be very optimistic on supply and pessimistic on demand, perhaps they are trying to talk down oil prices. I am doubtful that any surplus in supply will remain after 2022Q2, OPEC plus is likely to hit its limit on supply by June at the latest and although Brazil, Canada and US output may increase, it is unlikely to meet demand for oil at current prices. An oil price increase in 2022 will be needed to destroy some demand and spur some investment in oil production in my opinion.
Dennis, it’s just my opinion but I think you are drastically underestimating the effect of this new Omicron virus will have on oil demand.
Ron,
My guess is most of the effect on demand will be in 2022Q1, then we might see demand come back pretty quickly. The thing about a highly transmissible variation is that herd immunity may be reached more quickly and when we reach that point covid19 will be less of a problem.
I am not an expert of course and I am likely to be wrong.
I think that scenario has pretty high chance of being true Dennis.
It appears that Omicron variant is causing generally less severe disease, with lower hospitalization and deaths rates. If this holds true for a few more weeks the attitude is going to start to change by the end of this month.
Masks and vaccinations may not be out of the picture, but businesses will be less hampered by spring.
Still going to be very hard on healthcare system since the number of vulnerable people, even if gradually less over time, is huge.
Hickory,
Yes I agree. My wife is in the healthcare industry at a tertiary care facility and sees this firsthand.
Markets don’t seem to care one bit about Omicron. Long end of bond market is selling off rather hard today. If there was any fear over Omicron bonds would be bid and yields lower.
Stocks are likely just waiting for buyback window to reopen before they get ramped up higher. Much higher.
The liquidity flowing into stock market has never originated from the FED. The liquidity that flowed into shale oil and gas over the years never originated from the FED. Nobody on earth can show me how Bank Reserves created at the FED make it into stock prices and shale oil and gas debt or credit. It’s a myth.
Pension funds last time I dug into it a little over 2 years ago were valued at 120% of GDP. And majority are underfunded by a long shot. Which means pension fund managers have to make outsized returns to fill the gap. So there is huge demand to make 7.5% return of capital. And they aren’t buying stocks they are buying corporate credit because it has yield regardless if stock valuation go up or down they still get paid as long as the companies have cash flow to service debt.
If you follow the money it’s coming from pension funds not the FED.
And credit works like a light switch. It’s either on or off. If the switch is turned on like it is currently you get this huge credit boom that doesn’t really reflect economic reality. It reflects the need for 7.5% return on capital by pension funds. This drives active stock fund managers crazy. Because stocks continue higher even when economic data isn’t good. We get a small panic like Omicron scare and you’ll have a pullback that gets bought.
Even if FED ends QE and hikes the FED’s fund rate. Pension funds still need 7.5% return on capital.
On the state level. Increases in taxes are also going into pension funds. Which ramps up the ability of these funds manager to buy even more debt to try to fill in gap between what has been promised benefits and current value of the funds.
There will be a whole lot of pension fund money funneled into corporate debt backing green energy moving forward.
Corporate USA is using the money to do stock buybacks at 5 times leverage. Because that is usually the amount of leverage they are allowed to use.
For those betting on SHTF now. Everything above is what your betting against. You’d need a scenario where there was a run on pension fund money. Where pension funds had to get their money out immediately and all at once to meet promised payouts to get a SHTF scenario.
And if that were to happen no amount of QE would prop up asset prices. And oil would be lucky to be priced at $10 in such a scenario.
Make no mistake about it though. If the house of cards ever comes tumbling down. It’s all the same trade. Which is sell everything to service your debt. Only thing you can be long in SHTF is US dollars.
Something like a wide spread energy crisis in the US. That doesn’t have a answer or solution would need to take place in order for the credit spigot to get cut off. Otherwise we will continue to get temporary market panics that just get bought.
Kind of like Europe gets a temporary relief from high natural gas. Markets settle down and credit continues to flow. SHTF when there are no solutions.
HHH- maybe you don’t think the ‘markets’ care about the pandemic,
but real people and businesses sure as hell do.
@HHH
FED money does a lot for the pension fund allocations. Traditional they have been the main buyer of long state bonds.
The FED has bought lots of these, driving the price high and giving the money to the funds (by buying them out). So they have the money to pump into junk credit as shale oil and finance buybacks of Apple & Co to chase return %.
It are the indirect effects of this QE wave.
And yes, when this starts tumbling down it will get hard. The FED will have to buy everything, so round about 20 trillions+ in a week or 2 to stop a complete meltdown. Or they do nothing and everything gets broke – the house of cards is too high already.
In Europe I know the ECB buys netto all new issued state debt – so our pension and insurance funds have to go into risk debt to invest new money on netto base. This pushes the stock bubble by enabling huge credits for buybacks, too. So the ECB is destabilizising the markets it wants to secure on the long run with this policy. But they can’t stop – nobody would buy italian bonds for this low yield (10 year have 1.19% atm) . And high yield would trigger a big state crisis – so the ECB is bound to continue.
Key word is influence. They can influence pension fund money into corporate debt. By keeping interest rates low.
But if there is ever a run on pension funds. The FED is powerless to make that pension fund stay in corporate debt.
Guess the FED could break the law and buy corporate debt and or stocks in such a situation but I wouldn’t count on it.
And honestly they they can’t allow an pullback in stock that sticks. A bear market can’t be allowed. So don’t expect one.
I think they will. Because they already have.
They already dabbled with buying junk bond ETF:
https://edition.cnn.com/2020/05/04/investing/fed-junk-bonds-etfs-debt/index.html
It’s corporate bond buy program:
https://www.marketwatch.com/story/fed-needs-to-say-it-will-no-longer-buy-corporate-bonds-to-break-feedback-loop-says-this-fixed-income-cio-11624323969
And I remembered they talked about buying stock during the crash – but didn’t do it.
I fully agree they can’t allow stock to crash.
So I think they will buy everything that’s too slow to flee.
There will come and go many variants. Right now there showed up a new one in France, straight out of Africa. Covid will become like the seasonal flu. I think Dennis is right and we eventually will reach herd immunity, though I expect a couple of more waves globally. But treatments improve and the virus gets less dangerous with each variant. We should get over this ASAP.
I do not understand how they came up with 3.4 million bpd of cuts to unwind. OPEC is only 1.2 million bpd below their pre-covid 12 mth average of February 2020. That would leave 2.2 million bpd left for the non-OPEC part of the OPEC+ cabal. That figure cannot possibly be correct. OPEC + Russia is only 1.6 million bpd below their pre-covid average.
However, OPEC + Russia is still 4.3 million barrels per day below their 12-month average peak in August 2017. That point will not be reached again…. ever.
Ron,
Often the IEA and others include phantom capacity from Saudi Arabia and others that never materializes, it is approximately 2.5 Mbpd of “spare capacity” that has been claimed, subtract that amount and we might come close to the actual capacity of OPEC plus. Also note some of this capacity has been cut off by US sanctions on Iran and Venezuela so it might be even less than the roughly 1000 kb/d that is my guess.
Ron,
Thinking about this further, the cuts may be based on cuts from claimed capacity, 3.4 Mb/d sounds about right when Iran is included, but without Iran the cuts are more like 2.1 Mb/d, so your 2.2 Mb/d estimate seems pretty much spot on.
U.S. Hits New Petroleum Production Level
While Crude oil and Condensate production in the U.S. at 11,800 thousand barrels per day remains below its peak of 13 mbd, NGLs reached a new record of 5,713 thousand barrels per day in October.
The U.S. is producing more NGLs currently compared to the low of crude oil production in 2008 at 5,000 thousand barrels per day.
Another sign that these shale basins are reaching their peak??
steve
More like a sign that gas processing is becoming a priority, with increasing market demand both domestically and internationally.
reservegrowthrulz,
Is this due to more natural gas being processed in NGL plants and less being flared or vented?
I would think part of the story is more wet gas is being produced today vs the previous peak in 2019.
nope- rising GORs
LTO Survivor,
Yes that would explain higher natural gas output and I agree GOR is increasing, but in October 2021 US natural gas output was lower than at the end of 2019, while NGL production was higher. So the ratio of NGL to natural gas was higher in October 2021 than at the earlier peak of US natural gas output in December 2019. Could you explain why this would be the case?
More processing is coming on line on a regular basis. Within the past year ND required a fairly high capture percentage, in order to tamp down flaring and venting, something I was able to confirm with a visit back in September. Someone else mentioned rising GORs, which is true, and has been in solution gas drive reservoirs since the beginning of time, but that doesn’t account for more natural gas usually. Falling primary phase production (oil) happens faster than GOR can increase, you can find this effect by curve fitting oil and gas independently in places like the Bakken, and then check the decline differences to spot the overall rate of the change between the two. As the Bakken as been drilled up, its GOR hasn’t quite doubled but it certainly isn’t <1 mcf/bbl anymore.
ReserveGrowth,
I disagree. If we just focus on Hess in the Bakken. Here is the production data:
Q1-Q3 2013: 54,000 bopd Oil / 6,000 bopd NGLs (11%)
Q1-Q3 2016: 70,000 bopd Oil / 27,000 bopd NGLs (38%)
Q1-Q3 2020: 110,000 bopd Oil / 54,000 bopd NGLs (48%)
Q1-Q3 2021: 80,000 bopd Oil / 48,000 bopd NGLs (60%)
As we can see.. Hess NGLs production has increased 8 times while its oil production is only up 1.5 times. There LIES THE RUB.
Now, if I were to provide the data for other shale producers, we will see the SAME TREND. I can assure you that these companies would rather have more Oil than NGLs, but that is what you get when the reserve-resource becomes depleted.
steve
lower bottom hole pressure creates a lot of gas coming out of solution. All Shale oil basins are getting gassier.
LTO Survivor.
Is it your opinion that the reservoir is approaching bubble point?
Pretty darn close. We were also concerned about retrograde reservoirs with the lighter gravity oil and that the gas would overtake the fluid and significantly impair the oil production. It has not been proven that these are retrograde reservoirs but I have been a little worried about this for some time.
Within individual wells, it already has, probably with examples in all LTO plays. I’ve got examples from shale wells I completed, produced, and ran into the most beautiful oil to gas transition bubble point you’ve ever seen. I use it as an example explaining this effect to this day.
Chart below uses tight oil and shale gas data from EIA for 4 major tight oil basins (Permian, Bakken, Eagle Ford and Niobrara to find GOR from Jan 2000 to November 2021 in MCF Natural gas per barrel of tight oil produced. The GOR was down substantially from 6 to 2.5 over the 2008 to 2014 period and then rose somewhat from 2.5 to 3.3 from 2015 to 2021 and I expect it will continue to rise as fluid is removed from the rock and pressure in the rock decreases. PV=nRT.
Links to data used for chart above
tight oil spreadsheet at link below
https://www.eia.gov/energyexplained/oil-and-petroleum-products/data/US-tight-oil-production.xlsx
From spreadsheet linked above I use Eagle Ford, Bakken, Wolfcamp, Spraberry, Bonespring, (previous 3 are Permian basin) and Niobrara.
To get gas produced in the Eagle Ford, Bakken, Permian, and Niobrara I use the spreadsheet linked below
https://www.eia.gov/naturalgas/weekly/img/shale_gas_202111.xlsx
From this spreadsheet I sum up the natural gas produced from the Eagle Ford, Bakken, Permian, and Niobrara.
To find GOR for these four tight oil basins I divide the natural gas produced (BCF/d) by the tight oil produced (Mb/d). The GOR is presented in the comment linked below
https://peakoilbarrel.com/us-october-oil-production-rebounds-after-hurricane-ida/#comment-732798
Dennis, I think you misunderstand GOR. Gas to Oil Ration referrs to the amount of gas that comes up with the oil. It has nothing to do with NGLs or gas wells. When GOR is rising it means the oil field is gassing out.
No Ron,
Steve talked about the rising ratio of NGL to oil, NGL is extracted from natural gas so typically when natural gas output increases NGL increases. So I looked at US natural gas output on a monthly basis, the peak was in December 2019, but NGL peaked in October 2021. That suggests we are getting more NGL per unit of natural gas produced in October 2021 than in December 2019 (I assume the EIA data is correct). This implies wetter natural gas (wet gas has more barrels of NGL per cubic foot of natural gas produced).
LTO survivor suggests no, it is higher GOR that explains the higher NGL per unit of natural gas produced. I think he may be mistaken or did not understand what I was saying.
My chart takes shale gas produced in each of the 4 major plays (in BCF/d) and divides by tight oil produced in those plays (in Mb/d), if you do not think that represents the GOR of those 4 major plays (in MCF/bo) then one of us does not understand what GOR is, I will leave it to others to decide who that is.
Dennis, Steve never mentioned GOR.
How Do You Solve A Problem Like GOR?
The gas-to-oil ratio (GOR) of a production stream describes how much gas is produced for each barrel of oil produced; it is referred to in terms of standard cubic feet per barrel or scf/bbl. Another way the industry refers to this ratio is liquids cut, or the percentage of total wellhead production that is liquid rather than gas. This percentage changes over the life of the well, but this is not unique to Pioneer.
GOR simply means gas that comes up with the oil. This gas is often flared. It is regarded as a problem because more gas coming up with the oil means less oil. Rising GOR is a very serious problem as LTO Survivor clearly indicates. It has nothing to do with LNG or gas only wells.
Ron,
You are correct that Steve did not mention GOR, I responded to reservegrowthrulz who responded to Steve’s comment, and I suggested perhaps the explanation for higher NGL was wetter natural gas being produced.
LTO survivor chimed in that no it was due to rising GOR. The GOR is rising a bit as LTO survivor suggests, but overall it is not near the level it was in 2008 in the major 4 tight oil basins. It has increased from a low of 2.5 in 2015 to about 3.2 in 2021. So far not that big a deal.
All natural gas from oil and/or gas wells has some liquids (NGL) that are extracted in natural gas processing plants. I imagine you are aware that significant quantities of natural gas are produced in the Permian basin (about 14 billion cubic feet per day in November 2021 vs 25.5 Bcf/d for Marcellus play).
Bottom line, higher GOR will mean higher natural gas production from oil wells and higher natural gas production typically leads to higher NGL output.
That’s fine Dennis, but the acronym “GOR” is not remotely related to NGLs. A rising GOR is a problem, not an asset. They may be able to sell the gas if they have a pipeline to move it out. But often it is just flared. But even if they salvage it, the gas is worth far less than the oil it is displacing. But as indicated in the Forbes article, it can cause other problems as well.
And I have no idea what you mean when you say GOR has risen from 2.5 to 3.2. What does that mean? GOR is measured in “scf/bbl” or Standard Cubic Feet per Barrel.
From the Forbes article I linked above:
As a rule of thumb, GOR rises as reservoir pressure drops (due to production) – and here’s why: A liquids-rich well predominantly consists of short chain (C1, C2 and C3) and long-chain heavy-end hydrocarbons (C7+) and can exhibit GOR ranging from 1,000 to 8,000 scf/bbl. In ultra-low permeability liquid reservoirs (tight oil), solution gas evolves when reservoir pressure drops below the bubble point pressure.
At this point, the gas dissolved in the oil starts to escape and provides most of the drive energy. As the pressure continues to drop, a portion of the heavier hydrocarbons gets trapped in the porous network, resulting in higher production of lighter hydrocarbons.
Due to the complex nature of a liquids-rich reservoir, estimating the future GOR trend can be challenging.
Ron,
I used MCF per barrel so it has risen from 2500 to 3200 scf/b for the big 4 tight oil basins.
I will repeat, higher GOR tends to result in higher natural gas output per barrel of oil produced, higher natural gas output leads to higher NGL output as most of the gas produced is not flared or vented but collected and sent to NG proccessing plants that remove the liquids to produce dry natural gas.
So GOR and NGL are connected as alluded to by LTO survivor.
I agree rising GOR is a problem, this is what tend to happen to older tight oil wells, the GOR rises, this is not unexpected.
Fair enough Dennis, but I think you should get LTO survivor’s own opinion on that issue.
Yes, of course, the GOR would trend higher in older wells just as WOR, water to oil ratio would. And of course, that is expected. However, when the GOR in this year’s new wells is higher than the GOR in last year’s new wells, then you start to worry.
Ron,
The GOR in this year’s average well has not changed significantly from last year or the year before.
Dennis, I do not follow the GOR from the Permian, Bakken or Eagle Ford that closely. I am glad you do. You must have had to comb through a lot of data to find that conclusion. Thanks.
Ron
Ron,
It was Enno Peters of http://www.shaleprofile.com that put this together for Permian basin
see chart linked below from Permian September 2021 update at the shaleprofile blog
https://shaleprofile.com/wp-content/uploads/2021/12/GORs.png
Also this data used to be available for free see advanced insights at older post linked below (June 2020)
https://shaleprofile.com/blog/permian/permian-update-through-june-2020/
Link below to GOR chart for Permian as of June 2020.
https://public.tableau.com/shared/WSG5GTSDB?:toolbar=n&:display_count=n&:origin=viz_share_link&:embed=y
Dennis, thanks for the link. It shows the Gas to Oil Ratio exploding in the Permian. Thanks, this is a real eye-opener. This shows the Permian is definitely gassing out. Thanks again,
Ron
Ron,
No not really. It shows that when completion rates decrease as they did in 2020, that gas oil ratio increases.
Chart below uses EIA data to look at basinwide Permian tight oil GOR from Jan 2000 to November 2021.
For my low completion rate Permian scenario (maximum of 525 new wells per month) with URR of 34 Gb (about 7.3 Gb cumulative production to date) the GOR is in chart below (if the scenario is correct which is highly unlikely). After 2030 the Permian becomes more of a shale gas play than an oil play for this scenario. No oil or gas production afer 2050 for this scenario in the Permian basin.
The last posts at shaleprofile with the advanced insights graphic were posted in March 2021, see link below
https://shaleprofile.com/blog/2021/03/
Permian post from March 2021 at link below
https://shaleprofile.com/blog/permian/permian-update-through-december-2020/
“…the cumulative discovered volume for 2021 [4.7 billion barrels-of-oil-equivalent, through November] is on course to be its lowest in decades.”
—-Palzor Shenga, vice president of upstream research at Rystad Energy
liquefied petroleum gas is also a good fuel for adapted car engines. So, it shouldn’t be a problem.
I can attest to more and plenty of new processing facilities being built on a regular basis in the Bakken. So obviously, that must include individual actors, but I don’t pay attention to the who, and your data seems to prove it. They aren’t getting NGLs out of thin air, without processing those NGLs would continue downstream until someone else collected them because folks aren’t going to put them into a high pressure pipe. Screws up high pressure transportation something fierce, hence gas quality requirements for said pipe. Sure producers would rather have oil. But if they can’t produce the oil because of capture requirements what do they do? Capture more…and that includes NGLs.
Some fascinating info posted in this NGL/GOR thread. Tnks to all for the good data. (Miss your usual hyperventilating drama, Steve, but good topic, nonetheless.
Some perspectives that may help …
That the targeting of NGL-rich rock is taking place is obvious. This is a big reason why West Virginia is now the 5th largest US gas producing state.
As for marketing, this calendar year alone, 3 huge US crackers and one massive Chinese cracker will come online with the express purpose of processing abundant, cheap ethane and propane feedstock originating from US ‘shale’ plays. India has several new plants, and a newbuild fleet of ships, expressly for this purpose. In addition, 2 huge plants near Antwerp will come online in the next ~2 years, a steam cracker and a Propane Dehydrogenation plant.
Producing polyethylene and polypropylene from NGLs is, historically, way cheaper than sourcing from naptha.
Regarding the ratios of gas (and NGLs) to oil, and the topic of bubble point/phase change/formation pressure in general, there is a wealth of intriguing data that continues to emerge.
In the Bakken, there no longer exists ‘flowback’ fluid as has been the norm.
Due to advances in High Viscosity Friction Reducers, the frac fluid now remains underground indefinitely.
This not only drives hydrocarbons into the wellbore by way of elevated, induced pressure, this status remains for several months as, now, hundreds of thousands of barrels of water – now characterized as ‘produced water’- are recorded for up to a year on monthly Bakken production reports. This is readily seen on public records.
Regarding bubble point/higher API/GOR … the somewhat debated role of asphaltenes is now stepping into the limelight as so-called ‘wet sand frac’ing’ is becoming the norm.
By keeping the product wet, all the previously lost ‘dust’ is now injected downhole. This is now – largely – displacing the micro proppants/nano proppants which have been used so effectively the past few years.
In addition to more cheaply/extensively scouring/propping the tiniest of cracks, the resulting pathways are even more miniscule than those of years gone by.
This directly results in the larger hydrocarbon molecules blocking even more of the induced pathways which further inhibits liquid flow while allowing the smaller (gaseous/lighter ends) molecules to continue on.
The disproportonately high recovery of the C12/C18 molecules (IIRC) from Liberty’s Stomping Horse EOR project irrefutably shows that these larger molecules (commonly referred to as asphaltenes) are not only being left behind in original recovery, they may be playing a large role in the high initial production decline by blocking the pathways.
Anyone can view the recent production profiles ftom Marathon and Continental in the Bakken and see how these factors – relatively high/flat initial output coincident with massive amounts of produced water – are playing out in real time.
Russian Annual Oil Output Recovers in 2021 after Slump
Russian oil and gas condensate output rose to 10.52 million barrels per day (bpd) last year, according to energy ministry data cited by the Interfax news agency and Reuters calculations, from 10.27 million bpd in 2020.
Russian C+C production stood at 10.9 million bpd for both November and December.
Deputy Prime Minister Alexander Novak has said that country’s oil output is expected to rise further to 540-560 million tonnes (10.8-11.2 million bpd) in 2022, and to 542-562 million tonnes in 2023.
He is saying that he expects 2022 production to be somewhere between down by 100 K bpd to up 300 K bpd as compared to November and December production. And then he expects production to increase by 200 K bpd in 2023.
Well, at least no one can accuse him of being overly ambitious. 😁
The Russian Energy Ministry has been projecting a plateau at 11 Mbpd for quite a while now, so this is not a surprise.
OPEC plus is still having difficulty meeting their quotas:
https://oilprice.com/Energy/Crude-Oil/OPEC-Continues-To-Struggle-To-Produce-As-Much-As-Quotas-Allow.html
“ The ten OPEC members bound by the OPEC pact—and excluding exempted producers Iran, Venezuela, and Libya—complied with the cuts at a massive 122 percent, while the conformity level of the non-OPEC members led by Russia was 107 percent
More from Russia.
https://tass.com/economy/1383843
Another Chinese city goes into lockdown. Omicron isn’t even spreading rapidly in Asia yet except for the Philippines, but it will in the next few weeks. Beijing is trying desperately to keep it out before Winter Olympics. Expect many more lockdowns in the lead up.
https://amp.theguardian.com/world/2022/jan/04/chinese-city-of-12-million-people-locked-down-after-three-covid-cases-emerge
Lockdowns in China equals less imports/exports. Largest port in the world is likely to be under lockdown soon. Means further price inflation due to supply chains disruptions.
Also means less US dollars flowing into emerging markets from China imports. Means less US dollars to service dollar denominated debts. This could get ugly in a hurry for emerging markets.
China only imports about 10% of its total coal usage. But 60% of that 10% or just call it 6% of China’s total coal is going to be cut off by Indonesia. It’s about $3 billion less US dollars flowing to Indonesia a month.
Indonesia imports about $12 billion in refined petroleum in a year and another $2 billion in gas. Can they afford that oil without the dollars coming in from coal exports?
Less US dollars flowing outside US should equal less demand for oil outside US.
Attached is a table that shows the February production commitments made by the OPEC + members. Also included are the December and January commitments. The last column is the difference between February and January. In a few cases the difference between January and December is out by 1. Note that Mexico is unchanged. As I recall they just made a one year commitment.
The second table shows the OPEC November production numbers and the December increase the countries need to meet their commitment.
Table 2 shows the production increases needed by the OPEC countries to meet their December commitment. The negative numbers indicate that the two countries are already above their commitment.
Ovi, both those charts are totally unrealistic. Your last chart shows that OPEC alone must increase production, from November to December by 822 thousand barrels per day just to get to where they say they were in December. I don’t think they were anywhere close to that figure. Then OPEC+ must increase production by 400 thousand barrels per day in January and February. Really? If you think that is going to happen then I have a bridge I would like to sell you. OPEC+ would have to be up 1.622 million barrels per day from November to February for those figures to be accurate. If you think that is going to happen then I have a bridge I would like to sell you.
But imagine how embarrassed they are supposed to be when in March when they are nowhere remotely close to that target. But of course, they will not be embarrassed at all. They don’t really expect anyone to really believe those numbers. They will just say they cut back because of covid, or some other bullshit excuse.
Ron
Nowhere did I imply that they were going to meet those commitments. The point of the second table was to demonstrate the hill that OPEC has to climb to our participants and you picked up on that pronto. Now that I have the data we will be more able to track how OPEC is doing.
Dennis will be doing his OPEC post in two or three weeks and I will, if Dennis doesn’t, update that table to see how far the members are from their targets.
It will be interesting to see if SA increases their output by the 150 kb/d required in December. According to the first table, they are committed to supplying over 10,250 kb/d after March. They have only exceeded that output level for short periods. The real stress on OPEC will begin to show up shortly.
Really Ovi, I hope you did not think that I was implying that those were your predictions.
Lots Of Insanity Taking Place In The World Believing In the Energy Tooth Fairy…
If you take a close look at China, you will see that it has turned a backward agricultural country into a 21st century Global High-Tech Metropolis in less than three decades… which took the United States and West 75-100 years. This will come at a huge Cost when China can’t continue to consume a massive amount of energy each year… 26% of the world’s total energy consumption.
The same can be said for the Middle East that is constructing Mega-Cities that now need to be run by a gargantuan amount of Electricity… generated mostly by Natgas.
Even though Middle East Natgas production has increased from 30 Bcf/d in 2005 to 66.2 Bcf/d in 2020, the Middle East now consumes 75% of that growth or 27.5 Bcf/d more than in 2005.
So… I say… LET’s PUT THE PEDDLE TO THE METAL and continue expanding the Global High-Tech Infrastructure-Manufacturing-Building System right up until the point that we head over the Energy Cliff.
GOD HATH A SENSE OF HUMOR…
steve
This is spot on. The majority of the public truly believes that the technology boom is an energy saving industry. This absolutely false. I have had more people call me to find natural gas fields to buy where they can “waste” that energy on mining Cryptocurrency. Insanity rules the day until it doesn’t. I read recently that the UK wants to re-classify gas oil as green! We might as well just call a duck a cow. Could it be that the green revolution is not compatible with economic prosperity?
>>I have had more people call me to find natural gas fields to buy where they can “waste” that energy on mining Cryptocurrency.
I’ve read about this on other forums. Is this something that is actually happening, or just exploratory phone calls? Any other details or even opinions on this would be greatly appreciated.
Tom,
I will give you the names of the groups as they come to me but there are a lot of young guys trying to do this.
Russian electricity generation from natural gas has remained fairly stable since 2010. However, their net electricity production has increased by about 10% since then, which is why the NG proportion is falling. Essentially all of the increase in Russian power generation is coming from nuclear power. It is offsetting some declines in hydro as well. I do not know if the Russians are replacing old gas powerplants with more modern CCGTs. If they are, then total natural gas consumption for power generation will have fallen. It would be interesting to know.
But one thing is clear. If the Russians had the ability to substantially increase NG production and burn it efficiently for their own use, they probably would and we would be seeing large increases in NG power generation in Russia. NG used in this way is about the cheapest generation option, provided that you have cheap gas to burn. It makes no sense investing in a Station that has a 40 year design life, if the natural gas isn’t going to last at least that long. But the Russians aren’t doing that. Instead they are building VVER pressurised water reactors and are actively pursuing a fast breeder reactor programme, whilst exporting the gas to other places.
That should tell you that they themselves do not see enough of a long term future in NG to justify large scale investment in NG powerplants. They do not see a future in coal either, as their coal generating capacity is slowly wearing out. They are keeping what they have going. They are not particularly interested in renewable energy either, aside from what they can harvest through hydropower and biomass. What the Russians are doing is slowly transitioning their own economy from a fossil carbon to a Uranium energy base, with a strong emphasis on fast neutron reactors. That is the energy future that they are investing in for themselves.
Maybe the rest of the world should take the hint rather than trying to build a transition to nowhere based on a hydrocarbon that is close to its global production peak, or a fantasy world based on low power density ambient energy. There is insufficient natural gas remaining to consider it valuable as a transition fuel. If you already have a NG station and good wind power resources, then using the NG as backup allows you to stretch the benefits of an increasingly expensive fuel. But only by committing to the capital and maintenance costs of a renewable energy system that requires orders of magnitude more steel and concrete than a fission power plant of equivalent energy output. The current renewable energy craze just doesn’t make sense. It will not be sustainable when fossil fuels are no longer available to make the huge volumes of steel, concrete, glass, silicon, copper and rare Earth’s that are needed to build country sized wind and solar farms. And natural gas shortages are going to eat into supply too quickly for NG to be useful even as a backup power source. To replace fossil fuels we need something equally power dense that doesn’t require building multiple powerplants and batteries in the place of just one. The Russians appear to have cottoned on. How long will it take the rest of the world?
Kazakhstan government’s resignation fails to quell protests
Protesters stormed public buildings in Kazakhstan’s biggest city on Wednesday as security forces struggled to impose control after the government resigned in response to popular anger over a fuel price increase.
The protests began in the oil-producing western province of Mangistau on Sunday, after LPG prices more than doubled following the lifting of caps.
A source familiar with the situation said some workers at Mangistaumunaigas, a Kazakh-Chinese oil-producing joint venture based in the Mangistau province, were on strike, although this was not affecting output so far.
Internet is down:
https://twitter.com/netblocks/status/1478694849440358400
This instability within Kazakhstan is a good example of how ELM can play out-
growth of internal demand for energy products will result in lower exports,
And civil unrest will be an increasingly common response to loss of subsidies, higher prices, restricted supply, rationing, and/or export of product in the face of perceived domestic shortage or high price.
Any words on Victoria “F the EU” Nulands current whereabouts?
I think she is now in Kazakhstan . Trouble thy name is Nuland . 🙂
OPEC+ Continues To Struggle To Produce As Much As Quotas Allow
The OPEC+ group has been undershooting its collective production targets for months and will likely continue to do so in the months ahead, analysts say. African OPEC members lack the capacity and investments to boost production, Russia is estimated to pump and export lower volumes than its quota, and the biggest Arab Gulf producers have the means to raise output but at the expense of shrinking their spare production capacity, which accounts for the majority of the spare capacity globally.
The alliance’s inability to deliver on its production targets—with some estimates putting the overall output at around 650,000 bpd-730,000 bpd below the collective quota—is set to support oil prices next year, analysts say. This underproduction could even become a major upside for oil this year, especially if Omicron’s dent to global oil demand remains limited to jet fuel, as the most recent estimates and analyses showed at the end of 2021.
2020 the year of the virus , 2021 the year of the vaccine , 2022 the year of the energy crisis . It is only the beginning .
https://www.thenationalnews.com/mena/iraq/2022/01/04/iraq-hit-by-severe-power-shortages-as-iran-cuts-gas-supplies/
https://mobile.twitter.com/chigrl/status/1477755878602428418/photo/1
Saudi rig count down by 50 % .
HiH,
That’s old news.
Look here:
https://www.opec.org/opec_web/en/647.htm
OPEC upstream investment down by 70% since 2017.
I have posted this one before.
The FED wants to taper faster, and hike earlier. They even want to shrink their balance sheet.
This IS an oil related message. Duck and cover if they really do this.
We have a fiscal and monetary stimulus cliff hanging over markets and the economy. We ran a 2.77 trillion deficit in 2021 and a 3.13 trillion deficit in 2020.
If we don’t get something similar in 2022. GDP will decelerate. Monetary conditions automatically tighten because way less money will be spent into economy.
Right now the spin is the economy is doing so well not only do we not need QE we need to raise interest rates to cool it off some. Maybe even shrink FED’s balance sheet some.
I don’t buy into that narrative. If everything was as good as the narrative suggests. The US dollar would sink to a new all time low. Because US dollars would be getting leveraged up buying and bidding everything to the moon.
I’m trying to think of something that would be more devastating to the global economy than a strong dollar. And there just isn’t anything that can happen that would wreck more things than a strong dollar.
And it appears that their solution to inflation is guess what a stronger dollar.
Latest update (Jan 4) to GDPNowcast fro Atlanta Fed at link below
https://www.atlantafed.org/cqer/research/gdpnow
For 2021Q4 seasonally adjusted annual growth rate of real GDP the estimate is 7.4%, next update on Jan 6. The Bluechip consensus average estimate is 6%.
Real GDP growth of 7.4% + inflation of 6.8% = 14.2% nominal, is that what they’re saying?
Stephen,
I am not sure they are trying to calculate nominal GDP growth and it is not clear if the inflation rate is a quarterly or annual rate and if it can simply be added to the 4th quarter growth rate estimate, you would need to look at the detail at the Atlanta Fed website.
Update for Jan 6 at
https://www.atlantafed.org/cqer/research/gdpnow
An excerpt:
The GDPNow model estimate for real GDP growth (seasonally adjusted annual rate) in the fourth quarter of 2021 is 6.7 percent on January 6, down from 7.4 percent on January 4. After recent releases from the US Bureau of Economic Analysis, the US Census Bureau, and the Institute for Supply Management, the nowcasts of fourth-quarter real personal consumption expenditures growth and fourth-quarter real gross private domestic investment growth decreased from 5.6 percent and 18.0 percent, respectively, to 4.5 percent and 17.4 percent, respectively, while the nowcast of the contribution of the change in real net exports to fourth-quarter real GDP growth increased from 0.0 percentage points to 0.21 percentage points.
The next GDPNow update is Monday, January 10. Please see the “Release Dates” tab below for a list of upcoming releases.
In short the new estimate is lower at 6.7% from 7.4% two days earlier.
Stephen,
I took a look at BLS data, for past 5 quarters the nominal GDP has grown at an annual rate of about 12.8%, the average annual rate of inflation has been about 6.4% over that 5 quarter period so real GDP has been growing at an annual rate of 6.4% over the period from the 2nd quarter of 2020 (bottom of pandemic dip in US) to the enf of the 3rd quarter of 2021 (last official data point from BLS at present).
Data from https://fred.stlouisfed.org/series/GDP/
and
https://data.bls.gov/cgi-bin/surveymost
Thanks Dennis!
Chart from Atlanta Fed GDPNow webpage
Ovi, your last chart shows world oil production in December 2021 at 80,000,000 barrels per day. I assume that is the EIA’s estimate. Have they lost all credibility? What the hell is hapening?
Ron,
I agree the estimate may be too high, but if the linear trend in increased World C plus C output continues, we may see 80000 kb/d for World C plus C by January or February of 2022. The average annual rate of increase in World C plus C output from June 2020 to September 2021 (using OLS regression to determine trend) has been about 5200 kb/d per year, extrapolating that trend by 15 months gets us to 83250 kb/d by Sept 2022. I doubt that happens, but 80000 kb/d by March 2022 seems a reasonable guess, I don’t think we will reach 83000 kb/d until 2023 or later.
Dennis, please see my reply to Ovi below. I meant 82 million barrels per day by December, not 80 million. However, you wrote:
The average annual rate of increase in World C plus C output from June 2020 to September 2021 (using OLS regression to determine trend) has been about 5200 kb/d per year, extrapolating that trend by 15 months gets us to 83250 kb/d by Sept 2022.
Yes, extrapolating the past into the future really works miracles. However, that was recovering from the covid shutdown. If you look at the data from most nations, like Russia and eight of the OPEC nations, you will see that they have recovered about all they are going to recover.
Ron,
We will see. I do not think the linear trend is a good way to predict the future, even when you use such a method (mostly for declining nations).
Note that I said as much in the next sentence which you omitted
I doubt that happens, but 80000 kb/d by March 2022 seems a reasonable guess, I don’t think we will reach 83000 kb/d until 2023 or later.
From the September 2021 level, OPEC plus Russia has increased output by 678 kb/d through November 2021, if Iranian and Venezuelan sanctions are removed OPEC plus Russia may be able to increase output by 3400 kb/d above the November 2021 level to 41960 kb/d, in addition Brazil, Canada, Norway, US and Guyana can all increase their output from the September 2021 level.
Ron
That 80,000 kb/d estimate uses the December STEO report along with the International Energy Statistics to make the projection. To make that estimate requires removing US all liquids from the data. I do that because the US has a much lower C plus C ratio to all liquids than the other countries. The next step is to calculate the ratio for the remaining countries of EIA C plus C to all liquids and then projecting it forward and then adding back in the US EIA C plus C numbers.
While it is a logical procedure, once one starts to use past ratios to project into the future there are risks. So it is an estimate based on info the EIA is providing. Not sure what the /- would be on that 80,000 kb/d. I would say it is close to 500 kb/d but more to the negative side and gets smaller as we get closer to that projected month. The December 2022 estimate could be closer to plus/- 750 kb/d.
If you were to go back to the May report on Non-OPEC production, the estimate for December 2021 was 80,622 kb/d. So the EIA estimated all liquids numbers have been slowly coming down since then and I would not be surprised if we ended up around 79,750 kb/d when we get the real numbers in March.
Hopefully this clarifies the hoops one must go through to come up with that estimate. Now that you have raised it, let’s see where December comes out when it really come out.
https://peakoilbarrel.com/may-non-opec-oil-production-up-slightly/#more-33004
Thanks, Ovi, and thanks for all the work you have to do to estimate total C+C from the total liquids data. I really screwed up in that post. I wrote 2021 when I should have written 2022 and I wrote 80 million when I should have written 82 million. But I was getting pretty groggy at the time. I was looking a lot like this: 😒
Perhaps I am a little overly pessimistic, but I do not believe world production will increase by 4 million barrels per day this year. Perhaps I should have just said that and left out all the drama.
What I think the EIA, and all the other optimistic procrastinators are doing is overlooking the natural decline many nations have had since 2019, and will continue to have through 2022. Most have recovered from the covid cut as much as they are going to recover.
Thanks again for all the hard work.
Ron,
I agree the EIA estimate is likely too optimistic and that a 4000 kb/d increase in World output over the October 2021 to December 2022 time frame is not very likely, the rate of increase will depend in part on oil demand and the price of oil as well as depletion and geological constraints. I imagine output might rise to 80 to 81 Mbpd by Dec 2022 and then by about 1 to 2 Mb/d (say 1.5 Mb/d as a best guess) for another 2 years and then about 750 kb/d for another couple of years with slowing output to a peak in 2027 with decline thereafter. My guess for the final peak in World C plus C is about 85 to 87 Mbpd in the 2026 to 2028 time frame.
The Bakken story is over ?
https://www.oilystuffblog.com/news-stuff
Hole in head,
So far about 16888 horizontal oil wells have been completed in the Bakken/Three Forks of North Dakota. For scenario presented below URR is 7.4 Gb. My ND Bakken/Three Forks scenario has a total of roughly 23300 wells completed (6440 remaining to be completed after October 2021), many of these will be tier 2 and tier 3 wells which may be profitable as oil prices rise. Cumulative output though Oct 2021 is about 4 Gb and if no more wells were completed after October 2021 the URR for the Bakken would be 5.4 Gb. This implies the remaining 6440 wells completed in the scenario below have an average new well EUR of 311 kbo with new well EUR gradually falling from 350 kbo in Nov 2021 to 269 kbo in August 2029 when the final wells are completed in the scenario. Bakken is past peak, but more wells will be completed, if oil prices remain at $75/bo or higher in 2020$ until June 2028 as my scenario assumes.
Deep Freeze Disrupts Crude Flows in Oil Sands and Bakken
(Bloomberg) — A deep-freeze in Canada and Northern U.S. is disrupting oil flows, causing a surge in crude prices just as American stockpiles are declining.
So this is why WTI is currently spiking.
A new Earth Quake in the Permian.
Seems this might increase capex if waste water wells are destroyed. Perhaps it also might increase frack hits and contact between wells.
https://oilprice.com/Energy/Energy-General/Strong-Earthquakes-Spell-Trouble-For-Americas-Oil-Heartland.html
Frugal
I think it is more related to this article.
Oil extends rally on Kazakhstan unrest, Libyan outages
“Our reference case now assumes the alliance will fully phase out the remaining 2.96 million bpd of oil production cuts by September 2022,” JP Morgan analysts said in a note.
“With signs of demand withstanding the Omicron variant, low stocks and increasing market vulnerability to supply disruptions, we see the need for more OPEC barrels,” the bank said. JP Morgan forecast Brent prices to average at $88 a barrel in 2022, up from $70 last year.
Meanwhile, the world’s top oil exporter, Saudi Arabia, cut the official selling price for all grades of crude it sells to Asia in February by at least $1 a barrel, three sources with knowledge of the matter said on Thursday. (Additional reporting by Florence Tan and Naveen Thukral; editing by Jason Neely)
With supply shortages being exasperated by Libya, why would SA drop its prices. Puzzling.
https://financialpost.com/pmn/business-pmn/oil-extends-rally-on-kazakhstan-unrest-libyan-outages
Ovi,
I have read that Iran is discounting the oil it sells to China, Saudi Arabia may be trying to steal some market share from Iran, this is just a WAG on my part, perhaps Saudi Arabia is worried about excess supply in the future and wants to ensure customer loyalty? Much of the oil may be sold based on long term price agreements and these marginal barrels and their price might simply be window dressing to keep Biden off their back.
Dennis
That makes some sense considering the news coming out today on Libya and the difficulty OPEC + is having in meeting its commitments.
OPEC Added 90,000bpd of Projected 400,000bpd to Nigeria in December
Libya’s production is in turmoil again after the country enjoyed a year of recovery and stabilisation. Output began to falter after militias shut the country’s biggest oil field, Sharara, ending the month down by 70,000 barrels a day at 1.06 million.
With the outage dragging on and compounded by damage to a pipeline connecting the largest export terminal — production is sinking to just 700,000 daily barrels.
Ten of OPEC’s 13 members were permitted to add roughly 250,000 barrels a day last month under the terms of the group’s accord with the wider coalition, but their combined hike amounted to only 150,000 barrels.
https://www.thisdaylive.com/index.php/2022/01/06/opec-added-90000bpd-of-projected-400000bpd-to-nigeria-in-december/
Using NATO-forces to topple Khadaffi, as bad as he and his sons however were, might not have been that brilliant from total human misery, or secondarily ultimate recovery viewpoints…
(but at least he can´t sell the oil prices in Es)
Nonsense, Muammar Gaddafi was toppled by the Arab Spring that swept across North Africa 11 years ago. NATO forces had absolutely nothing to do with it. These goddamn conspiracy theories get more stupid every day.
‘War weary’ Libya reflects 10 years on from Gaddafi and Arab spring
Well I know of a few Swedish airforce units deployed, for reconaince purposes allegedly, and quite possibly/likely (even though we are not full fledged NATO participants, to Kalle Stropps, i.e Carl Bildt´s, dismay) to support the NATO air buzz in support of the events that definately took place.
Hence my remark.
Edit: but it was not M1 Abrams or Leopard IIs rolling in that sealed his faith, so might have worded it bit more clearly regarding that…
Edit 2, Ron, have you actually read the article you linked to?
It kind of proves my point.
From the article: “By August Gaddafi his inner circle was “gone”, fleeing Tripoli after Nato planes led by Britain and France entered the war, their command of skies bending the outcome decisively in the rebels favour.”
I rest my case.
Hey, congratulations. You win this one. That’s the second mistake I have made in the last decade. 😁
Ron, you are more than welcome, and a big, big thank you to you, and to all the others, for the excellent work!
Gaddafi’s son is the leading contender in the current presidential election race .
https://www.aljazeera.com/news/2021/12/2/libya-court-reinstates-gaddafis-son-as-presidential-candidate
Gulf energy companies took on more debt in 2021 than any year in 25 years. Higher energy prices meant revenues were higher. Where did all the money go?
Perhaps they are investing a lot to maintain their production or to increase it after halting extraction from mature oil fields during the first wave of covid.
Saudis have to borrow every year to pay the Aramco dividend
https://archive.dhakatribune.com/business/2020/12/17/aramco-may-have-to-sell-assets-borrow-more-to-maintain-saudi-dividend
I’m assuming they have to borrow in US dollars to pay dividends in US dollars. Their revenue from oil sales is in US dollars.
Being a state run oil company I don’t see why they’d have to borrow in their local currency to pay dividends in local currency.
This is a common method to mask state debt. Letting a state owned or controlled company take on debt – otherwise the state would have to take on debt for the investment.
It’s done often here in Germany, too. The 100% state owned railway company takes on a loan to finance a new line – it doesn’t appear in the state budget.
Or even with Aramco – pay out dividends on credit to finance the state budget with $s. Nothing to see here move on ;).
The article says they should be able to pay CAPEX and find the dividend at oil prices of $50 and above.
So right now they should be generating a lot of cash.
Actually the big borrower in 2021 was Qatar who borrowed to fund an LNG export terminal. I am still surprised at borrowing levels because Saudi rig counts are down as is upstream investment in the Gulf, see link above: https://peakoilbarrel.com/us-october-oil-production-rebounds-after-hurricane-ida/#comment-732871
The borrowing was done to distribute to the peasants and keep them calmed down as they were becoming restless . Of course some of it went to build mosques and siphon the rest off for buying yachts and Mcmansions in London and New York . BAU .
Thanks Ron,
An alternative way of looking at this is OPEC plus Russia, US, China, Canada, Brazil and Norway then World minus this group (“rest of World”). I use EIA C plus C data in kb/d. In Sept 2021 the OPEC plus 6 nayions group produced 78% of World C plus C output. The following is World C plus C average annual output prediction for 2021 to 2028 in kb/d:
76787
79287
81287
82787
83787
84537
85047
85557
The below chart are the 10 producing nations that Dennis said, a month or so ago, would bring the world to new heights in oil production. They represent 60% of world oil production. They are about 2.8 million barrels per day below their pre-covid high. They will very likely reach that level within the next year or two.
The data is through September 2021.
The chart below is the world less The Big 10 listed above. They represent 40% of world oil production. They are about 2.9 million barrels per day below their pre-covid high. They have moved very little in the last 11 months. They were already in steady decline and will never reach their pre-covid high., In fact, they by the end of 2022 they will very likely be well below the point they are here in September of 2021. The Big 10 must, in order to hold off peak oil, overcome the deficit they are in today, but also make up the deficit of this group. That is not going to happen
Thanks Ron,
An alternative way of looking at this is OPEC plus Russia, US, China, Canada, Brazil and Norway then World minus this group (“rest of World”). I use EIA C plus C data in kb/d. In Sept 2021 the OPEC plus 6 nayions group produced 78% of World C plus C output. The following is World C plus C average annual output prediction for 2021 to 2028 in kb/d:
76787
79287
81287
82787
83787
84537
85047
85557
And if you remove Russia from the mix.
If Russia is removed from one group it should be added to the other.
Dennis, I was just showing what the decliners would look like with Russia removed. Russia was not in your original Big 10, so I will not add to your data. I don’t want to change your prediction.
Ron,
I had commented earlier that leaving out Russia was a mistake on my part, I would include Russia with that group of 10. Note that much of the fall in that World less 11 group of oil producers was from Venezuela which saw its output fall by about 1800 kb/d from 2015 to 2021.
Excluding Venezuela the decline is smaller dropping from about 1000 kb/d per year to 700 kb/d per year. If that continued it would add up to 3500 kb/d over the next 5 years.
Consider that centered average tight oil output was about 7 Mb/d at the November 2018 peak. We may see a final peak in 2027 at as much as 12 Mb/d, OPEC output may grow with higher oil prices and more investment in Iraq, Iran, UAE, Saudi Arabia, and Kuwait, Canada, and Brazil are likely to see output increase and Guyana and Suriname are also expected to see increased output and Norway through 2025.
I had commented earlier that leaving out Russia was a mistake on my part, I would include Russia with that group of 10.
Not a problem Dennis. I have created a new chart that includes Russia. I will post it down below where I get a wider area for the chart.
Dennis’ latest prediction from his 2:34 PM post above. The red prediction was from several months ago. I saved the chart but not the data. I will post that chart below this one. I think he has severely missed his earlier estimate for 2021 and will miss his earlier 2022 estimate as well.
Here is the earlier chart. Sorry I do not remember the date.
Note the rate of extraction for conventional crude plus condensate resources in chart above, this scenario guessed at future extraction rates and assumed rates of development of discovered resources continues in the future at historical rates, it also assumed relatively aggressive development of unconventional oil resources (tight oil and extra heavy oil) over the 2021 to 2030 period due to relatively high oil prices.
The “current estimate” was a back of napkin type of estimate and was not model based.
Below I have two scenarios for World output using Paul Pukite’s Oil Shock Model methodology, cumulative C plus C output through the end of 2020 is about 1422 Gb, the scenarios have URR of 2500 Gb. My guess is that output is likely (probability 60%) to fall between these two scenarios with perhaps a 25% chance the output path would fall below the low scenario and maybe a 15% chance it would be above the high scenario. The probabilities are my subjective estimates or WAGs.
BSEE just came out with their GOM oil production for October-2021 and there is a bigger than normal difference between it and EIA’s estimate.
BSEE’s total was 47,488,175 BO, or 1.53 MMBOPD vr. EIA’s total of 54,072,000 BO or 1.74 MMBOPD. BP’s Thunderhorse and Thunderhorse North were still completely offline, and Shell’s Mars-Ursa complex was still mostly offline in October. These are, I think, the biggest contributors to the shortfall.
As discussed earlier, Hurricane Ida damage to the West Delta 143 platform is contributing to this. Repairs to this platform were completed in early November.
So, in the grander scheme of things, this would result in total US production in October dropping from about 11.5 to 11.3 MMBOPD.
Bob
It will be interesting to see how much the November EIA report reduces its current October GOM estimate. If you look back at previous months, do the BSEE numbers and the EIA numbers coincide. In other words, does the EIA use the BSEE numbers to update their latest GOM estimates?
Ovi,
There still are differences between the BSEE and EIA numbers after a few months, but the differences become smaller. The EIA does not make their numbers match the BSEE numbers.
I prefer the BSEE numbers because they come from the operators. The BSEE numbers for previous months do change slightly as operators make revisions, called “prior period adjustments”. l’m not quite sure how the EIA estimates their production numbers.
Bob Meltz,
Typically the EIA surveys the largest producers that produce 80% to 95% of output from an area and then make a statistical estimate of the rest of the output from smaller producers for their initial estimate, eventually the EIA revises their estimate to match those of State Agencies and for GOM the may just use the BSEE estimate after a 12 to 24 month period. For most years from 2004 to 2019, the BSEE estimate is slightly higher than the EIA estimate, for 1985 to 2003 most years the BSEE estimate is higher, but for a few years it is lower, the cumulative total oil from 1985 to 2003 is about 28 million barrels higher for BSEE data compared to EIA data. For 2004 to 2019 the difference was only 4.8 million barrels (BSEE was higher) and in percentage terms the earlier estimate was 0.39% higher for BSEE data vs only 0.06% higher for the 2004-2019 period.
I agree the BSEE data is likely better, but wonder if reporting might have been impacted by the hurricane, so perhaps BSEE data might be revised up in the future.
kazahkstan oil surplus 1.8 mbpd production – 0.379 mbpd = 1.4 mbpd.
Consumption falling during 2 virus years. About 20K bpd. Production fell 100K bpd. Net change of
surplus 80K bpd or 5.7%
Coal production:consumption DEFICIT
Natgas surplus constant thru virus years.
Might want to think about coal. Not producing enough. Unlike Ukraine’s Donbas.
Well , Putin sent in Russian forces on request from the Kazakh President for assistance to control the situation . Now the Kazakh govt owes Mr Putin a favor ( in eastern culture it’s called a debt ) . Putin owns oil, gas and coal , now add uranium . Repeating myself ” Don’t mess with Mr Putin ” .
Here’s How Exxon Could Go Even Bigger on Its Dividend — Barrons.com
11:46 am ET January 6, 2022 (Dow Jones) Print
Avi Salzman
Oil companies used to compete on how much crude they could produce. Now they’re competing on how much cash they can send back to investors. That dynamic could pay off for Exxon Mobil shareholders, argues one analyst who is no longer bearish on the stock.
Truist analyst Neal Dingmann wrote in a report published Thursday that Exxon looks as if it is going to generate more than enough cash to pay off debt and still have enough to raise its dividend and buyback. He upgraded his rating to Hold from Sell, with a $65 price target. Shares were up 1.3% on Thursday, to $67.62.
The idea that Exxon could raise its dividend had seemed unthinkable just a year ago, because the company looked as if it might have to cut the payout. Exxon had loaded up on so much debt in 2020 to get through the pandemic that it had few options left should oil prices turn south again. Luckily for Exxon, oil prices kept rising, gaining more than 50% in 2021.
The company also cut costs in several areas, and reduced its expectations for capital spending through 2027. The result is that Exxon was able to raise its dividend last year, keeping it on the list of Dividend Aristocrats. The stock’s dividend yield is now 5.2%.
But Dingmann thinks that the company could boost it even more, as it strives to keep up with other oil companies. Exxon’s payout is still larger than most Big Oil peers, besting Chevron’s (CVX) 4.4% yield and BP’s (BP) 4.6%.
****************
ExxonMobil Makes Two Discoveries Offshore Guyana
8:30 am ET January 5, 2022 (BusinessWire) Print
ExxonMobil today said it made two oil discoveries at Fangtooth-1 and Lau Lau-1 in the Stabroek block offshore Guyana.
The Fangtooth-1 well encountered approximately 164 feet (50 meters) of high-quality oil-bearing sandstone reservoirs. The well was drilled in 6,030 feet (1,838 meters) of water and is located approximately 11 miles (18 kilometers) northwest of the Liza field. The Lau Lau-1 well encountered approximately 315 feet (96 meters) of high-quality hydrocarbon-bearing sandstone reservoirs. The well was drilled in 4,793 feet (1,461 meters) of water and is located approximately 42 miles (68 kilometers) southeast of the Liza field.
These discoveries will add to the previously announced recoverable resource estimate for the block, of 10 billion oil-equivalent barrels.
My base case scenario is things will seem normal or not much different than they are now when FED finishes up the taper in March.
They will get away with one rate hike. But if inflation is still high which I think most everyone will agree it will be. They will do a 2nd, 3rd and maybe 4th rate hike or hike 0.50% instead of the normal 0.25% rate hikes they do.
At which point the rate hikes becomes the deflationary catalyst that sends the yield on the 10 year bond 100-150 basis points lower. Yield is at about 1.7% currently. And it will be at 0.7% or less if they follow through with what they say their going to do.
If they do 3-4 rate hikes in 2022 the chances of seeing a inverted yield curve with the 2’s and 10’s are extremely high. And it will invert while the 10 year is well under 1%
And oil prices will crash along with a whole lot of other things.
Negative nominal yields in US would mean a whole lot of money would be forced to exit market or unwind. Think European and Japanese money that fled negative interest rates at home for a decade would now be forced out of US markets.
But what is the FED to do? Dammed no matter what choice they make.
They ran out of road to kick the can down.
As long as the 10 year interrest rates crash to near 0 or even under it ( German ones are negative a long time now), bond owners make money by increasing value.
Things spiral out of control fast when the interrest rates on 10 and 30 years begin rising fast – than collateral value will shrink, and we’ll see a margin call spiral here.
I don’t know where the trigger value is, but when this happens the FED has to step in fast and furious, otherwise there will be a complete crash since stocks, real estate and commodities will crash, too in such a tsunami.
And this taper can trigger this – now still the FED is the biggest single buyer of US bonds. When this stops or even reverses, new buyers have to be already there.
It’s like all big tech companies stop buybacks until march – things won’t be nice then, too.
Banks are and will be the buyers. They don’t care about the yield. They buy them to use as collateral at repo to borrow money. They’ll buy at any price.
Even with negative interest bonds will be bid. And remember US banks are sitting on over $4 trillion worth of US government T bills and bonds. Are banks going to lose hundreds of billions of dollars because yields spike?
The lower the yield the higher the value of the bonds the more money that can be borrowed in Repo market. If yields go other way. Higher the yield the lower the value of the bond the less money can be borrowed in repo market.
I don’t see banks losing hundreds of billions of dollars going over too well. Those shorting US treasuries are going to get burned in the end when banks move to protect that $4 trillion portfolio of treasury debt they own.
Long term bonds over the long term are going to zero. FED can do negative interest rates but there will be lot of negative consequences. Or they can watch everything blow up because they chose not to do negative interest rates.
Trillions of Euros and yen’s leave US markets if negative interest are implemented. And while at first that is dollar negative. Ultimately all those Euros and yen coming home blows up the economy and currency of Europe and Japan.
This is why I believe something breaks within 12-18 months. We just ran out of room to kick the can.
And why higher oil prices needed to keep production up just aren’t going to stick for any amount of time.
I know the painted narrative is rosy will nothing but growth in the future. But it’s complete bullshit.
Yes I agree this is not stable at all. And the FED wants to know it now – not the usual talk and change nothing action anymore.
I still don’t know in which direction this blows up. Much depends on the media – people start loosing the believe in the soundness of money here at the moment. When this happens more and people start spending their money as fast as they can to avoid inflation (and even take every cheap credit they get), we blow up inflationary.
A deflationary crash on the other hand will drive the complete economy into insolvency – given the today debt load.
There will be the point with any scenario where new money is needed to stop a spiral. Or start an socialism with pretty shiny paper money that’s nothing worth without the according buying allowance. And a press that says everything is fine.
Another thing is without US treasury issuing as much debt due to lack of fiscal stimulus. Those that are short treasuries. When the short squeeze comes and it’s going to come
It’s going to be very difficult for the hedge funds who are shorting treasuries to cover their shorts. Lots of margin calls in the future for those guys. And they will have to sell the stock, Bitcoin , gold and whatever else they own to meet those margin calls.
It’s the kind of thing that can knock the price of oil down 20% in a week.
Copy + paste from a comment on The Automatic Earth . Interesting .
“There’s step one: Powell tries to appear like a hawk. Let’s see how far he gets. He couldn’t even suggest, much less act, without a taper tantrum.
If you’re not inside baseball, one key element can’t be reversed: we’re at zero rates and also zero reserves. That’s like replacing Santa’s reindeer with two goats and a dog: the whole underlying structure, history, and action will be different than usual. Second is, no one believes he’ll taper at all. He’ll shut off one fix-er-up-chappie, and create another one out of sight with a new name to replace it.
But we play games one move at a time.
Like Bitcoins, warning of breakdown, now breakdown, looking for the buy. We’re already near 100% gain back to previous highs, so here’s your chance. You’ll need it for chicken and gas, Brandon. “
OPEC oil output boost in December again undershoots target
The Organization of the Petroleum Exporting Countries (OPEC) pumped 27.80 million barrels per day (bpd) in December, the survey found, up 70,000 bpd from the previous month but short of the 253,000 bpd increase allowed under the supply deal.
If this is correct then the chart below is correct.
Well, they have done the job that they were supposed to do : coming back to the production of february 2020. And now? That will not prevent the others to be in decline…
Well, the world, in September was still 4,636,000 barrels per day below the production of February 221 and 5,457,000 barrels per day below the 12 month average high in April 2019. So they just ain’t helping very much.
The Chart below is Dennis’s Big 11, the group that he says will insure a new world oil peak later in this decade. They are 74% of world oil production, or was in September. The data is through September 2021. It looks like that in September, they had stalled out at about 3.5 million barrels per day below their pre-covid average.
It is very important to note that the other 26% of world oil production is in steep decline.
Costs in ther Permian will climb again:
https://oilprice.com/Latest-Energy-News/World-News/Texas-Clampdown-On-Disposal-Wells-Hits-Oil-Producers.html
Now wast water disposal will get more expensive.
Eulenspiegel,
It might also lead to conservation of water in a very dry area by recycling the water for reuse in frac jobs, in the long run this may reduce costs as better methods are devised for recycling the water used for hydraulic fracs.
In any case the price of oil is likely to rise enough to support any increased cost, if not less tight oil will be produced.
The laughing guy on Biden’s SPR release . ROFL . Enjoy .
https://twitter.com/StreetBomber/status/1479137921001213956
Some people say the stock market leads
Here is a comparison of four stocks, one Canadian and three US. CNQ and PXD are oil producers while CVX and XOM are full service oil majors. It looks like money is pouring into these oil stocks.
Loot and scoot .
https://www.mrt.com/business/oil/article/Alleged-Permian-Ponzi-Scheme-Funded-Jet-Bahamas-16757172.php
New post up by Bob Meltz, aka SouthLageo, thanks Bob, great job.
https://peakoilbarrel.com/update-on-the-wilcox-in-the-offshore-northern-gulf-of-mexico/
and
https://peakoilbarrel.com/open-thread-non-petroleum-january-8-2022/