A Guest post by:
Dr. Minqi Li, Professor
Department of Economics, University of Utah
E-mail: [email protected]
This Annual Report evaluates the future development of world energy supply and its impact on the global economy as well as climate change. The report projects the world energy supply and gross world product (global economic output) from 2017 to 2050. It also projects carbon dioxide emissions from fossil fuels burning and the implied global average surface temperature from 2017 to 2100.
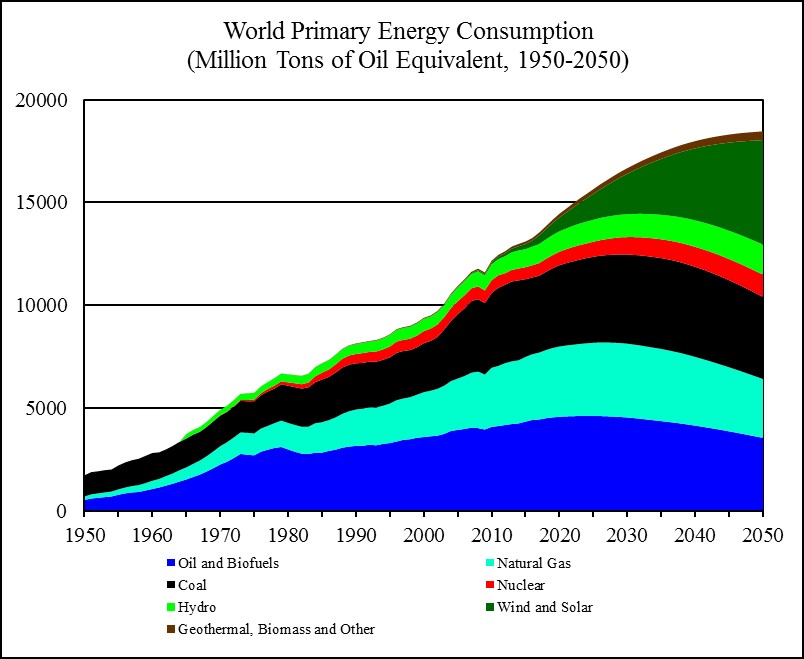
Figure 18
Sources: World historical oil, natural gas, and coal consumption from 1950 to 1964 is estimated from carbon dioxide emissions (Boden, Marland, and Andres 2017); world primary energy consumption and its composition from 1965 to 2016 is from BP (2017); world primary energy consumption and its composition from 2017 to 2050 is based on this report’s projections.
To project the future oil and natural gas production, this report uses Hubbert Linearization as the primary analytical tool. Hubbert Linearization was first proposed by American geologist M. King Hubbert (Hubbert 1982). It plots the current production to cumulative production ratio against the historical cumulative production. It uses the downward linear trend of the current production to cumulative production ratio to determine the ultimately recoverable resources.
Past experience suggests that Hubbert Linearization exercise tends to underestimate the ultimately recoverable oil and natural gas resources. Despite its limitations, Hubbert Linearization provides a useful tool helping to indicate the likely level of ultimately recoverable resources under the existing trends of technology, economics, and geopolitics. To mitigate this “pessimistic” bias, I use the US Energy Information Administration (EIA)’s official projection for the US oil and natural gas production from 2017 to 2050 (EIA 2017, Table A1), which may prove to be too optimistic.
There is a high level of uncertainty regarding the future of the world coal production that may be influenced by economics, climate stabilization requirements, as well as resources constraints. This report uses the “proved coal reserves” reported by the BP Statistical Review of World Energy (BP 2017) to evaluate the future coal production in China and India, currently the first and second largest coal producer in the world. I use EIA’s official projection for the US coal production from 2017 to 2050 (EIA 2017, Table A1). To project the rest of the world’s future coal production, I apply Hubbert Linearization to the rest of the world’s historical coal production data.
For the future wind and solar electricity consumption, I do not impose a definite limit on their future potential. However, I assume that the annual installation of wind and solar generating capacity will grow at a progressively slower rate and eventually approach a certain level of maximum.
For the future production (consumption) of biofuels, nuclear electricity, hydro electricity, geothermal electricity, biomass electricity, I use the projections made by EIA’s International Energy Outlook (EIA 2016).
The previous Annual Report, “World Energy 2016-2050”, was posted at Peak Oil Barrel (Political Economist 2016): http://peakoilbarrel.com/world-energy-2016-2050-annual-report/
Figures and tables are placed at the end of each section.
World Energy 2005-2016
According to BP’s Statistical Review of World Energy, world primary energy consumption reached 13,276 million tons of oil equivalent in 2016 (BP 2017). From 2005 to 2016, world primary energy consumption grew at an average annual rate of 1.8 percent.
World oil consumption (including biofuels) was 4,418 million tons in 2016, accounting for 33.3 percent of the world energy consumption. From 2005 to 2016, world oil consumption grew at an average annual rate of 1.1 percent.
World natural gas consumption was 3,204 million tons of oil equivalent in 2016, accounting for 24.1 percent of the world energy consumption. From 2005 to 2016, world natural gas consumption grew at an average annual rate of 2.3 percent.
World coal consumption was 3,732 million tons of oil equivalent in 2016, accounting for 28.1 percent of the world energy consumption. From 2005 to 2016, world coal consumption grew at an average annual rate of 1.6 percent.
World consumption of nuclear electricity was 592 million tons of oil equivalent in 2016, accounting for 4.5 percent of the world energy consumption. From 2005 to 2016, world consumption of nuclear electricity declined at an average annual rate of 0.5 percent.
World consumption of hydro electricity was 910 million tons of oil equivalent in 2016, accounting for 6.9 percent of the world energy consumption. From 2005 to 2016, world consumption of hydro electricity grew at an average annual rate of 3.0 percent.
World consumption of wind and solar electricity was 292 million tons of oil equivalent in 2016, accounting for 2.2 percent of the world energy consumption. From 2005 to 2016, world consumption of wind and solar electricity grew at an average annual rate of 25.3 percent.
World consumption of geothermal, biomass and other renewable electricity was 127 million tons of oil equivalent in 2016, accounting for 1.0 percent of the world energy consumption. From 2005 to 2016, world consumption of geothermal, biomass and other renewable electricity grew at an average annual rate of 7.4 percent.
According to the World Bank and IMF data, gross world product (global economic output) was 111.5 trillion dollars (in constant 2011 international dollars) in 2016 (World Bank 2017; IMF 2017). From 2005 to 2016, global economic output grew at an average annual rate of 3.5 percent.
World average energy efficiency was 8,401 dollars per ton of oil equivalent in 2016. From 2005 to 2016, world average energy efficiency grew at an average annual rate of 1.7 percent.
According to the BP Statistical Review of World Energy, world carbon dioxide emissions from fossil fuels burning reached 33.4 billion tons in 2016. From 2005 to 2016, world carbon dioxide emissions grew at an average annual rate of 1.4 percent.
World average emission intensity of primary energy consumption was 2.52 tons of carbon dioxide emissions per ton of oil equivalent. From 2005 to 2016, world average emission intensity of primary energy consumption declined at an average annual rate of 0.3 percent.
Figure 1 compares the historical world economic growth rates and the primary energy consumption growth rates from 2005 to 2016. The primary energy consumption growth rate has an intercept of -0.0157 at zero economic growth rate and a slope of 0.959. That is, primary energy consumption has an “autonomous” tendency to fall by about 1.6 percent a year when economic growth rate is zero. When economic growth rate rises above zero, an increase in economic growth rate by one percentage point is associated with an increase in primary energy consumption by 0.96 percent. R-square for the linear trend is 0.860.
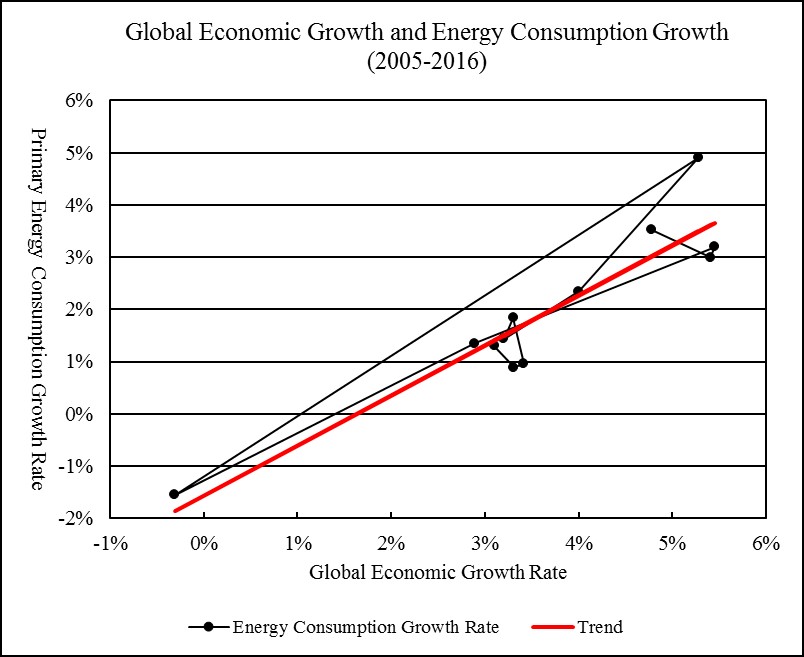
Figure 1
Sources: Gross world product in constant 2011 international dollars from 2005 to 2015 is from World Bank (2017), extended to 2016 using data from IMF (2017, Statistical Appendix, Table A1); world primary energy consumption from 2005 to 2016 is from BP (2017).
Oil
World oil production (including crude oil and natural gas liquids) was 4,382 million tons (92.2 million barrels per day) in 2016, 0.5 percent higher than world oil production in 2015.
In 2016, Saudi Arabia was the world’s largest oil producer by energy content; Saudi Arabia produced 586 million tons of crude oil and natural gas liquids (12.3 million barrels per day), accounting for 13.4 percent of the world oil production.
The United States was the world’s largest oil producer by volume; the US produced 543 million tons of crude oil and natural gas liquids (12.4 million barrels per day), accounting for 12.4 percent of the world oil production.
The Russian Federation was the world’s second largest oil producer by energy content or the third largest oil producer by volume; Russia produced 554 million tons of crude oil and natural gas liquids (11.2 million barrels per day), accounting for 12.6 percent of the world oil production.
Figure 2 shows the historical and projected US oil production from 1950 to 2050. The projection is based on the US Energy Information Administration’s reference case scenario of the US oil production from 2017 to 2050 (EIA 2017, Table A1).
The US cumulative oil production up to 2016 was 33 billion tons. According to EIA’s current projection, the US oil production will peak in 2026 with a production level of 670 million tons and the US cumulative oil production will be 55 billion tons by 2050. Hubbert Linearization applied to the EIA projection from 2041 to 2050 implies that the US ultimately recoverable oil resources will be 90 billion tons.
Figure 3 applies the Hubbert Linearization analysis to the world (excluding the US) oil production. The world (excluding the US) cumulative oil production up to 2016 was 156 billion tons. The linear trend from 2009 to 2015 indicates that the world (excluding the US) ultimately recoverable oil resources will be 356 billion tons. Regression R-square is 0.960. Year 2009 was the year of “Great Recession”. Other things being equal, using a recession year as the initial year in Hubbert Linearization leads to a larger amount of estimated ultimately recoverable resources than using a regular year.
Figure 4 shows the historical and projected world (excluding the US) oil production from 1950 to 2050. The world (excluding the US) oil production is projected to peak in 2022, with a production level of 3,861 million tons.
Figure 5 shows the historical and projected world production of liquid fuels. The world production of liquid fuels is the sum of the US oil production, the world (excluding the US) oil production, and the biofuels production. Projection of world biofuels production from 2017 to 2040 is from EIA (2016, Table G3), extended to 2050 based on the linear trend from 2030 to 2040. The world production of liquid fuels is projected to peak in 2024, with a production level of 4,614 million tons.
By comparison, in “World Energy 2016-2050” (the last Annual Report), world production of liquid fuels was projected to peak in 2023, with a production level of 4,540 million tons.
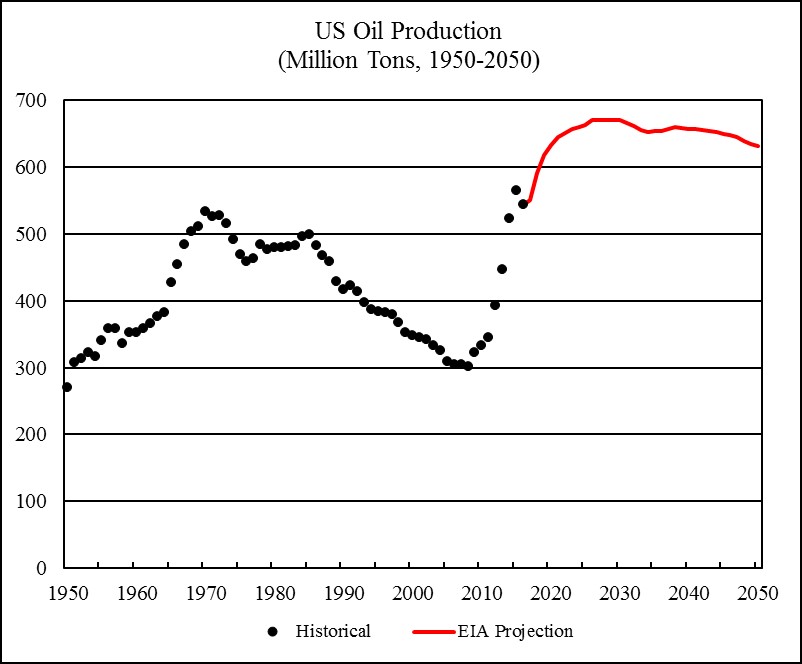
Figure 2
Sources: US historical oil production from 1950 to 1964 is from Rutledge (2008); US oil production from 1965 to 2016 is from BP (2017). Projected US oil production from 2017 to 2050 is from EIA (2017, Table A1).
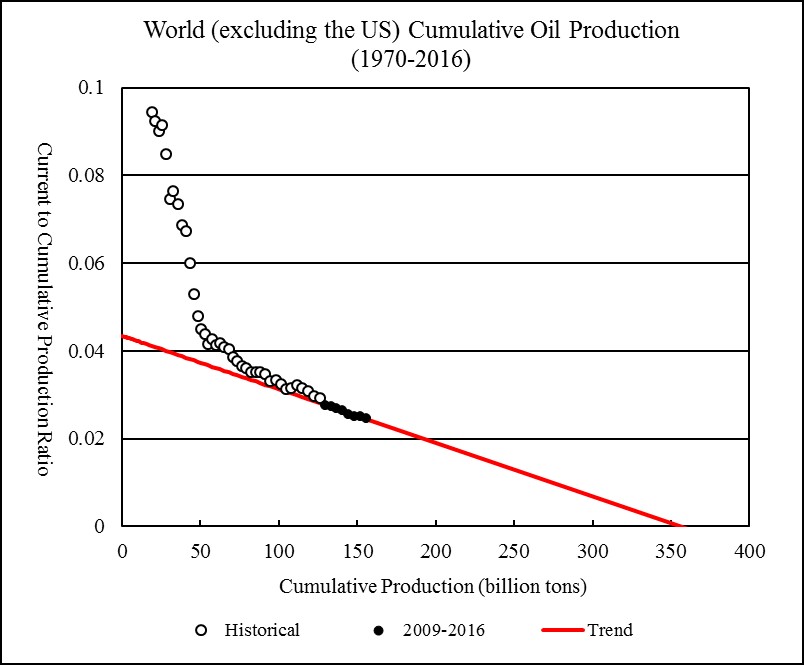
Figure 3
Sources: World historical cumulative oil production is from Rutledge (2008); world oil production from 1965 to 2016 is from BP (2017).
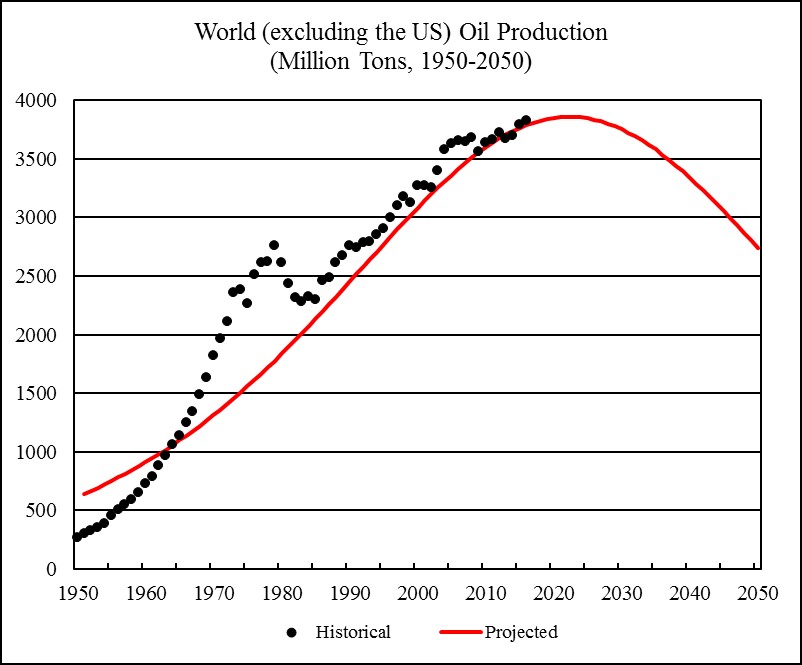
Figure 4
Sources: World historical oil production from 1950 to 1964 is from Rutledge (2008); world oil production from 1965 to 2016 is from BP (2017).
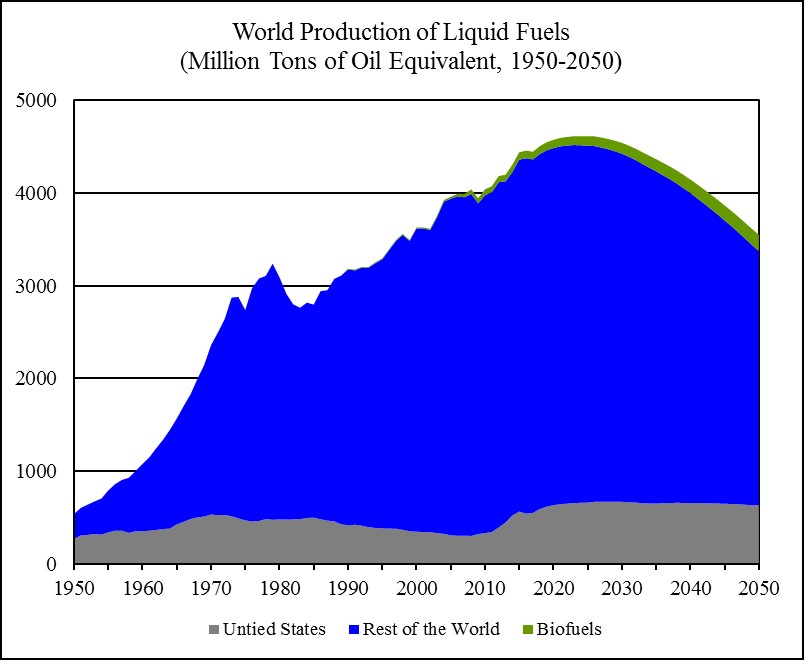
Figure 5
Sources: See Figure 2 and 4 for the US and the world (excluding the US) oil production. World biofuels production from 1990 to 2016 is from BP (2017). Projection of world biofuels production from 2016 to 2040 is from EIA (2016, Table G3), extended to 2050 based on the linear trend from 2030 to 2040.
Natural Gas
World natural gas production was 3,552 billion cubic meters (3,213 million tons of oil equivalent) in 2016, 0.6 percent higher than world natural gas production in 2015.
In 2016, the United States was the world’s largest natural gas producer; the US produced 749 billion cubic meters of natural gas (691 million tons of oil equivalent), accounting for 21.1 percent of the world natural gas production.
The Russian Federation was the world’s second largest natural gas producer; Russia produced 573 billion cubic meters of natural gas (522 million tons of oil equivalent), accounting for 16.3 percent of the world natural gas production.
Iran was the world’s third largest natural gas producer; Iran produced 202 billion cubic meters of natural gas (182 million tons of oil equivalent), accounting for 5.7 percent of the world natural gas production.
Figure 6 shows the historical and projected US natural gas production from 1950 to 2050. The projection is based on the US Energy Information Administration’s reference case scenario of the US natural gas production from 2017 to 2050 (EIA 2017, Table A1).
The US cumulative natural gas production up to 2016 was 32 billion tons of oil equivalent. EIA’s current projection implies that the US cumulative natural gas production will be 64 billion tons of oil equivalent by 2050 and the US ultimately recoverable natural gas resources will be 153 billion tons of oil equivalent.
Figure 7 applies the Hubbert Linearization analysis to the world (excluding the US) natural gas production. The world (excluding the US) cumulative natural gas production up to 2016 was 74 billion tons of oil equivalent. The linear trend from 2009 to 2016 indicates that the world (excluding the US) ultimately recoverable natural gas resources will be 195 billion tons of oil equivalent. Regression R-square is 0.843.
Figure 8 shows the historical and projected world (excluding the US) natural gas production from 1960 to 2050. The world (excluding the US) natural gas production is projected to peak in 2027, with a production level of 2,706 million tons of oil equivalent.
Figure 9 shows the historical and projected world natural gas production. World natural gas production is projected to peak in 2029, with a production level of 3,596 million tons of oil equivalent.
By comparison, in “World Energy 2016-2050” (the last Annual Report), world natural gas production was projected to peak in 2030, with a production level of 3,694 million tons of oil equivalent.
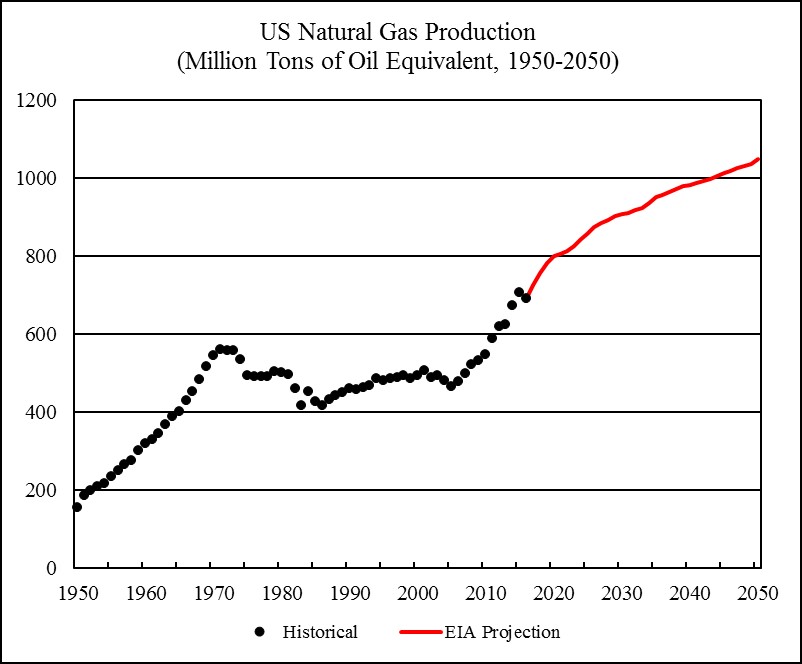
Figure 6
Sources: US historical natural gas production from 1950 to 1969 is from the US Energy Information Administration, Natural Gas Data, Natural Gas Gross Withdrawals and Production, “U.S. Natural Gas Marketed Production”; US natural gas production from 1970 to 2016 is from BP (2017). Projected US natural gas production from 2017 to 2050 is from EIA (2017, Table A1).
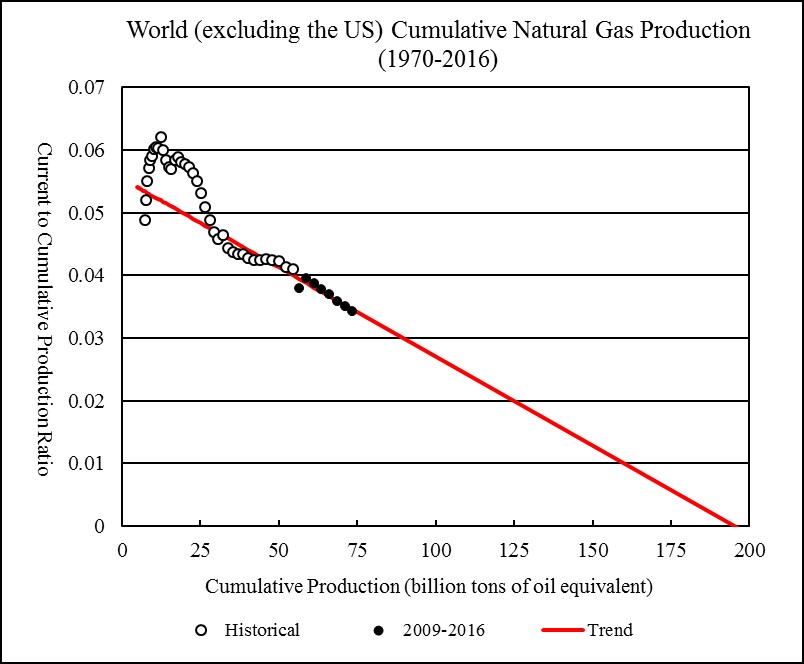
Figure 7
Sources: World historical cumulative natural gas production is from Rutledge (2008); world natural gas production from 1970 to 2016 is from BP (2017).
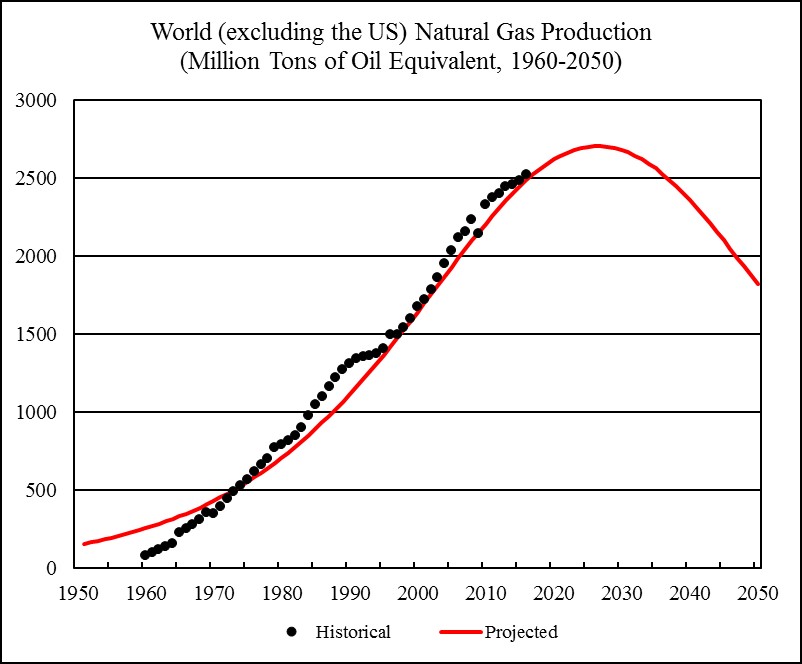
Figure 8
Sources: World historical natural gas production from 1960 to 1969 is from Rutledge (2008); world natural gas production from 1970 to 2016 is from BP (2017).
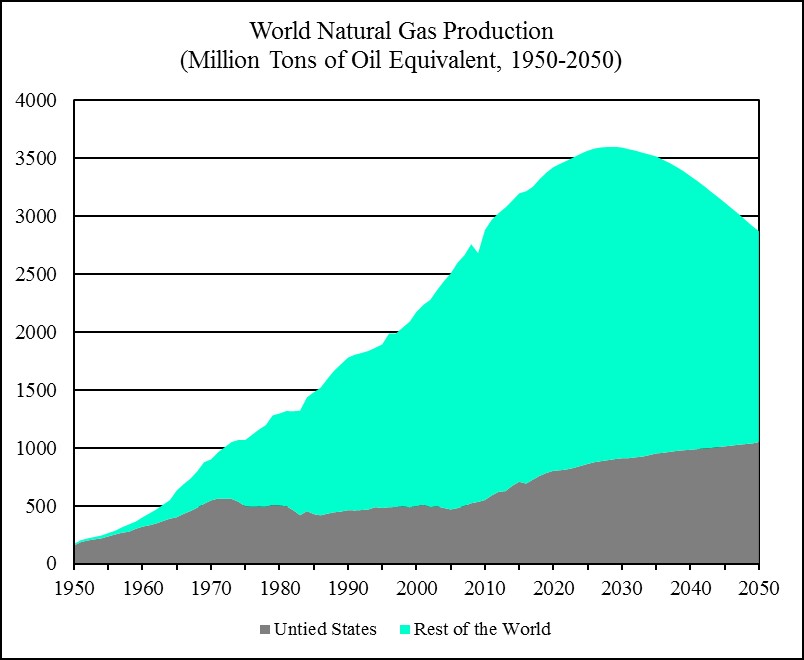
Figure 9
Sources: See Figure 6 and 8 for the US and the world (excluding the US) natural gas production. World historical natural gas production from 1950 to 1959 is estimated using carbon dioxide emissions from natural gas consumption (Boden, Marland, and Andres 2017).
Coal
World coal production was 7,460 million tons (3,656 million tons of oil equivalent) in 2016, 6.3 percent lower than world coal production in 2015.
In 2016, China was the world’s largest coal producer; China produced 3,411 million tons of coal (1,686 million tons of oil equivalent), accounting for 45.7 percent of the world coal production.
India was the world’s second largest coal producer by volume (but the fourth largest coal producer by energy content); India produced 692 million tons of coal (289 million tons of oil equivalent), accounting for 9.3 percent of the world coal production.
The United States was the world’s second largest coal producer by energy content and the third largest coal producer by volume; the US produced 661 million tons of coal (365 million tons of oil equivalent), accounting for 8.9 percent of the world coal production.
Figure 10 shows China’s historical and projected coal production from 1950 to 2050. China’s cumulative coal production up to 2016 was 79 billion tons. According to BP Statistical Review of World Energy, China’s coal reserves were 244 billion tons by the end of 2016. China’s implied ultimately recoverable coal resources are 323 billion tons. China’s coal production is projected to peak in 2036, with a production level of 4,699 million tons.
Figure 11 shows India’s historical and projected coal production from 1950 to 2050. India’s cumulative coal production up to 2016 was 16 billion tons. According to BP Statistical Review of World Energy, India’s coal reserves were 95 billion tons by the end of 2016. India’s implied ultimately recoverable coal resources are 111 billion tons. India’s coal production is projected to peak in 2051, with a production level of 1,396 million tons.
Figure 12 shows the historical and projected US coal production from 1950 to 2050. The projection is based on the US Energy Information Administration’s reference case scenario of the US coal production from 2017 to 2050 (EIA 2017, Table A1).
The US cumulative coal production up to 2016 was 76 billion tons. EIA’s current projection implies that the US cumulative coal production will be 96 billion tons by 2050 and the US ultimately recoverable coal resources will be 138 billion tons. The US coal production peaked in 2008, with a production level of 1,063 million tons.
Figure 13 applies the Hubbert Linearization analysis to the rest of the world’s (world excluding China, India, and the US) coal production. Despite wide fluctuations of the current production to cumulative production ratio over the past century, a long-term downward trend can be identified. The rest of the world’s cumulative coal production up to 2016 was 197 billion tons. The linear trend from 1915 to 2016 indicates that the rest of the world’s ultimately recoverable coal resources will be 382 billion tons. Regression R-square is 0.699.
Figure 14 shows the rest of the world’s historical and projected coal production from 1950 to 2050. In 2013, the rest of the world’s coal production reached 2,798 million tons, which has been the highest level on record.
Figure 15 shows the historical and projected world coal production. World coal production is projected to peak in 2036, with a production level of 8,844 million tons.
By comparison, in “World Energy 2016-2050” (the last Annual Report), world coal production was projected to peak in 2039, with a production level of 8,695 million tons.
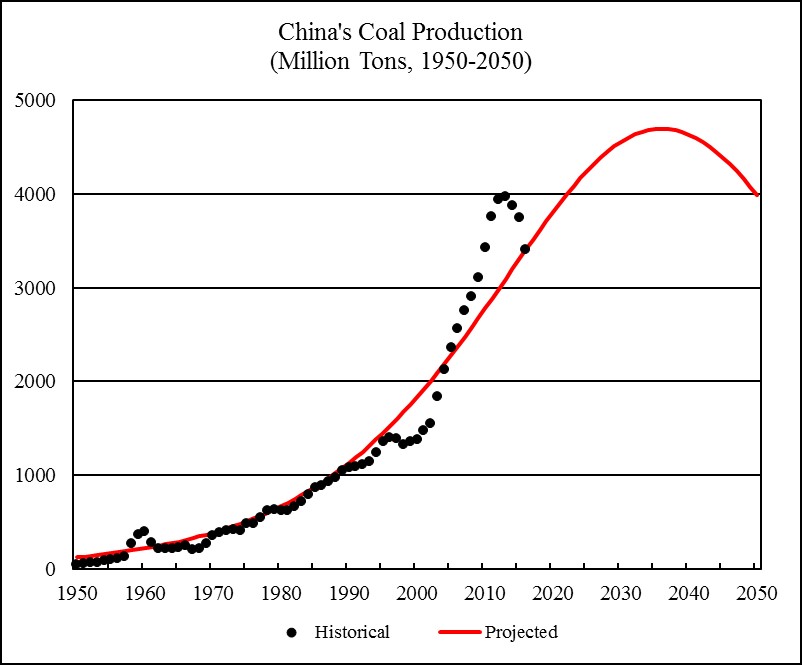
Figure 10
Sources: China’s historical coal production from 1950 to 1980 is from Rutledge (2011); China’s coal production from 1981 to 2016 is from BP (2017). China’s projected coal production from 2017 to 2050 is calculated by this author using the assumption that China’s ultimately recoverable coal resources equal the sum of historical cumulative production and the coal reserves reported by BP (2017).
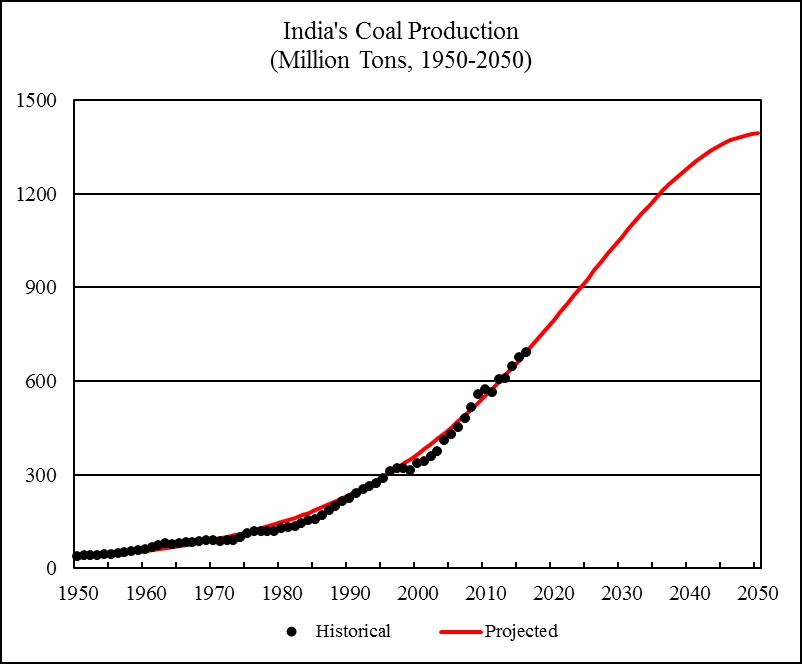
Figure 11
Sources: South Asia’s historical coal production (used as a proxy for India’s coal production) from 1950 to 1980 is from Rutledge (2011); India’s coal production from 1981 to 2016 is from BP (2017). India’s projected coal production from 2017 to 2050 is calculated by this author using the assumption that India’s ultimately recoverable coal resources equal the sum of historical cumulative production and the coal reserves reported by BP (2017).
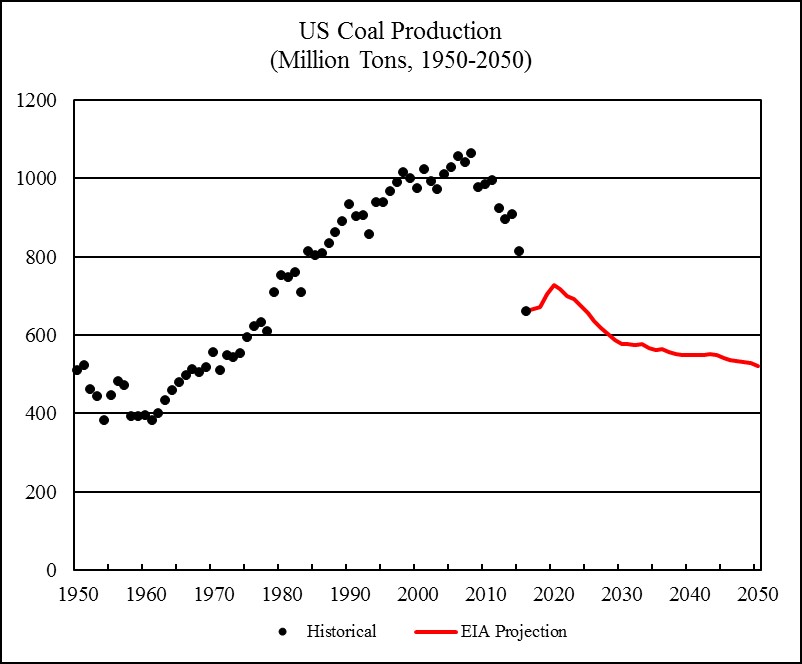
Figure 12
Sources: US historical coal production from 1950 to 1980 is from Rutledge (2011); US coal production from 1981 to 2016 is from BP (2017). Projected US coal production from 2017 to 2050 is from EIA (2017, Table A1).
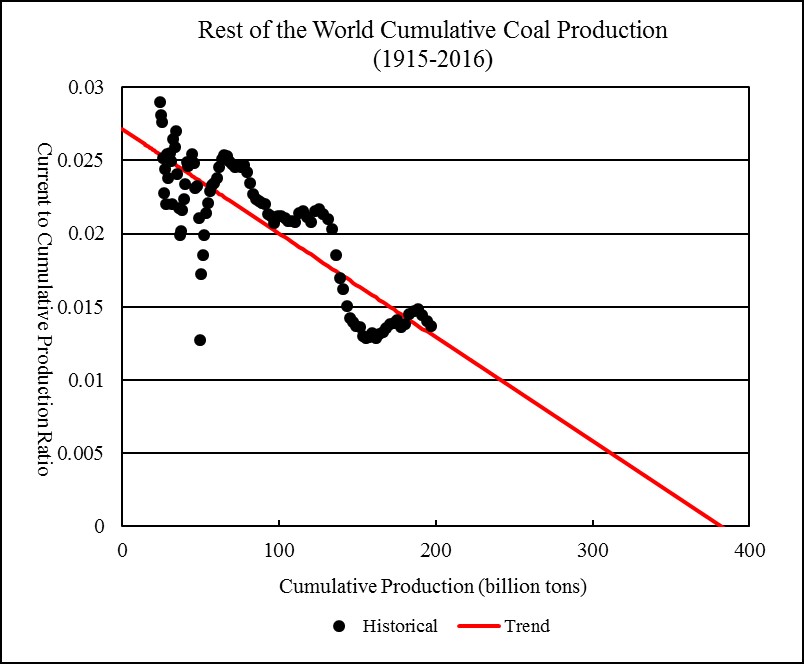
Figure 13
Sources: The rest of the world’s coal production is the world coal production less the sum of China’s, India, and the US coal production. World historical cumulative coal production is from Rutledge (2011); world coal production from 1981 to 2016 is from BP (2017).
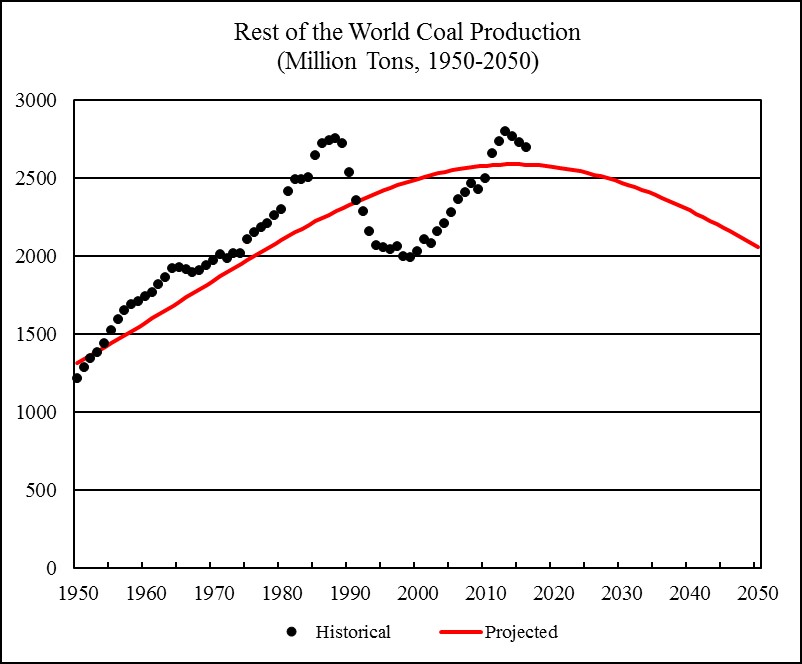
Figure 14
Sources: The rest of the world’s coal production is the world coal production less the sum of China’s, India, and the US coal production. World historical coal production from 1950 to 1980 is from Rutledge (2011); world coal production from 1981 to 2016 is from BP (2017).
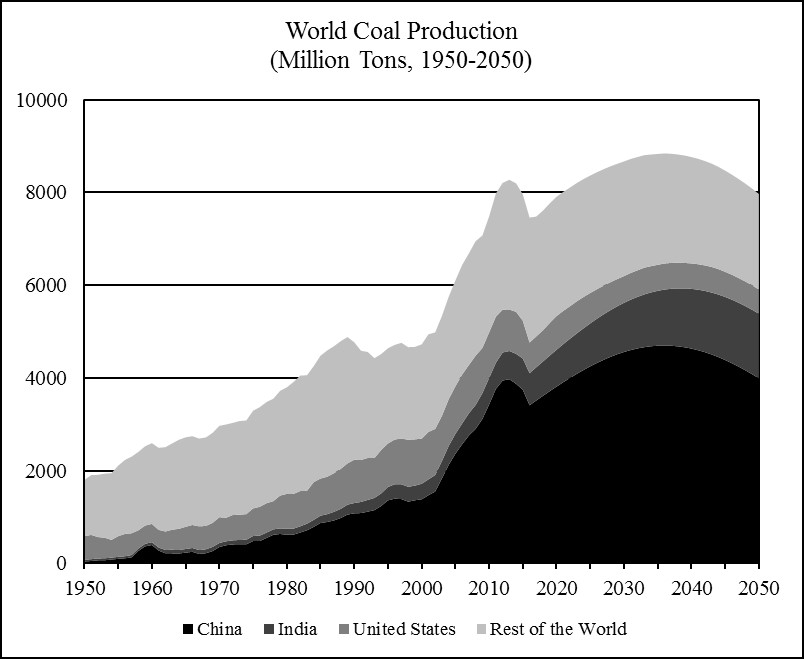
Figure 15
Sources: See Figure 10, 11, 12, and 14 for China’s, India, the US’s, and the rest of the world’s coal production.
Wind and Solar Electricity
World consumption of wind and solar electricity was 1,293 terawatt-hours in 2016 (292 million tons of oil equivalent), 19.2 percent higher than world consumption of wind and solar electricity in 2015.
Wind and solar are renewable energy resources. However, wind and solar electricity is intermittent. Incorporation of wind and solar electricity into electric grids requires maintaining a large backup generating capacity and poses challenges to grid reliability. Curtailing of excess wind and solar electricity when surges of wind and solar generation exceed demand may impose limits on how much wind and solar electricity can be absorbed by a given system of electric grids. In the long run, wind electricity and solar electricity are also limited by the availability of land and mineral resources (Castro et al. 2011 and 2013).
In 2016, the world installed 50 gigawatts of wind generating capacity and 75 gigawatts of solar generating capacity. Figure 16 compares the historical relationship between the annual installation of wind and solar generating capacity and the annual growth to the annual installation ratio (that is, the ratio of the growth of the annual installation to the annual installation) from 1999 to 2016. The downward linear trend indicates that the annual installation of wind and solar generating capacity should eventually approach the maximum of 282 gigawatts (where the linear trend meets the zero horizontal line).
However, the annual growth to the annual installation ratios have fluctuated widely and the R-square for the linear trend is very low (0.071). Wind and solar electricity is still in the early phase of their development. In the future, as data accumulate, one can hope that a more clear and reliable pattern may emerge that can help to illustrate the potential limits to wind and solar development.
The parameters of the linear trend shown in Figure 16 can be used to project the future installation of wind and solar generating capacity. The world’s cumulative installation of wind and solar generating capacity is projected to rise to about 9,400 gigawatts by 2050 (Figure 17). By comparison, in “World Energy 2016-2050” (the last Annual Report), the world’s cumulative installation of wind and solar generating capacity was projected to rise to about 6,600 gigawatts by 2050.
The future wind and solar electricity generation can be estimated using the following formula:
Electricity Generation (current year)
= (Beginning-of-year Generating Capacity + End-of-year Generating Capacity) / 2 * 8760 Hours * Capacity Utilization Rate
In 2016, the observed world average wind electric power capacity utilization rate was 24.7 percent; the observed world average solar electric power capacity utilization rate was 14.4 percent; the observed world average wind and solar electric power capacity utilization rate was 20.8 percent. From 2005 to 2016, the world average wind and solar electric power capacity utilization rate averaged 21.6 percent. These capacity utilization rates are calculated using wind and solar electricity consumption and generating capacity data provided by BP (2017).
I assume that from 2017 to 2050, the world average wind and solar electric power capacity utilization rate will be 22 percent.
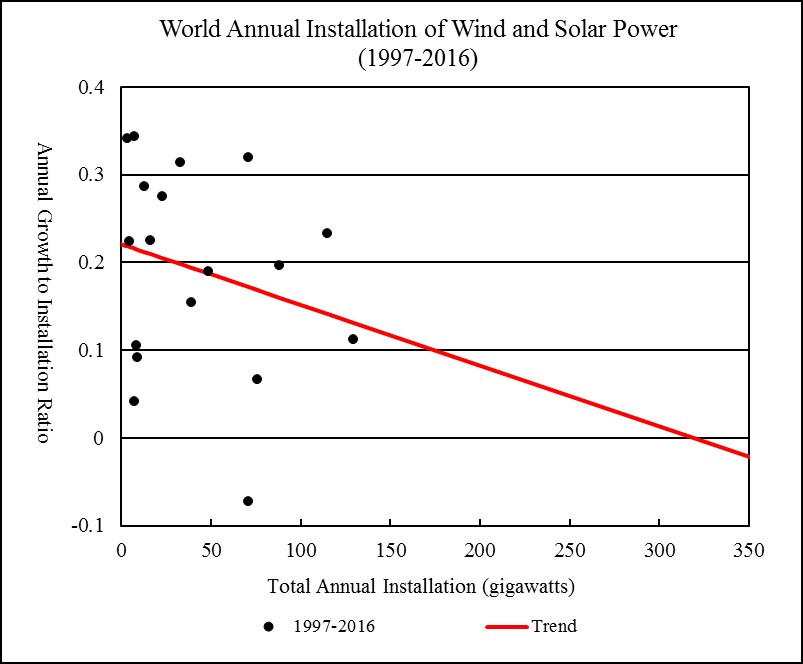
Figure 16
Sources: Annual installation of wind and solar generating capacity from 1998 to 2016 is from BP (2017).
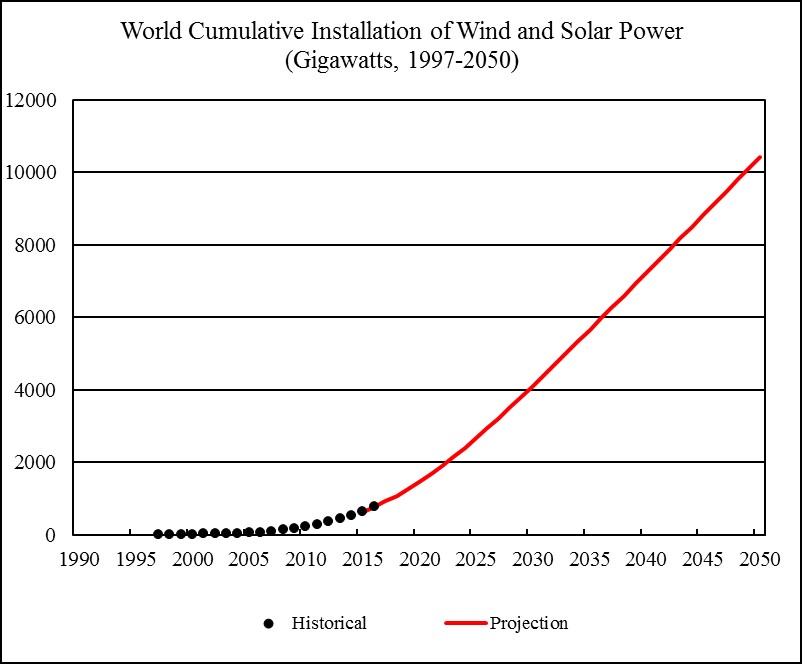
Figure 17
Sources: Cumulative installation of wind and solar generating capacity from 1997 to 2016 is from BP (2017).
Nuclear, Hydro, Geothermal, Biomass, and Other Renewable Electricity
World consumption of nuclear electricity was 2,617 terawatt-hours in 2016, 1.6 percent higher than world nuclear electricity consumption in 2015.
To project the future nuclear electricity consumption, I use the US Energy Information Administration’s projection of net nuclear electricity generation from 2017 to 2040 (EIA 2016, Table H16), extended to 2050 based on the linear trend from 2031 to 2040. I adjusted the EIA’s projection downwards to match the projected net nuclear electricity generation in 2016 with the nuclear electricity consumption in 2016 reported by BP (2016).
World consumption of hydro electricity was 4,023 terawatt-hours in 2016, 3.1 percent higher than world hydro electricity consumption in 2015.
To project the future hydro electricity consumption, I use the US Energy Information Administration’s projection of net hydro electricity generation from 2017 to 2040 (EIA 2016, Table H18), extended to 2050 based on the linear trend from 2031 to 2040. I adjusted the EIA’s projection upwards to match the projected net hydro electricity generation in 2016 with the hydro electricity consumption in 2016 reported by BP (2016).
World consumption of geothermal, biomass, and other renewable electricity was 561.7 terawatt-hours in 2016, 4.7 percent higher than world consumption of geothermal, biomass, and other renewable electricity in 2015.
To project the future consumption of geothermal, biomass, and other renewable electricity, I use the US Energy Information Administration’s projection of net geothermal electricity generation and net other renewable electricity generation from 2017 to 2040 (EIA 2016, Table H20 and H22), extended to 2050 based on the linear trend from 2031 to 2040. I adjusted the EIA’s projection downwards to match the projected net generation of geothermal, biomass, and other renewable electricity in 2016 with the consumption of geothermal, biomass, and other renewable electricity in 2016 reported by BP (2016).
World Energy 2017-2050
Figure 18 shows the historical and projected world primary energy consumption from 1950 to 2050.
World historical consumption of oil, natural gas, and coal from 1950 to 1964 is estimated from carbon dioxide emissions from fossil fuels burning (Boden, Marland, and Andres 2017).
World primary energy consumption and its composition from 1965 to 2016 is from BP (2017).
World consumption of oil, natural gas, and coal from 2017 to 2050 is assumed to be the same as production. Oil consumption includes biofuels production. Coal production in tons is converted to coal production in tons of oil equivalent using the formula: 2.04 tons of coal = 1 ton of oil equivalent (based on the observed world average ratio in 2016).
World consumption of wind, solar, nuclear, hydro, geothermal, biomass, and other renewable electricity from 2017 to 2050 is converted to their thermal equivalent based on the formula: 4.4194 terawatt-hours = 1 million tons of oil equivalent.
World primary energy consumption is projected to rise to 17,347 million tons of oil equivalent by 2050, effectively reaching a plateau by the late 2040s.
For 2017-2050, global economic growth rate is estimated by using the linear relationship between the primary energy consumption growth rate and the economic growth rate observed for the period 2005-2016:
Economic Growth Rate = (Primary Energy Consumption Growth Rate + 0.0157) / 0.959
Figure 19 shows the historical and projected world economic growth rates from 1991 to 2050. World average economic growth rate is projected to fall from 3.8 percent in 2001-2010 and 3.5 percent in 2011-2020, to 3.0 percent in 2021-2030, 2.2 percent in 2031-2040, and 1.7 percent in 2041-2050.
Since the end of the Second World War, global economic growth rate has fallen below 2 percent only in several occasions. During 1913-1950, when the global capitalist system suffered from major wars, revolutions, and the Great Depression, world economy actually grew at an average annual rate of 1.8 percent (Maddison 2010). Thus, by the mid-21st century, although the global economy will continue to grow, world economic growth rate may become too low for the global capitalist system to maintain basic economic and social stability.
Nevertheless, gross world product (in constant 2011 international dollars) is projected to rise to 257 trillion dollars by 2050. By comparison, in “World Energy 2016-2050” (the last Annual Report), gross world product was projected to rise to 207 trillion dollars by 2050.
Figure 18
Sources: World historical oil, natural gas, and coal consumption from 1950 to 1964 is estimated from carbon dioxide emissions (Boden, Marland, and Andres 2017); world primary energy consumption and its composition from 1965 to 2016 is from BP (2017); world primary energy consumption and its composition from 2017 to 2050 is based on this report’s projections.
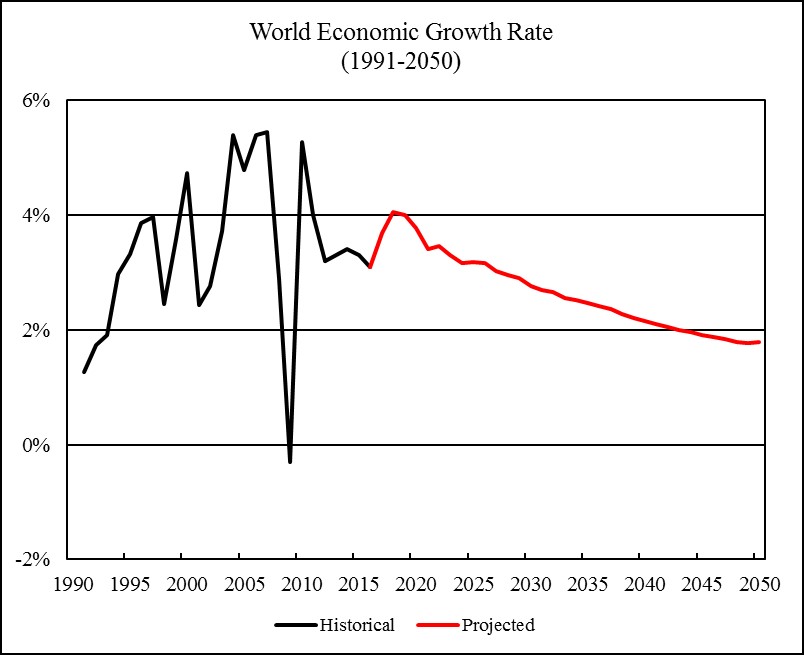
Figure 19
Sources: World economic growth rates from 1991 to 2015 are from World Bank (2017); world economic growth rates in 2016 and 2017 are from IMF (2017, Statistical Appendix, Table A1); world economic growth rates from 2018 to 2050 are based on this report’s projections.
Carbon Dioxide Emissions and Climate Change, 2017-2100
Figure 20 shows the world carbon dioxide emissions from fossil fuels burning from 1950 to 2100.
Historical carbon dioxide emissions from the burning of solid, liquid, and gaseous fuels from 1751 to 2014 are from Boden, Marland and Andres (2017). For 2015-2100, I estimate the carbon dioxide emissions from oil, natural gas, and coal consumption by assuming that each ton of oil consumption (excluding biofuels) emits 2.881 tons of carbon dioxide, each ton of oil equivalent of natural gas consumption emits 2.175 tons of carbon dioxide, and each ton of oil equivalent of coal consumption emits 3.882 tons of carbon dioxide. These conversion factors are based on the observed relationship between carbon dioxide emissions and fuel consumption in 2014.
World carbon dioxide emissions are projected to peak in 2030 at 37.1 billion tons. By comparison, in “World Energy 2016-2050” (the last Annual Report), world carbon dioxide emissions were projected to peak in 2029 at 36.0 billion tons.
Cumulative world carbon dioxide emissions from fossil fuels burning from 1751 to 2100 will be 3,584 billion tons. These are emissions from direct fossil fuels combustion only and do not include emissions from cement production and gas flaring.
According to Intergovernmental Panel on Climate Change’s Fifth Assessment Report, cumulative carbon dioxide emissions will largely determine the global mean surface warming by the late 21st century and beyond (IPCC 2013: 27-29).
Figure 21 shows the historical relationship between the cumulative carbon dioxide emission from fossil fuels burning (not including emissions from cement production and gas flaring) and the global surface temperature anomaly. Global surface temperature anomaly is measured as the difference between the global average surface temperature and the average global surface temperature in 1880-1920. The latter is used as a proxy for the pre-industrial global temperature (Hansen and Sato 2016). Global surface temperature anomalies are shown in ten-year trailing averages to smooth out short-term effects from El Nino and solar irradiance cycles. The linear relationship between historical cumulative carbon dioxide emissions and the ten-year average global surface temperature anomalies indicate that for an increase of cumulative carbon dioxide emissions by one trillion tons, global surface temperature will rise by 0.68 degrees Celsius.
Figure 22 shows the historical and projected global surface temperature anomaly from 1889 to 2100. Global surface temperature anomalies are shown in ten-year trailing averages to smooth out short-term fluctuations. The future temperature projections are based on the future carbon dioxide emissions projected by this report and the linear relationship between cumulative carbon dioxide emissions and the global surface temperature shown in Figure 21. Under the current trend, the global surface temperature is projected to rise to 2.43 degrees Celsius above the pre-industrial level by 2100.
According to Hansen et al. (2016), global warming by more than two degrees may lead to the melting of West Antarctica ice sheets, causing sea level to rise by 5-9 meters over the next 50-200 years. Bangladesh, European lowlands, the US eastern coast, North China plains, and many coastal cities will be submerged. This will lead to the end of civilization as we know it.
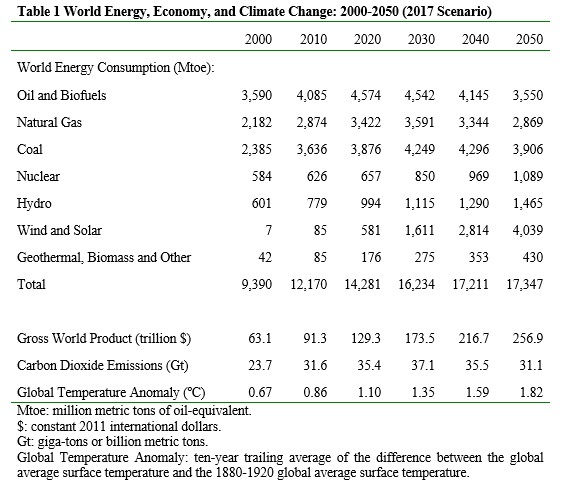
Table 1 summarizes the results of this Annual Report.
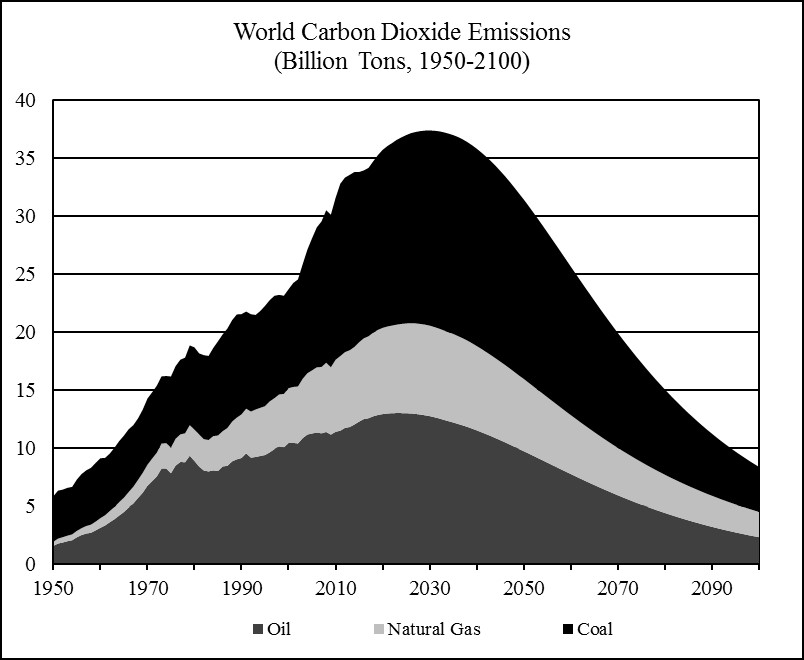
Figure 20
Sources: World carbon dioxide emissions from fossil fuels burning for 1950-2014 are from Boden, Marland, and Andres (2017); world carbon dioxide emissions from 2015 to 2100 are estimated using oil, natural gas, and coal consumption projected by this report.
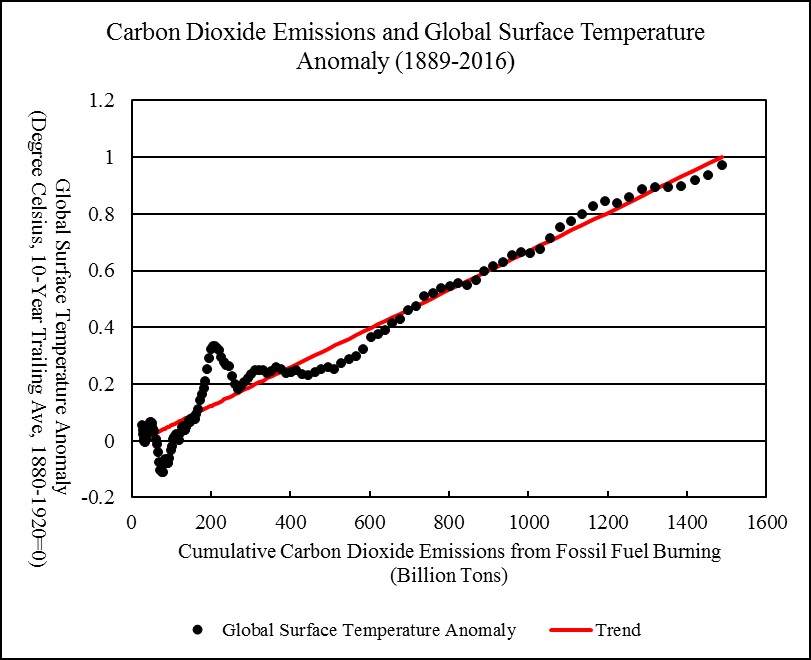
Figure 21
Sources: Historical carbon dioxide emissions from 1751 to 2014 are from Boden, Marland, and Andres (2017), extended to 2016 using fossil fuels consumption data from BP (2017). Global surface temperature anomaly from 1880 to 2016 is from NASA (2017).
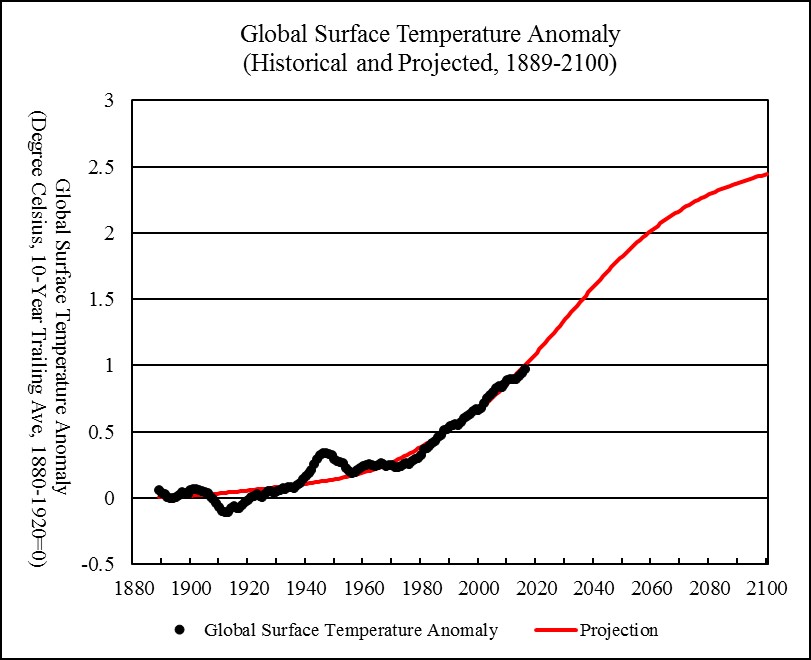
Figure 22
Sources: Global surface temperature anomaly from 1880 to 2016 is from NASA (2017). Future temperature projection is based on the projected future carbon dioxide emissions (see Figure 20) and the historical relationship between cumulative carbon dioxide emissions and global surface temperature (see Figure 21).
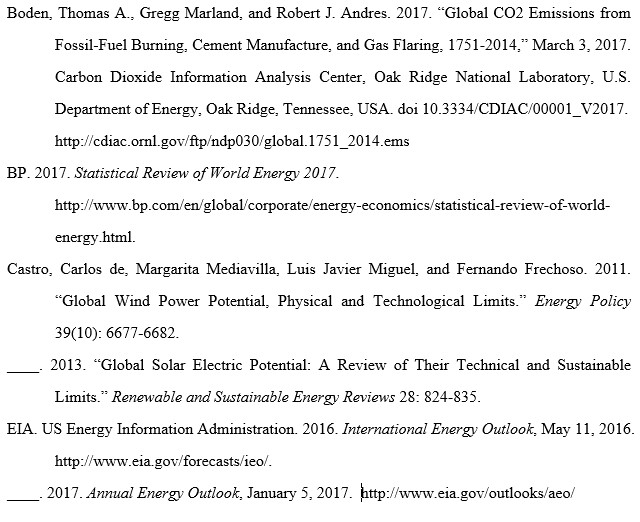
References
674 responses to “World Energy 2017-2050: Annual Report”
This is a brave effort. But…the coal, wind & solar, and “world product” projections are not useful.
Hubbert Linearization was useful for oil production in the US under price controls. It’s certainly not useful for coal forecasting. In particular, the idea that China’s coal consumption will grow until 2036 is not realistic. Nor are the growth assumptions for wind and solar useful: the idea that there are practical limits on solar electrical power generation is highly unrealistic. And, that means that the idea that “world product” will be limited by energy is unrealistic (even if the correlation of energy to production were valid….which it isn’t).
Hi Nick,
For China’s coal output probably a URR similar to the US is more realistic (around 100 Gt) and India may be less (80 Gt), so I agree that the coal estimate looks too high.
Energy has correlated pretty well with real GDP in the past (only World levels are appropriate to use), perhaps this will change in the future, but that is highly speculative.
Certainly energy efficiency can increase, but the gains are not unlimited.
Hi Dennis, a coal URR of 100 Gt for China would clearly be too low.
China’s cumulative coal production is already 79 Gt and its annual production now is about 3.5 Gt
Or do you mean RRR of 100 Gt?
Energy has correlated pretty well with real GDP in the past
Yes, as have many other things: other commodities such as metals, etc.
But, we’ve never made a sustained attempt to aggressively increase energy efficiency. To suggest that this would be impossible is also highly speculative.
Cars are a good example: US fuel efficiency has doubled in the last 40 years, to about 23MPG. It’s perfectly clear that it can be doubled again to 46MPG via hybridization, then doubled again to 92MPG by adding a plug, then doubled again by eliminating liquid fuels.
Similarly, housing can be made so efficient that it has no need for a net grid or FF energy input. Technically, it’s not zero energy, but it may as well be, given that it uses no net inputs besides solar panels on it’s roof. So, as a practical matter it’s infinitely efficient.
The Original Post makes no attempt to analyze the limits of efficiency under a policy of aggressive efficiency improvement – Business As Usual efficiency improvements are not appropriate evidence.
This article and the graph within show that the connection between GDP and energy use has been declining, both in developed and developing countries since 1990. So there is no reason to assume that economic growth (by current definitions) requires increased energy consumption.
Global energy intensity continues to decline – Today in Energy – U.S. Energy Information Administration (EIA): “Worldwide energy intensity, measured as energy consumption per unit of gross domestic product (GDP), decreased by nearly one-third between 1990 and 2015. Energy intensity has decreased in nearly all regions of the world, with reductions in energy intensity occurring both in the more developed economies of the Organization for Economic Cooperation and Development (OECD) and in the emerging nations of the non-OECD.”
Decline of energy intensity does not imply that there is no correlation between economic GROWTH and energy GROWTH
This is made clear by Figure 1
Even in OECD countries (benefiting for relocating energy intensive production to other parts of the world). Energy consumption has mostly stayed on a high plateau instead of declining.
In the rest of the world, higher economic output still requires higher energy consumption even though the two may not increase at the same rate
Decline of energy intensity does not imply that there is no correlation between economic GROWTH and energy GROWTH
Sure. But we’re not really concerned about correlation here: we’re concerned with causation, especially under conditions of scarcity that don’t exist today.
Of course, this isn’t really a very important point, given that there’s very little evidence that in the long run we’ll be faced with energy scarcity. But, the Original Post does argue that’s likely, and under those conditions…people would manage energy very differently. We know that people respond to price incentives – that’s well established.
Hi Nick,
Ok infinite efficiency and zero energy inputs.
Are you sure that is the argument you want to make?
Let’s just say I am not convinced.
Hyperbole results in people ignoring you.
Do solar panels rain down from heaven where you live? 🙂
hmm. Maybe I didn’t communicate that well.
So, you’re familiar with Passiv-Haus technology, aren’t you? Am I mistaken that the concept is that a house is so well insulated that it doesn’t need HVAC equipment like a furnace or AC; uses active air handling and heat exchangers to prevent heat loss to ventilation and outside air; and uses PV as it’s primary energy source?
My understanding is that a home built to Passive House standards would need not *net* inputs from the grid, or from an NG supply. Is that your understanding?
And, so, from the point of view of the larger society, this house would need no energy inputs at all. Energy efficiency is output divided by inputs: if the inputs are zero, then as a *practical* matter, it’s infinitely efficient.
Now, there’s no question that in this scenario there’s a need for energy, but energy efficiency is generally considered on the basis of *operating* energy inputs, not capital. As another example, I have a calculator that’s been powered by PV for decades. It needs no power from the grid – if there’s enough light for me to see the display, there’s enough light to power the calculator. My point of view is that the designers of this calculator have taken energy efficiency and improvements as far as possible, and as far as they need to go: if every device and building in our society was powered by ambient energy, we would have completely solved all of our energy problems. In other words, at the point where something is so efficient that it’s powered by ambient energy, further efficiency improvements are meaningless.
Does that make sense??
Hi Nick,
I am concerned with the total energy used by society. The solar panels need to be produced, can it be done using no net energy?
I hope your answer will be no. But you come up with some surprising logic.
Well, there are several parts to the answer:
First, no, clearly PV takes energy to produce. Not much: the energy required to produce enough PV to power a typical EV over it’s lifetime is no more than about $600 worth of energy (that assumes a conservative EROEI of 10:1, 250k kilometers over the vehicle’s lifetime, and .2 kWhs per km, and $.12/kWh in the US). A Passive House might be on the same order of magnitude. But, yes, it does take some.
Second, I thought this particular conversation was about the limits of energy efficiency.
Third, part of my comment was about how far efficiency can go. Look at the changes I discussed for both EVs and homes: 23MPG to 46, to 92, to 184….doesn’t that tell us something?? It seems to me that should change some people’s perceptions about the limits of what can be done.
4th, I was also discussing how far it makes sense to take energy efficiency. What’s the point of investing in further efficiency for my calculator, or for a Passive House that already needs no net inputs beyond panels? Isn’t that good enough? And, doesn’t that clarify how it makes little sense to think that our energy needs won’t be met in the future, when a home can be net energy neutral with the power that comes from it’s own roof?
Hi Nick,
yes it was about the fact that there are limits to energy efficiency.
You seemed to be implying that there are no such limits.
Energy efficiency can help, but there are physical limits to how efficient energy use can become.
Perhaps you disagree or would like to discuss something else.
And no it does not make sense to discuss Passivehaus design as needing no energy.
The solar panels are an energy source and without either battery or grid backup, it would require other sources of energy (or energy storage) due to intermittency.
Minqi is not arguing that energy supply will be insufficient, simply that he believes it will take more time to make the transition to non-fossil fuel than some believe.
We don’t really know how quickly it will occur.
” yes it was about the fact that there are limits to energy efficiency.
You seemed to be implying that there are no such limits.”
With a pragmatic POV the next 30 years there are indeed no limits for efficiency on a large scale. You can generate a lot GDP with saving energy.
Hi Ulenspiegel,
I agree there is the potential for large gains in efficiency by eliminating most thermal sources of power and most ICE use.
After that is accomplished over the next 30 to 40 years, further gains may be minimal.
The idea that these gains are unlimited and not subject to diminishing returns (in terms of % GWP [gross world product] spent to accomplish the increased efficiency relative to the % decrease in energy used to produce the marginal unit of GWP) is absurd in my view.
Beyond 30 or 40 years, do you still expect further efficiency gains will be unlimited?
I do not, I believe they will be marginal unless the transition to non-fossil fuel is far slower than I expect.
t there are physical limits to how efficient energy use can become
This could be beating a dead horse, but maybe it’s important.
People often get distracted by the fact there are limits to things like conversion efficiencies. But…that’s not really what we’re talking about here. We’re talking about efficiencies of energy *consumption*.
Transportation, for instance: when a vehicle moves from one place to another, physics calls that “translation”. Unless you’re going up a hill, it could be zero, except for real world losses, mostly friction. But…there is no minimum level of energy needed: it can get as close to zero as you like, if you keep working at it.
So, you can go from 12MPG to 1200MPG by reducing the various losses: drive train, suspension flexing; aerodynamics, etc. When you get to 1,200MPG (as engineers have demonstrated with prototype vehicles!) you’ve likely gone far beyond the point where anyone cares about further efficiency.
Heck, when you get to 120MPG (which is where we are now for production vehicles, with vehicles like the Tesla S or the Chevy Bolt), you may have gotten pretty much as far as is needed.
But…if there’s a shortage, or we realize that we need further efficiencies due to new evidence about pollution (perhaps GHG pollution)…then it will certainly be possible to find further efficiencies. Here are some examples:
you can reduce suspension flexing with dynamic suspensions, that adjust wheel height from the ground to sharply reduce tire and strut flexing. Or, you can use a suspension that converts kinetic energy into power, rather than simply converting it into heat, as suspension struts typically do today.
Aerodynamics can be greatly improved: the cross section that causes wind losses can be reduced; the skin interrruptions can be reduced, say by replacing side mirrors with cameras; the nose and tail can be redesigned to reduce turbulence; etc., etc., etc. The possibilities are simply endless, and today’s low hanging fruit is yesterdays obsolete basics.
Hi Nick,
So in your world friction can be eliminated?
Not in mine.
Hi Nick,
You should probably reread your physics text.
How does something go from a velocity of zero to a velocity V without expending any energy?
Even in your flat frictionless world, energy would be need to be “consumed” to get from point A to point B.
This is pretty basic stuff. See Newton’s Laws of Motion.
https://en.wikipedia.org/wiki/Newton%27s_laws_of_motion
No, friction can’t be eliminated. But, it can be reduced, and those reductions have no *theoretical* floor except zero. There is a large industry of mechanical and materials engineers working to reduce those losses, and they’re very good at their jobs…
2) when you accelerate something, you convert one form of energy (probably chemical) to kinetic energy. When you decelerate, you may convert that to heat via friction in the brake pads, or…you may recover it and convert it back to chemical energy (in a battery) with regenerative braking! And, of course, there is no theoretical limit to the efficiency of that recovery: each generation of regenerative braking is in fact significantly more efficient…
Hi Nick,
Well I believe the laws of thermodynamics preclude the ability to recover all of the energy with regenerative braking and such.
So assumptions that all of it can be recovered are a bit optimistic.
In addition the following statement by you seems contradictory:
No, friction can’t be eliminated. But, it can be reduced, and those reductions have no *theoretical* floor except zero.
Either friction can’t be eliminated (the “theoretical floor” is greater than zero) or it can be eliminated (there is no “theoretical floor”.)
Logic dictates that both parts of your statement cannot be true.
Hi Nick,
You said:
Transportation, for instance: when a vehicle moves from one place to another, physics calls that “translation”. Unless you’re going up a hill, it could be zero, except for real world losses, mostly friction. But…there is no minimum level of energy needed: it can get as close to zero as you like, if you keep working at it.
Objects at rest remain at rest. So although a moving object has inertia and will keep moving in a frictionless World forever unless a force is applied to slow it down.
How does the object start moving without any energy?
The laws of thermodynamics also apply here as perpetual motion breaks those rules, so you cannot just say we will recover the energy 100%. It cannot be done.
Have you ever actually taken a physics course? 🙂
Dennis,
Why are you being touchy? I know it’s frustrating when someone’s arguments don’t make sense to you, but jeez.
Okay. What I’m saying is that the laws of thermodynamics tell us that nothing is perfect when it comes to energy conversions, losses, etc. But…they don’t tell us how close we can get to perfect. In theory we can go from .1 gallons per mile to .01 gallons per mile to .001, etc.
Now, will we try to get to .001 gallons per mile? Very likely not. We know it’s possible – demonstration vehicles exist even now. But, there’s no need to make the investments and compromises necessary to get there. But…as long as energy is expensive, or in short supply, you can rely on those improvements in efficiency to continue in a robust fashion, for all of the various systems that use significant amounts of energy.
Does that make sense?
————————————–
As for the energy used for acceleration…I don’t understand why we’re disagreeing here. It seems obvious to me that the same logic applies that I discussed above. There is no limit to how much waste we can squeeze out of vehicle performance. And, if we manage to capture 95% of the energy of braking with a regenerative system, that makes an enormous difference: you’ve reduced the energy used to go through a round-trip cycle of acceleration and braking by 95%. That means that the remaining 5% is really pretty insignificant – by far the primary problem now is aerodynamics, which also have multiple opportunities for reduction. If we reduce aero losses enough to push braking losses back into the forefront…we’ll develop better systems there (e.g., super-capacitors).
Does that make sense?
Nick, you are being way too hopeful in your analysis, again.
Sure there are methods to build new places with great energy efficiency status, but we are not starting with a clean slate. The vast majority of people in the world will continue to live and work in older less efficient buildings for a very long time to come.
Last week I saw a home listed at 1.4Mill that still had a coal furnace, and single pane windows in very leaky frames. Sure, that is pretty rare here, but the turnover/renovation of older buildings is very slow, even more so in less economically vibrant areas.
Well, I think you’re talking about the pace of change, and I agree – it can be frustratingly slow.
But…I was talking more about theoretical limits: the Original Post seems to argue that Fossil Fuel is in basic some way essential to powering society. I disagree.
On the other hand: the pace of change is dependent on politics, and social consensus. It’s my understanding that all new construction in some places, like Germany and a few spots in California, are required to be net neutral. If we as a society understand the true costs of energy, we will push much harder to improve standards for new buildings and retrofit older ones.
I am with you Nick. We have all the tools needed to move away from fossil fuels and produce a low energy civilization. However, like the overworked husband, society never seems to get to those projects that should be done, only some of the ones that need to be done.
Hi Nick,
Let’s assume for a moment that all houses and buildings are demolished and rebuilt to Passivhaus standards.
Where will further efficiency improvements come from?
This is where the idea of a limit to efficiency improvements comes from.
Well, if all housing were rebuilt as you suggest, it would no longer require any net energy inputs from the grid, or from the NG system. It’s power would come from rooftop PV that as a practical matter lasts forever, and needs little maintenance.
So…as a practical matter, it would use no more energy. There would be no need for efficiency improvements in this sector of the economy. We could concentrate our attention on other sectors, like transportation, farming or industry.
And…the same logic applies elsewhere. Energy consumption by much of transportation can be reduced to the point where it’s powered by ambient energy: trains can be powered by panels on the roofs of containers; personal vehicles can be powered by panels on the roofs of the homes of their owners – that’s Tesla’s vision.
My sister is one of those crazy Californians: her Chevy Volt is powered by her home’s PV.
And our German readers can add their stories of factories powered by rooftop PV, like the Gigafactory.
Actually, I suppose the logical next step is net energy exports: energy efficiency of components inside those homes and industrial buildings would indeed continue to advance; and rooftop PV would expand beyond the needs of the buildings and it’s occupants, and those building would start to power the rest of society.
Trains could cover their own energy needs, then those of other trains, then start to export outside their network. They could start to cover much of their built area with panels (stations, sheds, even tracks and other parts of their Right of Way areas), and start to be a major force, competing with traditional utilities.
Hmmm. Inspiring thought.
Hi Nick,
Solar panels do not last forever. Nor do wind turbines, or batteries, or fuel cells, or cars.
The equipment needs to be replaced over time as it wears out and as the economy continues to grow.
Your expectation is for unlimited economic growth, I believe. (I have no such expectation.)
I noticed you did not explain where the unlimited gains in energy efficiency will come from?
Have you walked that back?
You seem to be changing the subject.
Solar panels do not last forever. Nor do wind turbines, or batteries, or fuel cells, or cars.
Well, solar panels actually do seem to last a remarkably long time. Panels that were installed 50 years ago are still going strong. They don’t stop working at the end of the 25 year warranty period: they keep on going, with losses per year of well below 1%.
But, that was an aside.
Let me try to summarize, because I think we’ve gotten lost in the weeds:
1st, I think that there’s no danger that wind and solar (and nuclear, hydro, biomass, tidal, etc) won’t be able to supply enough energy for humanity’s needs. This argument about efficiency is a secondary thing.
2nd, I do think that energy efficiency can continue to grow essentially forever, asymptotically approaching a limit, but continuing to grow. In the example of a Passiv-Haus, there are endless candidates for improvement: insulation of windows, roofs, foundations; air handling equipment; lighting, water handling, etc., etc. Here’s a concrete example: you might think that lighting has gone as far as it can go. But, even if LEDs emitted no waste heat (which is very far from the reality), the next step for offices which are primarily used in the daytime might be “day-lighting”, in which artificial lighting is mostly simply eliminated and replaced by light wells, light tubes, windows, etc. (Most people don’t realize that the standard lighting levels in offices are much, much lower than the ambient light levels outside). The possibilities are literally endless.
3rd, I do think there will be practical limits due to diminishing returns. Not diminishing growth rates of efficiency, but diminishing absolute value to that growth, as the absolute amounts get smaller.
I’ve been trying to say exactly that: In particular, I was trying to say that the point of diminishing returns might hit around the time when the needed power can be gathered from ambient energy: solar panels on roofs of houses, factories and trains.
But, of course efficiency will hit a point where it’s no longer worth the investment of time (and energy). Unless…there’s some kind of shortage of energy, energy prices rise, and more efficiency is needed. Efficiency will become moot at the point where reducing energy consumption is no longer an important issue for society and/or individuals.
Does that make sense?
Nick, all these things you are pointing out are theoretically good and possible, but I don’t think any of it changes the graph projections in this Presentation by Prof. Li in any appreciable way. My personal view.
Well, sure – this discussion of efficiency is about the demand side, and his charts are primarily about supply. This stuff would be more likely to be relevant if we, as a society, decided to aggressively reduce energy consumption.
That’s not happening nearly as much as we would all like.
We can see notable successes in California and Germany to incentivize efficiency by raising retail electricity rates, (even though it confuses some observers).
It would work better if it included industrial/commercial rates, but regulators were afraid of businesses leaving.
The US CAFE program has been enormously successful – oil consumption would be 10M bpd higher without it! Of course, we’d have hit $200 oil first…
Hi Nick G,
Your second to last comment is getting pretty close to reality with the exception that efficiency improvements will continue at a constant exponential rate essentially forever.
They will reach a point that they are no longer economically feasible or sensible and the growth will stop.
I agree that it might be possible to provide all energy needs without fossil fuel at some point in the future.
When that will be, we can only guess, but I think a guess of 2080 is more reasonable than 2050 or earlier.
A also agree that it is not highly likely that there will be a “shortage” of energy as long as prices are not artificially fixed at some low level by government intervention.
Nice straw man, but there is an interesting point you are missing: The energy industry is a big chunk of the economy today, but that proportion could fall dramatically in the next few decades.
So even though we will continue producing and using energy, the industry may be nearly zero.
Quick anecdote:
A co-worker moved into a newly built house last year.
Her electric bill dropped by 2/3… And the new house has twice the square footage of her previous home.
My bill this month was more than double her bill, but my house is almost half the size of hers.
We live in FL; a state not known for having progressive regulations on the energy efficiency of new construction.
Hi Brian,
I agree there is potential for significant gains in energy efficiency.
The argument that there is no limit to efficiency gains I do not buy.
This seems to be the story Nick G is trying to sell.
He points to prototype vehicles which get efficiency 500x the average US vehicle.
Maybe some engineers could point to to the likelihood that such a prototype efficiency would match the fleet average in 50 years.
Well, please re-read my comments. What I’m saying is that there is no *theoretical* limit to efficiency gains.
There is certainly a practical limit, but I think it’s farther out than your intuition is telling you.
I remember a high level auto executive (with solid engineering training and extensive design and manufacturing experience) telling me back in about 1980 that 40MPG was flatly impossible – it would never happen…
China’s future coal production is not estimated from Hubbert Linearization (because of the large fluctuations in recent years, it’s now premature to apply HL to China’s coal production), it is estimated by using China’s coal reserves reported by BP. BP finally updated its reported coal reserves this year and made some large upward adjustments.
China’s coal production declined quite substantially from 2014 to 2016. But now there is a high probability China’s coal production will resume growth this year. For the first five months, China’s coal production increased by 4% compared to the same period last year and in May, it increased by 12% compared to the same month last year.
About wind/solar, I do think they are also subject to ultimate ecological limits unless you think they do not have ecological impacts.
However, in the current projection, I am not assuming any ultimate limit to their long run growth. All I have assumed is that their annual installation will eventually reach a plateau.
This has already happened in Europe. I think it will happen to the world too.
Hi Minqi,
Europe may have plateaued during a period of low fossil fuel prices. Peak fossil fuel may change the dynamic.
US and China have a similar level of reported reserves and similar cumulative output.
I believe China has plans to scale back coal output, 100 Gt may be too low, but I believe your estimate is too high.
Eventually world installations will reach a plateau, but your basis for predicting that plateau is quite low.
For China I think the URR may be similar to your US estimate. I believe India will be under 100 Gt. This assumes wind and solar become cheaper than fossil fuels as costs for renewables will fall as the cost of fossil fuel rises with depletion. I assume demand for energy will continue to grow as population and real GDP continue to rise, though at a somewhat lower rate due to falling energy intensity of GDP.
Hi Dennis,
Most of my report is simply to indicate what the existing data/trend indicate. In the Chinese case, HL cannot be applied to coal yet. So for the moment, the best available data about China’s remaining recoverable coal resources are simply the reported reserves. It’s actually not “my” estimate but BP estimate.
On the other hand, it’s possible that my estimate of US/ROW coal URR prove to be too low. For the ROW, HL analysis under-predicts the current production levels. For the US, the EIA projection was prepared last year with the clean power plan included. Next year they may produce a more “optimistic” scenario for coal.
I am glad that we agree on a eventual future plateau of renewable installation. While I admit all the weaknesses my projections have, please note that they still stay above all the mainstream projections (IEA, EIA, BP) through 2050.
I am glad that we agree on a eventual future plateau of renewable installation.
If I understand your arguments, you and Dennis do not agree. Your projections seem to assume that renewables will plateau at a level that is insufficient to supply demand. Dennis’ projection does not: it assumes that it grows as needed to supply demand.
Hi Nick,
We agree that exponential growth will not continue forever.
We disagree on the level at which the crossover from exponential to linear will occur. In my scenario annual installation for wind and solar increases to 1250 GW per year (in 2046) and then levels off and gradually declining after 2054(as demand is met by 2054 by non-fossil fuel).
That scenario assumes demand for electric power continues to grow at 3% per year, possibly improved efficiency will reduce this rate of growth, but such efficiency increase will be offset by increased demand from transportation and space and water heating, eventually the rate of growth of electricity demand will fall as population growth is reduced (by 2070-2100, maybe 2085 for best guess of population peak).
If electricity demand growth falls below 3% per year before 2046 then less capacity will be needed.
Hi Dennis,
In your scenario, what explains the “slow down” from about 2027 to 2040?
Hi Minqi,
I assume eventually the capacity factor for wind and solar will reach 33%. I assumed a capacity factor of 20% (same as 2016) for the early part of the scenario and had it ramp up from 20% to 33% over the 2027 to 2040 period.
Not all that realistic probably, a better model would have a more gradual change that topped out at a 27% capacity factor (33% seems too high and 23% too low so I picked a number in between).
This would result in a smoother curve.
The 27% assumption would increase the capacity installed from 18,800 GW to 23,200 GW in 2050.
We agree that exponential growth will not continue forever.
I guess my question is about the underlying fundamentals. The Original Post seems to assume that non Fossil sources (wind/solar/nuclear, etc) will meet some sort of resource limit, which will cause problems for economic growth. As best I can tell, you do not make that assumption.
Hi Nick,
I did not get that implication, can you point to the part of the post where Minqi says that, I may have missed it.
There are several places. First, in the Original Post: … wind and solar electricity is intermittent. Incorporation of wind and solar electricity into electric grids requires maintaining a large backup generating capacity and poses challenges to grid reliability. Curtailing of excess wind and solar electricity when surges of wind and solar generation exceed demand may impose limits on how much wind and solar electricity can be absorbed by a given system of electric grids. In the long run, wind electricity and solar electricity are also limited by the availability of land and mineral resources (Castro et al. 2011 and 2013).
He’s said the same thing in comments about “ecological limits”, and also referred to Evan Mearns several times as a source for the idea that a 100% renewable grid is not possible.
And for the economics he said: Thus, by the mid-21st century, although the global economy will continue to grow, world economic growth rate may become too low for the global capitalist system to maintain basic economic and social stability.
He’s not talking about a temporary, transitional problem. He’s saying that energy supplies can’t grow fast enough to supply enough energy to allow the world economy to grow. That only makes sense if you think that there is some kind of natural limit to energy supplies in the reasonably near future (because of course, if you extrapolate far enough anything hits a limit, even 100,000TW of solar power).
I suppose it’s conceivable that he’s sufficiently economically illiterate that he believes that rising energy prices would not cause energy supplies to ramp up in response. I think that’s what you’re thinking that he’s thinking, and it’s true that’s a common (if puzzling) idea.
But, I think it’s clear that the Original Poster is instead thinking about physical limits due to intermittency, as we see in his later comment about Mearns analysis.
Hi Nick,
He says wind and solar may be limited, there are other non-fossil fuel sources.
On the economy there are several reasons Minqi might think the growth rate of the economy may slow.
A very simple reason is that the real GDP per capita has been relatively steady from 1960 to 2016 (about 1.4% per year). The population growth rate is likely to slow based on most population models.
So we would expect the rate of GDP growth would fall over time.
Another reason that the economic growth rate is likely to slow is that more of the World will become developed and generally more developed economies grow more slowly.
You seem to believe that exponential growth can continue without limit.
I do not agree that is possible and I am fairly sure Minqi does not think infinite growth is possible.
Ecological limits are a given. Though no doubt you would disagree.
Wind/solar…not assuming any ultimate limit to their long run growth. All I have assumed is that their annual installation will eventually reach a plateau.
The article implies that world production will be limited by energy supplies. If we expect demand for additional energy, and also project that solar & wind do not grow to meet that demand, then we must assume some kind of hard resource limit to wind/solar. The total solar resource is on the scale of 100,000 terawatts, while human energy production is roughly around 15 terawatts, a ratio of roughly 7,000 to one. To conclude that this presents a practical limit, one must assume that only a tiny, tiny fraction of the solar resource is usable – this is highly unrealistic.
It takes time/effort to “grow” anything, especially if you believe solar resources are virtually unlimited
I’m not sure what you’re arguing.
Yes, wind and solar installations require labor and costs to install. Of course, those costs are below the cost of coal in many areas even now, and are continuing to decline quickly. So, I’m not clear what the problem might be.
First, in many parts of the world, solar is still more expensive than coal/gas; in the US, wind is still more expensive than gas
Second, cost is not the only factor that limits wind/solar; there is the problem of intermittency/curtailment
Thirdly, it simply takes time+engineers+workers to install anything. The US now normally installs just 20-30 GW of any type of capacity each year. Unless you turn the US into a Soviet-style planned economy, things won’t be much different in the future.
Hi Minqi Li,
I imagine if prices change that things could be very different in the future.
In areas with good wind resources (Texas, Iowa and other plains states) wind is cheaper for power generation than natural gas (new build). In areas with good solar resources (US south west) solar is cheaper than natural gas.
In addition the price of natural gas will rise while the pride of wind and solar will fall so natural gas and coal will lose to wind and solar over a wider area.
The intermittency is not a problem.
http://www.sciencedirect.com/science/article/pii/S0378775312014759
Abstract
We model many combinations of renewable electricity sources (inland wind, offshore wind, and photovoltaics) with electrochemical storage (batteries and fuel cells), incorporated into a large grid system (72 GW). The purpose is twofold: 1) although a single renewable generator at one site produces intermittent power, we seek combinations of diverse renewables at diverse sites, with storage, that are not intermittent and satisfy need a given fraction of hours. And 2) we seek minimal cost, calculating true cost of electricity without subsidies and with inclusion of external costs. Our model evaluated over 28 billion combinations of renewables and storage, each tested over 35,040 h (four years) of load and weather data. We find that the least cost solutions yield seemingly-excessive generation capacity—at times, almost three times the electricity needed to meet electrical load. This is because diverse renewable generation and the excess capacity together meet electric load with less storage, lowering total system cost. At 2030 technology costs and with excess electricity displacing natural gas, we find that the electric system can be powered 90%–99.9% of hours entirely on renewable electricity, at costs comparable to today’s—but only if we optimize the mix of generation and storage technologies.
Highlights
► We modeled wind, solar, and storage to meet demand for 1/5 of the USA electric grid. ► 28 billion combinations of wind, solar and storage were run, seeking least-cost. ► Least-cost combinations have excess generation (3× load), thus require less storage. ► 99.9% of hours of load can be met by renewables with only 9–72 h of storage. ► At 2030 technology costs, 90% of load hours are met at electric costs below today’s.
Graphical abstract below
Thirdly, it simply takes time+engineers+workers to install anything. The US now normally installs just 20-30 GW of any type of capacity each year. Unless you turn the US into a Soviet-style planned economy, things won’t be much different in the future.
Electricity consumption in the US has essentially stopped growing. So, the US is actually doing pretty well to be installing that much – it’s more than is needed to handle demand, and appears to be driven more by a desire to reduce costs and clean up the grid.
On the other hand, US installation rates have been much higher in the past.
If, as a society, we decide to be more aggressive about installing clean power, we can certainly substantially increase installation rates. That’s what utilities do: they respond to what they’re asked to do by their customers, and by the commissions that regulate them. That’s not Soviet style central planning, that’s just Business as Usual for the US.
Don’t give some of these guys ideas about copying a soviet style economy. They actually believe in Marxism.
If long distance extra high voltage ( meaning HVDC lines ) transmission costs continue to come down as the technology advances, and the industry that manufactures the specialized equipment needed scales up, there is no reason to believe there is any PRACTICAL limit on the amount of solar electricity that we can produce, at least not for the next few decades, other than the costs of building solar farms and transmission lines. There are tens of thousands of square miles of more or less undeveloped land that gets full sun as much as ninety percent or more days per year.
Only a very minor fraction of all this land would need to be under solar farms to generate as much solar electricity as we can use.I don’t personally believe land is a limiting factor, so long as the grid is managed sensibly, and so long as long distance transmission is implemented efficiently.
The actual installations of lines on towers is a mature technology, and the price of running lines from a to b probably won’t fall much if at all, and might go up as the supply of raw materials needed, such as steel and aluminum, become more expensive. But it’s my understanding that the real money is spent at each end of a hvdc line, on the super expensive equipment needed to tie it into the existing ac grid at each end. I could be wrong about that, and hope somebody here knows enough to set me straight if I am wrong.
I guess we could run cables to Russia, and from there swing them down via China to Vietnam and Cambodia and Thailand and Malaysia and Indonesia and cross the ocean to Australia?
Hi Fernando,
I think we can realistically expect to run power lines from the American Southwest and Midwest to our major Yankee population centers, once the cost of HVDC equipment comes down as the industry scales up.
And if the political problems can be solved, it’s very likely it will be possible and practical to run lines from your part of the super sunny Med area to European population centers.
For sure such long lines are going to cost a hell of a lot, but once they’re built…….. they last just about forever with good maintenance.
And I for one am not much worried about when we can transition entirely away from using fossil fuels. If we can get eighty or ninety percent of the way there, things ought to work out ok in my opinion, for quite a long time, a century or more at least.
If a country such as Spain or the UK can cut down on the use of imported energy by just half, this would save such a country an enormous amount of hard to come by foreign exchange earnings.
Hi OFM,
Climate change may be a problem if we don’t get close to zero fossil fuel use by 2075 or so (say to 1% of today’s level of fossil fuel carbon emissions by that time).
The quest for rapid reduction in fossil fuel use is less about energy scarcity and more about tackling climate change. If we burn all the easily available fossil fuel there is a higher risk of damaging climate change.
Winter days are quite short in sunny southern Spain. And some days we get dust from the Sahara. Although I read that global warming may bring more rain to the desert, so the dust storms may not be as much of a problem.
Hmmm. You seem to be discussing production, but if China is planning to reduce coal consumption (so that they never hit production limits at all), then wouldn’t consumption be the more important factor?
China’s coal consumption data for 2017 of course are not yet available.
If coal imports have grown even more rapidly than coal production over the first half of this year. So it should not be difficult to guess what has happened to coal consumption.
Well, do we have good numbers for China’s annual or monthly coal consumption for the last few years?
This link has BP data for China coal. Consumption and imports.
http://mazamascience.com/OilExport/
Their chart seems to show China’s coal consumption dropping for the last 3-4 years.
Minqi Li said:
Ecological limits are fine, but what about economic limits?
Germany, for instance, has set what is perhaps the most ambitious agenda for wind and solar in the world. Nevertheless, wind and solar penetration, as a total of Germany’s total power production, is plateauing at about 18%.
But here’s the question: Will households and small businesses in other nations of the world be willing to pay the economic cost they paid in Germany to achieve Germany’s high level of wind and solar penetration?
Here’s a recent article by an economist from the University of Houston that recaps the enormous economic cost that households and small businesses, and now Germany’s electric companies, have paid, and continue to pay, to finance Germany’s super ambitious goals for renewables.
https://www.forbes.com/sites/uhenergy/2017/03/31/100-renewables-by-2050-germany-pays-the-price-for-its-ambition/#635209ba1e98
“Nevertheless, wind and solar penetration, as a total of Germany’s total power production, is plateauing at about 18%.”
Nonsense, please get correct data for more than two years.
Because 2016 had much lower average wind speed in comparison to 2015, you have a 2 year “plateau”. In 2017 we will see a drastic increase (one has only check data for the first 6 months) and for the next two years we will see additional 8 GW wind power, i.e. each year 2% more of the net electrcity demand is provided by wind, this with decreasing costs of offshore wind.
The realistic differential costs between BAU and energiewende are less than 17 billion EUR per year (EE sucharge – saved primary energy) , 0.5% of GDP, hardly a gamebreaker and mainly a legacy of early years with expensive PV.
To claim that these numbers are relevant for other countries is stupid propaganda.
P.S. If you want to argue with primary energy demand then keep in mind that the data are not temperature corrected.
Well my lying eyes.
It sure looks to me like that curve of Germany’s installed wind and solar capacity has flattened out.
Yes, do not present a graph you do not understand. 🙂
2017 is only 6 months old and we have a continuation of the trend of the last few years, you only have to check the data on Fraunhofer ISE energy charts.
While net addition of capacity (GW) is reduced, the capacity factor of the installed turbines have increased, the output too. Minor mistake, you also forget the effect of replacement of old turbines. Net addition is zero, but 100% gain of CF.
Then you claim a plateau when there is a net addition and an increasing generation? That is a contradiction even within your limited understanding of German renewable landscape.
Ulenspiegel says:
Nah. That dog don’t hunt either.
The growth in power production from renewables not only stalled out in Germany in 2016, but in all of Europe & Eurasia as well.
Again, y-o-y data depend on weather, that is my point. 2016 had a very low average wind speed, 2015 was above average, therefore, bad weather compensated for record addition of wind turbines.
You either argue with wind speed corrected data or you use a longer period of time . In both cases we see of course a clear increase. Again, you only have to compare the first 6 month of 2017 with 2016 to see the weakness of your argument: We have a >10% increase of generation.
And your basic issue is of course that with 4-5 GW gross addition for onshore wind we will end at 120-150 GW onshore wind capacity as steady state (saturation), that is what we need in Germany for a 100% RE scenario.
Glen- the USA has huge wind and solar resource potential compared to Germany, and our investment $/joule of output will be much less.
Yes, it’s not comparable. We have the north sea for wind, but for solar it’s a hmm. Not that good solar hours, and space is scarce so much rooftop.
When I remember the desert around Las Vegas or the windy planes – that’s a whole different thing.
Especially nobody would really care if you cover 100 square miles of desert with collectors.
Hickory,
That might be true for Texas.
But if one tries to push that “logic” in places where it’s not applicable, this is what one gets:
.
Glen, you have a nice way of spinning things (learned at Fox?). What I had pointed out was that the USA has much better solar and wind resource than Germany, and so our nations cost of renewable energy production has the potential to be much cheaper than theirs. Texas, Wyoming, Nevada, Kansas, Calif, etc. Good sun and good wind. Nice compliment to the oil and NG.
Here is some comparative data on Solar horizontal annual irradiance (kWh/m2/day)
Hamburg 2.52
Munich 2.98
Seattle 3.2
Pittsburgh 3.8
Atlanta 4.6
Denver 4.8
San Antonio 5.0
Mojave Des 5.8
Phoenix 5.9
Also, by being an early adopter, Germany paid a high cost for its PV over the past 10 yrs. In doing so they helped to create demand for mass production- thank you.
California does pay a lot for electricity at the retail level. This is not a good indicator of the wholesale cost of new photovoltaic energy production whatsoever. To spin it so would be a transparent political propaganda maneuver.
Retail prices have little to do with the cost of generation, especially in places like California and Germany.
You really ought to do deeper research, rather than just accepting anything you find on the internet.
Anyway the desire to keep energy cheap is the slave’s ideology. It is based on the belief you will never be a net producer. Producers don’t want commodity prices to be cheap.
Hi Glenn Steele,
Germany has only a so so wind resource, compared to other physically larger countries more favorably situated in respect to where the wind blows steadily and at a brisk pace. Germany’s solar resource is pathetic, by comparison to say the USA., or most other larger industrialized countries.
If the German people were to be transplanted into the American southwest, they would probably be using at least three or four times as much solar electricity as they do now, considering their climate.
They would be using a LOT more wind power too, if they had more spots suitable physically and politically for wind farms.
The balance will continue to swing toward Germany using more renewable electricity, especially wind and solar electricity, as time passes, for some VERY good reasons.
One coal and gas deplete,and Germany is in the position of having to eventually import coal in large quantities, or do without, unless they give up using coal. They are already dependent on imported gas.
And every ton of coal, and cubic meter of gas imported means Germany has to export even more stuff to pay for imported energy. If they can remain among the front runners in the wind and solar industries, they will have something more to export that will become more valuable, as time passes, rather than less. Cars depreciate to nothing.
Wind and solar farms, once built, are going to last just about forever, because the equipment used on them can be repaired and replaced and upgraded piecemeal, as needed, or as circumstances dictate. Wind and sun will always be free, except maybe for taxes, lol.
Germans, as well as everybody else, will learn to use more wind and solar sourced electricity more efficiently, as time passes, and they will also figure out ways to store it economically, to some extent, for sure.
Some time back I was reading stuff posted by anti renewable folks to the effect that grids would NEVER be able to accomodate more than ten percent wind and solar power, then twenty percent.
Now there are examples to be found of grids running on as much as forty or fifty percent wind and solar power, once in a while, when ENOUGH is available.
And all the arguments about wind and solar power being limited because sometimes wind and solar farms will produce more electricity than can be used at any given minute are complete and total bullshit.
It’s true that not being able to use all the power that CAN BE PRODUCED means the average cost of wind and solar power will be higher, but ya know what?
We can’t use all the power that can be produced all the time by coal and gas fired plants plus nuclear plants. Curtailing output is a normal part of just about any and just about every industrial process, because supply has a way of outrunning demand sometimes.
I park my machinery weeks at a time, lol. Most trucks are parked more than half the time, school buildings are empty fourteen hours out of twenty four, or more, during the week, and mostly deserted on weekends, athletic fields excepted.
Hotels are seldom full, year in and year out.
A lot of retail stores depend on the Thanksgiving to Christmas shopping spree to survive the rest of the year.
Hi Minqi,
A major shortcoming of the analysis (which you allude to), is in figure 16.
If we do a regression on the relationship between the annual installation of wind and solar vs the growth to installation ratio we find that the t-value for the slope is about 1.1, typically we are looking for a t-value of at least 2 for a statistically significant relationship.
If we consider the 68% confidence interval (one standard deviation interval if the distribution is normal) the x- intercept varies from 120 GW per year to 4500 GW/year, so the range is very wide, at the 95% confidence interval the upper bound has a positive slope so there would be no upper bound (which is not realistic).
I would suggest the 280 GW/year would be the minimum we might expect for the maximum installation rate for wind and solar.
Hi Dennis, thanks a lot for posting this. All the graphs look great. I agree that Figure 16 is a major shortcoming. But as we discussed through emails, given this early phase of wind/solar, any projection of their future is likely to be speculative. My hope is that in the future, as we accumulate more data, we can understand the wind/solar potential better and their statistical range of confidence can be substantially narrowed.
In my projections, wind/solar is projected to rise to 2206 Mtoe (9749 TWH) by 2035, 2814 Mtoe (12434 TWH) by 2040, and 4039 Mtoe (17850 TWH) by 2050.
By comparison, BP Energy Outlook 2017 projects that TOTAL non-hydro renewables will be 1586 Mtoe by 2035. EIA’ International Energy Outlook 2016 projects that world total wind generation will be 2542 TWH by 2040 and world total solar generation will be 962 THW by 2040 (their 2017 IEO won’t be available until September).
I think you probably will agree that my projection will have a smaller deviation from the actual numbers in 2035/2040 than the BP and EIA projections.
It is unrealistic to put any weight on projections for renewable energy from an oil company.
It is misleading to project a decline in wind/solar installations, based on a correlation with an r squared of .07. Such a projection simply should not be included, given such weak evidence.
Hi Minqi,
Yes your projections are better, but still too conservative in my view.
A better method for projection is to look at wind and solar consumed which has increased for many years at 25% per year (1996-2016).
I believe this rate will slow to 10%/year over the next 10 years (20%, 19%,…,11%. 10%) and then remain at 10% growth for many years (until demand is satisfied). Oil supply grew at 7% per year from 1945 to 1973 and was limited by demand and low prices.
I believe this is a better model of what is likely to happen as fossil fuel prices rise and cause demand for wind and solar to increase. About 93% of power demand is met by non-fossil fuel by 2050 in this scenario. Much of transportation and space and water heating will be met by electricity used in EVs and trains for transport and heat pumps for space and water heating. Overall fossil fuel demand may be much lower than your projection, especially if climate change is taken seriously. There is much uncertainty in climate science so higher temperature scenarios cannot be ruled out. Better to play it safe in my view.
Hi Dennis, thanks for agreeing that my projection is the “better” one among the “conservatives”
Thank you for posting various graphs below.
Of course, we disagree about the oil/wind/solar comparison. While oil was very cheap and has many desirable features, wind/solar is intermittent, only good for electricity, and solar is still relatively expensive
As we discussed, unfortunately, up to perhaps 2025, both your projection and my projection could stay on track. So let’s wait a while and see how the data evolve.
Oil was not cheap for the first 80 years of the oil industry. It was cheap briefly just before and after WWII, but it isn’t cheap now. It especially is not cheap, when you include all costs: pollution, security, etc.
Wind and solar have some variability. But, solar is very reliable, even if it varies greatly from day to night. And, if you ask the US or German military, they will tell you that they don’t feel that imported oil is at all reliable, and that this unreliability is very, very expensive.
Electricity is, on the whole, better than liquid fuel: EVs are cleaner, quieter, cheaper and more powerful.
Solar is cheaper than coal in many places, and quickly getting much cheaper.
These projections and assumptions you have presented seem to be essentially those of the Fossil Fuel industry: a full transition away from FF is simply unthinkable.
I can assure solar is still more expensive than coal in China, which is the main solar market now
Hi Minqi,
Is that still true when external costs are included in the price of coal fired electricity?
I bet a lot of people in China would trade higher prices for cleaner air.
What are the costs of wind, solar and coal in China? Do they vary by region?
Hi Minqi,
If we look at oil and consider changing oil output as a proxy for change in production capacity we can do something similar for oil as you did for wind and solar in Figure 16.
From 1945-1973 (28 years) we have an upward sloping trendline. R squared is small at 0.15.
Longer period using 3 year averages 1934-1972 (38 years).
Still a positive slope and low r squared.
And a very long period 1903-2010 with 5 year averages.
After 1971 the data moves towards the origin (1979-1983 in third quadrant), but a negative slope on the trend line is never evident. The proposed relationship for wind and solar has never been evident for oil. I propose there may be no such relationship, and the statistics support that proposition.
And lastly,
Using wind and solar output as a proxy for capacity (to extend the data set) we get a near zero slope for the line and nearly zero R squared. If the line is extended to the x-axis it crosses at about 3500 GW. My scenario has the maximum annual increase in wind and solar output at 520 GW average output increase from 2049 to 2050. This is an 8.2% increase with total average wind and solar output at 6300 GW and capacity at 18900 GW. This assumes capacity factors are able to reach 33%, lower capacity factors (say 25%) would require more installed capacity. Current World wind and solar capacity factors are about 20%, I expect this will improve, but 33% would be a stretch (27% is probably a more reasonable target by 2050 for the overall world average wind and solar capacity factor.)
Hi Dennis, at this stage output data is probably too much influenced by short-term change in capacity utilization (including grid connection) issues to generate meaningful trend.
Also, if we go back to 1990s, there were still many negative growth years as wind/solar was too pre-mature at the time
A few more words about Figure 16. BP provides capacity data starting from 1997. This allows me to have annual installation data from 1998 to 2016. So I can calculate change in annual installation from 1999 to 2016. So the data points in Figure 16 are actually from 1999 to 2016.
Hi Minqi,
If you run a regression on those 16 data points you will find the t-stat is about 1.1 for the slope of the line, the 95% confidence interval is very wide with the x intercept from -450 (line has a positive slope) to 60.
The proposed relationship does not pass the null hypothesis, so the chart (figure 16) is pretty, but tells us little.
The history of oil shows us that output can grow exponentially for a very long time (6.5%/year average growth in oil output from 1900 to 1972).
It is not clear why you would think this might not occur for wind and solar consumption especially after fossil fuels peak.
Also note that the growth in oil output was partially limited by demand, it is unlikely that lack of demand will be a constraint on demand for wind and solar power after fossil fuel peaks (2030 or so) and before 2050.
Most conservative projections (EIA, IEA, BP, XOM, etc) assume either there will be no peak in fossil fuels or that it will occur after 2050.
I believe the projection for fossil fuels influences the projected demand for wind and solar power.
They will be very competitive after the peak, probably by 2025.
Hi Dennis,
I agree, statistically Figure 16 is weak. I also acknowledge that in the report itself. But I think the projected results are reasonable based on my understanding of intermittency, land, mineral constraints et al. I know we disagree on that.
From the demand side, please note that under my projection, world economic growth rate declines gradually from about 3.5% now to just under 2% by the 2040s. This decline could very well happen for reasons other than energy constraints (decline of population growth; slow down of technological progress; for the latter see Robert Gordon).
I have also incorporated a large energy efficiency improvement from 8401 dollars per toe in 2016 to 14812 dollars per toe in 2050 (an average annual growth rate of 1.7%)
So even from the demand side, if you start from declining economic growth, incorporating energy efficiency growth, and then subtracting fossil fuels, the remaining “demand” for renewables might not look very different from what I projected here
Hi Minqi,
That assumes that the relative prices are unchanged.
The point is that due to depletion fossil fuel prices increase while technological progress leads to decreasing prices for wind and solar power.
So the supply of fossil fuels might be available at high prices, but demand will fall and fossil fuel output will be constrained by lack of demand.
This will eventually lead to a fall in fossil fuel prices, but I expect it will not be enough to catch up with falling wind, solar, EV and AV prices.
By 2035 fossil fuels may be in a death spiral where falling demand and prices will lead to falling supply.
As wind and solar ramp up World wide economies of scale, and technological progress are likely to drive wind and solar prices low enough that demand for fossil fuels will fall to zero by 2050.
I do agree it is possible that better efficiency will reduce demand, but at the same time there will be greater use of electricity for transportation and space and water heating and I assume these will offset each other and electricity demand may keep growing at 3%/year (mostly this is a simplifying assumption.)
Thank you for the work!
Some questions/remarks from my side:
1) Does primary energy for PV and wind means 1 unit primary energy = 1 unit final energy?
2) The construction rate of nuclaer power reactors is very likely not even sufficient to replace losses due to age until 2030, where does the increase of nuclaer power come from?
3) Oil is mainly used for transport with vehicles powered by ICEs, when we have to assume that at least most new cars are EVs in 2030 and very likely many trucks in developed countries are replaced by electric versions, why do you assume a quite modest reduction of oil demand between 2030 and 2040?
4) PV and wind growth: On one hand you assume an tripling of PV and wind between 2020 and 2030, on the other you work with a choked increase after 2030, that is too pessimistic, additions after 2030 are still mainly net additions, we are far from a saturation where additions would replace 20 – 30 year old PV or wind. The picture is too pessimistic IMHO.
1), 3) and 4) may have the effect (as you work with primary energy) that the demand for fossil fuels actually decreases much faster.
Hi Ulenspiegel,
The primary energy for wind and solar uses the same methodology as the BP Statistical Review of World Energy.
If we have 100 GW of wind or solar output we treat this the same as 100/0.38=263 GW of primary energy so that it can be compared to the coal or natural gas that it might replace.
One way to think about it is that 1000 GW of wind and solar output (average output for the year) could replace 2630 GW of average coal and natural gas input into power plants because there are almost no thermal losses in the wind and solar power sector. Note that 1000 GW (1 TW) over a period of one year is 31.536 EJ(Exajoule=1E18 Joules).
Hi Ulenspiegel
As Dennis explained, BP conversion of primary electricity (nuclear, hydro, wind, solar et al) assumes “thermal equivalent” (that is, how much thermal energy it takes to generate the equivalent amount of electricity assuming 38% efficiency). So 1 Mtoe = 4.4194 TWH (billion KWH)
About wind/solar
The renewable section of IEA’s World Energy Outlook 2016 can be downloaded here:
http://www.iea.org/media/publications/weo/WEO2016SpecialFocusonRenewableEnergy.pdf
Their Figure 10.18 (page 431) projects that under their 450 scenario (the most pro-renewable), both wind and solar net installation is projected to peak at about 90 GW in the 2030s. In my scenario, wind/solar net installation is projected to rise to 270 GW by 2030 and plateau around 280 GW by 2040s.
For nuclear, I take it directly from EIA IEO 2016
For oil, the current projection is not demand-determined but supply-determined by using EIA projection for the US but Hubbert Linearization for the rest of the world. Past experience suggests that Hubbert Linearization might underestimate the future production.
Thanks!
However, the EIA numbers were in the past a joke when it come to projection of renewables. Greenpeace did a much much better job, still too conservative.
Hint: We will see 100 GW PV net addition in 2019/20, 200 GW around 2025, and very likely >300 GW around 2030.
Even with a linear groth of wind power of 10% per year we would be in the 150 GW range around 2030.
Wind and PV will give ~400 GW per year around 2030 at least IMHO.
Hi Ulenspiegel,
My model suggests we might get to 400 GW per year (combined wind and solar) by 2038 and 300GW net additions by 2034. So I am roughly in the same ballpark as you.
We may both be too optimistic and perhaps reality will fall somewhere between Minqi’s estimate and yours (and mine which is roughly similar).
I am willing to accept this compromise
Hi Minqi,
Neither of us can predict the future, though your guess is likely to be better than mine.
I agree that we will have to wait to see how things unfold.
I also agree that my estimate is probably too optimistic.
Kurdistan. The deal with Baghdad is shaky.
Exporting 600K bpd. Turkey pipeline bypasses Iraqi fed govt.
Blurbs:
Kurdistan did not adhere to the OPEC production deal in November 2016, nor did it join the production cut extension agreed to in May. Indeed, the KRG has pressed ahead with plans to expand oil production and exports, signing a twenty-year deal with Russia’s Rosneft in early June. The Russian company will invest $3 billion in the KRG while exporting Kurdish oil to refineries in Germany.
This deal comes after an accord signed in February 2017, which gave Rosneft access to transportation for 700,000 bpd. This capacity could expand to 1 million bpd by the end of the year, if Kurdish production goals are met.
I am planning to keep doing this in the coming years.
By 2021, we will have the first major opportunity to test how my successive projections from 2017 to 2020 on what will happen in 2020 compare with what actually happens in 2020.
Hi Minqi Li,
Thank you for doing this, it’s a very nice summary.
What is China’s plan for coal? Does their 5 year plan call for a reduction of coal consumption?
Several years ago I had the opportunity to tour China with a group of bridge players. Our cruise ship on the Yangtze River was lifted up in the locks of the Three Gorges Dam, location of the world’s largest power plant. It was of interest to note that approximately half of the ships seen on the Yangtze were carrying coal. The pollution seen in Chongqing and other Chinese cities was unbelievable.
According to a news release by China’s National Energy Administration, the current plan is to limit total coal-fired capacity to no more than 1100 GW by 2020.
According to China’s National Development and Research Committee (used to be the state planning committee)’s Energy Production and Consumption Strategy (2016-2030), China’s total energy consumption is expected to reach 5 billion tons of coal equivalent (3.3 billion tons of oil equivalent) by 2020 and 6 billion tons of coal equivalent (4 billion tons of oil equivalent) by 2030.
Please note that 6 billions of coal equivalent has about the same energy content as 8 billion tons of Chinese coal.
It is projected that by 2030, nuclear and renewables will account for 20% of China’s energy consumption and natural gas will account for 15%. In the published report, no other figures are provided.
Thanks.
China has been increasing its consumption of wind and solar power at 33%/year from 2009 to 2016. From 2012 to 2016 electricity generation grew at about 4.8%/year. If we assume the wind and solar consumption increase falls by 1% per year while electricity consumption continues to grow at 4.8%/year, then all electricity generation is replaced with wind and solar power by 2034.
This is clearly optimistic, but China does some amazing things when a government decision is made to accomplish something.
Thank you for the work and posting Professor Li.
I have a few observations-
Assuming the trends play out roughly as you have displayed in the graphs, it looks like non-USA oil production decline is fairly brisk after 2020, whereas USA production has a prolonged high plateau (fig’s 2 and 4). There is a similar trend with Natural Gas. The geopolitical implications of this are huge.
For example, both India and China (and Korea, Japan and Europe) will have difficulty securing enough oil and gas in this scenario within a decade. This will support a huge demand for coal, and renewables.
In any case, I look forward to seeing how the future data plays out, and not so very much looking forward to seeing the sea level rise or the chaos of jostling nations.
“For example, both India and China (and Korea, Japan and Europe) will have difficulty securing enough oil and gas in this scenario within a decade. This will support a huge demand for coal, and renewables.”
The decline in oil production is around 3% per year. Therefore, the relevant question is what the EV share of newly sold cars must be to compensate for this.
A car lives around 15 years, trucks a little bit longer, hence, around 5% are replaced per year, to compensate for 3% decline in oil production we need around 50% EV share of new cars, this will be reached very likely before 2030.
Hi Ulenspiegel,
Cars in countries such as the USA last only about fifteen years, or even less, for two basic reasons, as I see it.
One, the many improvements in new models renders older models less desirable, in every respect, from comfort to fuel economy to reliability to safety, so older ones just aren’t worth the cost of maintenance in the eyes of the driving public.
Two, we Westerners don’t really build cars to last, there are too many things to go wrong, too many parts too hard to get at in the case repairs are needed, too little standardization, making it hard for mechanics to get to be REALLY good at fixing things fast and right. Bottom line, cars are throw away goods. Ditto light duty trucks, but to a somewhat lesser degree.
Modern heavy duty trucks can be bought with just about all the bells and whistles that come on nice cars, from leather upholstery to super sound systems, a to z, but they ARE made to be serviceable, and to last. I have driven some with over a million miles on them that were still basically as good as new, in terms of day to day service. I have friends who routinely do the cross country trip every eight to ten days or so in trucks with well over half a million miles on them.
I don’t see any reason why the auto industry in the USA will start building cars to REALLY last, because the idea HERE is to sell more, rather than to provide transportation, when you get right done to the bottom line. So they build them to last long enough that the new car buyer is satisfied with his new car, for as long as he is apt to want to keep it, which is generally less than ten years.
Eventually I get to the point. The Chinese have something that can be described as a master plan, and they have a political system that allows them to implement it, and as Dennis points out upthread someplace, they can and do accomplish some amazing things, when they decide to do so.
The Chinese may decide to build cars to last five hundred thousand miles or thirty years or longer, in order to save on cars, and thus have MORE resources to spend on OTHER goods, from housing to water and sewer to hospitals to warships.
There’s no technical reason at all that cars can’t be built to last thirty years or longer, especially if they are electric cars, which are simpler, except for the battery. Standardization, interchangeability, ease of service, and corrosion proofing are the key areas than must be emphasized for this to work. Truck manufacturers mastered these areas generations back.
Will the Chinese mandate cars that last? Cars that can be UPGRADED, economically, as new technology comes along? Gearheads here in the USA routinely swap out drum brakes for disk brakes on old collectible cars, which is easy, because the disk brake components bolt right onto the suspension system, with few or no modifications required. They substitute electronic ignition systems for old breaker points systems, they substitute fuel injection for old carburetors.
And these old cars weren’t DESIGNED to make upgrades easy.
It would be characteristic of the Chinese to build cars that are intended to last, at least for their domestic market.
I don’t believe in throw away goods. Most of my furniture will last hundreds of years, and it’s ALREADY valuable JUST because it’s already OLD, lol.
And if the automated for hire car industry does go from gleam in the eye to reality, then cars built here in the West will be built to be easily serviceable and to last as well, because the OWNERS of such for hire cars will buy the ones that run the cheapest over the long run.
The author of the original post did a great job, my hat is off to him.
But Nick is right, when he says technological and economic disruption can mean such modeling of the future MIGHT turn out no better than just guesswork.
The models provide us with something to go on, something to start with, and that’s a LOT better than just guessing.
In Germany the average registered car was 9.3 years old. The average car lasts about 18 years.
https://de.statista.com/statistik/daten/studie/316498/umfrage/lebensdauer-von-autos-deutschland/
Collapse of Global Civilization by 2020-Irrefutable Evidence
https://www.reddit.com/r/collapse/comments/6g2d7j/collapse_of_global_civilization_by/
Irrefutable? That’s silly.
The fact that growth in manufacturing (steel, car production, etc) is flattening in developed countries tells us nothing about the world economy, and it certainly doesn’t suggest that anything will collapse.
You are as dumb as they come…
Weird.
Okay, let’s try again:
…maybe it means the countries on that chart have enough “stuff”, and so the production of “stuff” is leveling off.
So, it’s services that are expanding: medicine, law, entertainment. It’s easy to measure the number of cars manufactured per year or hour, but it’s very, very hard to measure “productivity” (GDP per work hour) for services. How do you tell that a doctor or lawyer is producing more this year than last? Healthier patients? Faster surgeries? More lawsuits per hour? What’s a productivity increase for a movie maker – more special effects per hour? These things are very hard to measure.
We can try to measure production in terms of inflation-adjusted sales value, but how does that work for free iPhone apps?
It’s very easy to construct an argument, when, by and large, you don’t formulate one at all. Shovelling a yarn of links, with the outset expectation that the receiver collate them independently, distilling your assertion by proxy, is the weakest uniformity of any attack vector. However, certainly, on your part, it provides maximum maneuverability on a fulcrum of minimum input energy, but you counter with petulence, and that is where you lose all credibility. Mutual respect is conversation’s currency, and you are broke.
Dr. Pangloss.
See comment just above…
Free iPhone apps and more efficient lawyers. The world is saved. Let’s get some to Yemen and Syria ASAP. Who needs food & energy, we got an app for that. Crop failed? Don’t worry about it- Hollywood lawyers are upping the pace and CGI is better than ever.
BTW- doctors don’t produce. They provide. Some of the ones that provide the most are currently practicing in some of the world’s most squalid shitholes. I’m not sure what that’s doing for GDP though. The Doc could probably make more money if they got a gig at a lipo clinic sucking the fat out of first world asses. That would look far better on the current accounts deficit ledger.
Perhaps you could develop the metrics to answer your own question- “How do you tell that a doctor or lawyer is producing more this year than last? Healthier patients? Faster surgeries? More lawsuits per hour? What’s a productivity increase for a movie maker – more special effects per hour?”- and then let us all know in measurable terms how bright the future will be for us all as a result of these ‘improvements’.
I recommend for you a timeout from the Silicone Valley Circle Jerk™ and maybe try a working holiday on a small farm in rural India. You’re becoming disconnected from reality.
I stand by my earlier comment. Dr. Pangloss.
https://www.oxfamamerica.org/explore/stories/threat-of-four-famines-in-2017-requires-immediate-humanitarian-and-political-action/
More lawsuits per hour lol yeah, problems solved!
Hey Survivalist, sometimes you miss the point. Your comment says more about yourself than Nick.
We all understand that there are those who aren’t making it. That’s nothing new. What’s new is that a larger percentage of whites are struggling and more people of color are seeing success.
If a doctor can cure you with a $100 pill, instead of a $10,000 hospital visit. That doesn’t mean the world is collapsing.
We are living in a world of deflation. Twenty-five years ago you wouldn’t have had the time or means to waste hours on a non productive blog.
Americans waste more food than they eat and they eat way to much.
Ten years ago many here wrote with their hair on fire the world was running out of oil and collapse was only a couple of years off. Today we are swimming in oil.
In fact, mankind is solving its economic problem. But its ecological problems are getting worse.
You’re talking about developing countries: Yemen, Syria, India, etc. We both agree that they need more “stuff”, like food and housing.
The article that started this discussion is about developed countries, which pretty much have enough “stuff”. That means that any growth in their economy is in services, like medicine. Whether medicine is of any value or not is besides the point – that’s where the growth is happening, which is why growth of GDP per labor hour is slowing down dramatically in developed countries..which is what the article was about.
Think, and read carefully, before you start acting like a troll.
Hi Nick,
It is far from clear that the article was talking only about the developed World. The initial post in this thread was a page with many (50+) links. Did you read them all?
I didn’t read any of them. A link to 100s of other links is not very useful, one should pick the best link to focus the discussion rather than a link to many other links, or that’s what I try to do.
Also a brief excerpt with a link to the full text is nice, without that most people won’t bother to click the link (or maybe that’s just me).
Hi Dennis,
Just to be clear, this comment was not in response to the Original Post – it was in response to an article posted by “Cliffhanger”, which showed a chart showing the decline of rates of growth of labor productivity in OECD countries.
I gues that’s what you’re referring to. In which case, I agree – it’s not worth wading through all those links, most of which seemed to have nothing to do with the chart.
Hi Nick,
When I click on the link posted by cliffhanger, I get a page with 50-100 links.
I stop there. Not at all clear what “chart you are talking about” unless you post a link to it or post the chart itself.
Wow, I see what you mean.
When this link was first posted, at the top you saw a large chart of decline labor productivity in OECD countries. The links followed, and I ignored them, as they were a hodgepodge of only vaguely related stuff.
Now the link is just useless – no one is going to wade through the long list of URLs.
Hi Dennis,
I just noted the last part of the reference is cut off. The missing references are listed below:
Maddison, Angus. 2010. “Statistics on World Population, GDP, and Per Capita GDP, 1-2008 AD.” http://www.ggdc.net/MADDISON/oriindex.htm.
NASA. National Aeronautics and Space Administration, Goddard Institute for Space Studies. 2017. “GISS Surface Temperature Analysis.” https://data.giss.nasa.gov/gistemp/
Political Economist. 2016. “World Energy 2016-2050,” Peak Oil Barrel, June 20, 2016.
http://peakoilbarrel.com/world-energy-2016-2050-annual-report/
Rutledge, David. 2008. “Hubbert’s Peak, the Coal Question, and Climate Change,” Excel Workbook. Originally posted at http://rutledge.caltech.edu.
____. 2011. “Estimating Long-Term World Coal Production with Logit and Probit Transforms,” Excel Workbook. http://rutledge.caltech.edu/.
World Bank. 2017. World Development Indicators.
http://databank.worldbank.org/data/home.aspx.
Hi Minqi,
Sorry, I got the references scrambled. Check now to see if its ok. They were in 3 jpg files and they were posted out of order (1,3,2) now fixed.
Thanks
Global Energy Graphed
All BP based charts now updated to 2016 from the 2017 Stat Review published last week (the link goes to the BP chart pages).
This looks like an interesting post that I will return to.
Euan, thanks
I rely on your website a lot to support my “conservative” case for renewables in my discussion with Dennis
Professor Minqi Li
I think many people see the increase in things like electric cars in wealthier countries and think nothing can stop their growth.
However electric cars are the preserve of the well off and as long as 80% of the wealth is owned by the richest 20% then electric vehicles will never become mass market.
Global EV sales in 2012 were 134,000, in 2016 they were 775,000 that sounds wonderful.
http://www.ev-volumes.com/
However global vehicles sales in the same period has gone from, 82,129,138 to 93,856,388 an increase of 11,727,250.
So the gap between EV sales and diesel/petrol vehicles has actually widened over the last 5 years by over 11,000,000.
http://www.oica.net/category/sales-statistics/
Trouble is an electric vehicles is totally unaffordable to MOST families in most of the world and will remain so for a very long time.
https://en.wikipedia.org/wiki/Distribution_of_wealth
When the poorest 60% of the planet owns just 3% of the wealth, burning coal and wood for cooking and heat will be their lot.
Even in rich countries an EV is £15,000 more than the equivalent ICE, very few families can spend an extra £15,000 on a car.
Hi Jan,
The Tesla Model 3 will start at 35,000. The average sales price for a new personal vehicle in the US is about $30,000.
The price of EVs will continue to fall and when peak oil arrives the price of petrol will rise, making EVs total cost of ownership fall below that of an ICEV.
This may not be true today, but in 5 years it is likely to be the case.
I agree that unequal distribution of income is a problem, better progressive income tax policy like that instituted by FD Roosevelt in the US (though with all the loopholes eliminated) would help reduce income disparity.
Dennis Coyne says:
The wind and solar energy cup is always half full, and the fossil fuels energy cup is always half empty.
How has that bias worked out for your crystal ball in the past?
Hi Glenn,
On World C+C see the post linked below from July 20, 2012
http://oilpeakclimate.blogspot.com/2012/07/an-early-scenario-for-world-crude-oil.html
The “high” scenario in the first chart of the post might not be too far off, though since that time I have revised my estimate from 2800 Gb for the World C+C URR to about 3200 Gb (including 600 Gb of LTO and extra heavy oil resources combined).
I expect a peak between 2020 and 2030, depending upon how fast resources are developed and the rate of production from proved developed producing reserves (I call that rate of production the extraction rate following the work of Paul Pukite, aka Webhubbletelescope).
Need to segregate heavy oil resources. Venezuela is going towards failed state status. Watch this video in which Luis Almagro hints the comparison of Maduro to Hitler and Venezuela to Rwanda
https://youtu.be/XaXKv1_D1RE
Hi Fernando,
I agree extra heavy and LTO resources should be treated separately. I do that. I follow Jean Laherrere’s estimate of a 500 Gb URR for extra heavy resources and 100 Gb for LTO resources.
My actual output scenario is somewhat more conservative than that of Laherrere for extra heavy (API gravity less than 10 degrees) oil.
I assume about 250 Gb from Canada and 250 Gb from Venezuela, with Venezuela following a similar ramp as Canadian Oil sands, but delayed by 15 to 20 years.
I believe that your expectation for Venezuela is less than 250 Gb from Orinoco (maybe 125 Gb?), but I am not sure what your latest estimate is.
Clearly you would know far more than me and your estimate would probably be closer to reality.
Who knows? Venezuela produces less 2 mmbopd and there’s a high risk that sometime in late August the civil war will start. Yesterday there was a significant amount of looting in Maracay by what appeared to be regime supporters, and in Caracas they were looting food trucks on the eastern end of the city.
Hi Fernando,
I am talking long term.
Eventually things will get better in Venezuela, hopefully soon.
Imagine a democratically elected government that follows the rule of law is re-established in Venezuela within 5 years.
Based on your knowledge, what would you expect the URR from the Orinoco belt would be 50 Gb, 150 Gb?
I think you might have thrown out a guess of no more than 100 Gb in the past, but I may not be remembering correctly.
I am pretty sure it is far less than the supposed 200 Gb of proved reserves.
Dennis
What car do you drive?
Hi Jan,
Prius plugin (wife uses camry hybrid). Will probably buy the Tesla Model 3 when it is available (no deposit, so probably 2018 or 2019.)
Hi Dennis
So it has a petrol engine. Burning petrol even at a reduced rate still means the world must drill for more oil and it will all get burned up, it will just take a little longer.
http://www.greencarreports.com/news/1093560_1-2-billion-vehicles-on-worlds-roads-now-2-billion-by-2035-report
The fact is out of 93,000,000 vehicles sold world wide only around 300,000 were real electric.
These figures should tell you everything you need to know about cost and practicality of electrics.
The fact is out of 93,000,000 vehicles sold world wide only around 300,000 were real electric.
These figures should tell you everything you need to know about cost and practicality of electrics.
LOL! The only thing they really tell us is that people are ignorant of past example of massive failures to adequately predict the growth of future technologies…
Sure, the planet could be wiped out by an unexpected asteroid in the near future but if it isn’t, then EVs will rule the future just like the furry little mammals won out when the dinosaurs went extinct.
Case in point:
http://digital-stats.blogspot.com/2014/07/mckinsey-company-projected-that-there.html
McKinsey & Company projected that there would be 900,000 mobile subscribers in the US by 2000
“In 1980, McKinsey & Company was commissioned by AT&T (whose Bell Labs had invented cellular telephony) to forecast cell phone penetration in the U.S. by 2000. The consultant’s prediction, 900,000 subscribers, was less than 1% of the actual figure, 109 Million. Based on this legendary mistake, AT&T decided there was not much future to these toys. A decade later, to rejoin the cellular market, AT&T had to acquire McCaw Cellular for $12.6 Billion. By 2011, the number of subscribers worldwide had surpassed 5 Billion and cellular communication had become an unprecedented technological revolution.”
Did your grandfather work for McKinsey & Company? Maybe the way you think is genetic.
Needed to be repeated:
“The only thing they really tell us is that people are ignorant of past example of massive failures to adequately predict the growth of future technologies…”
I agree
Fred
You really are an ignoramus.
Comparing cars that cost tens of thousands of pounds with mobile phones that even at the start were a fraction of the cost.
I will say this slowly for you so you get it.
In many countries they can afford to buy these kinds of cars.
https://www.zigwheels.com/newcars/Tata
But a £30, 000 car or even a £20,000 car will never be an option.
Mobile phone my left foot.
Never say never
My flip phone has enough computing power to fly to the moon
Hi Jan,
We will have to see how the Tesla Model 3 does, they expect to be making 42,000 per month by the end of 2018.
If the car is successful other companies like Volkswagon, Chevrolet, and Audi will join in.
The rate of growth has already been pretty fast and at 20% growth in sales per year things can change quickly.
Models for EV growth using smartphones (high growth) and personal computers (slower growth) as analogs. The chart below looks at oil consumption with the two scenarios and a no plugin scenario (oil demand limited by supply).
Note that no attempt was made to model transition to trains, electrification of trains, or ship and air travel. High oil prices may lead to a fast transition away from fossil fuels for these other uses (wind and or nuclear for ships, or LNG) and possibly biofuel/ electric hybrid for air travel.
Dennis
You cannot compare mobile phones or computers to cars.
Even in the early day both were affordable to average earning families. I know several people who bought them in the early days.
http://lowendmac.com/2014/personal-computer-history-the-first-25-years/
Look at the costs of vehicles sold in India.
https://www.zigwheels.com/newcars/Tata/Tiago/on-road-price-delhi
http://www.toyotabharat.com/showroom/prius/
How many families in India will buy one electric car when it costs the same as 10 cars which is already a high expense for a family.
Hi Jan,
There is a great demand for transportation, as the availability of oil for transport becomes a problem, the scarce oil will become very expensive.
The total cost of transport includes the price of the car and the cost of fuel and maintenance. The electric cars will become cheaper (total cost to own and operate) especially as economies of scale and technological progress drives down the cost of EVs.
India has a rapidly growing middle class and less expensive EVs will be produced for that market.
In the Chinese Market EVs are about $8000 after government subsidies. The average new car sales price in China is around $21,000.
https://www.forbes.com/sites/jackperkowski/2017/06/01/china-is-leading-the-worlds-boom-in-electric-vehicles-heres-why/#f45ebb02f2ee
While electric vehicles and plug-in hybrid electric vehicles (PHEVs) currently account for less than 1% of the cars produced annually, many believe that we are at the beginning of an “Electric Revolution.” In its recent comprehensive and authoritative report on the subject, Bernstein, a prominent Wall Street research firm, predicted that EVs could represent 40% of auto sales and 30% of the global car parc in 20 years. Likewise, UBS, a leading global financial services company, believes that a growing global electric vehicle fleet will be disruptive to gasoline demand by 2031.
Hi Jan,
A mobile phone is different from a smartphone, also personal computers were very expensive at the start.
The technology is adopted in wealthier nations first, costs fall and they become more widespread.
This is a pretty standard practice for new technologies through my life time. In fact the adoption has gotten quicker over the years.
EVs are being rapidly adopted in China where densely populated cities makes them practical.
I would think even in the UK where petrol is quite expensive that EVs might be pretty competitive on a Total cost of ownership basis.
It is up to the people of the UK if they want to subsidize EVs as is done in China and elsewhere. This speeds adoption and drops prices and may also keeping the Chinese from dominating the EV market in the future.
Electric Vehicles come in all sizes and price points. In general, their Total Cost of Operation (amortized purchase cost/depreciation, fuel, maintenance) is less than a **comparable** oil fired vehicle.
Electric bikes sell in in the tens of millions in China, India, etc.
Dennis
That graph is pure fantasy.
In the real world people are making real choices.
http://online.wsj.com/mdc/public/page/2_3022-autosales.html
Ford F series and Dodge Ram being the top choices in 2017.
Back in 2005 many on the oil drum said people would be dumping pickup trucks in a few years due to high oil prices, WRONG.
There is no sign what so ever of most people being more aware of any oil production problem. Those who buy electric are usually more aware of environmental issues and perhaps how oil is the cause of so many wars. They also need to be reasonably well off.
This puts them in a minority, hence the very small percentage sales of pure electric vehicles.
Hi Jan,
As more EVs become available and costs decrease the sales will increase.
I forgot about the Chevy Bolt which costs about 30K after Federal govt subsidy of $7500 (MSRP $37.5k), its range is 238 miles.
Nice review at link below
https://cleantechnica.com/2017/06/25/life-chevy-bolt-first-1200-miles/
Soon the Tesla Model 3 will be available at $35k MSRP with at least 215 miles of range (final numbers not announced yet afaik) in August or September.
The price of these cars will fall over time as less expensive models are designed and they become more popular.
When considering Total cost of ownership over 5 years, the Chevy Bolt($8356/year) is only slightly more ($500) than the Toyota Camry Hybrid ($7874/year).
https://www.kbb.com/toyota/camry-hybrid/2017/le-ownershipcosts/
https://www.kbb.com/chevrolet/bolt-ev/2017/lt-ownershipcosts/?r=661778262642441100&vehicleid=421886
Just curious. Would you consider the Chevy Bolt which is becoming widely available?
Hi Ovi,
Not sure who is being asked.
I have had a very bad experience in the past with a Chevy (in 1985) and will never purchase another GM car.
So I will wait for the Tesla or a Toyota or Honda, first used Toyota purchased in 1985 and mostly that is what I have driven since with one Honda in the mix.
Thank the car loan bubble for a $30,000 car being “affordable”
Is there a car loan bubble?
Has the default rate on car loans in the US been increasing markedly?
No.
See
https://us.spindices.com/indices/specialty/sp-experian-auto-default-index
Chart below from ink above.
@ Jan: “You cannot compare mobile phones or computers to cars.
Even in the early day both were affordable to average earning families. I know several people who bought them in the early days.”
I must once again bring up the topic of selfdriving cars: They are intrinsically connected to mobile phones. Mobiles will be the devices to call and pay fort that service. Once these services exist, mobile providers without a doubt will offer free car miles for cellphone buyers. In inner cities this will be a valid model from the start. It will spread fast and will be very economically: You only pay for the miles you really use. No trouble with insurance, maintenance, parking, grid connections and so on.
For the average single citizen within a few years this will be the best model for commuting and a complementation of existing public transport. Step by step this model will spread to suburban areas and bigger families, too.
Actually, the average sales price in the US is now $34k!! That’s higher than the cost of a basic Nissan Leaf, IIRC.
And, a Nissan Leaf has just about the lowest Total Cost of Ownership compared to other vehicles on the road, even the tiniest – just check Edmunds. Vehicles like the Chevy Volt, which has no range limitation, has a TCO which is rather lower than average.
Finally, used EVs are very, very cheap: you can get Leafs for $12k, and Volts for $15k.
So…EVs are very, very affordable.
“1. Nissan Versa S ($12,855)
In the case of the cheapest car of 2017, the Nissan Versa sedan, you indeed get what you pay for. We won’t mince words here: The Versa is cheap in every sense of the word, from the thin-skinned, plasticky interior to its miserably low feature content to its meager 109-hp four-cylinder engine with its rubbery manual shifter.”
In 1971 a new 70- hp base Ford Pinto sticker price was $1919 and minimum wage was $1.65.
I am young enough to remember when mobile phones were yuppie toys, and even when personal computers were sold as knock down kits that required soldering to assemble.
The most expensive piece of an electric car is the battery, and prices are collapsing. Meanwhile newer designs are shedding their ICE drive chains and losing weight.
I’ve never seen much discussion on weight vs. safety vs speed. How much lighter could we get vehicles and still have them be able to go 100mph and also give occupants a decent chance to survive collisions with heavier vehicles.
If we had better urban planning to zone roads for different styles of traffic but this would require we have a problem which we have article after article assuring us that we do not.
Sorry Minqi,
I realize your political views may not be conservative, maybe “pessimistic” would have been a better characterization of your renewable power projection.
One persons pessimism is another persons realism,
and ones optimism is anothers fantasy.
Depends on your pre-conceptions and assumptions…
Dennis Coyne says:
Minqi Li “pessimistic”?
Not hardly.
If you want to see what pessimism looks like, go spend some time on Gail Tberberg’s blog, Our Finite World (OFW). Minqi Li is still very optimistic, just not to the extreme that most who congregate on Peak Oil Barrel (POB) are.
Nevertheless, both schisms of peak oil congregants (OFW snd POB) do have something in common, and that is an abiding faith that the Age of Carbon is over.
This, however, is far from certain.
The much-heralded “transformation” — whether it be to the new wind and solar civilization (POB) or the apocalypse (OFW) — could require many decades, if not centuries, to come about, and the end result could be something very different from what either the peak oil optimists or peak oil pessimists imagine.
Glenn,
If your mind starts making division between optimism and pessimism it will trick you into believing that we are talking about two separate things. That is false. There is no division.
Optimism ends in pessimism. Every pessimist has been an optimist once — he is an ex-optimist. He hoped too much and because those hopes were not fulfilled he has become sour, angry, enraged. Now he cannot see the flowers and the stars.
There are people with optimism who thought that free market will regulate oil production. Now they are moving to the pessimist side when they figure out that so called “free-market” is man made up stuff – like Disney characters. Their hopes are not fulfilled. What they can do? They invested their lives in so many master’s degrees learning about “free market” theories and it is natural that one day they will become ex-optimist.
With renewables is the same. People were very optimistic in the beginning but year after year they move to the ex-optimist side after year after year F-150 is the top selling car. It is perfectly natural that they are moving to ex-optimist. Hard core renewable optimist says it is slow process. Well they are clinging to their optimism and not to renewables. Renewables will not develop faster or slower because it has more optimist than pessimist. It has its own path.
So, these pessimist and optimist are just different poles. It’s just like electricity. Electricity cannot exist only with one polarity, positive or negative; it has to have both the poles together. So we have to have both poles in everything.
But you can transcend both poles but that is nothing to do with topic of oil.
Ves,
That sounds very Niebuhrian.
He found that the moderns (atheists, secular humanists and religious humanists) placed too much emphasis either on evolutionary nature or the rise of the human spirit.
Neither naturalism nor humanism corresponded adequately to the chaos of the present social life. They both ended by avoiding the reality of chaos and suffering in human affairs by falling into despair and ineffectiveness. Their optimism betrayed them in the time of crisis.
The pessimism of the POB congregants, however, is not the consistent pessimism of the OFW congregants. The pessimism found on POB only extends to fossil fuels, but not to wind and solar, where optimism abounds. So their pessimism is more selective.
Sinking Louisiana: A Major Threat To Billions In Oil Infrastructure | OilPrice.com
ECB Reveals That 15% Of Its Bond Purchases Directly Funded Companies
For the normalcy worshipers. News just out.
The ECB has been lending money directly to companies. Other CBs buy stock. They lend money. The revelation was not that they buy secondary — meaning the company issues bonds and someone buys it, and then the ECB buys from the initial or 2nd or 3rd buyer (bonds have markets of their own), but rather, the ECB Has Been Buying Corporate Bonds Directly From The Issuing Company.
You want oil? You need a loan to pay for drilling? Quite the lender there.
ECB from its own QE program . . . 4.2 Trillion Euros, and growing.
So we see that banks and corporations are buying and selling back and forth. At the moment it is being done to prop up oil.
But the banks and corporations could be buying and selling back and forth in any industry. Propping up oil might be useful to keep oil flowing, but does that really benefit the rich? Their wealth is financial and could be constructed around any industry.
We are seeing that in Europe and the US, the masses aren’t necessarily going to go to war with the rich, even if the masses’ pay, their jobs, and perhaps oil is diminished.
In other words, how long with the rich and financial institutions even bother trying to prop up business as usual, or even the illusion of business as usual?
Big Oil Opposes Trump’s Budget Plans | OilPrice.com: “I suggested we use the SPR as a hedging tool to provide a balance between cost and price, thereby allowing a floor for producers and a ceiling for end users of the finished product.”
I don’t think technological innovation in oil drilling is going to be the answer, but this is an interesting post.
Dr. Ed's Blog: Drowning in Oil: “Meanwhile, the 52-week average of gasoline usage in the US is down 0.7% y/y. This may or may not be a sign of a slowing economy. It is undoubtedly a bearish development for oil prices.
Saudi Arabia, Russia, Iran, and other major oil producers, with large reserves of the stuff, should be awfully worried that they are sitting on a commodity that may become much less needed in the future. Elon Musk intends to harvest solar energy on the roofs of our homes, storing the electricity generated in large batteries while also charging up our electric cars. As long as the sun will come out tomorrow (as Little Orphan Annie predicted), solar energy is likely to get increasingly cheaper and fuel a growing fleet of electric passenger cars. Meanwhile, the frackers are using every frick in their book to reduce the cost of pumping more crude oil. Rather than propping up the price, maybe OPEC should sell as much of their oil as they can at lower prices to slow down the pace of technological innovation that may eventually put them out of business.”
Funds pull back from Permian as U.S. shale oil firms go into overdrive | Reuters: “Eight prominent hedge funds have reduced the size of their positions in ten of the top shale firms by over $400 million, concerned producers are pumping oil so fast they will undo the nascent recovery in the industry after OPEC and some non-OPEC producers agreed to cut supply in November.
The funds, with assets of $286 billion and substantial energy holdings, cut exposure to firms that are either pure-play Permian companies or that derive significant revenues from the region, according to an analysis of their investments based on Reuters data.”
2 DEGREES OF SEPARATION – TRANSITION RISK FOR OIL AND GAS IN A LOW CARBON WORLD
http://www.carbontracker.org/report/2-degrees-of-separation-transition-risk-for-oil-and-gas-in-a-low-carbon-world/
This new analysis provides a way of understanding whether the supply options of the largest publicly traded oil and gas producers are aligned with demand levels consistent with a 2 degree Celsius (2D) carbon budget. By allocating the carbon budget to potential oil and gas projects, through applying the economic logic of a carbon supply cost curve, it is possible to identify which companies have the highest exposure to potential capital expenditure (capex) to 2025. This report provides a snapshot of the potentially unneeded capex spend for 69 global oil and gas companies – highlighting for the rst time, the wide- ranging degree of exposure amongst companies in the sector.
US$2.3trn – around one third – of potential capex to 2025 should not be deployed in a 2D scenario compared to business as usual expectations.
Company level exposure varies from under 10% to over 60% when considering the largest 69 publicly traded companies.
Around two thirds of the potential oil and gas production which is surplus to requirements in a 2D scenario is controlled by the private sector.
Full report is available for free download.
Hi George Kaplan,
Can you check your e-mail account?
Thanks.
Minqi Li: Excellent work. I would only suggest a correction: the temperature match to emissions may be a fluke, because the theory ties warming to CO2 atmospheric concentration. This in turn is supposed to impact forcing (in watts per square meter) according to a logarithmic function. The warming caused by co2 in turn drives water vapor concentration and other feedbacks. Thus it’s possible your temperature projection may be off. One possible solution is to use a conventional approach, estimate concentration (you have to assume at least three carbon sink efficiencies), use three climate sensitivities (use TCR ranges seen in IPCC report), and limit yourself to laying out a table with 9 possible outcomes (for three carbon sinks and three TCRs) when concentration reaches 560 ppm (that’s the doubling used in the TCR).
A subsequent step would be to estimate the point in time until when the temperature increase is economically positive. The IPCC 2013 draft and work done by Dr Richard Tol sets the peak at 1.6 degrees C, meaning global warming and increased CO2 is a positive until temperature reaches 1.6 degrees above preindustrial. Thereafter, mostly due to sea level rise, the curve trends downwards. This type of estimate is quite rough and may not be valid, but it’s what we can use at this time.
Given that co2 concentration increase can be a positive until a future point in time, then we have to understand if indeed it’s worth it to take the extraordinary measures proposed by the climate dogmatists. It’s possible the current technology and fuel depletion trends will allow market forces to “solve” the problem, at least as far as the next 50 years are concerned.
Hi Fernando,
A problem with that type of analysis is that the carbon dioxide remains in the atmosphere for a very long time and there is a long lag on global temperature increase due to the thermal inertia of the Global Ocean.
One cannot just switch off the continued warming after reaching 1.6 C, you commit the planet to hundreds of future years above the optimal temperature (if indeed 1.6 C above pre-industrial is indeed optimal, I do not believe there is widespread agreement on that point).
So for the medium term (between TCR short term and ESS long term) of the next 500 years we would use the ECS rather than the TCR.
For 1.6 C we would aim for a stabilized atmospheric CO2 at about 402 ppm if we use the mainstream equilibrium climate sensitivity (ECS) of 3 C.
So it looks like some drastic action is in order, if indeed 1.6 C is optimal as we are past that point already as the recent global trend line was 404 ppm in March 2017.
The half life of a carbon dioxide molecule in the atmosphere is five years.
David, that is not true.
Why don’t you just be straightforward with everyone and tell them you are a rabid climate change denier.
You’ve got your vested reasons.
So does Trump.
Hi David Archibald,
The half life of individual CO2 molecules is beside the point.
The mean lifetime of anthropogenic CO2 in the atmosphere is 32,500 years because the carbon cycles in and out of the atmosphere through the Carbon cycle. Try the peer reviewed literature below by David Archer, rather than blog posts.
See
https://geosci.uchicago.edu/~archer/reprints/archer.2005.fate_co2.pdf
A model of the ocean and seafloor carbon cycle is subjected to injection of new CO2 pulses of varying sizes to estimate the resident atmospheric fraction over the coming 100 kyr. The model is used to separate the processes of air-sea equilibrium, an ocean temperature feedback, CaCO3 compensation, and silicate weathering on the residual anthropogenic pCO2 in the atmosphere at 1, 10, and 100 kyr. The mean lifetime of anthropogenic CO2 is dominated by the long tail, resulting in a range of 30–35 kyr. The long lifetime of fossil fuel carbon release implies that the anthropogenic climate perturbation may have time to interact with ice sheets, methane clathrate deposits, and glacial/interglacial climate dynamics.
David,
While individual CO2 molecules have a life time of around five years in the atmosphere when they leave they’re simply swapping places with CO2 in the ocean so the final amount of extra CO2 that remains in the atmosphere stays there on a time scale of centuries. This is Grade 8 science.
CONTROL OF CO2 CONTENT OF THE ATMOSPHERE BY THE OCEANS
http://eesc.columbia.edu/courses/ees/climate/lectures/ocean_co2control.html
And BTW,
TIPPING POINTS ARE REAL: GRADUAL CHANGES IN CO2 LEVELS CAN INDUCE ABRUPT CLIMATE CHANGES
During the last glacial period, within only a few decades the influence of atmospheric CO2 on North Atlantic circulation resulted in temperature increases of up to 10 degrees Celsius in Greenland — as indicated by new climate calculations.
https://www.sciencedaily.com/releases/2017/06/170623100414.htm
But will many outside the science community understand what this means and what it implies? Let alone take some action?
…This is Grade 8 science.
That is way beyond the knowledge level of the average troll/science denier that shows up around here. And that seems to include petroleum engineers who like to tell us things like this:
The IPCC is wrong. Their mental model works at this time by sheer accident. It has no science behind it.
In any case here’s a little ocean chemistry primer on why the continued increase of CO2 absorption of the oceans and the subsequent consequences to marine organisms is a such a very big problem.
https://www.st.nmfs.noaa.gov/Assets/Nemo/documents/lessons/Lesson_3/Lesson_3-Teacher's_Guide.pdf
First, CO2 reacts with water to form carbonic acid (H2CO3-):
(1) CO2 + H2O -> H2CO3
–
Carbonic acid can then dissociate into bicarbonate (H+ CO3-):
(2) H2CO3 -> H+ + HCO3-
–
Bicarbonate can then dissociate into carbonate ions (CO3 –)
(3) HCO3 -> H+ + CO3 —
(1) CO2 + H2O -> H2CO3-
(2) H2CO3 -> H+ + HCO3-
(3) HCO3 -> H+ + CO3 —
When first viewing these equations it may appear that both hydrogen ions and carbonate ions increase in solutions as a result of CO2 dissolving in seawater. This is not the case! This would be true if the reactions above only occurred in a single direction but chemical equations can actually go in either direction. A more correct representation of this would be:
(4) CO2 + H2O H2CO3-
(5) H2CO3- H+ + HCO3-
(6) HCO3 H+ + CO3 —
It is ultimately the rates of occurrence and net direction of the above reactions that determine seawater pH and carbonate availability. First when CO2 dissolves in seawater the primary reactions that occur are (1) and (2) going in the direction as listed.
Equation (2) shows that formation of carbonic acid results in an increase in the hydrogen ion concentration (and thus a decrease in pH). This leaves equation (3) as a key player in determining carbonate availability in seawater. Chemical reactions in seawater can send any of the above equations in either direction as the system tries to maintain equilibrium. As more CO2 dissolves and H+ ions increase in solution, equation (3) will shift in the opposite direction (to the left) to produce bicarbonate. Thus in the system’s attempt to reduce the hydrogen ion concentration, it binds hydrogen and carbonate ions together thereby reducing carbonate availability to marine organisms.
Now the trolls may not have passed 8 grade science but you’d figure petroleum engineers would have at least taken organic chemistry…
Not to worry Fred, there is going to be a lot more calcium carbonate flushed into the ocean as growing concerns over DT, global warming and host of other problems causes acid reflux.
I bet parts of the ocean are already heavily reduced in their ability to absorb CO2.
I bet parts of the ocean are already heavily reduced in their ability to absorb CO2.
Yep, that is most certainly a claim I would be unwilling to bet against. Ironically this afternoon I had a conversation with a scientist who designed and runs the saltwater filtration system of a new marine research institute that just opened up in my back yard, they help injured sea turtles.
This guy self identified as a conservative Republican and to say that he is deeply concerned by the ignorance and anti science stance of the public at large would be an understatement.
As he said, facts are facts you can deny them if you want but it just doesn’t change reality and you can’t fucking argue with basic ocean chemistry! It just isn’t a partisan issue.
Petroleum engineer’s, idiotic anti science statements, notwithstanding!
Nature is a wonderful teaching instrument, yet can be very harsh on the ignorant and unsuspecting.
Dennis, your logic is flawed. Roughly half of all emitted CO2 never contributes to atmospheric concentration. The amount removed increases as a function of CO2 concentration. The lifetime of an individual co2 molecule is quite irrelevant. The SINK removal rate is a function of CO2 concentration, seawater temperature, humidity, precipitation, erosion, plant growth, etc. Thus it’s more accurate to link temperature to CO2 concentration rather than emissions. As emissions turn down we should see the fraction that is removed increase, but this effect is sometimes tweaked to exagerate warming. Just like the IPCC had a brain gas with RCP8.5, many models have tricked co2 sinks to exaggerate warming. Now that rcp8.5 has fallen in disgrace, my next target is to get these carbon sinks straightened out.
Hi Fernando,
When you published some peer reviewed papers that refute the main stream scientific understanding of the Carbon cycle then I will be convinced.
See
https://geosci.uchicago.edu/~archer/reprints/archer.2005.fate_co2.pdf
Fate of fossil fuel CO2 in geologic time
David Archer Department of the Geophysical Sciences, University of Chicago, Chicago, Illinois, USA
Received 26 July 2004; revised 7 March 2005; accepted 24 March 2005; published 21 September 2005. [1] A model of the ocean and seafloor carbon cycle is subjected to injection of new CO2 pulses of varying sizes to estimate the resident atmospheric fraction over the coming 100 kyr. The model is used to separate the processes of air-sea equilibrium, an ocean temperature feedback, CaCO3 compensation, and silicate weathering on the residual anthropogenic pCO2 in the atmosphere at 1, 10, and 100 kyr. The mean lifetime of anthropogenic CO2 is dominated by the long tail, resulting in a range of 30–35 kyr. The long lifetime of fossil fuel carbon release implies that the anthropogenic climate perturbation may have time to interact with ice sheets, methane clathrate deposits, and glacial/interglacial climate dynamics.
Citation: Archer, D. (2005), Fate of fossil fuel CO2 in geologic time, J. Geophys. Res., 110, C09S05, doi:10.1029/2004JC002625.
Irrelevant. You missed the point. Never mind.
Hi Fernando,
Look at anthropogenic carbon emissions and atmospheric CO2 concentration from 1900 to 2017, you will find that the amount of anthrogogenic emissions that have been sequestered has been relatively constant. The chart below plots cumulative anthropogenic emissions (fossil fuels, cement, and land use change) since 1850 against CO2 in the atmosphere (both measured in Gt of CO2 from 1960 to 2014.
The sequestration rate (1 – slope of line) has been pretty constant at about 56% over that period.
Chart above should say “Atmospheric CO2”
Using this relationship and cumulative emissions one can estimate future CO2 concentrations. Then using natural log of CO2 vs Temperature from 1880 to 2016 one can estimate the slope of that line and use this to model future temperature. Or one could use a program like MAGICC to make an estimate based on the emissions profile.
The fact that the simple model agrees well with RCP4.5, which I think you would agree is a reasonable scenario verifies the procedure.
I will obviously not convince you if you assert without proof, that the thousands of scientists that contribute to the IPCC reports are incorrect.
So yes I will ignore your comments on climate change.
The zero point on the vertical axis corresponds to the atmospheric CO2 in 1850 (289 ppm) so it is the increase in atmospheric CO2 since 1850 (837 Gt CO2 added to the atmosphere from 1850 to 2015 which corresponds to the increase from 289 ppm in 1850 to 397 ppm in 2014.)
Hi Fernando,
It is very relevant, and if you read and understand the paper it is very clear why.
Hi Fernando,
The carbon models suggest that carbon is removed from the atmosphere very slowly. You are correct that about half of carbon emissions are sequestered by a combination of the land and ocean, and it is also correct that the percentage of anthropogenic carbon emissions that are sequestered might increase as emissions decrease.
Where your thinking is incorrect is that when/if anthropogenic carbon emissions cease (or become very low) the carbon that remains in the atmosphere will decrease very slowly with a mean half-life for the average carbon dioxide molecule of over 30,000 years.
It takes a long time to put the Genie back in the bottle.
In the Archer paper there is a 1000 Gt and 2000 Gt carbon emission scenario, take the average of those two to get a rough idea of how long it takes to remove that carbon emissions pulse, keeping in mind the first 50% is the part that gets sequestered within a few years of being emitted so going from 560 ppm to 280 ppm would be like going from 50% to 0% of the original emissions pulse, note that 1500 Gt of carbon emissions is likely to get us to about 630 ppm.
After about 1000 years atmospheric CO2 falls to 432 ppm if there are no future anthropogenic carbon emissions based on the Archer, 2005 paper (21.5% of the 1500 Gt of carbon emissions remains in the atmosphere after 1000 years.)
This has nothing to do with IPCC scenarios, just science.
Hi Fernando,
Thanks for the suggestion. The current estimate is inspired by IPCC statement that cumulative CO2 emissions is good predictor of future warming on a century time scale (assuming no massive geo-engineering/carbon sequestration programs over the second half of the century)
The predicted warming actually matches well the IPCC scenarios (in particular, it roughly correspond to RCP 4.5)
The IPCC is wrong. Their mental model works at this time by sheer accident. It has no science behind it.
LOL.
Wow quite convincing. 😉
Fernando, you were doing fine until you just couldn’t help yourself by saying this!
Given that co2 concentration increase can be a positive until a future point in time, then we have to understand if indeed it’s worth it to take the extraordinary measures proposed by the climate dogmatists.
I guess therefore we can call you what you are, A climate science denialist, right? Fair is fair. Your knowledge of climate science seems to be mostly outdated and fractally wrong! Especially when it comes to feedbacks and damaging consequences to ecosystems. I don’t suppose you know a heck of a lot about plant physiology and how changing climate skews optimal temperature ranges for the major crops on which humanity depend for food security, namely wheat, corn, and rice.
But let’s just stick to the climate science for now. I guess you probably consider the scientists at realclimate to be among those you call climate dogmatists but hey, you never know, you might actually learn a thing or two from people who are specialists in this field.
http://www.realclimate.org/index.php/archives/2017/06/why-global-emissions-must-peak-by-2020/
Why global emissions must peak by 2020
Filed under: Climate Science Greenhouse gases Solutions — stefan @ 2 June 2017
(by Stefan Rahmstorf and Anders Levermann)
In the landmark Paris Climate Agreement, the world’s nations have committed to “holding the increase in the global average temperature to well below 2 °C above pre-industrial levels and to pursue efforts to limit the temperature increase to 1.5 °C above pre-industrial levels”. This goal is deemed necessary to avoid incalculable risks to humanity, and it is feasible – but realistically only if global emissions peak by the year 2020 at the latest.
Let us first address the importance of remaining well below 2°C of global warming, and as close to 1.5°C as possible. The World Meteorological Organization climate report[i] for the past year has highlighted that global temperature and sea levels keep rising, reaching record highs once again in 2016. Global sea ice cover reached a record low, and mountain glaciers and the huge ice sheets in Greenland and Antarctica are on a trajectory of accelerating mass loss. More and more people are suffering from increasing and often unprecedented extreme weather events[ii], both in terms of casualties and financial losses. This is the situation after about 1°C global warming since the late 19th Century.
Granted it is just my personal opinion, but I think it is more than obvious based on what we already know and understand that it is indeed past time to take the extraordinary measures proposed by the so called climate dogmatists and we stop listening to petroleum engineers and oil companies for economic advice and what they tell us are or are not safe levels of atmospheric CO2. I guess I’m biased but I listen to the biologists instead!
Cheers!
I find a lot of glaring problems with the guest analysis, but since it is just a probable projection based on assumptions I won’t belabor the problems.
Two do stick out though.
He says that wind and solar energy growth will slow down. I think that just the opposite will occur. As it becomes obvious that fossil fuels are on the decline and nuclear is too slow, expensive and dangerous to provide more than backup, wind and solar power growth will climb very quickly. Also electrical demand will increase due to population growth and added EV’s (until they figure out how to build them correctly).
The tying of future temperature to historical CO2-temperature rise ignores the delay in the global system, increased radiation due to future cleaner air and the multitude of growing feedbacks.
I agree that future coal production is quite an unknown but given the human propensity to procrastinate and ignore coal could be the fallback energy source in the future. As power falls short of demand due to slow buildout of renewable sources, coal production could flourish until the renewables are brought on far enough and fast enough.
I also disagree that the electric power system will need large amounts of non-renewable backup in the future. The system will have been redesigned plus battery technology will be far in advance of current tech. There is such a huge potential for profit in power storage that it should grow quite rapidly.
The problem with future projections is that they depend upon the future world being mostly similar in operation. This is most likely not going to be true as global operations and local societies change to meet a rapidly changing world.
Hi Gone fishing,
I think that Minqi would like to be wrong. So far the energy transition seems to be progressing quite slowly. So I think it is understandable that he would be somewhat pessimistic that the optimistic scenarios that I produce are unbelievable (many concur with that view point and I agree they are on the optimistic side of realism, aka unrealistic 🙂 ).
As far as the very rudimentary climate analysis, it is based on the work of James Hansen and Minqi’s fossil fuel projection.
It is relatively mainstream climate science, which I realize you believe is much too optimistic.
We will need to try to remove carbon dioxide from the air (beyond the natural carbon cycle). One possible method (beyond planting trees) would be to use cement that absorbs CO2 as it is produced (so called “green cement”).
A better approach (far less costly in the long run) is to transition to non-fossil fuel energy as rapidly as possible.
Unfortunately there are many who do not agree.
Dennis, yes, I would like to be wrong
From the climate perspective, even your plan to build 20,000 GW of wind/solar by 2050 may not be enough
Hi Minqi,
Yes, more is needed such as replacing the personal vehicle fleet with EVs, electrifying the train network, better housing stock (improving energy efficiency), basically trying to eliminate fossil fuel use by 2050 and that might get us close to 2 C, beyond that we could try to sequester more carbon with better farming practices (more environmentally friendly), plant trees, burn trash and biofuels with carbon capture, green cement, and reduce population growth.
And it may still not be enough for the reasons Gone Fishing gives, but try we must.
Dennis—
You are a techno narcissist (in a good way)—-
I never thought of using excess energy to fight against energy loss in H2 production.
It would still be a loss, but a loss put to use.
Hydrogen has some fundamental issues when it comes to widespread use: it can permeate through what would normally be considered safe seals (e.g. a fairly normal weld), it needs special materials to avoid embrittlement of steel, it has very wide explosive and flammability limits, and being diatomic it gets very hot when compressed (i.e. wasting a lot of the energy of compression), and it needs speciality compressors because it leaks so easily. Ammonia, methane or methanol might be better, they have their own issues but might be easier to solve than for H2.
Hi George,
Great comment, I am far from expert on these things, can those other things be used in fuel cells (I am thinking more for stationary backup purposes rather than in cars.)
They can be used but would have to be converted (reformed) back to H2 first, so direct combined cycle turbines would likely be more efficient. Of course fuel cells have their own issues – most use platinum which I think is at or past peak production from the currently available sources (might be load in Greenland though – I can’t remember exactly – see below from Geochemical Perspectives Vol 3, No 2). Others use molten salt, which just doesn’t sound a great idea to me, or even more exotic and rarer catalysts.
Yes, but this can be handled.
You can buy hydrogen in steel bottles for welding – so it can be handled.
Town gas from coal was about 50% hydrogen in the early 1900 years. The problem of synthesizing methane is getting the “C”, if you don’t have a coal plant in the neighbourhood it’s difficult to get out of thin air.
It still leaks—
Hydrogen is rarely there in storage in a matter of weeks.
Dimethyl ether (DME) – handles like propane. Lower energy density due to the oxygen atom but you get perfect combustion.
I think my comment could only be read to say that all the methods have issues, and the question is which are easiest to overcome, so what exactly is your comment adding except to forward whatever agenda you’ve already decided on?
Sorry – that should have been against Eulenspiegel above. I wanted to include DME but couldn’t remember the acronym, I think BP are working on it as a GTL option.
” Ammonia, methane or methanol might be better, they have their own issues but might be easier to solve than for H2.”
Yep. And as chemist I would add liquid organic hydrogen carrier as alternative.
Thanks everyone.
So fuel cells might not be the best route, probably excess wind and solar power could be used to produce synthetic fuel of some sort (whichever the chemists and chemical engineers think would work best from a practical point of view) that could be burned in a “natural gas” style power plant for backup power when needed and could use carbon capture and storage to keep emissions low. It might be cheaper to just use natural gas with carbon capture and storage or eventually coal with carbon capture and storage for backup of wind, solar, hydro, geothermal and nuclear power.
Yes, indeed. Some thoughts:
First, it’s clear that there are viable, affordable ways to “back up” renewables, with only today’s technology. There are lots of candidates that would work, and underground storage is very cheap for stationary applications, so handling seasonal backup is very doable.
2nd, the point at which we approach a 100% non-FF grid is pretty far off, so detailed speculation is pretty idle. But, it’s pretty clear that solutions will only get cheaper and more effective with time.
3rd, I suspect non-carbon fuels will be easier for stationary applications: pure H2, or NH3 (ammonia), or something else that doesn’t require capturing and recycling carbon.
Hi Nick,
Yes the ammonia might make more sense as storage of hydrogen might be more of an issue than ammonia. Avoiding the need for carbon capture is definitely a plus.
Fuel cells may never make economic sense for stationary applications.
I assume you don’t write somebody else’s opinion. I disagree with you.
Yesterday, while driving down College Ave in Berkeley I found myself behind two big vehicles. One a Nat Gas fueled garbage truck, and the second a fullsize Bus- Fuel Cell running on Hydrogen.
This ain’t Philadelphia, but they can make that choice too.
Both then were running natural gas, as most H2 is generated by reforming
In the future, excess power on windy and sunny days that is above demand could be used to produce hydrogen to power fuel cells for power backup during low wind and low sun periods. If batteries are cheaper, or pumped hydro is cheaper, or vehicle to grid is cheaper then perhaps fuel cells will not be used, this will depend on the development of future technology which is difficult to predict.
Eventually the extraction of fossil fuel will become very expensive relative to wind, solar, hydro, geothermal, and nuclear power and very little of it will be used as an energy resource after 2060.
Dennis,
In the future, if oil/gas/coal production will be cut back, it is possible that their marginal product cost (and therefore their prices) can be kept at relatively low level
This is likely to be the case if peak oil/gas/coal will happen because of growing competition from wind/solar (rather than hard resource constraints). In that case, only those fossil fuels that can stay competitive will be produced.
I am not ruling out hard resource constraints. But it will be some years before we find out what will actually bring about peak oil/gas/coal.
Separately, a Chinese EV car producer claims that EV will account for more than 20% of Chinese new car sales by 2025. If that’s the case, conventional cars may still dominate the world car STOCK up to 2050
I think the Chinese EV producer assumes oil will be plentiful and oil prices will be low.
As EVs become more ubiquitous there advantages will become clear.
ICEVs will sell as well as horse and buggies in 1945. (Not very well). This will be the case by 2035, people will drive the old ICEVs that are still around, but sales of new ICEV for personal transportation will be very low.
Maybe 20% of total personal vehicle sales, tops.
Oh I noticed they said more than 20% of new car sales by 2025, so that is a minimum, maybe they believe the high end is 50%. 🙂
On low oil prices, some of the lowest marginal cost output comes from Middle East OPEC and they can only keep their budgets from blowing up at higher oil prices, maybe $50/b in 2016$.
Prices first will go up as supplies become constrained then the marginal cost of transport (MCT) using electricity will fall below MCT using oil, nobody will want oil at its marginal cost of production, less oil produced will mean less natural gas produced as well which may keep natural gas in short supply with prices high.
A lot of fossil fuel will become a stranded asset with no buyers by 2040, hopefully all of it by 2050.
True (re-H2 coming from Nat Gas), and as I understand it, the process of of creating H2 is not inexpensive, or thermodynamically trivial.
Hydrogen (produced by steam reformation) costs about three times that of natural gas per unit of energy produced. Also, when hydrogen is extracted from natural gas, it produces carbon emissions, which is exactly what we’re trying to avoid by using hydrogen in the first place. What does thermodynamically trivial mean?
Means it has a very high EROEI.
If you get a high output, like from early oil, far exceeding your energy inputs, then the cost is thermodynamically trivial.
Hydrogen, quite the opposite. It is an energy sink, where large amounts of energy are used to transform physical things into a different state. There may be advantages to the different state, or storage medium, but the thermodynamic costs, your losses, are not trivial. Probably more like a death knell to lose two thirds of what you start with.
Jim
It all depends on the cost of your input energy.
At some point it’s likely that we’ll have a large surplus of wind and solar energy for a large percentage of time. If, for instance, we overbuild wind and solar by a factor of 2x, then we’ll have very large surpluses about 80% of the time (with roughly equality about 10% of the time, and shortages from wind/solar for about 5-10% of the time).
So, 80% of the time electricity will be very cheap – perhaps 2 cents per kWh or less. At that point electrolyzing water and storing H2 underground becomes very cheap, and very cost effective for handling seasonal power shortages, which as noted above might happen 5-10% of the time.
Cost has very little to do with it.
It is all about energy return.
The actual cells that the hydrogen energy is stored in can store only a small amount of power. This makes the process of maintaining reliable power sources with the use of hydrogen fuel cells very unlikely.
I’m talking about underground storage, and I’m not assuming the use of fuel cells.
Fuel cells are efficient, but capital intensive. For seasonal storage of very low priced hydrogen, what is needed is something that is cheap per unit of power, and even cheaper per unit of energy stored – efficiency isn’t important.
So, you want very cheap generators. This is similar to the minimum-cost solution for NG peaker plants, which don’t use combined cycles – they use cheap and inefficient single cycle plant.
And hydrogen is an energy carrier – not a source of energy. …
Fossil fuels are still needed:
“In order to separate the atoms of the hydrogen and oxygen and actually generate hydrogen fuel, fossil fuels are needed. This completely defeats the purpose of an alternative energy source. If we ran out of fossil fuels we would no longer be able to produce hydrogen energy.”
Hi Hightrekker,
The use of hydrogen would be as a storage medium.
Imagine a world where all electric power is supplied by an extensive widely dispersed wind and solar power system built to about 3 times average load. At times these facilities would produce more power than required and either the extra power would be sent to ground or it would be utilized to store the excess energy.
There are multiple things that could be done, battery storage, pumped hydro, or producing a fuel that could be used in fuel cells. An alternative would be to produce ice or hot water to be stored for near term heating or cooling.
Whichever option is cheapest should be used.
Perhaps fuel cells would be the most expensive (including both internal and external costs) option, in which case it would not be used.
Instead of fuel cells, you can use the nowaday natural gas energy plants. There are experiments to burn pure hydrogen in them, by mixing in water steam to prevent a turbin burnout.
You’ll get only 60% utility rating with it – but it’s here and it works now and is cheap and scaleable.
As a transition technology you can mix natural gas with hydrogen, 10% is no problem.
None of these seem to scale right now, except pumped hydro, and most of the good spots are gone.
Battery technology has not scaled since the Japanese commercialized lithium ion in the early 1990’s.
I would not hold your breath.
Hi Hightrekker,
In a grid built out as I propose, about 1% of average load would need to be provided by backup (which could be hydro or nuclear) or vehicle to grid or batteries or fuel cells or some combination of those four. The battery technology need not be sophisticated, it could be lead acid as the application will be stationary rather than mobile.
In 2016, hydro produced 4023 TWhr, about 16% of total load hours (24,816 TWhr according to BP Stats), so hydro could be the backup, or existing nuclear which currently produces 10% (2616 TWhr) of total load hours.
These scale just fine to backup wind and solar built out to a capacity of 3 times average load.
So where do we find the hydrogen gas reservoir? Jupiter?
From the Wall Street Journal. “The end of car ownership.” Lots of potential business models mentioned in the article. The best article on the topic that I have seen. Published on June 20.
https://www.wsj.com/articles/the-end-of-car-ownership-1498011001?mod=e2fb
I think that the end of home ownership will come first. Owning a home is expensive and very restrictive. If you lose your job, or voluntarily change jobs, you are screwed. The Air B&B model will dominate. If you take a job someplace, you will rent a house nearby. If you want to, or have to, change jobs you just cancel the lease and enter into a new lease near wherever the new job is. If you start a family, and you want to move to a better school district, just cancel the lease and rent a house in the preferred school district. Get divorced – no problem! Cancel the lease and each can rent in a new area that they want. Mobility, and especially job mobility, is the key to the future. Home ownership is just too restrictive to tolerate in today’s society.
Millions of investors will want to invest in housing in order to cater to the desires of the consumer. Think of it. You and your friends have a favorite golf course in the area. You can all just rent places nearby in order to be more efficient and reduce the cost/time of getting to the course. And, if another course is built that you like better, you can all just cancel your leases and move close to it. This is a no brainer. Your son and daughter-in-law and your only grandchildren, move across the country. No problem. Just cancel your lease, and rent a house close to them.
Why would landlords tolerate such easy cancellation?
What has changed to make home rentals more attractive?
Car sharing works because cars are on average only 5% utilized: about 1 hour per day, and smart phones have made it easy to access that underutilized resource. On the other hand, housing is 95% utilized: almost every home has someone sleeping in it every night.
Nick – attempted satire. Done because I just do not think that car sharing will work all that well.
Casr sharing is currently working. It works well among people who don’t need a car often enough to own one, for people who need a second vehicle on occasion, and, in terms of getting rides, for people not capable of driving themselves.
As the baby boomer generation ages, we will see more transportation services. That’s a big demographic.
I assume that you are right since I have no idea what “Casr” is [LOL].
However, I live in a city adjacent to Oklahoma City. Over 1 million people in the area. I keep reasonably current with most of the news. If my wife wanted a “shared” car every Monday from 10 am to 6 pm to run weekly errands, how does she get it? Does someone park it out front with the keys in it? How, does she “return” it and to who? [Hopefully, she just parks it out front, or it will not work.] I figure that you can give me the places I should check with, since it is “currently working,” and I have no clue.
I totally agree with your last statement – however, there is a caveat. Many of those [pretty soon, probably including me] are handicapped in some fashion. So they need the driver’s assistance, along with the ride (which, can include wheelchair service, etc). There are already numerous companies in large metro areas that offer those services – so it is a kind of car sharing. But, I am assuming that your car sharing is something beyond such transportation, and taxis, and rent cars.
I keep reasonably current with most of the news. If my wife wanted a “shared” car every Monday from 10 am to 6 pm to run weekly errands, how does she get it? Does someone park it out front with the keys in it? How, does she “return” it and to who? [Hopefully, she just parks it out front, or it will not work.] I figure that you can give me the places I should check with, since it is “currently working,” and I have no clue.
Yeah, we all know you are clueless but it is obvious that you are lying when you claim you are keeping reasonably current with most of the news. At the very least you should make an attempt, however feeble to learn how to use Google and your smartphone. Or did you buy one of those stupidphones to go with your handle?
What you describe already exists and sounds pretty much like Skurt’s business model, to name at least one company that does exactly what you wish for and there are certainly others, you do realize this is almost the 3rd decade of the 21st century, right?!
https://www.skurt.com/
Book a car using our app
Download our app and book a car when you need it. No lines or paperwork.
We deliver it to you
A driver will bring it right to you anywhere, on-demand.
What happens to the driver?
They magically disappear.
When you’re done using it
A driver will come and pick it up. It’s really that easy.
Then again maybe you are just typical of the cavemen who live under some rock in backwaters like Oklahoma where people are still trying to stay firmly in the 20th century!
BTW, ‘Casrs’ are what people who say ‘Covfefe’ ride in, I figured at the very least you’d know that much, eh?
Obligatory Disclaimer: I do not receive commissions from Skurt! Just used them as an example of the kinds of businesses that are sprouting up all over the world outside of Oklahoma…
Car sharing is pretty much an extension of transportation modes we already have: car rentals, taxis, public transportation, and even leasing. All of those models work.
There are actual car sharing companies. I live a couple of blocks from a car share spot. The car has a permanent spot in married student housing at the university. What usually happens in that people who use the service get entry access digitally, reserve the car for a certain period of time, and have the fee billed to the credit card they have on file.
I’ll put up some links to car share companies.
When it becomes both cheaper and more convenient to use a vehicle on a as-needed basis than to own it, many people will switch.
What is CarSharing? | eGo CarShare: “CarSharing is a type of car rental designed to be convenient for people who want to use cars for relatively short periods of times (as little as 15 minutes, usually a few hours, up to multiple days) and only pay for their usage (your costs depend on how long you have a car and miles driven). CarSharing is also practical because it allows you to access vehicles conveniently located within your neighborhood at any hour of the day, not just business hours. We have cars located throughout neighborhoods and business districts of Boulder, Denver and Longmont – you pick up at and return your car to its specific (designated) parking location.”
I like Zipcar a lot. I used it extensively, and then…Uber arrived, and suddenly inconvenient and slow taxis were replaced by fast, convenient and cheap Uber drivers. I haven’t really used Zipcar since.
I still have my 14 year old ICE vehicle. It’s sometimes necessary, and it’s really cheap to own, so I keep it, but I only drive it about 800 miles per year (not nearly enough to justify a new EV – my main vehicle is a chauffeured EV which most people refer to as a “train”).
When autonomous urban vehicles arrive, I expect services like Zipcar and Uber will become identical: both will dispatch similar vehicles from similar local pools.
Denver Metro Car Sharing and Hourly Car Rental- Enterprise CarShare: Denver Metro
Join now for $1!*
With cars located throughout Downtown, Uptown, and Capitol Hill, Enterprise CarShare is perfect for running errands across town or heading up to the mountains for a day. Signing up today allows you to take advantage of all the freedoms of a car, without the costs of owning one, for low hourly and daily rates.
Where to park | car2go Denver: car2go offers you ultimate parking freedom. To end your rental, simply park your car2go on public, on-street parking within the Denver Home Area. The best part? It costs you nothing.
Car Sharing from Zipcar: How Does Car Sharing Work?
Another car-sharing service debuts in Denver – Denver Business Journal: Maven customers use a smartphone app to search for and reserve a car by location and type; they also unlock the car with their phone.
Rental fees include gas and insurance. A gas card is provided with the car, and customers are asked to return the vehicle with at least a quarter-tank of fuel or face an additional charge.
Cars are dropped off at the initial pickup location.
Tour | Getaround: Choice
Choose from 1000’s of cool cars shared by great people in your neighborhood. Convenient hourly and daily rentals.
This is the last link I’ll post. I posted links to five different companies providing car sharing in Denver and I know that isn’t a comprehensive list.
Denver Transportation, Part One: Car and Ride Sharing: “George Ferris and his wife moved from Oklahoma City to Denver’s Capitol Hill almost three years ago. Naturally, they brought their two cars with them because, in Oklahoma City, ‘everything is 100 miles apart.’
But soon after unpacking and settling in, Ferris discovered that short trips were far easier and cheaper to accomplish through Denver’s B-cycle bike-sharing program. As a result, their two cars sat largely unused. What to do? …
‘We sold both of our cars and converted over,’ Ferris says. ‘I don’t think I’ll ever get a car again.’”
Another factor which may reduce the need for car ownership is having everything, including groceries, ordered online and delivered to your door. Both Amazon and Walmart see a future in this.
This is for those who know nothing about car sharing.
A brief history of car sharing | News | The City of Portland, Oregon: “It’s estimated that 600 cities around the world support successful car sharing operations. In Germany alone, car sharing operates in over 150 cities and some European operations, like Mobility CarSharing in Switzerland, have more than 30,000 members. About 30 independent car share companies operate in the United States.”
Also, here’s another bit of background for those who don’t understand car sharing.
It’s basically a car rental program. This is how it differs from more traditional car rental companies.
1. You can rent by the hour rather than by the day.
2. Pick up and drop off locations are located in a variety of neighborhoods, not at central rental offices.
3. You have access to the car without signing papers at a location. Once you are in the system and have reserved the car online, you can go and pick it up without having someone in an office hand over the keys.
4. There is usually some form of membership (even if you pay nothing to join), so that you and your payment method are in the system.
5. Most car sharing models involve a company or non-profit owning the vehicles, but there are also companies that let individuals rent out their cars.
Car rental companies have long dealt with a variety of people renting their vehicles. Car sharing is no different. The idea that multiple people will drive the same vehicle is no more of a problem with car sharing companies than it is with any company that rents something out on an hourly, daily, or weekly basis.
Business models continue to develop around the concept that not everyone needs to own a car in order to have access to transportation on an as-needed basis. If you don’t own a car, you don’t have to pay for car insurance, ownership fees, parking/storage, maintenance, etc. If your lifestyle is such that you get many places by bike, walking, public transportation, or taxi, then you may find that intermittent access to a vehicle is cheaper than owning one.
I would give easy cancellation if somebody rents my house in Denton for $2000 a month and gives me a three month deposit i can keep if they stay less than 9 months.
Looks as though both Whiting Petroleum and Chesepeake are in some trouble. Whiting may have to reduce capex for the year revealing the large declines. The Kodiak acquisition of a couple years ago proving a collasal mistake. Production about flat but with $2.5B more debt.
Yup.
Whiting is shaping up more and more as a potential take over target as they possess a ton of good acreage in both Colorado and North Dakota. Their acquired debt is killing them.
Chesapeake is more likely to sell off some more of their vast leaseholdings.
At the peak of the go go years under McClendon, Chesapeake held mineral rights for near half the country, it seemed.
Got a link to some data or commentary? It looks like Whiting Bakken production is still in decline, and comes mostly from Mountrail, which was the first to be developed and maybe the first to be exhausted. They increased CAPEX in 2017, with a straight statement that they were betting on higher oil prices, they also seem to have some supply commitments, so they may have had no choice (anybody know about how this works?)
Chart below from Enno Peter’s.
Mr. Kaplan
Whiting also has outstanding acreage in McKenzie county. In fact, the Twin Valley field – although tiny (’bout 8 townships) – is the most productive spot in the Bakken and is almost exclusively owned by them.
When large pipelines (oil) are contemplated, it is customary for the builders to have an ‘open season’ period to try to line up suppliers who are then given somewhat preferential pricing based upon amount and timing of contractually offered supply.
Edit … Twin Valley is about 8 sections (1 square mile each), not 8 townships (36 sq. mi. each).
When they bought Kodiak, every company in the world passed on it except them. WLL will not get bought out in my opinion unless it is by another shalie that will hype their worthless acreage. WLL has drilled out most of their good acreage and buried in debt.
CHK doesn’t have anything much left of any value to sell except their marcellus which they have tried forever to sell but have failed. They can’t really sell that anyways because their production would disappear. They wouldn’t keep up the mirage that they are a real company. They are hoping that they will be able to pay off the debt with new production from unproven plays. I would bet against that happening. They are also getting sued left and right for screwing royalty holders. One big judgement and look out. Maybe they do more financial engineering screwing bondholders some more. They are praying for higher NG by 2019, otherwise it could be over for them. CHK continues to outspend cash inflows by hundreds of millions. With costs going up they will lose even more money.
Neither CHK or WLL are investable in my opinion.
One more thing, with regard to asset sales for the shalies, you should read up on “chasing the balance”. Asset sales won’t help these two.
Spot on, John; that’s always been one of the escape plans for the shale industry: they’ll sell out and be fine; you know, pay all that debt back. Right. As an operator, and pretty keen on economic analysis necessary to operate and actually eat, given the high grading those guys are doing, at least shale oil, the well communication, the GOR and increasing water, the remaining, realistic UR from 75% of those wells and the unbelievable costs to P&A and decommission all those locations, to their original leasehold state… you could not give that stuff to me.
Apparently I am not the only one that thinks that. In the Eagle Ford there have been countless, enormous unpublicized production sales on the market for years, by significant players, with no offers whatsoever. The PUD value of flank acreage has no value anymore.
CHK had to pay someone to take their 65,000 BOE/day (I’ve read your comments on BOE) of Barnett shale production from them. I’ve been laughing at news reports of Elliot Capital Management pushing BHP to sell their shale assets which it bought in the acquisition of Petrohawk. That Petrohawk acreage/production is probably worth less than zero.
Hi Mike,
Would your estimate be that David Hughes was too optimistic in his assessment of the Eagle Ford in Drilling Deeper?
http://www.postcarbon.org/publications/drillingdeeper/
He estimates about 36,000 potential total wells drilled (oil and natural gas).
In Figure 2-52 on page 90 of that report he estimates 7.8 billion barrels of C+C will be produced by 2040.
My scenario uses an average well EUR of 250 kb of C+C and assumes about 34,000 total wells are completed (12,100 by Dec 2016) with economically recoverable resources of 7 Gb. About 2.1 Gb of C+C have been produced from the Eagle Ford play by the end of 2016.
My guess is that you would think this scenario is much too optimistic (relatively high oil prices by 2024 are assumed, about $100/b Brent price in 2015 $).
Dennis, I am a fan of David’s. The bottom end of the volatile oil window in the Eagle Ford, for instance Karnes County and parts of DeWitt, have been hammered and the no vacancy sign is out. Well communication now is a big deal. If there are 35,000 wells left to be drilled in the EF, they will be off the sweet spots and less productive, IMO, so 250K BO UR seems very high to me
2.1G BO so far, from 19,000 wells; 7.0G BO left? No way. Amazing, isn’t it, that one of the top three producing shale basins in America might be good for only 1 1/2 years of total US C+C consumption?
John Keller is right again; there is a big proxy-chicken fight at BHP to get rid of all the EF stuff it bought. Its not been good for them, not by a long shot.
Hi Mike,
The total left is 5 Gb (7 Gb includes the 2 Gb already produced). I only have 12,000 oil wells drilled so far in my model and I just remembered the condensate (as it is reported by the RRC) comes from Gas wells, so the EUR (oil only) is 200 kb not 250 kb (the 50 kboe was an approximation based on about 20% of Eagle Ford output being condensate from gas wells).
In any case about 21,800 wells left to be drilled in my model and I also assume the average new well EUR decreases from
200 kb in Dec 2017 to 135 kb in Dec 2023 and to 103 kb by July 2028 when the last well is completed due to low profitability.
I always make a guess at EUR decrease due to moving out of the core areas as the become saturated with wells.
As always a professional like you would make a far better estimate than me.
Thanks for the input. Helps me every time.
One last thing, my guess on EUR decrease (falling well productivity) is based on the assumption that the total number of wells is close to David Hughes’ estimate and I first create a model using that number of wells, the I adjust how fast EUR decreases so that the TRR is close to David Hughes estimate. So I am glad you are a fan of David Hughes’ work as it is the basis for my estimate for decreasing well productivity.
After I do that I use the economics based on my assumed prices, well cost, royalties and taxes, operating cost and a 10% discount rate to find the net present value of future output for each well. The rate that the productivity decreases depends on the number of wells drilled so if the wells are unprofitable the number of wells drilled and completed decreases until profitability is reached. The price assumptions (and other economic assumptions) result in fewer wells (about 2000 less) than in Hughes analysis and lower total oil produced (7 Gb vs 7.8 Gb).
Hi Mike,
I made a mistake on the David Hughes “Drilling Deeper” piece. He has about 36,000 wells in the Eagle Ford but a fair portion of this is gas wells, so I reduced the number of oil wells to 25,000 based on the proportion of gas to oil wells on schedule in June 2017 in the Eagle Ford.
Even with no decrease in well productivity, this number of wells completed results in about a 6 Gb URR, based on my well profile for the average Eagle ford oil well.
I assume there will be some decrease in well productivity (I make an arbitrary assumption essentially) the EUR decreases to 98 kb (from 200 kb in 2017) by July 2026 when the last well in my scenario is completed.
Total URR 2009-2040 is about 5.7 Gb with 25,000 total oil wells completed (about 14,000 wells after 2016). This is probably more realistic under the given assumptions
$6.5 million well cost, royalties and taxes 32%, $12/b LOE and transport cost, 10% annual discount rate, and $2000/month downhole maintenance and the price assumptions shown on the chart. The average well does not have a positive NPV until March 2019, but I assume wells are added at a low rate until Jan 2019.
In Eagle Ford economics I would use 27% RI and tax deductions. There is now about a $2-3 marketing deduct to NYMEX WTI and hedges are now set to drop off, big time. LOE’s could indeed be as high as $10-12. H2S is increasing with depletion in many areas and the older those wells get the more intervention they seem to need. Produced water costs can be as high as $2.50 per incremental BW. G&A cannot be left out of the equation as that is the cost of doing business and each well bares that cost, say $3. As legacy wells decline they still carry the burden of debt that new wells must cover, in addition to the cost of financing those new wells where applicable. Interest expense is an ugly reality that cannot be ignored, say $4-5 per incremental BO.
I hope that helps.
Mike-
From your experience, as you step out from the sweet spot, is the drop off in oil recoveries per well gradual or more dramatic. It looks like Dennis is modeling a gradual and linear decrease in EURs as the drilling moves out. But is there the possibility of a more massive drop off in recoveries as you move away from the better spots where EURs move down in a more stair step fashion. So, what we might actually see is flatlining EURs from new wells but just fewer wells drilled, assuming people act rationally which obviously has not been the case to date.
Hi Mike,
I should not have called it LOE, it essentially is intended to include OPEX, G&A, interest, water disposal, etc., I am assuming taxes are 7.5 %, so with your RI of 27% that would be 34.5% royalties plus taxes.
I have also left natural gas sales from the oil wells out of the economic analysis. These would offset some of the other expenses.
Yes your comment helps, thanks.
Dennis, weighted RI burdens across the EF trend are generally only 20% and yes, oil severance taxes are 4.6% in Texas and property taxes tend to be about 2.5% of total revenue. There are a lot of OPEX costs associated with high BTU gas; you will please recall Rune Likvern pretty much suggests gas is a negative component in the revenue stream.
The BS about PDX downhole is ridiculous; it has a market cap of $28B and it’s claims to free cash flow for 1Q17, the first quarter in several years, is based on non-GAPP piddly BS that, if true, and its not, would otherwise get its shareholders right in about 100 years. Some of those idiots are using a Citi induced oil price deck of $80 dollars in their 2018-2019 projections. A loss is a loss and some funky arithmetic for one quarter does not erase numerous losses in the past. Some of the stuff said around here makes me want to go rinse off in the shower.
John Keller has a point regarding DCA in flank areas, off sweet spots; unfortunately in the Eagle Ford that is very evident. I am personally, painfully aware of that. I don’t know how to predict that but he has a good point regarding future recovery rates from 2nd tier shale.
http://m.chron.com/business/energy/article/The-party-is-over-for-investors-in-U-S-shale-11242266.php
Hi Mike,
On natural gas I am confused.
If we only consider the oil wells drilled in the Eagle Ford and ignore the gas wells, wouldn’t the sales of associated gas be extra revenue for the owner of the oil well?
I have ignored this natural gas in my analysis, but it is not clear how it would negatively impact total revenue.
I suppose the total to collect and transport the natural gas could be less than the price of the natural gas, but I am assuming all of the well’s capital cost and OPEX, G&A, etc are deducted from the oil revenue.
Thanks for the correction on RI plus taxes.
So it should be 27% not 32%, I misread.
Should it be 27% for the Permian also or is the RI 25% there?
Hi George.
A few things to keep an eye on.
1. The Western Isles FPSO is due for tow out in to the North Sea on 27th June.
2. The first test well drilled in the HRZ shale on the north slope Alaska was fractured last week and is now flowing back on clean up from the first stage. (It is a 2 stage vertical well completed in the upper and lower HRZ)
3. UK oil and gas have just completed core sampling and reports oil Seeps from Kimmeridge Limestone Core Samples at Broadford Bridge-1 Kimmeridge Exploration Well, PEDL234 Licence, Weald Basin,
It’ll be interesting to see how the Western Isles project start-up goes. I think it’s about 3 years late (drilling campaign was completed in early 2015 – hopefully all the wells and subsea kit are functioning) and parts had to be rebuilt because of issues with material selection and/or fabrication problems at the shipyard. The reserves aren’t big – they might be relying on future discoveries or tie-backs to make the economics positive. It might have cost more than one of the company officers their jobs already.
I saw this on Energy Matters today:
http://euanmearns.com/the-quest-for-100-renewables-can-curtailment-replace-storage/#more-18666
It seems to me the article makes a pretty convincing case that 100% renewable electricity will be very difficult to achieve even with very large scale curtailment(overbuilding)+storage
Also addressing this issue is a good article from the energy institute at Stanford-
https://energy.stanford.edu/from-directors/path-deep-decarbonization-avoiding-solar-wall
note -thanks to someone from last week posting this article ?Hightrekker
Yep
The obvious solution is not discussed: Transmission lines between areas with not correlated wind.
Take a map and a ruler: locations whith a distance of about 1500 km usually generate electrcity in a uncorrelated manner.
For Europe these basic discussions were done around 2005-2010 (e.g. the dissertations of Gregor Czisch or Matthias Pöppel, both in German).
And the huge off-shore wind potentail with CFs of 50% requires only moderate overbuilding and transmission line capacity.
Planet For Rent or Flip
Like so-called government, which I call a social technology, all sufficiently complex and/or complicated so-called technology is what I might call ‘rental’ technology, meaning that we don’t really derive, own or control it. Because I am also including so-called government-as-technology, then this also includes limited ownership and sense of belonging over our locales, communities, and lives in general.
That said, are we more likely to take greater care in general of what we own or feel we have some sense of belonging to, or of what we merely rent from someone else? If the answer is the former, which I think is far more likely, how might this create erosive and toxic effects on our realities and especially over time and increased scale and numbers?
Maybe we already know and are already seeing and talking about it– social unrest? climate change? poverty? prime? ecocide? resource squandering? war?– while many of us continue, despite ourselves, despite when we should damn well know better, to accept and/or promote ‘rental’ technology.
Earth is not a private planet for some elite.
We currently have a bunch of elite’s fighting over the dregs in the bottom of the barrel, playing last man standing.
Let’s all continue to gather in unison and continue to prop those elites up so that they can maintain their admirable quest.
Dreg-a-licious.
Hi Ulenspiegel,
Another potential solution is to build transmission lines north to south so for solar power, excess in summer can be sent North or South. Potentially some nuclear will be needed if there is not enough hydro for backup and batteries, vehicle to grid, and/or fuel cells are too expensive.
I expect it may be difficult to accomplish 100% renewable energy, but perhaps not impossible, I think 99% is pretty likely.
“Another potential solution is to build transmission lines north to south so for solar power, excess in summer can be sent North or South.”
In Europe this is a no brainer as it would also connect vast hydro reservoirs to central Europe, the reduction of excess PV generation is a nice by-product. 🙂
Hi Ulenspiegel,
There is a pretty big solar resource just south of Europe, but political stability is a potential problem.
We already import 75% of our primary energy, half of that from “interesting” countries.
I would simply allow import, but backup capacity should not be delivered by these countries.
So who would be nutty enough to lay lines across North Africa?
Hi Fernando,
I agree it would be a problem. Maybe Tunisia or Morocco and then feed to Spain or Italy, those nations could lay the lines and place PV installations in their southern regions, they could export any excess to Europe, but generally I agree it is not likely in the near term (before 2030), if fossil fuels become expensive enough as they deplete and as people start to understand climate science, there may be some who think the risk is worth it.
This may be clearer in 2030 than in 2017.
Morocco has an Allawite King. That’s a setup similar to the one the French designed in Syria. I was just having lunch with a lady who is the daughter of a Spanish diplomat, born over there. Says the long term stability is unlikely, we should expect a flood of refugees within the next 20 years.
“So who would be nutty enough to lay lines across North Africa?”
We already get a lot of NG from there. As long as back up is not liked to these countries it is a simple economic issue which will be interesting in 20 years.
The no brainer is of course to build morer transmission line to Scandinavia.
Hi Minqi,
The optimal solution is 300% of average load for wind and solar capacity, rather than the 200% used by Roger Andrews.
Another glaring problem with the analysis us that Europe is widely interconnected by a continent wide power grid. A proper analysis would take the four countries he analyzed together, the more widely the resources are spread out the fewer times demand is not met by wind and solar and backup needs are reduced. In addition hydro can be used as backup, which is ignored in the analysis.
So the post is not convincing at all from my perspective.
Mr Andrews analysis of Texas makes the mistake of assuming that Texas is not connected to other grid networks in the US, there are DC ties between Texas and the Eastern Power Grid, which is connected to the Western Power Grid.
Power can be imported and exported through these DC grid ties.
Again he uses too low a number for wind and solar, it may be that the optimal solution is not 50% wind and 50% solar, due to the deficit in most summer months, a better option might be 60% solar and 40% wind, past weather data (maybe 10 years) and a simulation run on that data might give an optimal solution, but typically we would expect 3 times average load would get us close to an optimal solution. Texas can also trade about 220 MW of power through a DC tie with the eastern power grid, so the Texas grid is not completely isolated. Eventually Tres Amigas will finally be completed which will allow 20 GW of power to be traded between the three major US Grids.
After further reading of Roger Andrews’s two articles and the discussions, it seems the most practical/economic approach is to simply build wind/solar up to approximately 100% average demand (the capacity probably needs to be five times as large)
In small countries that have access to large pumped storage capacity (like Denmark/Norway), the surplus can be stored to cover the deficit
For most countries, most of the surplus will have to be curtailed (about 10-15%) and the deficit can be covered by fossil fuels or biogas backup.
It seems using this approach we can get 80%+ wind/solar penetration without too much technical difficulty
If we can get 80% decarbonization in the electricity sector (or 90% if we include nuclear/hydro), then the remaining questions are how to decarbonize residential/industrial heating, about 1/3 of transportation (sea, air, freight on road), chemical industries
Decarbonization of the last two (perhaps 20% of emissions) may be difficult or impossible
Decarbonization of residential/industrial heating should be technically possible. But it probably won’t make economic sense to use wind/solar electricity to do heating. Some residential heating/cooling may be done by solar directly. But residential winter heating and industrial high temperature heating may still depend on fossil fuels (although the energy needed may be reduced by efficiency technologies; but on the other hand may continue to increase because of the Third World industrialization/urbanization).
“In small countries that have access to large pumped storage capacity (like Denmark/Norway), the surplus can be stored to cover the deficit. Denmark? Have you ever been there? The country has only three hydropower plants, powering 3000 homes, accounting for less than 0.1% of its total electricity production. Norway? There’s not really much interest in pumped storage for environmental reasons.
Hi Doug,
Where reservoirs already exist, excess wind and solar power could be used for pumping form the bottom to the top of the dam. The hydro can be saved to use as backup, unless the reservoir gets too full.
Only a partial solution and possibly not a great one from an ecological perspective, but it needs to be weighed against the alternatives (nuclear power, more carbon emissions), certainly reducing energy usage is the best first step.
Hi Minqi,
I doubt 5 times average load would be needed as long as wind and solar are placed in the best areas with the highest resource. I think 3 to 4 times will be enough. Many high heat processes can use electric arc furnaces, space and water heating can be done with heat pumps, air travel a combination of electric and biofuel, ships can use wind and/or nuclear, land freight can use electrified rail and EV trucks/ combined with overhead wires on main local roads for trucks and buses.
Yes it will be a challenge and will take some time, probably until 2070 to 2080 to eliminate all use of fossil fuels as a fuel source. They might continue to be used as inputs to some processes where substitution is not possible.
I think Minqi was referring to wind/solar energy output equal to 100% of average demand, and *capacity* equal to 5x average demand.
I don’t think he’s really accepted the value of overbuilding, let alone other solutions such as “wind-gas”, long distance transmission, DSM, etc., etc., etc.
Unfortunately, he’s been listening to Euan Mearns, who provides very misleading analysis. Euan is a very big Fossil Fuel advocate, and IIRC he’s in deep denial of Climate Change.
Their climate denial is the part I disagree
Well, that’s great.
But…people who are in denial about Climate Change tend to show bad judgement about non-Fossil Fuel energy sources. They’re very willing to accept deeply flawed analyses, as long as the analyses confirm their bias against anything that competes with Fossil Fuels.
So, unfortunately, you have to be very skeptical of anything written by someone (like Euan) who is in denial about Climate Change, especially when it comes to analyses like this, which are all about transitions away from Fossil Fuel.
Well, one be both a serious thinker on climate change (concerned about climate catastrophe) and be cautious (“pessimistic”) about renewable potential
Just name two:
Richard Heinberg
James Kuntsler
Hi Minqi,
Is your expectation that there will be zero technological progress in wind and solar power?
Currently the average worldwide capacity factor for wind and solar power is about 20%.
As the grid connections become better over time (HVDC grid connecting a widely dispersed wind and solar power network) and as the areas with the best wind and solar resources are developed, it seems logical that the average worldwide wind and solar capacity factor might increase to 28.6% which would mean that wind and solar combined capacity of 3.5 times average load should be sufficient, backup could be provided by hydro or nuclear power, which together currently provide about 26% of the world’s electricity generation, if electricity output increases by 2.73 times 2016 output by 2050, then about 9.5% of total load would be available for backup from 2016 levels of nuclear and hydro output. This should be plenty at a high level of wind and solar buildout (some studies suggest 1% backup would be needed at wind and solar combined capacity of 3 times average load.)
Dennis,
I don’t think capacity factors are as helpful as your comment seems to suggest. For instance, consider a theoretical location where solar power has a 20% capacity factor, but it’s 100% reliable: every day you get exactly 4.8kWhs per kW of capacity.
Well. You don’t need any seasonal or unusual-weather-event related backup at all: all you need is enough storage to get you through the night. That wouldn’t be that much, given that daytime demand is higher than night time demand to begin with, and some demand could migrate to the daytime (EV charging, industrial demand, etc).
In that case you wouldn’t need to overbuild at all – you could build exactly what you need.
Let’s consider another case, where solar is completely reliable, but where winter insolation is 50% of summer peak levels. In that case you’d need to build your capacity to match your winter needs, which might be 50% above the overall average for the year. Then you need to over-build to 1.5x the average. Which, of course, is still much lower than a capacity factor based analysis might suggest.
The point? The kind of strategies needed to deal with supply variance and randomness depends on the nature and distribution of the variance and randomness. Different kinds of variance, and different kinds of randomness will need different levels of overbuilding, long distance transmission, storage, backup, DSM, etc., etc.
Variance that is completely predictable is different than random variation. Daily/diurnal variance is very different from seasonal and weather-event variation. They have different distributions and require very different strategies.
And capacity factors don’t tell us that much about variance and distributions.
Hi Nick,
We understand “overbuild” differently.
If the Capacity of a solar facility is 100 GW but it’s average daily output was 20 GW per day, then I call that and over build of 5x if only 20 GW are needed and you say capacity has not been overbuilt at all.
We will just have to disagree on out terminology.
Typically claims are made that 100 GW of capacity have been installed in my example.
If we use your terminology we would need to revise that to 20 GW of useable capacity (daily average output) have been installed.
One cannot have it both ways.
I’d guess that the term “over building” is new enough that it’s not clear in this context.
It’s generally understood to mean “building more than you need”.
So, if you are a utility, and your customers need an average of 440GW of power per day (as in the US), then building 490GW of nuclear power (490 x 90% capacity factor = 440) would not be over-building – it would be considered “right-sizing”.
Similarly, in a world in which all power consumption happened to perfectly fit the pattern of solar power generation, 2,200GW of solar at 20% capacity factor would give an average of 440GW, and would be “right-sizing”, not overbuilding – there would be no “wasted” capacity or potential energy output.
Now, let’s say your customers occasionally need a peak level of very roughly 700GW. If you add about 250GW of NG peaker plants, you’d be ok. You could call that overbuilding (both you and I have in the past), but a utility might not, given that they’ve built the right thing for their needs.
So. I understand the authors of the study that recommends 3x overbuilding to be discussing a solution that involves building, say 6,600 GW of solar for our theoretical all-solar model. Is that your understanding?
Hi Nick,
Yes Capacity is often understood as the maximum possible output from a power generating source. So the study from the University of Delaware that I often refer to proposes that combined wind and solar capacity of 3 times average load will result in the lowest cost system at expected prices from 2013 to 2030 for wind, solar, and battery/fuel cell backup.
http://www.sciencedirect.com/science/article/pii/S0378775312014759
“Cost-minimized combinations of wind power, solar power and electrochemical storage, powering the grid up to 99.9% of the time”, Budischak et al, 2013
Again, for Europe these simulations have already been done. With more transmission lines we get a nice flat power duration curve, the develeopements of offshore wind power make the whole much easier.
Hi Minqi,
Residential winter heating can easily be covered even in the coldest climates using ground source heat pumps, in more moderate climates with well built houses air source heat pumps are adequate. High heat industrial processes can use electric arc furnaces in many cases.
Air travel could use biofuels, freight can go by electric train and by plugin hybrid or EV trucks from trainyard to store/factory. It might be that we cannot get beyond 99% of energy being supplied by non-fossil fuels, but humans are pretty innovative and may be able to use wind/nuclear for water freight and maybe solar/battery/biofuel for air travel or make air travel very expensive so that it is used very little.
Synthetic liquid fuels are perfectly viable – the tech and engineering exist right now. At the moment they’re not *competitive*, at maybe $2.50 per liter, but they’re *viable*.
Aviation can become much more efficient in it’s consumption of fuel, and synthetic fuel costs can be reduced sharply, but even if neither of those happened, $2.50 per liter is maybe 3x the current price. Given that fuel is about 1/3 of the cost of flying, that price would only double the price of flying. That’s not the end of the world.
The same logic applies to seasonal agriculture, and long-distance water shipping.
This is the data that caught my eye in the BP report. World oil reserves. In 2011 they were 1681 BBbls. In 2016 they were 1707 BBbls. World oil reserves increased by 26 BBbls over 5 years. Is this due to geology or economics? Also how much of the increase is due to new discoveries vs increased reserves of known fields.
How can it be geology?
I suppose that means new discovery, but the rock didn’t change.
Hi Ovi,
The proved reserves data is not very good especially for OPEC. The short answer, we have no idea.
If the OPEC data is consistent, it’s the flattening that is interesting. Since we consume 35 BBbls/yr, we may see the world reserve begin to roll over in the next few years.
According to the EIA, Oil Companies’ Proved Reserves in 2016 Decline for second consecutive year. Part of the downward revision was due to oil sands reserves being reduced due to lower oil prices.
https://www.eia.gov/todayinenergy/detail.php?id=31592
India. Conflicting blurbs. One says diesel consumption growth 2016 was 25%. ( Overall oil consumption growth 10ish %).
Attributed by reporter to car sales. Makes little sense.
Another blurb says diesel explosion in consumption growth derives from diesel powered portable generators being brought to unpowered areas by political parties seeking that neighborhood’s votes.
These guys won’t want shale oil.
The world runs on diesel.
Shale doesn’t produce much diesel.
Hi Hightrekker,
LTO is only 5.6% of World C+C production, so not really much of a problem.
True
Hightrekker says:
More fact-free nonsense from our “expert consensus.”
Eagle Ford and Bakken crude yield almost the same amount of diesel as do WTI and Brent.
Glenn, folks that don’t need to be right to apparently maintain employment don’t use facts, but they do however use models that never work, theories that need not be ever be proven and falsely generated scientific expert consensus as a cover to promote falsehoods. thumbs up for your effort to keep ’em honest?
We’re not the ones you have to convince. Right gas and oil are priced so low that some projects will be postponed, perhaps indefinitely, and Wall Street isn’t all that impressed with gas and oil companies.
Any talk of the great amounts of gas and oil that will flood the market just depresses the price further.
Cheerleading doesn’t seem to propping up the industry.
But you guys are doing exactly what I want to see happen: less interest in drilling in some parts of the country and the world.
Your talk doesn’t make sense to me unless your goal is either to keep prices low or to sell the Brooklyn Bridge to some unsuspecting buyers/investors, but for personal reasons I’m happy to have you maintain that there is so much gas and oil that low prices should be the norm, even if it is killing some companies.
Hi Boomer II,
You realize that Glenn and Texas Tea believe that oil and natural gas resources are unlimited and will never run out.
Not much point in responding to them.
In 2012 at
http://oilpeakclimate.blogspot.com/2012/07/an-early-scenario-for-world-crude-oil.html
my 2012 scenarios are in the chart below. Since that time my estimate for World C+C URR has increased from 2800 Gb to 3300 Gb, based on research I have read since 2012.
Yes, I realize that. But even if such supplies are unlimited, if you can’t get it out of the ground at the price that people are willing to pay for it, then you constantly lose money unless you convince people to subsidize it.
What I see is that the financial community is no longer enamoured with gas and oil. They have shiny new industries and companies to fund instead.
If there isn’t enough money coming in to fund drilling, how long will it continue? People and companies with money can find other outlets for their money. Gas and oil may no longer be part of that mix, no matter what Glenn and TT write.
I think telling people there is an abundance of oil, when investors are concerned about a glut, seems rather self-defeating.
Hi Dennis,
you are not much of a mind reader? your comment “You realize that Glenn and Texas Tea believe that oil and natural gas resources are unlimited and will never run out.”
I do not know Glenn so I have no idea what he thinks, but as for my self my disagreements with those on this board, they center around my real life experience. People have been saying we are running out of oil for several decades but supply and demand hits new records just about every single year, year after year for that same period of time. My point is graphs and models can not and do not factor in the real world, where good decent scientist and engineers, motivated by real world factors like employment and advancement continue to find new sources of oil and gas and recover them economically. If “alternative sustainable energy” was ready for prime time those industries would not need government intervention and government subsidies to “compete”. Not only do they need direct subsidies they also need intervention like shutting down DAPL to raise the cost of oil and gas to compete.
I must make a living in the real world were facts and being right from time to time are the difference between steak and spam for dinner. Therefor my world view is shaped accordingly.
Hi Texas Tea,
The rate of increase in World oil (C+C)output slowed down quite a bit from 1900 to 1973 (6.5%/year increase) to 1974-2016 (a 0.93% per year increase). From 2005 to 2016 the rate of increase in World C+C output has slowed further to 0.87%/year.
Perhaps oil output will increase forever, but I am highly skeptical and there is quite a bit of peer reviewed literature which agrees.
See
http://rsta.royalsocietypublishing.org/content/372/2006/20130179
From section 5a of that paper
Simple calculations suggest that delaying a global peak in conventional oil production beyond 2030 would require more than 1700 Gb of remaining recoverable resources (i.e. a URR>3000 Gb), together with a relatively slow increase in production prior to the peak and a relatively rapid decline thereafter, especially if the peak is extended into a multi-year plateau [11].
Following an earlier literature review, we concluded that a sustained decline in global conventional production appears probable before 2030 and there is significant risk of this beginning before 2020 [11,62]. This assessment excluded tight oil resources since these were classified as unconventional. However, on current evidence the inclusion of tight oil resources appears unlikely to significantly affect this conclusion, partly because the resource base appears relatively modest (figure 9).
So many experts believe a peak between 2020 and 2030 is likely.
Higher oil prices are likely to result, along with higher natural gas prices (as both of these resources deplete).
In the mean time the price of wind, solar, and batteries will fall so that by 2030 oil and natural gas may no longer be competitive.
Whoa.
Scoping around for an assay of India’s declining oil output. Haven’t found one yet, but during the search went to the Capline assay page and happened to see . . . .
WTI, sportsfans, as of an assay done last year is listed as API 40.6. Yes, 40.6. WTI is 40.6. Remember back when things were normal?
http://www.caplinepipeline.com/Reports1.aspx
Remember also the bloomberg article where a guy was quoted within declaring the WTI definitions were going to change because LTO was being mixed with the flow going to Cushing?
Ooooh, maybe liquid with lower middle distillate content isn’t as valuable.
BP says India’s oil consumption grew by 8.3% in 2016.
Although if use India’s oil consumption numbers for 2015 and 2016 reported by BP, the calculated growth rate is 8.6%
BP says they adjust growth rate for “leap years”. The precise method of their adjustment is unknown.
The point was disproportionate consumption growth of diesel vs oil as a whole.
Not happy with that diesel blurb of 25% growth. Trust little data and no projections.
http://www.thehindubusinessline.com/companies/rosneft-closes-essar-oil-deal/article9733596.ece
More India stuff. Rosneft overpaying for assets and foot in the door. India’s consumption growth and essentially ignoring any US sanctions on Rosneft makes this rational — despite a 2:1 overpay.
Meanwhile, looks like the end for coal 🙂
GLENCORE RAMPS UP BIDDING WAR FOR RIO TINTO’S COAL MINES
“The Switzerland-based mining group said it would offer $2.68bn in cash, payable in one lump sum, for Rio’s Coal & Allied business in New South Wales. This represents an advance on the $2.55bn it offered earlier this month and is considerably more than the $2.45bn offered by Yancoal, the Chinese-backed miner that is Rio’s preferred buyer.”
https://ca.finance.yahoo.com/news/glencore-ramps-bidding-war-rio-144458621.html
India coal consumption:
2010 290 Mtoe
2011 305 Mtoe
2012 330 Mtoe
2013 352 Mtoe
2014 388 Mtoe
2015 397 Mtoe
2016 412 Mtoe
Domestic production consistently about 150 below that number. Rio will have a customer.
India’s oil fields and coal mines are essentially co-located in the northeast
Domestic production consistently about 150 below that number. Rio will have a customer.
Anyone who thinks coal has a long term future either has blinders on or can’t read the writing on the wall! China and India are both putting nails in coal’s coffin.
https://www.ecowatch.com/india-coal-mines-close-2446931737.html
World’s Biggest Coal Company Closes 37 Mines as Solar Prices Plummet
The rapid growth in renewable energy continues to put a dent in the demand for coal.
Coal India, the world’s biggest coal mining company and producer of 82 percent of the country’s coal, announced the closure of 37 mines that are financially “unviable.”
It’s the long term growth in demand for coal that is falling and will continue to do so! My hunch is that trend will pick up speed!
Closing 37 mine poorly producing mines out of over 400 does not seem like a big step. Mines play out, a fact of life. There will always be mine closures.
From what I have been able to gather India will continue to grow it’s coal consumption. It also appears to be one of the largest coal importers in the world.
But I find the information on India coal production confusing. So maybe someone there or with more info can shed some light.
http://instituteforenergyresearch.org/analysis/india-opening-coal-mines-will-surpass-u-s-in-coal-production/
http://www.thehindubusinessline.com/economy/policy/coal-india-identifies-445-mines-for-closure/article8981825.ece
It seems as though you’re not the only one confused. 🙂
INDIA’S COAL PLANT PLANS CONFLICT WITH CLIMATE COMMITMENTS
“The people going to the international meetings to participate in climate negotiations aren’t the same one that are permitting new power plants in the country.”
https://phys.org/news/2017-04-india-coal-conflict-climate-commitments.html
July 2015
Piyush Goyal, India’s Minister of State for Power, Coal, and New and Renewable Energy, plans to double his nation’s coal production by the year 2019 to meet domestic energy requirements.[v] The reason for this major use of coal is to provide electrification to millions of Indians that are without it. An estimated 400 million Indians–roughly 31 percent of the country’s population–lack access to electricity. [Those that have electricity endure rolling blackouts as the norm]
Climate change? Zero importance.
They have coal. They will burn it to make power. They have nearly no nat gas. They have coal. They will burn it to make power.
Climate change? Zero importance.
But it may turn out that localized renewable energy is cheaper now to implement than putting in new coal fired plants and new transmission networks.
It’s like cellphones. They enabled developing countries to skip over the landline phase.
I have read quite a few articles on India and coal. There are two versions of their future. One is that they’d like use less coal and have a clean solar future. The other is that they are on an actual path toward 2 or 3 decades of heavy growth in coal consumption.
Both are happening simultaneously. The coal train is not going to stop on a dime, in fact its still picking up momentum.
India is not remotely survivable, if one is even rudimentarily educated in population biology, it is obvious.
With the little I know about India energy, so far Hickory’s analysis of the situation appears to be correct.
We all know where this is leading. Happy shifted monsoon, happy high tides.
A possible scenario is that a lot of coal capacity will be built at the same time as wind and solar, and…the coal plants will be underutilized and their investors will lose money.
Regarding India population and growth- they are in the early stages of a growth spurt. It will not be as dramatic as China’s has been over the past 30 yrs, but nonetheless will be a big story. The average Indian is feeling much more prosperous than just 10 yrs, and the number who can afford electricity, and gasoline purchases has mushroomed. While they are surely up against the ecological constraints of the sub-continent (such as water), they have big gains to made on the efficiency and organization front in managing their assets.
They will be the biggest country soon. They will not be so well off as to avoid using tremendous amounts of coal, however.
My son-in-law is from India, and his whole family still lives there. He is an example of the immigrant who makes our country strong- IT companies competing to hire him. Some of his buddies who arn’t married to a citizen girl have been sent back to India after Trump got elected.
The future of coal in India is a good deal more uncertain than many forecasts suggest.
The use of coal for power generation, for example, stalled this last Indian Financial Year (which ends in April), according to data from the Indian Coal Ministry (publicly accessible but requires extensive data-mining and wrangling). When imported thermal coal (now in clear decline after peaking in 2014/15) is added to Indian coal dispatched to the power sector, FY2016/17 showed a less than 1% increase, while power generation was up about 4%, and GDP about 7%. Yes, Indian coal production overall continued to increase by about 3.4% year-on-year, but it’s unclear if this will do anything but end up in stockpiles like last year that led the Govt to cut its production goal for this year and led to fears of self-combustion events.
Much of India’s coal production increase will simply displace thermal imports, and the plan to build more washeries at pit-heads will also displace some of the imported coking coal.
Power is the main coal customer in India, but the diabolical finances of the State discoms means that all but the few solvent ones lose money for every new customer, hence they simply cannot afford to purchase any more power. The government “UDAY” bailout of the discoms is patchy at best. Recently the discoms owed more than the whole country takes in income tax each year.
Some of the claims for inexorable increases in Indian coal look completely overblown, given the massive logistical and financial barriers to extension of the grid, power theft, political vote-buying with low tariffs, and the inexorable rise of large-scale solar as well as distributed generation.
The Powder River Basin – Liquids growth outside of Texas
IHS Markit – Energy Blog – Thursday, 22 June 2017 by Reed Olmstead
As in the rest of the L48 onshore system, the price collapse led operators to high-grade, extend laterals and increase proppant in the Powder River Basin. Peak month productivity has nearly doubled since early 2014, from ~90 boe/d per 1,000 lateral feet to over 180 in late 2016. Proppant intensities rose from 800 lbs/ft to nearly 1,200 over the same period and aided the doubling of productivity. However, the most interesting operational change has been the experimentation and ineffectiveness of extended lateral lengths. Historically, operators preferred 5,500 ft laterals in the region through 2014. During 2015, operators (mainly Devon and SM Energy) tested 9,500 ft laterals. But longer laterals have been relative underperformers with only 8% of wells with laterals over 7,500 ft peaking above 150 boe/d per 1,000 lateral feet, compared with 37% of short laterals since 2014. Unsurprisingly, operators reacted and brought few long laterals on-stream during the past 18 months.
http://blog.ihs.com/the-powder-river-basin-–-liquids-growth-outside-of-texas
This is the first thing I’ve seen saying proppant total per 1000 ft of lateral has been a significant variable. We know longer laterals were embraced starting about 2012. And we’ve seen many items of evidence since then saying longer laterals remain the order of the day.
What we didn’t see was a choice to spend much more $$$ per lateral foot on proppant sand (one does wonder if they had stayed with ceramics . . . maybe the cost would be lower) to get flow up per lateral foot.
This all further explains the negative earnings on the big guys, EOG, CLR, WLL Osomething.
oh yeah oasis
Watcher says:
Where have you been? This news has been all over the place in O&G publications for at least a year now.
And what about this part of the article, which you seem to have ignored?
Experimentation with the newer completion techniques is still in its infancy, but the initial results are most encouraging, to say the least.
Pioneer Resources, for instance, reports that the additional cost of a Version 3.0 completion (which it began experimenting with in 1Q2016) over a Version 2.0 completion (which it began experimenting with mid-2015) pays out in 12 months. The biggest achievement appears to be the flattening out of the decline curves, which greatly enhances EURs.
So even though there was a marked improvement in productivity going from Version 1.0 completions to Version 2.0 completions, the productivity gains achieved with Version 3.0 completions are quite remarkable.
Experimentation in the Tuscaloosa Marine Shale, the Powder River Basin, the Brown Dense, SCOOP/STACK, Canada’s Duvernay and even the Permian Basin also is still in its infancy, and it’s going to take some time to identify the sweeter parts of the plays. The vastness of the Permian Basin makes this chore especially challenging.
Pioneer Natural Resources Earnings -$1.97/sh
The triumph of technology.
You need to learn how to keep score.
Pioneer is a business:
Business Schools Might Have A Tiny Little Psychopath Problem
http://dealbreaker.com/2017/05/business-schools-might-have-tiny-little-psychopath-problem/
“Business students are more likely to fit the prototypical profile of a psychopath, including being more likely to be rebellious, manipulate others, and have a propensity towards guiltlessness. […] Fundamental differences in psychopathic personality can help explain why business students deceive others more often compared to nonbusiness students.”
Watcher says:
Nah.
Hi Glenn,
Analyst forecasts are not worth much, the 2017 Q1 10Q says that Pioneer lost $42 million in Q1 or a loss of $0.25 per share.
For the 2016 10K (annual report) Pioneer lost $556 million or $3.34 per share.
Data from
http://investors.pxd.com/phoenix.zhtml?c=90959&p=irol-sec
and
http://investors.pxd.com/phoenix.zhtml?c=90959&p=irol-sec
Dennis,
The NASDAQ analysts probably used pro-forma earnings and not GAAP earnings for their graph. Analysts often believe GAAP earnings do not provide investors with a true picture of the continuing operations of a company. Pioneer, for instance, wrote off $285 million in impairments to its oil and gas properties in 1Q2017. Many wells that are profitable to operate at $100/barrel are no longer profitable to operate at $50/barrel, so must be written off. This is a one-time writeoff.
Pioneer generated $364 million of net cash provided by operating activities, or $2.17/share, in 1Q2017.
Hi Glenn,
A loss is a loss. You can spin it how you choose, I ignore the analysts.
How long will people believe that next quarter will be different?
Dennis,
GAAP earnings are an important metric.
But what sort of investor would argue that they are the only metric that matters? This is an exaggeration and a distortion that almost no investor would agree with.
Are you even an investor? Or are you just someone intent upon bashing the oil and gas industry?
Hi Glenn,
And would you argue that free cash flow is the only metric that matters?
There are many investors that pay very close attention to earnings. The Price earnings ratio is often prominently featured in business news.
What is the P/E of PXD?
I have seen the consensus earnings forecasts on the NASDAQ website. I have wondered what oil and natural gas prices are being used in those forecasts.
It’s probably quite a bit more than the current price, more like $50 to $55 per barrel.
Without further production cuts from Saudi Arabia or some black swan event, it’s shaping up to be a hard candy Christmas in the oil patch come December.
Fortunately, Saudi Arabia has some strong incentives to defend the price of oil, especially in the short-run. So we shall see what happens.
Why Is Saudi Arabia Desperate For Higher Oil Prices?
http://oilprice.com/Energy/Energy-General/Why-Is-Saudi-Arabia-Desperate-For-Higher-Oil-Prices.html
And talking about “The triumph of technology,” here it is:
.
Hi Glenn,
Many (including me) would agree that Tesla is overvalued.
And so is PXD.
Hi Glenn,
Tesla lost $674 million in 2016 on revenue of $7 billion (-9.6%).
Pioneer Natural Resources (PXD) lost $556 million on revenue of 3.824 billion (-14.5%).
So technology does not seem to be working well for either of these companies in 2016. Worse though for Pioneer Natural Resources.
Tesla data
http://ir.tesla.com/sec.cfm?mode=&CompanyCIK=1318605&DocType=Annual&Year=&FormatFilter=
Income statement on page 56 of the Tesla 2016 10K.
Dennis,
Pioneer had $66 million, or $0.39 per share, of free cash flow in 1Q2017.
How you are able, with a straight face, to compare that to Tesla’s chronic losses is beyond me.
.
Hi Glenn,
Income per share is what matters.
Positive free cash flow with net losses, is not impressive.
Maybe you can find people that believe your crap.
Not many of them are here.
I double checked Pioneer’s cash flow statement, they burned $455 million in cash in the first quarter of 2017. The $66 million in “free” cash flow assumes that we should ignore the $521 million in losses from financing activities.
Did you go to the Bernie Madoff school of accounting? 🙂
Just some Enron Accounting.
Its all the rage these days.
Dennis,
The reason that Pioneer “burned $455 million in cash in the first quarter of 2017” is because it repaid $485 million in long-term debt and bought $36 million in T-bills, in addition to investing $519 million in the oil patch.
From comments like this one, you demonstrate that you lack even the most rudimentary understanding of what you’re talking about.
.
Some interesting things I see in PXD 10K:
In the 12/31/16 10K it is disclosed that PXD operates 9,978 net wells, with total BOEPD production of 233,842, BOPD production of 133,677. PXD operates mostly stripper wells.
PXD’s production costs (which consists primarily of LOE) has been steadily dropping, with the big drop occurring in 2016 at $6.79 per BOE. Prior years were:
2015. $9.62
2014. $10.54
2013. $11.08.
2012. $11.06
D,D & A (which PXD calls depletion expense) per BOE is as follows:
2016:$16.77
2015 $18.01
2014. $14.29
2013. $15.20
2012. $13.42
Ad valorem and production tax per BOE has dropped, due to much lower product prices:
2016. $1.60
2015. $1.95
2014. $3.25
2013. $3.32
2012. $3.25.
Average annual oil price:
2016. $39.65
2015. $43.55
2014. $85.51
2013. $93.09
2012. $91.01
Average annual BOE price:
2016. $28.25
2015. $29.25
2014. $53.71
2013. $53.71
2012. $49.57
I did notice that PXD’s net operating loss carryforwards increased in both 2015 and 2016.
Based upon reviewing these historic metrics, it appears to me that PXD would either need to continue to substantially lower production costs and also substantially lower DD&A in order to show significant earnings increases at $50-$55 oil. This might be difficult considering the number of net wells they operate.
As an aside, I see the word redneck being tossed around by some EV advocates here. As a person who lives in rural America, with numerous friends and relatives living in urban, suburban and rural areas, and as someone who realizes therefore that people should be judged on an individual basis, you may want to reconsider.
Some for some reason like to pigeonhole people based a single, or a small set of indentifiers, such as residential location, political party, etc. This ignorance is very detrimental to our society, and in particular the USA.
Much better off being civil and sticking to facts folks.
shallow sand,
This graph is from Pioneer’s latest investor presentation.
It should come as no surprise that the production cost per BOE for a vertical wolfberry well that makes 3 BOEPD is much greater than for a horizontal wolfcamp well that makes 100 BOEPD.
As to DD&A, depletion has more to do with tax laws and tax liabilities than anything else. Many anti-O&G advocates claim it amounts to little more than a special tax break for the O&G industry.
I don’t know what the current tax laws allow, but back when I was active in the O&G industry we could expense much of the drilling and completion cost of a new well. We called these “intanglible drilling and completion costs,” and they greatly reduced current earnings (and taxes due) for the working-interest partners of the well. The anti-O&G advocates argued these were also nothing more but a special tax break for the O&G industry. They argued that these intanglible drilling and completion costs should be capitalized and amortized, and not written off the year the well was drilled. This would result in higher profits and higher taxes for the working interest partners in the year a well was drilled and completed.
When it comes to the decision as to whether to drill an indiviual well or not, proved developed F&D cost is a more useful metric than DD&A. For its new horizontal wells, Pioneer reported this metric to be $9.11 per BOE in its laterst investor presentation.
As to those approximately 10,000 wells that consitutue Pioneer’s legacy production, no doubt many of them are not economical to operate on an operating cash flow basis at $50/barrel oil. In addition, their depreciation weighs down Pioneer’s GAAP earnings on its SEC earnings statements. But if Pioneer writes these wells off, it would result in more impairments to its oil and gas properties. Plus these wells are what holds much of Pioneer’s acreage. For these reasons Pioneer is probably reluctant to abandon them.
Hi Glenn,
And what was their cash flow?
It was negative.
Every business has to pay its debt and invest capital, to suggest that this is unusual suggests maybe it is you who is spinning like a top.
Dennis,
Pioneer generated $364 million in operating cash flow, or $2.17/share, in 1Q2017.
Hey Dennis, speaking of spin, I just want to remind you and others that certain troll like activity eerily mirrors the agenda of the happy billionaires pictured below. If the troll is not on their payroll he might as well be.
I also note that the troll seems to be operating out of Mexico. Maybe his mission is to try and start the spread of Koch inspired bullshit to the second largest language block in the world, seeing as how global warming denial is largely an English speaking phenomenon. Maybe the Kochs have decided it is time to try and spread their brand of indoctrination beyond the borders of English speaking countries.
Why is the troll pumping PXD? Maybe that is something outside his job description. If he thinks anybody in this crowd is going to rush out and invest in PXD he is well and truly beyond hope.
My agenda is to advocate that the necessary steps be taken to avoid the worst scenario put forward in the 2005 Hirsch Report where, on page 65 it says, “Mitigation will require an intense effort over decades. This inescapable
conclusion is based on the time required to replace vast numbers of liquid fuel consuming vehicles and the time required to build a substantial number of substitute fuel production facilities. Our scenarios analysis shows:
• Waiting until world oil production
peaks before taking crash program
action would leave the world with a significant liquid fuel deficit for more than two decades. ”
What is the troll’s agenda?
I’ve been wondering what his agenda is, too. He seems to want to promote gas and oil, without regard to what his claims would mean for prices and their affect on producers.
As I have said, such a message actually works for my goals. I don’t want to see drilling in certain parts of the US and the world, and low oil prices discourage those projects.
Ooops!
The Happy Billionaires!
“If scientists could be bought, these motherfuckers would make it rain in Nerdtown!”, Jon Stewart – The Daly Show.
I thought I’d see if there are some connections between the Kochs and Pioneer.
Here’s one, though not necessarily proof of anything.
Pioneer Oil LLC – About Us: Damon Krehbiel – General Manager of Supply and Trading
20 plus years experience in the asphalt and petroleum industries
Supply and Distribution Management, Sales, Marketing, and Commercial Development at Koch Industries
Sales Management and Marketing at Citgo Asphalt Refining Co.
BS in Business Management/Marketing from Kansas State University
Hi Glenn,
Operating cash flow is one way to spin a negative cash flow into a positive cash flow, just ignore all the negative cash flows and add up the positive ones, ya that’s the ticket. 🙂
Do you read what you write?
Dennis,
If investors used your criteria to value stocks, then not only the stock of Pioneer would be nearly worthless, but those of Telsa, Uber and Lyft too.
But they are not worthless. In fact, the very opposite is true, they are quite valuable.
How do you explain that?
Hi Glenn,
The price is based on the expectations of the investors. Sometimes these expectations are fulfilled and sometimes they are not.
If investors believe the investor presentations of PXD, they might be convinced that things will turn around for PXD, but if oil prices remain where they are, they may be disappointed.
You often point out that Tesla is overvalued, and I agree. PXD is also overvalued, especially when one considers that the well profiles in the investor presentations are inflated by about a factor of 2 and the well profiles we do have are from the core areas where the well productivity is highest. The thousands of future wells to be completed are unlikely to match the average PXD well from 2016 and 2017 as the core areas become saturated with wells and average new well productivity eventually declines (probably around 2020).
Most investors don’t realize this.
An interesting comment at Enno Peter’s site by a reservoir engineer.
https://shaleprofile.com/index.php/2017/06/08/permian-update-through-february-2017/#comment-1158
An excerpt:
From the historical Permian production curves that you posted, it’s really hard to imagine that more than one million BOE of EUR, mainly due to high completion efficiency, is used by some companies to show their investors. As a reservoir engineer, I think the some presentations mislead investors for using such a big EUR to get a very small break even oil price. They may find an excuse since no one knows the exact EUR until the well was abandoned. The type curve analysis they used to get such a high EUR is mainly based on the high initial rate and apply the same decline rate as they used before for lower completion efficiency wells. The decline will not follow the type curve that they used, and the EUR will not reach more than 1 million BOE on an average basis that Pioneer Natural Resources used for Wolfcamp B completion 3.
Oh that’s right, you’re the dood I had to waste time educating about cash flow.
Watcher,
You “educating” someone?
Lordy! Lordy! Now I’ve heard it all.
https://www.oilandgas360.com/stage-continues-improving-completions-design/
“The average number of fracture stages in the Montney went from 10 in 2010 to 26 in 2016 before jumping to upwards of 100 stages this year, according to Stage. Fluid volumes and proppant tonnages are increasing at a similar pace, going from 2,500 cubic meters of fluid and 750 tons of proppant in 2010 to over 30,000 cubic meters of fluid and 5,000 tons of proppant in 2017.”
in my neck of the woods, production rates have increased significantly, that is anywhere from 30-100% over wells we drilled just two years ago. (with 7 month production history) How this large increase in production rates affects well density and EUR is still unknown but it is a fact that recent completion methods have yielded significantly higher and sustainable production rates and faster payouts in the areas we are active.?
The introduction of diversion products and techniques has practically eliminated the adverse effects of stress shadowing from one stage to another, thus enabling many more stages per lateral.
The temporary blocking of near wellbore, large fissures has increase cluster effectiveness from 60% a few years ago to near 100% now.
This also enables the use of MUCH more 100 mesh proppant to scour/sandblast way more reservoir area.
The recently introduced micro proppants – 200/400 mesh ceramics – is expected to double output yet again.
Hi Coffeguyzz,
The mistake people make is to assume a high IP (say double previous rates) means that EUR will be doubled.
A reservoir engineer would point out that this is rarely the case.
Looking at previous history, the gains in EUR are over the first 12 to 24 months, after that the cumulative well profile is the same or lower than earlier wells from 25 months to the end of life (typically 15 to 20 years rather than the optimistic 30 or 45 years sometimes found in investor presentations).
I am going to take the opportunity to say Dennis you “MAY” be right but on the other hand you may not be. I for one make my bets (yes with real dollars) with hard facts and data I monitor each and all within a 3 miles radius or every well I drill. How long was the lateral how big was the frac how does the production compared to earlier wells. In times like these (low commodity prices ) if I think based on hard data I can get my money back in under 2 years its a go. I now have wells in the scoop woodford well that are 6 years old and I have decline curves that I compare too. The economics are as good if not BETTER NOW then they were when prices were higher. just the facts jack?
And by the way every section we own minerals in now have not only the woodford but the springer and the sycamore, so when we started we thought we would drill 5 wells per section now its 12-15 well per section.
Hi Texas Tea,
I use the data at shaleprofile.com as the basis for my analysis. Surely there are individual wells that will make money, for the industry as a whole it is the average well that matters.
Currently for Permian basin wells competed in the first quarter of 2016 (only recent wells with enough data to estimate a type curve) the breakeven oil price (NPV of future output is zero) at a discount rate of 10% is $61/b.
That’s a fact.
Dennis Coyne said:
It’s “a fact” only if one, in calculating well economics:
1) Uses the current cost to drill a 9,500′ lateral well completed using Version 3.0 completion designs, while at the same time
2) Uses production histories and EURs for average 7,100′ lateral wells completed using Version 1.0 completion designs.
It’s going to take some time to see how the newer completion designs with longer laterals perform, whether in the long-run they’re going to flatten out those decline curves or not.
So far the results don’t look too good for the nattering nabobs of negativity who are hell bent on seeing the shale industry fail.
Hi Glenn,
The average well cost used was from the EIA data and also corresponds to Pioneer’s well cost in 2016, using capital divided by completed wells. I use the average results from the wells completed in the first quarter of 2016.
Yes we do not know what the future well profile will look like, but typically after 12 to 24 months the well profile declines steeply to match or sometimes fall below the well profile of earlier wells.
That has been the case for every LTO play that has been developed so far.
You may think the Permian will be different. That is just wishful thinking and buying the hype in investor presentations.
Oh and my predictions for the Bakken were pretty good ( except that they were too optimistic.)
See following from Dec, 2012
http://oilpeakclimate.blogspot.com/2012/12/quick-update-to-tight-oil-models.html
especially the following figure
http://2.bp.blogspot.com/-C5zbgWYPwJU/UMzTkuAXjiI/AAAAAAAAAIE/z-e0JfZPSWE/s1600/bakkenmodel3.png
Which of those shale companies with these miracle completion techniques with revenue of . . . let’s say > $500 million . . . have positive earnings?
More important, assuming you find even 1, a better question is what % of shale companies who no doubt are using miracle completions have positive earnings?
http://www.pnas.org/content/early/2017/06/16/1610381114.abstract
New paper published by National Academy of Sciences
It says 80% decarbonization of electric power sector can be accomplished with reasonable cost. But 100% or near 100% will be very difficult. Solar/wind variability is a serious challenge and decarbonization can only be done gradually
In particular, it criticizes the widely celebrated Jacobson article which claims the possibility to have 100% renewable electric power sector in the US by 2050
Hi Minqi,
I read the paper differently. It claims using only wind, water and solar (WWS) as Jacobsen et al claim is a problem. Including nuclear, biofuels and carbon capture and storage makes the problem difficult, but more doable. Not anything about a gradual transition in the abstract, primarily the focus is that relying exclusively on wind, water, and solar is problematic.
Abstract
A number of analyses, meta-analyses, and assessments, including those performed by the Intergovernmental Panel on Climate Change, the National Oceanic and Atmospheric Administration, the National Renewable Energy Laboratory, and the International Energy Agency, have concluded that deployment of a diverse portfolio of clean energy technologies makes a transition to a low-carbon-emission energy system both more feasible and less costly than other pathways. In contrast, Jacobson et al. [Jacobson MZ, Delucchi MA, Cameron MA, Frew BA (2015) Proc Natl Acad Sci USA 112(49):15060–15065] argue that it is feasible to provide “low-cost solutions to the grid reliability problem with 100% penetration of WWS [wind, water and solar power] across all energy sectors in the continental United States between 2050 and 2055”, with only electricity and hydrogen as energy carriers. In this paper, we evaluate that study and find significant shortcomings in the analysis. In particular, we point out that this work used invalid modeling tools, contained modeling errors, and made implausible and inadequately supported assumptions. Policy makers should treat with caution any visions of a rapid, reliable, and low-cost transition to entire energy systems that relies almost exclusively on wind, solar, and hydroelectric power.
While you folks ponder these models, hypotheticals, projections, etc., it might be a good idea to keep a sharp eye on what is actually occurring in the ‘real’ world as Zephyr and Ra continue to make inroads on mainstream infrastructure.
Thursday a huge rolling blackout hit the SF Bay area as infrastructure crapped out and little rapid response was available.
Those folks who run the New England grid have a revamped website.
The home page – iso-ne.com – has an outstanding, short piece on why wholesale prices spiked 25 times higher than normal on May 18 to $758/Mwh.
(Localized equipment failure, same as Bay area).
I well realize the vast majority of people who seem anti fossil fuel have somewhat limited technical know how in power generation, but as fiascos continue to arise related to renewables, you folks might want to start learning.
Couldn’t find anything on rolling blackout in SF lately. What gives?
Went to ISO-NE site and yes, wind drove the prices down into the negative region. As far as the high spikes “The real-time price spread was caused by challenging power grid circumstances that can occur mainly during spring and fall (but also any time of year, depending on resource availability): when unseasonable weather drives a spike in demand while major energy infrastructure is offline for maintenance.”
and
“The real-time market typically accounts for a small portion of overall wholesale energy market payments. Over the past five years, more than 95 percent of New England’s wholesale energy payments were determined in the day-ahead market, with less than 5 percent coming from the real-time market.”
http://isonewswire.com/updates/2017/6/9/significant-price-variation-on-may-18-highlights-operational.html
So what kind of logical leap made you think the high prices were related to renewables in New England?
Around here the outages are from storms and accidents. Comes from having a 1920’s style stick and wire system stuck along the roads with trees growing through them.
GF
Having hard time with this new tablet but Google california power outage 2017 and a bunch of stories pop up.
Re New England, it should be very important to all, I think, to understand what’s going on up there.
The quick response units, aka gas, are increasingly not available.
Concurrently, reliance upon wind/sun inherently increases unreliability.
The low Maine electric price that day is not as important as the Boston folks paying 25 times the normal wholesale rate due to break down of routine supply coupled with high demand.
Ominous background is that the NE people are heading that way more and more as natgas supply will be restricted and renewables are prone to intermittent deliverability.
Looking on that same site natgas power was the largest growth area in that region.
Why is natgas restricted in the future in the NE?
Those power outages in SF were due to record heat that just occurred. Thousands of people were effected for up to a few hours.
That just happened here today, had about four hours of outage.
No more gas pipelines are scheduled to be built in NE due to fierce opposition.
Coal plants heading out the door (huge Brayton Point just retired.
Pilgrim nuclear will be gone after two more winters.
And, yes, paradoxically, more natgas plants are still being built.
Oh no, New England will have to modernize. Is it possible?
It will work out. Politics change and so do laws when reality sets in.
GoneFishing says:
Modernize?
Or get drug back to the dark ages by the wind and solar lobby?
Sure Glen, that big leap of renewables in New England from 8% to 9% in 15 years sure makes a big difference.
Get your facts straight. Natural gas went from 15% in 2000 to 49% power production in 2015. Coal and oil fell away in that time.
Hydro stayed the same. Nuclear at 31 percent went to 30 percent by 20115.
What is happening is heavy dependence on natural gas.
Sure wind power is growing, but still small. Maine wind power is stalled due to lack of transmission capability.
http://www.wbur.org/bostonomix/2017/06/06/maine-wind-energy-stalls
GF
If you have the time and interest in the coming weeks, you may find it highly instructive to ‘get into’ this whole New England power supply situation.
It entails cutting edge embrace of fossil free future public policies, aging nuclear power plants, NIMBYISM not only towards natgas pipelines, but also power transmission lines coming from hydro-sourced Canada, whirleys both onshore and off being shunned, imported LNG from Yemen and Trinidad keeping the lights on in Bahstan.
This saga has gots it all.
Bottom line, the folks up there are counting on renewable sources for electricity with no plans at the moment on how to effectively bring it about.
That natgas fueled electric power is clearly the most efficient … as long as there is enough gas available.
In the cold of winter, the local gas companies and their customers get first ‘dibs’ on that gas since they paid for the transmitting pipelines long ago.
People who need their lights on?
Guess we’ll all get to see how it plays out.
Coffee, sounds like democracy at work ( or not-work in this case). Too Lilliputian for my taste.
The power outages in California this week came not as a result of the lack of power generation or supply- that was just fine-, rather it came from trouble with the distribution network during a massive heat wave.
The primary issue was old transformers not getting enough cool-down overnight and then failing outright.
It is a good example of this country spending too much in Afghanistan and Iraq and on football, rather than on domestic infrastructure.
Hickory said:
Oh, I think Calfornians have spent plenty on power.
Imagine that, paying almost double the price and getting unreliable power to boot! Who could possibly complain?
Hickory,
But to point out such facts is, of course, “spinning things” and “a transparent political propaganda maneuver,” according to you. (See your comments above.)
http://peakoilbarrel.com/world-energy-2017-2050-annual-report/#comment-606302
Dennis, in page 4-5 and page 8-9 (supporting information), the author made arguments about how unrealistic the installation rates proposed by Jacobson are
With more realistic installation rates, the decarbonization transition would be far slower than Jacobson hoped for.
The authors of this new article certainly advocate a broad range of energy options but in various places of the article, the authors emphasize that even with a broad range of options, the transition to complete decarbonization would remain “extremely difficult”
Hi Minqi,
I did not read the SI, but in the main article the focus seemed to be that restricting the energy sources to only wind, water and solar was the main problem.
I agree they seem to believe 80% is doable, but the last 20% will be very difficult, I agree, especially if we are looking at total energy supply. For just the power grid, and not restricting the non-fossil fuel resources to mainly 3 as Jacobsen at al do, I think we can get to 90% non-fossil fuel by 2050 in the electric power sector with appropriate policy and to 99% by 2070.
The industrial and transportation sectors may take longer, maybe until 2095 to get to 95% non-fossil fuel for all World energy use.
Difficult to foresee.
To describe it as “published by the National Academy of Sciences (NAS)” will mislead most folks.
It wasn’t authored by the NAS, and the Proceedings of the NAS is a non-peer reviewed publication. So, this publication does not indicate any kind of approval or review by the NAS.
How about published by the Proceedings of the National Academy of Sciences
I checked the Wikipedia page:
https://en.wikipedia.org/wiki/Proceedings_of_the_National_Academy_of_Sciences_of_the_United_States_of_America
It says PNAS is the second most cited science journal and ALL PNAS research papers are peer reviewed
Hmmph. My mistake, I guess. I’ll have to figure out what I was thinking of – I’m sure there was something similar that was not peer-reviewed.
So, that raises the question of how these two sets of authors can disagree so strongly – seems like a failure of the peer-review process, doesn’t it?
Hi Nick,
Yes it does. Based on the second paper, it may be that the first paper was not reviewed very well. In fact perhaps the Jacobsen et al work was not peer reviewed.
On second thought there is this where Jacobsen at al answer the article posted by Minqi.
http://www.pnas.org/content/early/2017/06/16/1708069114.extract
full paper at
http://web.stanford.edu/group/efmh/jacobson/Articles/I/CombiningRenew/PNASReplyClack.pdf
On reading the response by Jacobsen et al. I guess I would need to read both the Original Jacobsen et al articles and then the two more recent papers.
The rebuttal seems to have pretty good answers for the criticisms by Clack et al.
For investors in shale drilling, the party's over – Houston Chronicle: “But the in wake of the recent slump in oil prices, the oil companies that raised billions of dollars this year have seen their shares drop by 22 percent this year. If investors keep pulling back, the surge in drilling could slow sharply, Pursell said. And why wouldn’t they? Other industries are performing much better than energy.
‘The Dow’s at record levels and energy isn’t working,’ Pursell said. ‘It’s just maximum indifference. You have to get the oil price up for investors to care.’”
I noticed the author after posting this. The Mike from here, yes?
Wall Street Blames Shale, But Shale Points the Finger Right Back – Oilpro: “As long as investors continue to invest in companies with growth with marginal wellhead economics, you’ll get more growth. So you guys can help us, help ourselves. This is kind of like going to AA. We need a partner. We need somebody to sit through that class with us, but we do. I mean, we really need the investment community to show discipline, just like you’re asking us, I think, appropriately so in this environment, to show discipline.”
Hi Boomer,
Correct that is Mike, who comments here and likes to call them like he sees them.
Refreshing in my view.
A great comment from the link above by Boomer.
James Moody · 3d ago · Reply · Like · 4
This is why you need and independent 3rd party to allocate production among producers to insure that all share in the pain when production cutbacks are necessary. Totally free markets simply do not work well for oil and gas. Capital is not allocated on a rational basis because of the conflicting interest of the financial community and producers. Whether that third party is OPEC or the TX RRC or the State Oil and Gas Boards, if it is not done the industry staggers from shortage to glut bankrupting companies and investors alike. Granted futures traders like it because they make money on the spread, so you get the futures market driving prices and investments ran than being a way for producers and buyers to hedge risks.
Mike Shellman · 3d ago · Reply · Like · 3
That is precisely correct, Mr. Moody. The rate of further growth in the US shale oil industry must be slowed down thru regulations, be it allowables are simply increasing spacing and well densities per acre of land. It is hardly against the law to do that; in fact, there are existing laws in Texas that mandate it. I can make reasonable legal arguments for suggesting its against the law NOT to slow the pace of shale oil drilling in Texas.
It is the ONLY way to fix this mess.
I agree with Mike, the RRC of Texas should step in, maybe North Dakota, Oklahoma, New Mexico, Colorado, and Wyoming would follow their lead.
Dennis,
So just how do you believe the long arm of the law reaching out to cause higher gasoline and electricity prices is going to play in Peoria?
Do you really believe the average Joe or Jane in the heartland gives a flying flip that Mike (and many more in the O&G business just like him) can’t money with $50/barrel oil prices?
Politically speaking, your idea is DOA.
Hi Glenn,
That is up to the people of Texas and other states.
Perfectly legal from 1935 to 1971 and only stopped because the US stopped bein the swing producer for the World.
Why is it that the RRC of Texas (and other state agencies in Oklahoma and Louisiana) set output levels for several decades in the US?
Free markets don’t work well in the oil and gas industry, that is why the RRC and OPEC controlled World output levels for most of the 1935 to 2016 period.
Have you not been paying attention? 🙂
Dennis,
So you earnestly believe passage of something like the Connally Hot Oil Act would be politically possible these days?
Connally Hot Oil Act of 1935 Top # 7 Facts
https://www.youtube.com/watch?v=KdJxN8cftYo
The Connally Hot Oil Act has absolutely nothing whatsoever to do with existing statutory laws in Texas (Oil and Gas Conservation Law, 1919) that mandates the Railroad Commission of Texas (TRRC) to a.) to conserve oil and gas resources in Texas, b.) to prevent waste of those oil and gas resources in Texas and c.) to protect the correlative rights of mineral owners owning those resources in Texas; Natural Resource Code 3.B.Sec. 85. Further, 16 TAC (Texas Administrative Code) 3.37 clearly sets forth a number of applicable Statewide Rules for the TRRC to implement regarding oil and gas well densities per acre of land, spacing between wells, legal distances from lease and/or unit lines, well allowables, etc. etc. http://texreg.sos.state.tx.us/public/readtac$ext.TacPage?sl=R&app=9&p_dir=&p_rloc=&p_tloc=&p_ploc=&pg=1&p_tac=&ti=16&pt=1&ch=3&rl=37
Any good Texan knows the historic role that the TRRC has played in conserving oil and gas resources in our State over the past 90 years. Those Statewide Rules, however, have been forsaken completely over the past 20 years for the benefit of State severance taxes, a continuous budget surplus in Texas, school districts, counties and the Texas University System. Cheap gasoline also translates to votes and Texas Railroad Commissioners need to be elected, or re-elected. It is therefore unlikely that any attempt to re-instate conservation principles in Texas, for instance by restricting the number of shale oil wells per acre of land, will ever be re-instated. Until its too late. With regard to our hydrocarbon future, and leaving a savings account for our children, most people feel like Stehle and can’t think past next week, or simply don’t care. There in it for themselves, that’s all; for the quick buck.
In the mean time the financial state of the US shale oil industry, and particularly in Texas, is so dismal it is clear to me that the help needed to slow the rate of shale oil growth will ironically come from Wall Street. “Vision 3.0” apparently means driving the price down, sending everybody home out of work, filing bankruptcy, borrowing more money and starting over again, rinse and repeat, like 1.0 and 2.0. Wall Street appears to have just about had enough of the shale oil industry’s lack of fiscal restraint and its, 5th grade “insight” into world oil markets.
There’s an extremely informative book that discusses in great detail the history of how the Texas Railroad Commission finally gained the power in 1935 to implement production allowables, and it certainly did have something to do with the Connally Hot Oil Act. Previous attempts by the state of Texas to implement production allowables had been struck down by the courts. So a change in federal law was necessary before Texas could implement and enforce production allowables.
Mike, I don’t know where you come up with all the fact-free nonsense that you spout, but it impugns your credibility.
Mike said:
That’s pretty much what I said, so in this we are in agreement. What you describe are the political realities that exist today, whether one likes them or not, and they are very different from those that existed in the 1930s.
The remainder of your screed reads like a morality play — a sermon about what people ought to think and feel and do. But your moral priorities are just as DOA as Dennis’ political program.
A businessperson like myself who wants to continue to be a businessperson must deal with the world as it is and not as he or she believes it ought to be.
And the thought that Wall Street is going to throw you a lifeline is nothing but magical thinking.
“Over the past decade—roughly the history of the shale boom and two intervening busts
—eight leading U.S. shale producers have collectively generated $414 billion in revenue
but had negative free cash flow of $68 billion.”
https://www.wsj.com/articles/shale-produces-oil-why-not-cash-14984
Your “business” is failing miserably, but of course you are little more than a self-described hanger-oner, a royalty owner, little else, and, it appears, a professional blogger who if here on Peak On Barrel to win friends and influence people, has seemingly failed at that as well.
I have functioned successfully as an oil and natural gas producer for over 40 years without Wall Street and don’t need them now.
You do, however, need them desperately. Without them you might actually have to go back to work. Perhaps that is where you should hock your wares, on Wall Street, not here on POB. Here I think most folks find you rather, repulsive. And your “economic agenda” self-serving.
Perhaps POB readers find my comments equally repulsive, or those of Shallow, or Mr. Hightower; we seem to pose an enormous “threat” to the mighty US shale oil business to you and your equally minded friends.
You want me, and thousands like me, out of the oil business completely so your shale oil “business” can have a greater market share in America. Your ‘business’ is driving little guys like myself out with borrowed capital it will never pay back. Some might correctly liken that to stealing.
On the other hand, I would simply like the shale oil industry to pay back it’s student loans and to manage my country’s last remaining hydrocarbon resources responsibly. To play fair. To stand on it’s own two feet.
Which of us has the moral high ground?
Mike,
Your moral one-upmanship fails miserably.
And the reason it fails miserably is this: For every person like you, shallow sand, texas tea or myself who higher oil prices would help, there are 99 people they would hurt.
My 80 year-old sister and 84 year-old brother-in-law, for instance, are extremely happy with $1.95 gasoline, and have no qualms about telling me so if I begin bemoaning the low oil prices. (Incidentally, they bought one of the first Toyota hybrids that came out when gasoline prices were around $4 per gallon and rising. But for their latest new car purchase they switched back to a fully ICE model because the hybrid economics just don’t work with gasoline prices in the low $2 range)
Mounting that moral high-horse of yours may provide you with some emotional conpensation for your losses, which I’m sure are significant and difficult for you to accept. But most neutral observers can see your moral one-upmanship for exactly what it is: self-interest pleading.
Hey Mike, I find it somewhat amusing that this troll has managed to irritate the two main groups of people that comment on this web site, the petroleum guys who mostly comment on the oil related posts and the renewable advocates who mostly comment on the non-oil threads.
In a comment further up, I stated that my agenda is to advocate that the necessary measures be taken to prevent the worst scenarios put forward by the Hirsch Report (Peaking of World Oil Production: Impacts, Mitigation, and Risk Management) from playing out.
Cheap petroleum and NG do nothing to promote or encourage a transition away from oil in the transportation sector and the fact that the current state of affairs has been reached by pissing away billions of dollars of other peoples money does not sit well with me either.
On the other hand, PV manufacturing outside of China is struggling to survive as Chinese outfits have set up huge amounts of manufacturing capacity with the encouragement and assistance of their government. There is a strange parallel between this situation and LTO in that many of these huge Chinese operations are losing money, huge amounts, in some cases massive amounts. In the process they have precipitated a steady stream of news of bankruptcies and closures of many long standing western PV manufacturers, SolarWorld being the most recent. (See SolarWorld says it’s insolvent; fate of Hillsboro factory unclear)
On one hand the livelihoods of honest hard working people outside of China involved in PV and associated manufacturing are being threatened by the actions of Chinese businesses in collusion with the Chinese government. In your case, your operations are being threatened by American operations with the collusion of Wall St.!
In the case of PV manufacturing the state of affairs serves to further my agenda and encourage a transition away from oil (Jamaica generates over 90% of it’s electricity using plants fueled with Bunker C fuel oil). In the case of LTO, cheap petroleum has lulled the world into what I consider a false sense of security, with many people dismissing Peak Oil as a figment of our imaginations. That in no way supports my agenda.
If billions are going to be pissed away, I would rather see them pissed away on infrastructure that will be useful when global oil production starts to decline in earnest than on extracting oil at artificially low prices to be burned in pursuit of folly.
I would rather see people like you doing well than the CEOs of companies operating on the basis of huge amounts of debt, even if it means paying more for fuel (and in the case of islands electricity as well) but, it seems that the troll and team Koch want to do anything that discourages a transition away from oil and other fossil fuels at any cost.
Right now the foxes are in charge of the hen house and team Koch is firmly in control of this president and his administration. I fear this will not end well!
islandboy,
So I’m wondering, which group of nefarious conspirators was it that caused Tesla’s stock to be priced into the blue empyrean?
After all, if Pioneer Resources stock were valued like Tesla stock, Pioneer would have a market cap equal to that of ExxonMobil or Chevron. But it doesn’t.
So what caused Tesla’s stock to be valued so highly?
Was it those evil Koch Brothers?
Was it the evil shale industry, working hand-in-glove with their evil co-conspirators on Wall Street? You do claim, after all, that Mike’s “operations are being threatened by American operations with the collusion of Wall St.!”
Or was it the evil Chinese?
Please enlighten us. Inquiring minds want to know.
Hi Glenn,
You are likely correct that the RRC would never restrict output. I didn’t realize the commissioners were elected.
We will just leave controlling the oil market to others (OPEC and other oil producers that want to participate), as has been the case since 1971.
Hey maybe OPEC and the non-OPEC nations joining in the recent cuts would raise their prices for US customers, as long as the US does not want to control its own output. 🙂
Hi Glenn,
No most of us here agree with Mike, not you.
You sound like a used car salesman, Mike on the other hand sounds like the real deal.
Clearly I don’t speak for everyone who posts on this blog.
But people like you require the ignore feature that some blogs have.
Excuse me what does the price of Tesla stock have to do with anything? Trying to change the subject are you?
OK. Since you want to talk about Tesla.
Each vehicle Tesla sells is sold for significantly more than it cost to manufacture. However Tesla as a company is currently operating at a loss because it is expanding the scope of it’s operations at a frenetic pace.
Tesla is in the process of building the largest battery factory on the planet in order to supply enough batteries to build more than 500,000 cars a year.
Tesla has built and continues to build out it’s own private network of high speed charing stations, currently numbering 887 with 42 under construction and 21 having been permitted. These stations exist in the USA, Canada, Mexico, the UK, Ireland, all of Western Europe except Portugal, Russia (Moscow), China, Japan, South Korea, Australia, New Zealand, Jordan and the UAE.
Tesla is opening more showrooms all over the world.
Tesla has over 400,000 US$1,000 deposits for it’s new, more affordable model and is on schedule to begin ramping up production having retooled it’s Freemont facility to be able to produce half a million cars per year.
First customer deliveries of the new, more affordable model are on track for the third quarter of this year.
Tesla has acquired the German firm that does the automation of car factories. Hence they are also making the machines that make their machine.
Tesla has built an Apple like brand cachet around their cars. It is the new cool brand.
What was your question again?
Low gasoline prices may make the public happy, but they won’t sustain the oil industry. So touting low oil prices to people in the oil industry won’t find a good reception.
And touting low oil prices will keep away investors and lenders.
That’s the positive side for someone like me who wants to see certain projects not started, or abandoned. Keep those prices low enough that it isn’t worth it to anyone to try to get the oil and gas out.
Stop and think about it. What does a LTO company have to offer investors?
Is the narrative this: Years of oil priced so low that the company can never make money?
Whenever these companies lower the break even price (not that they actually break even), the price of oil also goes down, so unless they can get their break even price down to next to nothing, they continue to lose money.
It’s just not a business model that has much appeal to investors now.
I was thinking of posting this but the troll beat me to it! That sort of thinking does not sit well with his backers, the Happy Billionaires pictured below. Whether he is on their payroll or not, he couldn’t be doing a better job of pushing their agenda.
Islandboy,
So you earnestly believe passage of something like the Connally Hot Oil Act would be politically possible these days?
Connally Hot Oil Act of 1935 Top # 7 Facts
https://www.youtube.com/watch?v=KdJxN8cftYo
Well, not after your team spent $900 million this past election cycle and has carried out a decades long brainwashing and propaganda campaign that has successfully convinced poor rural voters that their interests are the same as theirs. They have been so successful that they have got their pet turtle elected and re-elected to the point he is now senate majority leader, not to mention the snowball man and a few others that are in the government to do their bidding.
Your team set up “think tanks” like the Heartland Institute and the Institute for Energy Research (who’s rubbish you have been known to cite) among others to spread their idea of the American dream and create the idea that there is not a scientific consensus on global warming. So yeah, considering your teams long and expensive but, successful con job, almost nothing they oppose is “politically possible these days”. Pat yourselves on the back! You guys make Goebbels look like a kindergartner.
islandboy,
So let me get this straight.
The green lobby and its public relations campagin lost in the courtroom of public opinion.
And as it was losing, the green lobby just sat on its hands. It and the MSM made no effort to tell the public its side of the story.
And furthermore, the green lobby and the MSM were so hopelessly outgunned by a handful of think tanks funded by the evil Koch brothers so as to make the green lobby’s and MSM’s efforts futile.
Meanwhile, the public is made up of hapless, ignorant masses that can easilly be led around by their noses like a bunch of trained goats. So they need elite thinkers like you to tell them what to think, what to feel, what to believe, and who to vote for.
Does that pretty much sum it up?
Yup! Except that the vast majority “the public” do not giver a flying fuck about anything that does not affect them right here right now and are content to latch on to the latest bit of misinformation if it gives them more peace of mind. Concepts like Peak Oil, Global Warming, depletion of fisheries, species extinction, pollution etc. are way of their radar. You expect people who know the names of Beyonces new twins or the state of Kim Kardashian’s marriage to Kanye West or the latest news on Caitlyn Jenner (aka hapless, ignorant masses that can easilly be led around by their noses like a bunch of trained goats) to give a rats ass about the fate of some endangered species or the other?
Your team knows that the public can be manipulated fairly easily using mass media. Who owns most of the MSM? Your Team. Have you never heard of “Manufactured Consent” or is Noam Chomsky to liberal and left leaning for you?
The sad thing is that the consequences of the actions of your team are not that a rising tides lifts all boats, it’s that rising sea levels floods all
low lying areas equally, regardless of political persuasion.
As it turns out, according to polls, the majority of Americans believe in climate change and support the Paris Accord. I could pull links to that info, but unless anyone is unconvinced, I’ll leave it at that.
However, the elections don’t appear to have been motivated by those concerns, yet.
I don’t understand why the Kochs want to spend so much of their money to a create a world that is not likely to make economic sense. Yes, they own heavily polluting industries and don’t want to deal with regulations, but hell they could clean up those industries or shut them down and have more money than they know what to do with.
I believe their mouthpiece organizations have been sending trolls to places like this to discredit climate change and renewable energy, but global sentiment is going the opposite direction on both of those, and the Kochs can’t stop it, at this point.
I hope they lose considerable money with their political efforts. At least we have Mike Bloomberg to use his money to promote the opposite viewpoint.
Here’s one problem with the Koch, fossil fuel approach.
Fossil fuels and global warming are international issues. The Kochs may want to control the narrative, and they may try to put their politicians in office, but they can’t control global energy prices, they can’t control strategic energy decisions in other countries, and they can’t stop research in other countries.
The “rah rah” coal, gas, and oil posts here don’t influence those who seek out research on their own.
The Kochs can spend all the money they want, but there are limits to what they can accomplish.
India oil. Found some assay info.
Bombay High field seems to be API 28, some parafin. 300K bpd. This is offshore 100+ km west coast. Been flowing over 10 yrs.
Mangala is onshore, API 27, viscous and feeds what is apparently the longest independently heated pipeline in the world cuz of the wax. Much talk of lots of parafin. I didn’t find exact refinery yield but other items mentioned suggests rich in middle distillates. Pushing 200K bpd.
These are the two majors and most of the 880K bpd India flows.
Both fields in decline as is India.
Peak oil demand, pure fantasy at the moment.
The theory in 2005 was that electric vehicles will become very cheap very soon and everyone will see the error of their ways and buy an electric car.
12 years on and the reality could hardly be more different.
http://online.wsj.com/mdc/public/page/2_3022-autosales.html
The biggest sellers are the powerful pickup trucks that Oildrumisters said would be given away with corn flake tokens by 2010.
The fact is vehicles like these
http://www.ford.com/trucks/f150/2017/models/f150-platinum/
have great appeal. They give people a sense of power and a feeling of being able to go anywhere.
As apposed to this.
http://www.chevrolet.com/volt-electric-car
Which is very sensible but unfortunately does not inspire many people.
https://cleantechnica.com/2017/05/09/5-months-chevrolet-bolt-sales-numbers-tell-us-far/
The number speak for themselves, volts sell less than 2,000 per month and Ford F series sell 76,000 the ram and silverado selling in the mid 40 thousand.
In 12 years nothing has changed enough to make any real difference, and the wishful thinkers are still wishing. Maybe they stay so positive because they cannot remember what they said 10-15 years ago?
BaJesus Jan, your like a 16 year old boy at the drive-in on date night. How about a little turbo hybrid aluminum body foreplay before we go all electric.
Nahhh, he wants to go directly to carbon-fiber/direct PV powered butt movers.
Good one HB, no patience in the young ones. They believe advertisements too. 🙂
I am simply stating what reasons people give for buying certain vehicles.
So electric vehicle and hybrid sales number in the low thousands.
And internal combustion vehicle sales number in the millions.
Now that’s truly “Change you can believe in!”
Maybe you should look at the bigger picture and a longer time frame…
U.S. car sales from 1951 to 2016 (in units)
https://www.statista.com/statistics/199974/us-car-sales-since-1951/
In 2016 there were 7,105,162 units sold.
In 1951 there were 7,465,000 units sold.
The highest number of units ever sold in the US was in 1986, at 11, 404,239
BTW, it might also be of interest to note that the US population in 1951 was 155,000,000 While the current population stands at about 325,000,00.
https://www.forbes.com/sites/rrapier/2017/02/05/u-s-electric-vehicle-sales-soared-in-2016/#aa2cb10217f1
U.S. Electric Vehicle Sales Soared In 2016
Robert Rapier
Final numbers for electric vehicle (EV) sales in the U.S. were recently released for January. The 70% year-over-year increase in monthly sales continued the strong momentum from 2016. Following a 5% decline in sales from 2014 to 2015, U.S. EV sales jumped by 37% in 2016.
Maybe someone here has the patience to teach you about compounding growth rates before the Zombies eat what little brains you have…
https://www.youtube.com/watch?v=3jvFAYxvvlQ
Math Exponential Growth Formula – Zombie Style
Since oil prices, and concomitantly gasoline prices, took their big nosedive beginning in November 2014, it looks like things haven’t worked out the way the peak oil faithful had predicted.
Gasoline is about as low in cost as it has been in years here, once I subtract the newly added state tax. Subtracting the new tax and leaving the old one in place puts regular gasoline below $2 a gallon. During the big dip it only reached that level for a short time. For a car like the non plug-inPrius that is less than 4 cents per mile, about equivalent to an EV. Still, EV’s are running about half the cost per mile for energy than the average ICE car.
I get over 16.5 million annualized auto and light truck sales in the US , with April 2017 selling 4.6 million auto units annualized rate. From FRED. That is a big surge in light trucks.
Considering the relative price of light trucks that is a lot of debt building.
Considering the relative price of light trucks that is a lot of debt building.
Rednecks are dumber than rocks and Glenn Stehle is dumber than a redneck with an ideological agenda!
Fred,
I don’t have an “ideological agenda.”
I have an economic agenda.
And for someone in my position, and given current events….
I have an economic agenda.
Apparently you don’t seem to know squat about economics either!
https://cleantechnica.com/2017/06/16/lyft-aims-100-renewable-energy-self-driving-bolt-fleet/
Lyft Aims For 100% Renewable Energy & Self-Driving Bolt Fleet
June 16th, 2017 by Steve Hanley
General Motors makes the Chevy Bolt, a fully electric car. General Motors also has a half billion dollar investment in Lyft, the on-demand taxi service that competes head to head with Uber. In the future, the Chevy Bolt may be the backbone of Lyft’s fleet of autonomous driving cars, and those cars may be 100% powered by renewable energy.
Good night and sweet dreams to you Mr Stehle!
It is most definitely NOT morning in America for fossil fuels!
.
Fred,
Speaking of an “ideological agenda,” Lyft undoubtedly passes that test with flying colors.
According to company founders Logan Green and John Zimmer, Lyft’s goal “was to create a new kind of social ride-sharing, an attempt to decrease the number of cars on the road and to improve congestion, reduce humanity’s environmental footprint and create more efficiency in transportation.”
But when it comes to an economic agenda, the company hasn’t been able to pass that test:
•••••Lyft is said to seek a buyer, without success
https://www.nytimes.com/2016/08/20/technology/lyft-is-said-to-fail-to-find-a-buyer-despite-talks-with-several-companies.html?mcubz=1
•••••Lyft Suffers Big Time With $600 Million Loss in 2016
https://www.marketsmorning.com/lyft-suffers-big-time-with-600-million-loss-in-2016/
Maybe they don’t need a buyer now.
http://nypost.com/2017/06/12/jaguar-land-rover-pumps-25-million-into-lyft/
http://www.motortrend.com/news/jaguar-land-rover-invests-25-million-in-lyft/
Hi Glenn,
So Lyft lost about the same amount as Pioneer Natural Resources in 2016 (556 million)?
Redneck wood burning to save money.
Spend $40,000 on a truck to haul it. Spend $500 on a chain saw to cut it. Don’t buy any protective equipment. Spend $1000 on a splitter to split the wood.
Spend $1000 on the stove and pipe.
Don’t get a permit.
Spend much of your spare time finding, cutting, hauling, splitting and feeding/cleaning the stove.
Smoke out your neighbors because you overfill the stove with green wood.
Yep, more savings there than a bass boat.
Glenn Stehle’s Good Morning in America economic agenda…
In the midst of the current recession, two redneck farmers get together and come up with a way to improve their sales. They will collect watermelons from all the surrounding farms, pay the farmers 50 cents per melon, and then sell them at local markets in the area.
They rent a truck, drive out to several farms and load up the truck with the watermelons they purchase.
Next, they drive to the big city, some 400 miles away. At the market, they sell the melons, 2 for $1.
It doesn’t take long for them to sell the entire truckload.
On the way home one farmer says to the other, “You know, we really didn’t make too much money. How do you figure it?”
The other one answers, “We gotta get a bigger truck.”
My suggestion would be that they buy a whole fleet of giant trucks!
Hi Fred,
There are some very nice people who live in rural areas (including me) who find being called a redneck kind of insulting.
A little less heat and more light is preferred by most of the readers here.
Of course if someone behaves like a donkey feel free to call them out using any name you wish.
I have a bunch of friends that drive pickup trucks, all very nice people and none that would fit the description “redneck”.
Thanks.
Sorry Fred,
The post above should have been addressed to Gone Fishing.
Dennis,
Choosing to be insulted is your choice and yours alone. Grow a thicker skin.
Around here, rednecks are good people, the kind you want by your side if you have to stand and fight.
Can’t say the same about the cornucopians, investment promoters, and renewables advocates hereabouts. I doubt they would be much help when things got tough. But maybe they could conjure up an electric personal transport to whisk them away.
Jim
Hi Cracker,
It was not me that was insulted by the term.
Someone else mentioned that not all people from rural areas appreciate being referred to as a “redneck”, which some take as a pejorative associated with racism.
You might be proud to be called that, some are not.
I really think it’s better to attempt politeness and don’t really care what kind of vehicle someone drives whether its an f150 or a sierra matters little to me.
It was me. I don’t really care so much, but I suppose those that are trying to promote certain agendas at least ought to think about the words they chose if they are trying to build a consensus.
I live in a rural area that has numerous engineers, as wells as doctors, attorneys, teachers, college instructors and many, many other people with bachelors and higher degrees. Labeling all rednecks is ridiculous, especially when many of my community’s residents hail from urban and suburban areas, but chose to live here.
Then, of course, you have the many people from my community who now live in major cities all over the United States. Are those folks still rednecks?
The Democrats have totally lost rural America, got absolutely hammered out here. Not everyone who voted R is an uneducated rube, believe me, I listened intently to those who surprised me that they switched.
Sorry for non-oil post. Just seems our country is rapidly losing civility and respect for each other. We seem to be bigger and bigger on shouting, “I am right and you are wrong.”
I truly miss civil and rational discussion of facts. I also miss the idea that we are all individuals that do not fit in a well defined box.
I came here to discuss productivity and profitability of LTO. It is very interesting how political oil is, I guess it always has been.
Hi Shallow,
Oil was politics short after it was discoverd, the whole asian part of WW2 was about oil for example.
Oil is military power, and military power regulates access to oil. Without oil no air superiority. Nuclear energy don’t work here, even fusion won’t help.
This extreme coutryside / town difference I noticed when I was in the USA, too. The democrats where very hated on the countryside. I was there on a business trip, so only educated people I met there longer.
What’s the actual opinion about Trump in the USA? Here in Europe the press only produces one horror story after the next.
Hi shallow sand,
Your input is certainly appreciated by me and I believe most here.
Unfortunately due to the length of the post and that it covered both petroleum and non petroleum subjects I decided to leave it as Minqi Li originally composed it.
The Non-Petroleum thread does tend to be much less civil and that has been apparent here.
Hopefully people will realize that alienating others does not tend to build consensus, but simply reinforces the polarization that currently exists.
If I banned everyone with occasional poor behavior, the blog would probably not be worth reading (there would be very few left to participate).
Hi Eulenspiegel,
It seems about half the country loves him and the other half not so much.
Very roughly, the people on the coasts don’t like Trump very much (with the possible exception of parts of the Atlantic coast from North Carolina to the south.
A lot of the middle of the nation supports Trump, with a few pockets to the North that may not like him much.
Fred
Maybe you should find out the correct facts first and then write, rather than the other way around.
https://tradingeconomics.com/united-states/total-vehicle-sales
Many people in the US are buying pickup instead of cars. They are not in the car sales so you missed out half the sales. The important half.
Those are actual monthly sales, need to multiply by 12 to annual sales for comparison to total auto sales figures. Last year they sold over 25,000 Chevy Volts.
Total 2016 hybrid sales were about 350,000, which is about 7 percent of auto sales.
Gonefishing
350,000 is not 7% of auto sales.
https://www.statista.com/statistics/199983/us-vehicle-sales-since-1951/
17,464,600 vehicles sold in the States. So hybrids are just under 2%.
When it comes to pure electric vehicles.
https://www.statista.com/statistics/199983/us-vehicle-sales-since-1951/
Nissan leaf is number 184. More Porsche Cayennes are sold. All in all electrics do not meet the expectations of most people. Sales will not improve until the vehicles get cheaper and better.
Well the good news there is that the F150 has almost doubled in fuel efficiency in that timeframe (13-26mpg roughly). Technological progress is not limited to EVs. The fact remains, though, that EVs are about four times as efficient as ICEs, so when we check back in ten years and find sales of F150s are still high, it’ll be alright because they’ll be EVs getting over 100mpg equivalent. Imagine a pickup truck that you can plug all your power tools into, a kind of mini shop that goes directly to the job site. I guarantee you Ford is working on it.
Good ideas SH.
The bed cap will be covered with high efficiency PV and support the battery/tools system.
There is so much incredibly disruptive technology heading into the transportation field, one hardly knows where to begin.
Tiny outfit out of Utah, Nikola Motor, claims it is ready to introduce class 8 (big, over the road) trucks into the market that are completely electric. Uses hydrogen cell or some such.
Marketing pitch will be no sales, only monthly leases that include one million miles free fuel.
Daimler, VIA Motor, Tesla are all furiously pushing forward to capture market share for electric trucks.
The CNG approach is rapidly picking up momentum with all the low pressure applications that are possible via Adsorbed Natural Gas (ANG).
An entire mini industry is springing up including tank manufacturers, auto makers – Ford, in particular – virtual pipeline companies transporting natgas in bulk over the road …
Whatever evolves from all this is uncertain, except it is apt to be very different from today’s world.
QATAR GIVEN 10 DAYS TO MEET 13 SWEEPING DEMANDS BY SAUDI ARABIA
https://www.theguardian.com/world/2017/jun/23/close-al-jazeera-saudi-arabia-issues-qatar-with-13-demands-to-end-blockade
The onerous list of demands includes stipulations that Doha close the broadcaster al-Jazeera, drastically scale back cooperation with Iran, remove Turkish troops from Qatar’s soil, end contact with groups such as the Muslim Brotherhood and submit to monthly external compliance checks. Qatar has been given 10 days to comply with the demands or face unspecified consequences.
MbS vs Erdogan and Iran: unlikely to end well. I can’t help thinking this wouldn’t have got this far with any half way competent administration in the USA, or in fact anyone other than the narcissistic buffoon there now. But as someone (I think here) has pointed out, he is a consequence rather than a cause, so someone like him (and MbS and Erdogan) was inevitable, and probably more to come as climate change, resource limits and overpopulation continue to bite harder, and the elites up the ante to hang on to what they’ve got and get more.
From the Guardian:
Talk about the pot calling the kettle black!
Really, you couldn’t make this stuff up.
Really, you couldn’t make this stuff up.
Sure you can!
If you’d like I can photoshop you into the picture as well!
From the Guardian:
Do you reckon “the allies” will be “pushing for the isolation of Iran and the suppression of dissenting media” in Europe and the Americas as well?
HispanTV, an Irani-owned Spanish-language TV station that operates out of Spain and that has gained some popularity here in Mexico, might become a target for the “suppression of dissenting media.”
From the Guardian:
Or a pivot away from US/NATO towards China’s New Silk Road?
That choice might not be such a bad tradeoff for Quatar, especially since Turkey’s pivot towards the New Silk Road makes the prospects for a terrestrial pipeline connecting Quatar’s vast natural gas resources to the European market a rather remote possiblity.
Turkey’s pivot towards the New Silk Road, by the way, happened on Obama’s watch, not Trump’s.
China pledges $124 billion for new Silk Road as champion of globalization
http://www.reuters.com/article/us-china-silkroad-africa-idUSKBN18A02I
This is probably a bit over the top, or maybe just a few months early:
CANARY IN THE COAL MINE: UNFUNDED LIABILITIES HAVE TURNED ILLINOIS INTO A “BANANA REPUBLIC” ON THE BRINK OF BANKRUPTCY
http://www.shtfplan.com/headline-news/canary-in-the-coal-mine-unfunded-liabilities-have-turned-illinois-into-a-banana-republic-on-the-brink-of-bankruptcy_06222017
Illinois is the perfect example of what happens when your state is run by fiscally irresponsible dunces for decades. The state is buried debt, and hasn’t passed a budget in over 700 days. 100% of their monthly revenue is being consumed by court ordered payments, and the Illinois Department of Transportation has revealed that they may not be able to pay contractors (who are working on over 700 infrastructure projects) after July 1st if the state doesn’t pass a budget. To top it all off, the state’s credit rating is one step away from junk status, the lowest of any state. Because of these factors, Illinois may become the first state to declare bankruptcy since the Great Depression.
So when does Trump foreclose?
One more time.
There will be no deaths sweeping the US because of money. State budgets, federal budget, whatever. There aren’t going to be any scythes cutting through the population and killing millions because of a substance created from thin air via QE. If people are going to drop like flies, there will simply be more QE — and a pretense that everything is fine and normal it’s merely a one time event and all the assets denominated in that substance that elites hold retain their status.
The scythe will be oil scarcity. Oil scarcity is an equal opportunity killer via starvation probably derived from oil motivated war.
You mean the cuts to Medicaid won’t cause excess illness and death. Increases to taxes on the poor and lower income people were already in place, expect more.
Watcher, we are enjoying peak oil right now, give us a couple of more years at least.
We can always convert Western rock grease to oil if we have to. 🙁
Good thing we have EV’s.
LOL.
Please read the one star reviews for Skurt from Yelp.
https://www.yelp.com/biz/skurt-los-angeles-7
I rest my fucking case!
I really don’t give a flying fuck about your case and whether or not Skurt or any other business gets a good or bad review on Yelp or anywhere else for that matter! That is completely irrelevant to the point that car sharing businesses are popping up all over the place and they are highly successful. Case in point the CEO of Uber just resigned, yet Uber, despite a drop in valuation is still worth about 70 billion dollars. Not bad for a business model or a company that didn’t even exist before 2009. Private car ownership is going to go the way of the Dodo, future cars will all be driverless and will be powered by electricity and they will be shared. That is already happening whether you fucking like it or not!
Fred,
“Car sharing businesses are popping up all over the place and they are highly successful”?
“Highly successful,” like Uber you say?
When it comes to an “ideological agenda,” Uber certainly seems to live up to your claim of being “highly successful.”
But when it comes to a money-making agenda, it misses the mark by a mile.
Can Uber ever make money?
Ride-hailing company’s new CEO will have to stem billions of dollars in losses
https://www.ft.com/content/09278d4e-579a-11e7-80b6-9bfa4c1f83d2
Just like LTO. As long as investors keep pumping money into a company, it keeps going.
You might want to read Douglas Rushkoff’s book, ‘Throwing Rocks at The Google Bus’, to get a better understanding as to why for example companies like Twitter, based on a 145 character app, that pulls in a half million dollars a quarter, 2 billion a year, is still considered an abject failure by Wall Street.
It doesn’t mean that Twitter is a bad business model. It means the system in which all companies currently exist is by design an unsustainable growth based system and it will not continue long term, ‘The System’, that is, not the individual businesses.
It also explains why Winco Foods can beat Walmart in terms of quality of it’s products, offer better prices, all while offering living wages, health care, paid vacations and profit sharing to all it’s employees. Hint, they don’t have shareholders and don’t have to pay dividends or support venture capitalists.
Even if Uber and Lyft were to go out of business, which I highly doubt, then there are still plenty of other ride sharing service companies that will jump in to fill the niche. Ride sharing services are here to stay! The current system? Maybe not…
Cheers!
UBER IS LOSING AN ABSOLUTELY INSANE AMOUNT OF MONEY
http://www.vanityfair.com/news/2017/04/uber-is-losing-an-insane-amount-of-money
But as long as someone is willing to fund it, it will keep going.
Sometimes that strategy works (as in the case of Amazon) and sometimes it doesn’t.
It’s Wall Street you need to win over, not us. Right now investors are more enamored with tech companies than with energy companies.
But as long as someone is willing to fund it, it will keep going.
Just like the Permian Shale Companies.
Yes, exactly.
For investors in shale drilling, the party’s over
(The con men could only get the rubes to go along for so long)
http://www.chron.com/business/energy/article/The-party-is-over-for-investors-in-U-S-shale-11242266.php
Which is something the likes of Glen Stehle and clueless will never admit…
Actually, when it comes to shale, Glenn and clueless posts and views set forth therein have had almost nothing in common.
Sounds like they have an even greater absolutely insane amount to lose…
I’m not sure what your problem with car sharing is. You didn’t know it existed and now you find the reviews from one company in LA (which has an average of 2 1/2 stars, rather than just one star reviews) and think you have a made a case. And this company is competing with traditional car rental companies rather than car sharing companies because people rent cars by the day, not the hour.
Skurt has raised a $10M Series A to grow its rental car delivery service | TechCrunch: “Renters only need to be 21, and more than 80 percent of Skurt’s customers are millennials. Unlimited miles are included with each rental; prices range from just $21 per day for a sedan to $59 per day for a luxury car.”
You guys just do not get it. You must be very rich businessmen. Look, say you opened a restaurant and served 500 people. 250 people raved about it and gave 5 stars. The other 250 ended up in the hospital.
The point being, there is almost no in between. It either works perfect, or it is a total disaster. I do not see it working well until all the cars are driverless, if then.
Further, Fred is the typical asshole. If he thinks an idea is good and someone else does not (which does not mean that I would not like it at some point), he takes it as a personal assault on him, so he has to start calling names.
But it doesn’t matter if Skurt succeeds. It’s just one of many car rental companies. It is going against Avis, Thrifty, Hertz, etc.
The rental car model works even if this company doesn’t succeed.
You guys just do not get it…
No you are the one that doesn’t get it! You are saying that restaurants aren’t a viable business model because somewhere someone gave a restaurant a bad review. Either all restaurants are five star or the idea of restaurants just won’t work!
If pointing out that you are clueless, makes me an asshole then so be it!
Regardless, what I think has no bearing whatsoever on the existence of successful car sharing companies or successful restaurants.
Article on the Texas electricity market- (try to ignore the headline spin)
https://www.bloomberg.com/news/features/2017-06-20/texas-is-too-windy-and-sunny-for-old-energy-companies-to-make-money
Rune has posted here before, hasn’t he?
Oil Prices To Stay Low If Global Credit Impulse Turns Negative | OilPrice.com
Hi Boomer II,
Yes, Rune has great stuff, and he posted here at least once.
http://peakoilbarrel.com/bakken-nd-now-mostly-mckenzie-county/
Posted without comment – Okey Dokey .. what a whopper !
“President to flag historic shift as U.S. becomes net exporter”
Exporter of Credit? Can one fix stupid? – Gotta bring m Russians to their knees….. Long blockchain coins?
https://www.bloomberg.com/news/articles/2017-06-25/trump-to-call-for-u-s-dominance-in-global-energy-production
“Ironically, some of Trump’s policies could exacerbate the market challenges facing oil, gas and coal, by spurring more domestic production at a time when a supply glut is already suppressing prices.”
“The U.S. is on track to produce 10 million barrels of oil per day on average next year, according to a forecast from the Energy Information Administration — a milestone that would shatter a record set in 1970.”
And what will that do to oil prices?
US oil production declined last year. Per the Bible. The link to the BP spreadsheet has been posted before.
Production was down, consumption up.
And of course price is down.
I wonder who will be buying more coal from the US.
Asia and the Fall of Coal | The Diplomat: “In 2015, though, things dramatically changed. China’s coal imports plunged 30 percent, and fell even further last year. Now, plants are being closed and construction is being idled across the nation. But what really stunned observers was that India did not pick up the slack. There, solar is booming and already at cost parity with coal, and the industry is going through turmoil. Earlier this month, the government of India’s most populous, energy-hungry state, Uttar Pradesh, announced the cancellation of more than 7,000 MW of coal power plants.”
China’s coal imports resumed strong growth this year
Hi Minqi,
Is there consumption data also? Has production decreased while imports have increased? Or has coal consumption also grown strongly.
Have you seen the article below:
https://www.americanprogress.org/issues/green/reports/2017/05/15/432141/everything-think-know-coal-china-wrong/
Demand to ship gasoline on top U.S. pipeline at six-year low | Reuters: “The operator of the biggest U.S. fuel pipeline system said on Thursday demand to transport gasoline to the country’s populous northeast is the weakest in six years, the latest symptom of a global oil market grappling with oversupply.”
Being fat and blaming forks?
“The biggest problem our industry faces today is you guys. You don’t reward capital efficiency, you reward growth. When you guys stop rewarding growth and reward capital efficiency, guess what — and the share prices react, people will stop chasing growth for growth’s sake. As long as investors continue to invest in companies with growth with marginal wellhead economics, you’ll get more growth. So you guys can help us, help ourselves. This is kind of like going to AA. We need a partner. We need somebody to sit through that class with us, but we do. I mean, we really need the investment community to show discipline, just like you’re asking us, I think, appropriately so in this environment, to show discipline. We need you to be disciplined in the way you allocate your investment dollars because first off: a) most of you are not getting big funds flows right now; b) you’re underweight in energy because you’ve made sector bets that are probably a better place to be than energy in the foreseeable future, and those of you that are in energy that want to stay in energy you are probably doing some securities rotation right now. All of that’s understandable. So just think about trying to look at situations where capital efficiency actually can be rewarded and that’s not a company-specific comment, it’s more of a generic, because the more the capital-efficient companies are rewarded in the marketplace and growth is not, then you guys will help us help ourselves and we’ll be in a better place, but if you keep rewarding growth without return, you’re just going to help compound the problem that we have today, where I think a lot of us feel very much in need of showing growth because if you’re a growth and value investor, you need to see little bit of both.”
Yes. The gentleman that is responsible for this statement is yet another gate keeper of America’s hydrocarbon future. His company has $15.3B in debt https://www.zacks.com/stock/chart/APC/fundamental/total-long-term-debt-quarterly. During his tenure his company traded at a high of $112 dollars a share (8.14) to a low of $45 and some change last week and he lost another $300M for his shareholders 1Q17. Does that sound like capital efficiency? His total compensation in 2016, however, was $15.6M. He is blaming Wall Street for loaning his company too much money. Pathetic, uh?
This is what several of us have been saying about the shale boom for awhile now.
Interesting comments from a shale CEO.
A part of the US domestic oil industry to truly admire and cheerlead for…but only if you are a CEO with that kind of annual compensation, or a royalty/overriding royalty owner receiving mailbox money.
There is a piece from the WSJ re-posted over at Peak Oil dotcom titled “The Shale Revolution’s Staggering Impact”.
Author talks about NGL production and touched upon many very salient topics.
One data point, the US export value of raw and refined NGL products will rival Saudi’s oil revenue in a decade’s time.
Another aspect, not stated, is the relative economic context these petrochemical plants project in comparison to, say, a professional sports stadium.
In this country, local governments frequently go nuts in offering enticements to professional sport teams by way of subsidizing the building of stadiums.
At $250 million a stadium, 25 could be built for the cost of a single $6 billion plus petchem complex.
Many of the bigger ones cost upwards of $10 billion.
The biggest petrochemical companies in the world are rushing to build in the US and/or purchase the ethane/ethylene or propane/propylene that is emanating in massive quantities from the US shale fields.
Worldwide manufacturers, including the infamous Foxconn, are relocating manufacturing plants in the US to take advantage of the world’s cheapest feedstock along with methane- fueled low electricity costs.
http://oilprice.com/Energy/Crude-Oil/The-World-Is-Millions-Of-Barrels-Away-From-Peak-Oil.html
”Oil consumption in 2016 represents a new all-time high in global oil demand” and occurred despite the fact that global EV sales grew at a 41% rate in 2016 to reach nearly 800,000 vehicles (Source: InsideEVs). The growth over the past decade also took place during a time that global biofuel production increased by over a million BPD. (I can recall many who suggested ten years ago that growth in biofuels would lead to peak oil demand).
Related: Underperforming Energy Sector May Soon See M&A Wave
Underlying oil demand is growing for several reasons. The population is growing, the middle class is growing, automobile sales in developing countries are growing at a blistering pace, and the number of miles driven is reaching all-time highs.
The implications are clear with respect to the peak demand argument. While many proponents are pushing the notion that peak demand is imminent, growth in EVs thus far hasn’t even been able to slow down oil demand growth.”
“The bottom line is that even in a best case scenario for EV growth rates, demand for oil rose by 1.6 million BPD last year, and it’s projected to increase by 1.4 million BPD this year. It will take a few years of rapid EV growth to halt the growth rate for oil, and what that means — and what many peak demand proponents don’t get — is that peak demand for oil is going to be millions of BPD higher than current demand, and it’s almost certainly going to take place beyond 2023.”
I think a slowdown in global economic growth will be the deciding factor in demand. If there isn’t enough money to buy more vehicles and oil, demand will hit a wall.
Sounds like a great idea, keep on doing things wrong then amplify that. How is selling our resources to other countries benefiting us? Is an oil importing country supposed to export to meet foreign demand. Makes no sense.
Well this graphic kinda speaks for itself…
.
Too many facts Fred.
LOL! I figured in the simplified world of Trump briefings a simple graphic would suffice…
Uber and Tesla are showing ominous signs that the era of auto disruption may be about to come to an abrupt end
http://www.businessinsider.com/uber-tesla-waymo-struggle-to-disrupt-auto-industry-2017-6
Hi Glenn,
Yes that sounds just like what some were saying about LTO in 2008.
http://www.theoildrum.com/node/3868
From the conclusion section:
3. Because of the highly variable nature of shale reservoirs, the characteristics of the historical Bakken production, and the fact that per-well rates seem to have peaked, it seems unlikely that total Bakken production will exceed 2x to 3x current rate of 75,000 BOPD.
So a peak of about 150-225 kb/d was expected in April 2008.
Later in August 2011 at the Oil Drum Heading out predicted the Bakken wouldn’t rise much higher than current levels (about 300 kb/d in July 2011).
http://www.theoildrum.com/node/8258
Later in Sept, 2012 in the famous “Red Queen” post by Rune Likvern he said:
Now and based upon present observed trends for principally well productivity and crude oil futures (WTI), it is challenging to find support for the idea that total production of shale oil from the Bakken formation will move much above present levels of 0.6 – 0.7 Mb/d on an annual basis.
http://www.theoildrum.com/node/9506
A month after seeing Mr. Likvern’s work as well as analyses by Paul Pukite (aka Webhubbletelescope) and James Mason, (Oct 2012), my first attempt at modelling Bakken output suggested a peak between 1000 and 1300 kb/d around 2015 to 2017 (depending upon assumptions). This was a lucky guess.
http://oilpeakclimate.blogspot.com/2012/10/using-dispersive-diffusion-model-for.html
Se especially that chart at the link below
http://2.bp.blogspot.com/-_OTRI-S7oRU/UGygOuHhKqI/AAAAAAAAAFc/gsY5NYnHvgw/s1600/bakken6.png
that chart has output at about 1150 kb/d with 11,000 wells completed for the North Dakota Bakken/Three Forks.
The point is that the future is difficult to predict and sometimes optimistic predictions prove correct, other times they are completely wrong.
Hindsight requires little skill.
Hi Texas Tea,
One has to be careful about confusing “liquids” demand with oil demand. If we make the simplifying assumption that over long periods that supply is approximately equal to demand and that crude plus condensate is what can be properly termed “oil”, then from 1974 to 2016 oil “demand” has only grown at an average rate of 0.9% per year compared to an average rate of growth of 6.5%/year from 1900 to 1973.
Oil prices are likely to increase markedly between 2020 and 2025 and this may slow the rate of growth in oil demand. The sales of EVs will take off (these can be SUVs, cars, and pickup trucks) and between 2020 and 2030 peak oil (C+C) demand may be reached and oil prices will start to fall if demand falls faster than supply. I expect this point will be reached by 2035, possibly sooner.
Dennis says “Oil prices are likely to increase markedly between 2020 and 2025”
Texas Tea says…. I hope the hell you are right?
Hi Texas Tea,
Maybe this time. I also hope I am right. My guess at real oil prices in 2017 $ below. About $100/b in 2024, I believe oil prices will be at least this high (a conservative oil price forecast).
… if the ten day time limit KSA gave to Qatar the other day to accept clearly untenable demands passes unresolved …
AND
the several nations – including mortal enemies – up the response to include armed conflict, we all will be lookin’ at $100 WTI in the rear view mirror in the blink of an eye.
Hi Coffeguyzz,
Yes that would mess up my nice chart. 🙂
Maybe we will continue to muddle through, perhaps not.
High oil prices will be here at some point, a gradual rise in oil prices would be easier to adjust to, we could probably handle a 25% annual increase up to $110/b without much difficulty (prices rise to $110/b from 2017 to 2020).
If prices double in less than a year, it is likely to be very disruptive.
FWIW: Applying a different twist, I think Global enough production is going to peak soon since World Population growth is peaking and will start declining in the 2020s if this chart is correct.
https://en.wikipedia.org/wiki/Population_growth#/media/File:World_population_growth_rate_1950–2050.svg
Its likely that as the world’s population demand for energy and consumer goods will decline. Generally Older people spend less compared to younger people that go out a buy a home, vehicles, raise children. In addition the digital ages is reducing the need for travel. Companies can perform teleconferences instead. Information workers can work remotely from home avoiding the daily commute.
Odd favor another major economic crisis, as the world use very heavy debt to expand production and its likely that further debt loads is going to cause retraction, as people, companies, and gov’t face the burden of servicing there debt. We also face a steep mountain of unfunded pension and entitlement liabilities that is likely to act as a double edge sword on the economy: higher taxation to fund aging populations and lower entitlement payouts forcing older workers to cut consumption.
While I do expect that gov’t will turn to Zero & Negative interest rate Policies and Quantitive Easing to avoid a global depression, its unlikely to fix the demography problems facing the world. Its likely that these financial gimmicks will make a tiny portion of the population extremely rich, it will leave the bottom 80% in poverty.
I also see that companies is going to need fewer workers as smart information systems and automation begin to replace workers. I think over the next 10 years at least 1/3 of American jobs will be replace by automation. Everything from retail jobs (salesman, clerks, cashiers) to higher paying jobs in IT,HR, Legal, Accounting, etc. With fewer people working, demand for energy, goods and services will also decline.
U.S. workers face higher risk of being replaced by robots
http://money.cnn.com/2017/03/24/technology/robots-jobs-us-workers-uk/index.html
Dire predictions for retail stoked by another bad week full of store closures and a looming bankruptcy
http://www.google.com/url?url=http://www.cnbc.com/2017/06/02/another-bad-week-for-retail-store-closures-and-a-possible-bankruptcy.html&rct=j&q=&esrc=s&sa=U&ved=0ahUKEwi-vs6PqdrUAhXh3YMKHbzeCLAQFggaMAE&usg=AFQjCNFgI5PaA0p0mTc884jzbG3DdvVMKw
[Its hard not a week than does not include some major retail store closing. All these people are losing their jobs and they are going to find it difficult to find a replacement retail job since the retail industry is in decline]
Aging America heading for disaster
http://nypost.com/2014/02/08/thanks-to-aging-population-its-all-downhill-from-here-for-usa/
[its not just the USA, but Europe & Asia that is also facing aging populations. The only region that has a high fertility rate is the Islam nations]
https://www.google.com/url?url=https://www.bloomberg.com/view/articles/2017-05-31/is-china-headed-for-a-recession&rct=j&q=&esrc=s&sa=U&ved=0ahUKEwiH44Seq9rUAhWI64MKHeojBFIQFgg1MAY&usg=AFQjCNEJs-v3qcCJ9xhpylmuqGlo7BTKdQ
[China’s Yield curve inverted, which is a signal that its economy is near or in retraction. Perhaps BoC will add more stimulus, but it would just be propping up a falling economy. Real Growth in China is dead. Currently, China is estimated to have more than 64 Million apartments & Condos.]
Toronto House Prices Have Already Fallen 12% From Their Peak
http://www.huffingtonpost.ca/2017/06/21/toronto-house-prices-have-already-fallen-12-from-their-peak_a_22528595/
[It appears that Canada’s Housing Market is finally popping, probably related that the Chinese have stopped pouring capital into Canada housing market].
Heated house market hits a ceiling in Sydney and Melbourne
http://www.google.com/url?url=http://www.theaustralian.com.au/news/inquirer/heated-house-market-hits-a-ceiling-in-sydney-and-melbourne/news-story/08a7b3f7cdb2feecfbcb15dd82746358&rct=j&q=&esrc=s&sa=U&ved=0ahUKEwiqmtntrNrUAhUH7IMKHWSnBsMQFggaMAE&usg=AFQjCNEV8wZU38-AvjaRMO94fme-3ul2ww
[Same thing in Australia, also China related]
Presumably if the global does plunge back into recession it going cause a significant dip in energy demand. By the time the world recovers, its possible that the demographic problems & more automation, will create a long term, if not permanent peak in energy demand.
I can’t imagine why a country would want to be dependent on gas, oil, and coal imports if they can find other options.
Some politicians put great emphasis on the US being energy independent and yet assume other countries will continue to import our fossil fuels. Even if installing renewables is more expensive at first (and it isn’t necessarily so anymore), from a strategic point of view, it could well be worth the price not to be held to the whims of the Middle East, Russia, and the US.
Should Energy Security Go Green?: “A fossil fuel-based energy ecosystem has further important strategic implications. Since the major sources of fossil fuels are concentrated in specific regions of the globe, there is an inherent weakness in such a system. Fossil fuel production and transportation, and to a lesser but still significant extent, processing, are highly centralized. This makes fossil fuel-based systems vulnerable to disruption, even in countries rich in such resources.”
Here are the populations of African countries by the year 2100. Still going to keep growing. Except no nation there will be over 1 billion yet by that time.
https://i.redd.it/yswwx2cq5b5z.png
Having a lot of people doesn’t guarantee they will have money to spend. More people could just mean more poverty and more political instability.
So what?
http://www.independent.co.uk/environment/climate-change/renewable-energy-investment-developed-world-developing-world-ren21-report-a7058436.html
Developing world invests more in renewable energy than rich countries for first time, new study says. Last year broke records for investment in renewable energy with countries like China, India and even Mauritania in the forefront
Hi Techguy.
FWIW: Applying a different twist, I think Global enough production is going to peak soon since World Population growth is peaking and will start declining in the 2020s if this chart is correct.
You have made a fundamental error in reading this graph. It does not show that population will decline; it shows that the rate of population increase will decline. The rate of increase has to go below zero (and become, essentially, the rate of decrease) for the population to decline. This graph doesn’t show that happening until sometime after 2050.
-Lloyd
Lloyd Wrote:
“You have made a fundamental error in reading this graph. It does not show that population will decline; it shows that the rate of population increase will decline. ”
Sorry but your confused what I wrote. Re-read the sentence you quoted from be above:
“I think Global enough production is going to peak soon since World Population growth is peaking and will start declining in the 2020s if this chart is correct.”
“Population Growth” is peaking and “Population Growth” is expected to decline. I did not say “Global Population” will decline.
I just made a comment wondering why any country would want to be dependent on importing gas, oil, and coal when it might have other options.
This article suggests China is thinking along those lines.
China’s energy strategy: power and independence
China’s green strategy is paving the way for an Asian renewable boom – The New Economy: “According to Mathews, China faces a ‘bleak future’ if it fails to break its dependence on fossil fuel imports, which have continuously increased over recent decades. He argued the key driver of China’s rapid uptake of renewables was the improved energy security they bring: ‘As it happens, it is an extremely convenient truth that the strategy of enhancing energy security via renewables also lowers carbon emissions as a fortunate side effect.’”
What if some countries, rather than increasing their military budgets, put that money toward reducing dependence on fossil fuel imports?
People talk about renewables in terms of environmental and economic reasons. But it might also be a good idea to pay more attention to security and strategic reasons.
One way to reduce the power of fossil fuel exporting countries is to stop buying from them. For those countries tired of being dependent on Russia and the US, renewables might be an opportunity for them to break away a bit.
“What if some countries, rather than increasing their military budgets, put that money toward reducing dependence on fossil fuel imports?”
That is the funny thing for me in the German discussion. People oppose the energiewende and at the same time feel threatened by Russia ignoring, that we Germans are Russias most important customer for oil and NG.
These people cry for 1% more defense spendings but call 0.5% for the energiewende expensive.
IMHO it was a mistake not to sell the strategic implications of the energiewende in a better way.
Yes, that thought occurred to me last night. Forget about the environment. Sell the idea that being dependent on fossil fuel sellers is a strategic and military mistake.
I know that the US military is thinking along those lines. Trump has given Mattis control of military decisions, so no matter what other members of the Trump administration say, the military wants more renewables and localized power generation in their mix.
Isn’t there supposed to be a different place for the wackos to post silliness and this one is for oil?
“Isn’t there supposed to be a different place for the wackos to post silliness and this one is for oil?”
My post was energy related, but it based upon energy demand peaking do to demographics as well as economic, Tech. changes that will also impact demand. Links about a potential global recession would also impact energy demand short term, that could continue indefinitely presuming that by the time the recession ends, demographics would limit demand growth.
https://www.youtube.com/watch?v=iV2ViNJFZC8
Monty Python’s Ministry of Silly Walks (Full Sketch) – YouTube
Grown men still promoting the continued use of fossil fuels and throwing large sums of money at a losing proposition is even sillier than that…
Car sharing is here to stay, and growing.
However:
Uber and Tesla are showing ominous signs that the era of auto disruption may be about to come to an abrupt end
http://www.businessinsider.com/uber-tesla-waymo-struggle-to-disrupt-auto-industry-2017-6
The obvious conclusion to draw from Uber’s crisis and Tesla’s Autopilot struggles is that the disruption of transportation so enthusiastically cheered by the tech industry was ridiculously overblown. And it wasn’t confined to Tesla and Uber.
Despite Waymo’s partnership with Lyft, the self-driving project isn’t closer to commercialization now than it was three years ago. And the Apple Car — “Project Titan” — has pivoted numerous times, always vaguely and secretively.
self driving cars…
yes, let’s see…
moon colonies…
fusion reactors…
yes, it’s all becoming clear…
it can be imagined…
billions of dollars can be thrown at it…
I predict millions of self driving cars in 30 years…
fusion reactors and moon colonies too…
30 years from now, I will likely extend that prediction a few decades longer…
You might be right about most of the things on your list, however you are dead wrong about self driving cars! And even more wrong about self driving trucks which are a much bigger deal are even more disruptive to the economy at large and pretty much ready to be on the road today.
https://www.cbinsights.com/blog/autonomous-driverless-vehicles-corporations-list/
44 Corporations Working On Autonomous Vehicles
Private companies working in auto tech are attracting record levels of deals and funding, with autonomous driving startups leading the charge. Besides early-stage startups, VCs, and other investors, large companies are also eagerly chasing a slice of the self-driving pie.
Using CB Insights’ investment, acquisition, and partnership data, we identified 44 companies developing roadgoing self-driving vehicles. They are a diverse group of players, ranging from automotive industry stalwarts to leading technology brands and telecommunications companies.
https://www.thetruckersreport.com/ata-self-driving-trucks-are-close-to-inevitable/
ATA: Self-Driving Trucks Are “Close To Inevitable”
The Wall Street Journal recently published an article titled “Daddy, What Was A Truck Driver?” In it they predict that the future of commercial trucking lies in self-driving trucks. All the non-drivers quoted in the article agree that it’s not a matter of if, but rather a matter when… including the director of engineering and safety policy for the ATA, Ted Scott, who said that ubiquitous, autonomous trucks are “close to inevitable.”
Perhaps it is not the prediction that is most unnerving, but rather the excitement with which the heads of major trucking companies look toward the driver-less future.
“Holy —,” exclaimed the safety director at a 300-truck firm. “If I didn’t have to deal with drivers, and I could just program a truck and send it?”
Here is how robotic big rigs will solve our traffic and energy problems.
Breaking News of the Future:
Car sales plummet as drivers fear to be on roads with robot tractor trailers. One driver we interviewed said ” There is no way I am getting on the highway with those platoons of robot trucks. They have nothing to lose! We need the corporate officers of the trucking companies to go to jail when the rigs kill and injure people. Somebody’s future and life has to be on the line. Right now it’s just insurance company money. “
Ever wonder why trains are not autonomous.
Unions.
In fact, for 20, 30 or more years after they switched from Deisel to coal, they still had to hire coal tenders to ride on every train.
When the caboose became obsolete, they still had to hire personnel that used to ride in the caboose.
Unions are part of the reason, but only part.
There are over 50 metro type systems in the world that are fully automated. These do not interact with other railroads and are short compared to mainline railroads.
Sight distance is a problem and due to very long stopping distances they really need monitoring at the crossings, stations and along the rail so they can be forewarned. This is being done in some places. There are also collision avoidance systems in place, again externally sourced.
The standard LIDAR system would be fairly useless on a train.
sight distance will always be an unsolved problem for self driving vehicles – SDVs.
also left turns at intersections – perhaps urban roads and especially intersections can be enhanced to “communicate” with SDVs.
but really the matter is giving these SDVs human intuition and that’s impossible.
so perhaps SDVs on short routes in urban areas where the roads have been “enhanced”.
But where is the conversation about cost?
after all, the technology for moon colonies has existed for decades.
so why no moon colonies?
I suspect the trillion dollar price tag is why.
SDVs will be too costly for any widespread use.
But my opinion won’t stop billions of dollars from being thrown at the technology.
Fusion reactors!
Moon colonies!
Flying cars!
SDVs!
does the imagination have no bounds?
I would think the left hand turn at a signal is solved by left hand turn signals at every stop light. They can be smart lights that only us a left turn arrow if there are cars in that lane waiting to turn.
On rural roads the technology may not work very well, though usually lines on the road edges and center lines are enough to keep the car on the road.
Unpaved roads or roads with no lines may require a driver.
Actually, I see it quite differently. I returned to my island home last Friday, having spent 22 days in the UK and a say and a half in South Florida. During my three week stay in the UK there were two “terrorist attacks” that consisted of the “attackers” driving rented light commercial vehicles (known as vans or LCVs in the UK) into groups of people. This follows similar “attacks” elsewhere in Europe where it seems that terrorists have decided that renting a vehicle and driving into groups of pedestrians is an effective tactic.
Being someone who has been following the development of EVs and autonomous vehicles with a fair amount of interest, I started thinking. How long before European governments mandate that all trucks and LCVs must be equipped with collision avoidance technology specifically geared at preventing such vehicles being used as weapons to intentionally harm people or damage property. Under the circumstances, my bet is less than five years.
Taking this to it’s logical conclusion, I suspect that I failing an untimely demise on my part, I will live to see human drivers banned from heavily built up population centers. I envisage a driver ignoring a sign warning that no driving is permitted beyond this point, only to be pulled over by a cop who then asks, “Why are you driving your car? Are you planning on causing an accident or something?”
I can see your logic on this one, but the collision and avoidance system could be hacked as well as autonomous vehicles being hacked. Hacking is much easier when one has access to the vehicle.
One of the big fears is that autonomous vehicles will be used as weapons with the terrorist is not at physical risk. Basically computer geeks becoming terrorists or handing over their knowledge to terrorists.
Kidnapping is another fear with driverless vehicles.
A lot of effort and money will go into prevention, but as we have seen even protected systems can be hacked. The fact that taxi type vehicles will be subject to physical intervention as well as software intervention will make them particularly vulnerable.
One of the big fears is that autonomous vehicles will be used as weapons with the terrorist is not at physical risk. Basically computer geeks becoming terrorists or handing over their knowledge to terrorists.
Really?! You are seriously worried about driverless vehicles being hacked? If I were the worrying type I’d be a lot more worried about these friendly supervisory vehicles that our some of our local police forces are already deploying …
http://fortune.com/2017/04/03/police-drones/
Soon You’ll Be Able to Hijack Weaponized Police Drones in Connecticut
Not content with having a fleet of insecure surveillance drones, the state of Connecticut wants a fleet of insecure weaponized drones. What could possibly go wrong?
An unmanned combat aerial vehicle (UCAV), also known as a combat drone or simply a drone, is an unmanned aerial vehicle (UAV) that usually carries aircraft ordnance such as missiles. … They are used in drone strikes.
.
A fundamental problem with all this crap is that you have to buy into it– into the religion that many indoctrinates call ‘The Ecomomy’.
Thus, you sell yourself out– and your island for that matter.
Thus, you’ve already failed. You just don’t know it yet. Or, maybe you do, in which case, your failure has taken on another dimension.
“No, lieutenant, your men are already dead…“
I am reading a novel at this time where an anarchist type is trying to break the hold of the elites on the world. He is extremely intelligent and powerful. Little does he know that his staff has been infiltrated and his plans actually fit into the elite plans. He is being used at cross purposes to give much more control over the world to the elites.
So one must be very careful that one’s set is not actually a subset of an apparent opposing regime.
I posted something kind of like this here.
Hey Caelan,
“A fundamental problem with all this crap is that you have to buy into it– into the religion that many indoctrinates call ‘The Ecomomy’.Thus, you sell yourself out– and your island for that matter.”
Yes.
If you move out of society, whatsoever society has given you will leave you. It can exist only in milieu, in the social milieu. Society means all comforts, all conveniences and all the society can give – and when society gives something, it also takes something from individual – liberty and soul. So, it is just an exchange. But only with awareness can someone can see this as being a choice. Without awareness people are in deep sleep. Because society is tranquilizing, very convenient, comfortable. You click button whoila , some drone brings fish for dinner.
So, society gives you sort of sleep. If you move out of society inconvenience is bound to be there. All types of inconvenience. You have to wake up early in the morning to catch the fish for dinner. So, the mind that is tranquilized by the society would look at this as “austerity”. But if individual is trying to get liberty back it has to stop the bargaining. It has to go though austerity and it will come out of it new. New purity, new innocence. But if someone does not deeply understand that there is a choice than how they can even make a choice.
Hey Islandboy next time you are passing through Miami drop me a line and I’ll buy you a beer!
Self driving?
Maybe.
EV on a big rig? Not with current technology for very far.
Actually, I think it will be self driving rigs that will make EV trucks work.
Without a driver, the most cost efficient speed on the road is going to be about 40 to 45 mph. This will cut the energy required by half and still most likely get the load to it’s destination in about the same amount of time. No coffee, meal, sleep or bathroom breaks, also no waiting for the driver to show up to start the trip. After the rig travels for 4 to 6 hours. It pulls into a charging station for a couple of hours and leaves again as soon as the charge is complete. No driver wasting time.
Thats not the problem.
The problem is the battery would comprise the whole payload of the truck.
That’s just not true. Most tractor trailer units weigh in at about 30,000 pounds with a payload of 50,000 pounds. The engine weighs 3,000 and the trans at 500. The electric power train should save a little weight. Eliminating the sleeper unit should save 1000 pounds and need for the current cab should also reduce weight, maybe another 500 to 1000. Oh, and don’t forget the 250 pound driver. Most road tractors have about 300 gallons of diesel capacity. That’s about 2000 more pounds saved.
In total, lets say there’s 4000 pounds of savings from the current standard unit. I would expect other weight savings available for a rig that is limited to 45mph vs. today’s standard.
The GM Bolt 60 kWh battery pack is a stressed member and weighs 960 pounds. If you give the rig a 600 kWh battery(this could still be a little small). Minus the 4000 pound savings, you add about 6000 pounds. That only reduces the payload from 50,000 pounds to 44,000 pounds.
Remember, more than half the energy to push the rig down the road at 70 mph is wind resistance and at 45 mph it is almost totally eliminated.
This is a much more reasonable solution than expecting to push almost all freight to an electrified railroad system.
The electric power train should save a little weight.
May I suggest some reading to increase your literacy on the subject?
http://www.springer.com/us/book/9783319263731
Not into reading (a common condition these days)?
Try this:
https://www.peakprosperity.com/podcast/100873/alice-friedemann-when-trucks-stop-running
MacHigh,
“The problem is the battery would comprise the whole payload of the truck”
Your statement has been exposed as a doomer BAU bullshit lie that it is. MacHigh, what you are is a glass half empty personality. I’m not really interested in your old world literacy crap. Stick to the subject and back up your statement. You haven’t shown you know or understand anything on the subject.
I did back up my statement.
You are the one confused, and in denial, combined with energy Illiteracy .
There is another possibility – running trucks with a power line on interstates, only use ICE (first) or a small battery pack for the final miles. Here a test facility in Sweden:
https://www.youtube.com/watch?v=mBwvQwzBxjk
Hi Eulensiegel,
I’ve seen this before and it very well could be a more cost effective system. I think a lot of that will depend on cost, life expectancy and weight advancements on batteries over the next 10 to 20 years.
They actually do this from Port Of Los Angles to the rail terminals.
The electrical usage is immense.
Electrifying rail in California would take most of all generated electricity, from early results:
Siemens To Conduct eHighway Trials With Electric Volvo Trucks In California
http://insideevs.com/siemens-conduct-ehighway-trials-electric-volvo-trucks-california/
The Swedish experiment only travels 2 kilometers.
Hi Huntington Beach,
I guess we could let the free market decide by putting a price on carbon or just wait for oil to become scarce and high oil prices will lead businesses to find the least cost solution. Electrified rail seems more sensible to me, but I don’t really know what the cost difference would be.
An interesting project, which someone may have already done.
I found this
http://reasonrail.blogspot.com/2015/09/a-cost-to-benefit-analysis-of-railroad.html
Long haul rail is electric- powered by diesel generators.
It is already electric– one just needs to get the electricity to it.
Diesel is the current answer.
And I doubt if we will have the wealth and resources to electrify it any other way.
Hi,
Here in Europe almost all rail travel is electric, not Diesel. Only on small local tracks are run by Diesel, all heavy duty is done electrical.
It’s only on Diesel in the USA, because the railway net is way underdeveloped. Freight trains go only with about 25 MPH or less (I’ve seen them creeping through the landscape on curvy rails), here they go normally with about 50 MPH to not disturb other rail traffic too much. A line goes along my town, sometimes I hear the “Katschung Katschung klip klop rat rat rat rat” of freight trains with coal, steel or produced cars.
Certainly you could build a modern railway net in the USA, if you really want it. It was possible in China is a few years – why not in the USA.
Here in Europy they are still somewhat underdeveloped, too. Most rails go on the same infrastructure from the first railway rush 1850, only a few new tracks for bullet trains. In the 1990s it was planed to design new freight trains going 100 MpH on the bullet train rails – but the plans where skipped in favor for more truck transport.
A big rig is likely to need at least 300 Horsepower which would be about 220 kW for the motor or motors. If that were the case it a 600 kWhr motor would last for maybe 3 hours before needing to be recharged, it might be able to fast charge, but that would reduce the life of the battery.
Overhead wires on highways might be a cheap solution, but I still think electrified rail makes more sense.
Another way to think about it is the 75 kWhr pack of the Tesla Model S moves a 5000 pound car about 250 miles, the Semi-Rig has a GVW of about 16 times the Tesla Model S (80,000/5000), so we might need a battery 16 times larger or 1200 kWhr to take the truck 250 miles.
That Nikola Motor outfit has a 320kw motor with 1,000 horsepower and 2,000 foot pounds torque, so they say.
Battery is under 4,000 lbs., lighter than the diesel engine it replaces.
Supposed to go 1,000 miles between refueling, which is from the onboard hydrogen cell. This is large, class 8 trucks.
They have a prototype, but it’s far from certain it will be a viable operation.
They are collaborating with Ryder trucks and US Express to try to introduce this whole new approach to over the road trucking.
Hi Dennis,
I’m glad you responded. It’s been some of your past posts on electrified rail, that has had me thinking about this. Rail works well for bulk commodities(coal, oil, lumber, autos, containers, etc), but when it comes to freight and perishables not so well. I don’t see new spur lines being reconstituted or more than 5 percent of today’s trucking freight getting pushed over to rail.
It takes about 100 hp to push a 80,000 pound tractor trailer van down a flat windless highway at about 65 mph. The aerodynamic drag increases exponentially with the speed. Yes, more power like 4 or 5 hundred hp is needed to climb a grade at 70 mph, but an EV can recoup the energy on the way down.
I know it’s been only about a year ago that I argued with Nick that heavy duty long hall trunking wasn’t going electric soon. But now I’m thinking with driver less vehicles and showing them down to eliminate the wind drag energy lost. Maybe we are only 15 to 25 years away from long haul electric class 8 vehicles. I see natural gas class 8’s still happening before electric.
Driver less vehicles are going to be a big game changer.
There are a lot of trial runs with driverless trucks taking place on interstates in Nevada and Utah.
Incremental adoption may start with daylight only, restricted roadways only with a human behind the wheel at all times.
The ability to run OTR trucks 24 hours straight (no human time constraints) combined with a 4 truck convoy format with the following vehicles mimicking the lead, human operated truck, offers enormous monetary savings.
All the more so if diesel is replaced with a more economical power source.
The problem is, 18 wheelers don’t go 250 miles- they go 1500 miles, and often times more.
And when you hear “Hydrogen”, one knows one is losing energy big time.
Alice Friedemann puts it quite nicely.. there is NO alternative to diesel. Electricity doesnt matter. In the end this will be a financial and therefore a liquid transportation fuel (and spare parts) crisis.
Hi Huntingtonbeach,
In the real world there are hills and there is wind, so 100 HP is not going to cut it.
There is still rolling resistance and air resistance to contend with. You don’t seriously think 100 HP is going to be adequate to move an 80,000 pound vehicle, I assume.
We do not live in a flat frictionless World and as far as I know at relevant speeds, Newton’s Laws of motion still apply in the World that I live in. 🙂
Hi Hightrecker,
When Diesel costs 20 Dollar / Barrel, suddenly transport per rail will be possible – or Interstates will be electrified. It costs a few billion dollars – but when Diesel runs out, this will happen.
There are possibilities.
10$ / barrel won’t be enough, we had this during the 150$ oil here because of taxes and still there was truck transport from Russia to Spain.
2018 2 more test lanes for E-Trucks will be build in Germany, about 8 km long each to test this technic.
Costs are calculated by 1 million € / Km, and it is planned to electrify only a third of the road – the other part is covered by loading a small battery. Even when you double or triple the cost (realistic approach) this still isn’t really expensive. Building wires is a proved technology for railroads, anyway.
The test LKW keep their Diesel engine, the extra stuff weights about 2 tons.
It is planed only to electrify the main transport routes, where 80% of all tons/km is done.
China and trucking companies are very interested: on 100.000 KM the electricity is about 20.000 € cheaper than Diesel, even now. At least in Europe where gas is more expensive.
Here is the tractor-trailer solution for our future.
Introducing the Trump-O-Truck. Powered by coal to keep them coal miners working. Guaranteed to pass all EPA emissions tests.
What Tesla and Uber have shown is that there is a market for what they have had to offer.
Are either of these companies worth what investors were willing to put in? No.
They have been disruptive forces, just very overvalued.
The concept of Uber is valid. You have under-employed people with under-utilized cars serving people who are willing to pay a price for on-demand transportation.
But the company culture has created problems which might have been avoided otherwise.
National Geographic Making New Coal Industry Doc Available for Free
National Geographic is offering free viewing of the new documentary From the Ashes on a wide array of digital and streaming platforms, beginning Monday and running through July 3. Michael Bonfiglio’s film looks at communities across America as they wrestle with the legacy of the coal industry and what its future should be under the Trump administration.
Nat Geo said it was making the doc available in the wake of President Donald Trump’s decision to withdraw from the Paris Climate Agreement to further the “network’s commitment to providing audiences with the resources and knowledge needed to preserve the planet and change the world.”
https://www.youtube.com/watch?v=rV0ro0uleVo
I saw this documentary Sunday night when it first aired. It fits in extremely well with the conversation that goes on here on the non oil side posts. It’s very well done and I think most of you will find it worth your time.
Here is the link to the full documentary now that it’s available:
https://www.youtube.com/watch?v=jUg4QZzggLA
ExxonMobil and its peers risk blowing $2.3 trillion on oil projects that will not be needed if the world hits peak demand in the next decade.
A new report from The Carbon Tracker Initiative analyzed what would happen if the oil market saw demand peak by 2025, a scenario that would be compatible with limiting global warming to just 2 degrees Celsius. The headline conclusion is that about one-third of the global oil industry’s potential spending – or about $2.3 trillion – would not be needed. In other words, the oil industry is on track to waste a massive pile of money if demand peaks in less than ten years
http://www.carbontracker.org/wp-content/uploads/2017/06/2D-of-separation_PRI-CTI_report_correct_2.pdf
ExxonMobil and its peers risk blowing $2.3 trillion on oil projects that will not be needed if the world hits peak demand in the next decade.
LOL! Gotta love it! I think currently Uber, despite all the bad press and the resignation of it’s CEO is valued at close to 70 billion dollars US.
Meanwhile in other news:
http://www.smh.com.au/environment/great-barrier-reef-valued-at-56-billion-by-deloitte-economists-20170625-gwy2yj.html
Great Barrier Reef valued at $56 billion by Deloitte economists.
The Great Barrier Reef is worth $56 billion.
That’s the “total asset value” according to a new Deloitte Access Economics report that calculates the World Heritage site’s full economic, social and iconic brand value for the first time.
I know that no one asked me what I think the Great Barrier Reef is worth but I’d say well over $2.3 trillion. I think that is being extremely conservative…
BTW, If I didn’t think it would give the poor sharks indigestion, I’d suggest tossing them a few Deloitte economists for lunch followed by a few Exxon oil men for desert!
Think about it! Uber alone is currently valued at almost 30 billion dollars more than what a group of economists think the Great Barrier Reef is worth. And some people around here think I’m an asshole.
Fuck it! I may as well max out my credit on a vintage Hummer…
As we know, investors risk appetite has been a big factor helping the increase in drilling activity. And I’m wondering if the drop in WTI prices in future years means that investors might lose some of their confidence in their financial gamble on oil and shale? (purely thinking out loud).
CRUDE OIL Jul 2018, chart direct: https://s23.postimg.org/wcv5j52h7/2017-06-26_WTI_price.png
CRUDE OIL Jul 2019, INO website: http://quotes.ino.com/charting/index.html?s=NYMEX_CL.N19.E&t=&a=&w=&v=dmax
US rig count has been rising since mid-2016, Bloomberg chart on twitter: https://pbs.twimg.com/media/DDOaKn9XoAQvII3.jpg
Paper barrel traders sentiment is turning from one extreme to the other…
Kemp – Hedge funds and other money managers appear to have entered their own special version of hell and abandoned all hope that OPEC will rebalance the oil market, slashing formerly bullish bets on crude futures and options.
February 2017
Fund managers accumulated a record net long position of almost 1 billion barrels by the middle of February 2017 only to suffer a sharp reversal in prices starting early the next month.
June 2017
Short positions across the three major Brent and WTI contracts are now running at the highest level since August 2016 and close to the record short position established in January 2016, just as oil prices reached their lowest point in this cycle.
Extreme bearishness extends to refined fuels, where hedge funds have a net short position of 27 million barrels in U.S. heating oil and a near-record net short position in U.S. gasoline of 21 million barrels.
Reuters link (Jun 26, 2017): http://www.reuters.com/article/us-oil-hedgefunds-kemp-idUSKBN19H1DF
This is what got me thinking, rigs added above WTI $48…
Article on SEB website: http://ravarumarknaden.se/rebounding-expectations-tightening-q3-17-us-shale-oil-rigs-continues-rise/
The 2017 EIA Energy Conference kicks off today in Washington, DC.
latest on twitter: https://twitter.com/hashtag/eiaconf?f=tweets&vertical=default&src=hash
Hi everyone,
is the attached estimate about Permian Total Recoverable Resource realistic or classical investors’ presentation hype?
https://twitter.com/T_Mason_H/status/879333155680944128
Thanks.
P.S. For some reason I cannot upload the image
Just as an FYI, the API degrees number for the liquid coming out of shale is climbing, and it doesn’t have much more room to climb before the liquid stops qualifying as oil and becomes condensate.
Of course, as this evolves, the definition of oil and condensate will be changed to prevent that declaration. There will be no diesel or jet fuel in it, but it will still be called oil.
Dean
Suggest you check out Mike Filloon’s short piece (just out) describing EOG’s 4 well Rattlesnake pad in Lea county.
1.77 million barrels oil produced total in under a year’s time online.
Astronomical decline rate following huge early production.
Something new is going on here to produce numbers this large.
Hi Coffeguyzz,
How much larger is the decline rate in percentage terms?
Did it go from 30% to 60% for initial decline rate for example?
What some petroleum engineers have suggested is that very high IP can also lead to very short well life such that overall EUR changes very little.
There are always very impressive wells that can be pointed to, it is the productivity of a company’s average well that will determine its profitability, as well as the cost to complete and operate the well.
Dennis
You may want to see Filloon’s piece yourself as he includes production numbers and charts.
It is linked from Bruce Oksol’s ‘themilliondollarwayblogspotdotcom’ .
I don’t do detailed numbers like you folks, but both the output and drop off seemed extreme.
It almost seems like some type of new completion may be involved, as well as geology.
Dennis.
I think I have previously advised that Mr. Filloon’s numbers are estimates of future well productivity made by software he is selling.
Rattlesnake 21 Federal Com wells 701H and 702H are big wells, thru 4/30/17 I see 833K BO.
There are 6 Rattlesnake 28 Federal wells, 703H, 704H, 706H, 707H, 708H and 709H. The latter 4 just had first oil in 4/17.
There are also four Whirling Wind Federal Com wells. 14-701H and 11-702H, 703H and 704H.
All of the 12 wells appear to be top end oil producers thus far, but I do not see any four combined close to 1.77 million BO thru 4/30/17.
Shallow
I never get involved in speculation stuff as people’s pre-existing views seem to dominate interpretations, but Filloon clearly stated he was using existing production records from four wells on the Rattlesnake pad.
Two wells started production March, 2016 and the other two on September, 2016.
Up till March, 2017 (40 months total online), he tallied these four wells cum at 1.77 million barrels of oil.
Are you saying Filloon is incorrect?
Yes. Based upon IHS Energy data thru 4/30/17.
That’s weird.
I went back over his piece to see if I misinterpreted (he can be a little difficult in clarity of presentation, sometimes), but it was straightforward.
I even added up the production points of the four well’s graph profiles and it was ballpark 1.6/1.7 million.
Just shot an inquiry to him and awaiting response.
I am just going off I subscription service we pay for monthly that I have always found accurate.
Go to shaleprofile and look at what Enno has. Or go to NM state site.
I recall there was a back and forth between Michael and Enno on Seeking Alpha awhile back. A poster who uses a long number starting with 217 – who I think is the person who went by Nony here – got into the fray and got Michael to admit he was making projections and not setting forth actual data.
Don’t get me wrong, the wells are definitely top percentile Permian wells and may very well surpass 1.77 million BO, but I do not see any four, in combination, that have hit that thru 4/30/17 based upon the place I looked, which I have never found to be in error
coffeeguyzz,
This is what the State of New Mexico Oil Conservation Division is reporting for crude production.
http://gotech.nmt.edu/gotech/Well/wellactivity.aspx
And for natural gas production.
But this tells a very different narrative than what Filloon is spinning, since the second two wells completed on the lease are not as good as the first two.
Here’s the Filloon/Oksol graph.
It shows the second two wells to have far superior initial well productivity than the first two wells, which the data from the New Mexico Oil Conservation Commission shows not to be true.
Here are the screen shots so you can see for yourself.
.
,
–
Shallow/Glenn
You guys are correct.
Filloon must have screwed up.
I just went through, for the first time, that NM site (really great site!) and just saw what you all posted.
The 4 Rattlesnake wells have cum’d about 1,275,000 bo, not 1,770,000.
Big difference, but still not too shabby.
Checked the Whirling Wind pad while on the site.
3 months online, 4 wells, little over 700,000 barrels oil.
That’s a lotta oil.
Glenn. Thanks for the posts. IHS shows the same data.
Coffee. I am really not sure what Filloon does with the data, but I know we went through this debate about his numbers awhile ago.
Clearly no need to exaggerate the productivity of these wells. It will be interesting to see how these perform over time and how subsequent wells perform as the acreage is drilled.
However, it is also good to focus on all wells. That is where shaleprofile is very helpful. There are very strong wells, very weak wells, and lots in between.
I also wish we were given more information on GWI and NRI. That is very important information, of course. Tough to show well payout for these, or any well without that.
Thanks Glenn and Shallow sand,
For the last of those two wells the annual rate of decline was 98.8% per year (first six months carried out to an annual rate).
There may be something to Mike’s theory that these are “show” wells intended to grab investors attention and make headlines.
Only the first 2 wells where we have 13 months of data are interesting, these 2 average about 400 kb over the first 12 months.
For the 815 wells completed in 2016 in the Permian basin with at least 10 months of output in Enno Peter’s data base, these wells are in the top 0.25%. Far from typical. These two wells at 10 months have cumulative output of 375 kb, the mean well has a cumulative of 104 kb at 10 months and the median well 99 kb.
Also 9.8% of wells have a cumulative of 30 kb or less and 9% of wells have a cumulative output over 180 kb after 10 months of production.
So about 81% of wells between 30 and 180 kb after 10 months.
77% of wells 130 kb or less and 26% with 65k or less cumulative output at 10 months.
So about 51% of the 2016 wells with at least 10 months of production have cumulative output at 10 months between 65 kb and 130 kb.
Data from productivity distribution under advanced insights at
https://shaleprofile.com/index.php/2017/06/08/permian-update-through-february-2017/
Thanks Coffeguyzz,
So the better 2 wells declined from 116,000 to 9,000 in 12 months a decline rate of 92%/year.
Astronomical decline rates indeed!
The piece reads like hype, 4 wells tells us very little.
Based on data from shaleprofile.com
There were about 16 Permian wells completed by EOG in the first quarter of 2016 (which we have 12 months of data for) and the average of those wells was about 168 kb of cumulative oil output over the first 12 months.
These are indeed good wells as the average Permian well from the first quarter of 2016 had 115 kb of cumulative output over 12 months (480 wells).
The productivity distribution of the 2016 wells at the 12 month cumulative shows that 85% of completed wells have a 12 month cumulative output of 165 kb or less, with median well 110 kb and the mean well 115 kb.
Such a small sample of wells from EOG (only 12 wells of 480 wells completed by all companies in the Permian basin) may not tell us very much.
Suggestions that the EOG wells will be “typical” in the future sounds a little too good to be true.
The average Permian well declined about 67.6% from month 2 to month 13, so the monster wells only declined about 36% faster than the average 2016Q1 Permian well.
A fella asked about total recoverable oil in the Permian and the answer was…see six very unusual wells drilled by EOG, within the past 18 months, as though that has anything whatsoever to do with the answer. As though that is now the new standard for all Permian wells. Gawd, I get tired of this shit. Over and over again, non stop. In the middle of the Northern Delaware, with a thousand wells within 5 miles of this EOG stuff, no less, and something new and “exciting” is going on.
I’ll tell you what it is, EOG needed some good press, they crammed 20M of sand in each one of those wells and flowed them back up 5 1/2 inch production casing, AOF. They gutted them. They like doing that. They get good press from that. So old ‘health care’ hands like Filloon can analyze them on Seeking Alpha, THE place to go to lose money. EOG has done that exact same thing a thousand times in the EF. And this time, in the Delaware, they gutted them at <$47 dollar oil. Hot diggity dog !
Those wells won't make half their reported EUR. AS good as they are they’ll be lucky to eek out 125% IRR. On a $10M well.
Mike, sometimes I point out the absolute dog wells, you know, the ones that after 12 months haven’t made 50K BO and are already under 100 BOPD.
Man, the shale props rip me for that.
Funny how the shale props here also like to rip small business owners like you, who pay taxes and provide jobs, all for the sake of glorifying USA’s newfound energy independence.
Check out EOG Dragon 36 State 4H. 10,840 cumulative oil, most recent month 1,077 BO.
Tayberries 13 State 501H. 61,181 cumulative oil. 5,267 BO most recent month.
Bridge State Unit 701H. 47,467 cumulative oil. 4,574 BO most recent month.
These are all EOG wells (not Yates) completed in Lea Co, NM since 1/1/2016.
Yes they are outliers.
You must imagine the kind of individual it is that finds it rewarding, a fun way to pass the time, to come on a peak oil blog to brag about how much money…other people make for them. They actually want you and I and thousands like us all across America to fail, to not be able to feed our families, so in some perverse way they can be better, or smarter, or in their worm ridden brains, right. That’s the America we live in today, brother. The US shale oil industry wants a bigger market share, from its own country, and they’d do, or say anything to get that.
pot meet kettle…
Hi Texas Tea,
Mike would like everyone to do well.
An important difference.
He also is simply informing those not in the know, that indeed the average Permian Basin well is not going to pay out in a reasonable period (36 months for Mike and 60 months for Shallow sand) when oil prices are $50/b or less.
You may not like these truths to be revealed, but the truth it is.
Hi Dean,
It is investor’s hype. Note the “boe” in the slide and it is based on assuming the average well EUR is 1 million barrels of oil equivalent, where the average Permian well completed in the first quarter of 2016 (11 months of data) has an average estimated EUR of about 340 kboe and 300 kbo (ignoring NGL and natural gas), so more realistic estimates for crude plus condensate Permian technical resources are more like 30 to 40 Gb (and I believe when economics are considered more like 20 to 30 Gb).
Dennis,
I am just shocked, shocked that you would make that argument.?
Hi Glenn,
Doesn’t using BOE rather than barrels of oil seem to be a distortion of reality?
As far as the revenue earned from a barrel of oil and a barrel of oil equivalent of natural gas at $55/bo and $3/MCF for nat gas the BOE of natural gas is exchanged for $18/BOE and the oil barrel is exchanged for $55/B.
So in barrels of revenue equivalent (BRE) every BOE of natural gas is equal to 0.333 BRE. So a Permian well that produces 300 kbo and 50 kboe natural gas for an EUR of 35o kBOE in revenue terms is only 317 kBRE .
The USGS estimates about 24 GB of undiscovered crude LTO in the Spraberry and Wolfcamp formations of the Permian Basin, to this we would need to add 2P reserves and cumulative output to get a mean estimate for the URR for these two formations. Perhaps the estimate for the Delaware formation will be very large, but I expect it will be between 5 and 20 Gb so the range in the estimate for undiscovered resources would be between 29 and 44 Gb with a TRR of between 35 and 50 Gb and economics likely limiting this to 25 to 40 Gb for the ERR (economically recoverable resources.)
Have you ever read the fine print on the investor presentations?
It says basically, don’t believe the hype. 🙂
http://www.coqa-inc.org/docs/default-source/meeting-presentations/20110609_Leto.pdf
Page 18
Roughly half of Niobara’s horizontal OOIP is API>45, aka condensate.
Hi Watcher,
Condensate is typically defined as API >49.
The Nigerian Akpo blend at an API of 45.8 traded at a slight discount to Brent of about $1.10/b FOB in Feb 2017.
https://www.platts.com/latest-news/oil/london/differentials-for-nigerias-lightest-crudes-lowest-26654485
https://rbnenergy.com/dont-let-your-crude-oil-grow-up-to-be-condensate
“The generally accepted delineation between condensate and crude oil is 45 API. ”
Other places:
“Refiner Phillips 66 (PSX.N) and midstream giant Plains All American (PAA.N) have said condensate is oil with an API gravity of 45 or above.”
“Lease condensate: produced in the field as a liquid and unprocessed except for basic stabilization at or near the wellhead. Lease condensates have wide ranges of API gravities from 45 to 75 degrees. ”
“The liquid condensate is a very light hydrocarbon, somewhere between 45 and 75 API gravity. (WTI is about 39 API, Brent 35 API, motor gasoline mid-50’s API.) The official delineation between a condensate and a crude oil is 45 API.”
There is no official delineation, but the overwhelming majority of references still say 45. A desire will grow to increase that, because as you google those quotes to get links you’ll find they still quote WTI at 39.
You can refine API 35 oil into diesel, kerosene and gasoline. You can refine ultra heavy API 20 oil into those same components heating them longer and breaking down the CH chains appropriately.
You can’t simply heat it longer and get diesel and kerosene out of what is, in effect, natural low octane gasoline. If there’s no middle distillates in it, you don’t get any from distillation.
The delineation number is 45.
Hi Watcher,
There is not agreement on where the line should be drawn.
Some say 45, some say 50. There is plenty of heavy oil that can be used to refine diesel, the lighter oil can be used for gasoline, which is still used quite a bit in the US. So oil between 45-49 API is useful, above that probably less so, though a chemical engineer or chemist would know better than me.
http://www.reuters.com/article/us-oil-condensate-idUSKCN0HX0BU20141008
This is important. While we have people here trying to say everything is great in gas and oil, based in what I see the majors doing, I think they see the future.
And if Wall Street has lost interest in propping up gas and oil companies, the money won’t be there for money-losing projects. It may become a matter if who can get their money out of gas and oil before there’s a rush to do so.
https://www.greentechmedia.com/articles/read/advice-for-an-oil-gas-industry-facing-its-last-cycle
As Oil and Gas Faces a ‘Last Cycle,’ a Generational Divide Emerges Over Its Future
Greentech Media – 11h ago
The oil and gas industry is facing its “last cycle,” according to consultancy Ernst & Young. What does that mean? It’s a “time when energy abundance, driven by technology, creates a permanent oversupply that not only keeps prices low but also allows …
This is the link to the report the article refers to.
http://www.ey.com/Publication/vwLUAssets/oil-and-gas-perceptions-survey-pdf/$FILE/1703-2205763%20BMC%20Oil%20&%20Gas%20survey_v11_Web.pdf
WSJ – Shale Produces Oil, Why Not Cash?
By Spencer Jakab – June 26, 2017
The heart of his argument is worth examining, though, as U.S. oil output is poised to surpass its 2015 record amid a renewed drilling boom in places like the Permian Basin. Over the past decade—roughly the history of the shale boom and two intervening busts—eight leading U.S. shale producers have collectively generated $414 billion in revenue but had negative free cash flow of $68 billion.
There were signs the industry could break that streak this year as technological innovation and a plunge in service costs brought the break-even oil price down by about a third in some locations. Yet analyst free cash flow forecasts for fiscal year 2017 compiled by FactSet show that cumulative expectations for the same eight companies have dropped from just over $1 billion in February to less than $60 million. The obvious explanation is that oil prices have dropped.
https://www.wsj.com/articles/shale-produces-oil-why-not-cash-1498486995
Chart on twitter: https://pbs.twimg.com/media/DDR6oe5XoAANN7h.jpg
Some quotes from the article which are relevant to comments that have been made here.
“The person uttering them was hedge-fund manager David Einhorn of Greenlight Capital. He charged that the companies leading the U.S. shale fracking revolution were ‘all hat and no cattle,’ failing to meet the basic business requirement of returning more cash to investors than they consumed. The biggest offender, he said, was Pioneer Natural Resources —the ‘mother-fracker.’”
“Oil producers will argue that individual projects have had good returns when planned and that their companies are profitable. Yet free cash flow is a bedrock principle in any investment, even if it seems to matter less in some industries. For example, Tesla and Netflix have burned $6 billion and $1.17 billion more in cash than they have generated in the past decade, respectively, yet their shares are near all-time highs. But both can point to a far off, theoretical profit bonanza. Oil producers don’t have that luxury. Measured by the duration of cash flows from a given project, shale producers have the shortest window among energy producers to recover their investment.”
The article ends with this:
“Yet another shale boom may become a victim of its own success.”
The “isn’t fracking great” guys who post here don’t seem to grasp that this is exactly the message they are sending. If gas and oil are flowing like crazy and there is no limit to how much will be produced, then prices stay low and no one makes any money.
But again, if low prices means certain projects aren’t worth doing now, that’s one positive result.
The more they produce the less the earn. Sounds like a big reason for a career change.
That’s what I am thinking, and I see some of the major oil companies trying to pivot.
Why use up all your money trying to succeed in an industry that is losing money? If you have money that you can get out, maybe it is time to invest it somewhere else.
Some folks seem to think boosting fossil fuels is a culture war (like those guys with the big trucks who intentionally blow carbon out of their exhausts).
It may feel good to brag out all the money you are making on your wells, or that you think you are going to make, but if the industry is tanking, your bravado isn’t going to compensate for lost money.
And again — US oil production declined last year. Amid miracle shale technology US OIL PRODUCTION WAS DOWN LAST YEAR.
Look at the graph at mazamscience.com or go get the BP spreadsheet. Production was down, not up.
Columbia oil figures for May – down 6000 bpd, holding at around 6% y-o-y decline.
Jodi numbers for April are out:
https://www.jodidata.org/oil/database/customisable-charts.aspx#cdSaudiArabia
Headlines are Saudi export s continue to fall (now well below 2012 to 2016 range), Iraq exports falling but above 2012 to 2016 range, Japan oil stocks rose from recent lows. May all back up claims of falling Asian demand.
Despite falling exports Saudi stocks continued to fall at about the same rate as the last year (about 1.2% per month).
https://www.jodidata.org/about-jodi/faqs.aspx
Can any of the shale guys on here give their view on this.
88 Energy, the Company, Operator) (ASX, AIM: 88E) is pleased to provide an update on Project Icewine, located onshore North Slope of Alaska.
Highlights
Flowback continues with ~13% of stimulation fluid recovered
Icewine#2 Operations Update
Flowback commenced on the 19th June from stage 2 (upper zone). Approximately 8% of total stimulation fluid volume was recovered until it became apparent, due to rate and pressure observations, that the upper zone was likely in communication with the lower zone. Consequently, a decision was made to drill out the plug between the upper and lower zones. No increase in pressure was observed, confirming that the two zones are in effective communication. Trace hydrocarbons were encountered whilst flowing back the upper zone prior to drilling out the plug and, as expected, the flow rate returned to 100% stimulation fluid once the two zones were flowed back together.
Flowback, currently comprising 100% stimulation fluid, is continuing. Percentage of fluid recovered to date is ~13% of the total fluid pumped. It is estimated that up to 30% of the stimulation fluid will need to be recovered before hydrocarbons will be released from the reservoir.
The forward plan is to monitor pressure and flow rate and continue to draw stimulation fluid off the reservoir. Artificial lift, using nitrogen or swab cups, may be introduced at some stage to increase the rate of draw down of fluid. If pressure becomes too low it is possible that operations will necessitate a shut-in to allow fluid to soak and pressure to build up. This soaking is not uncommon in other shale plays as it allows stimulation fluid to be absorbed into the reservoir and can result in lower required fluid flowback before onset of hydrocarbon flow.
Further updates will be made as and when appropriate throughout the testing program.
ClipperData – OPEC exports at basically the same level as back in October. – June 26th 2017
To counter the supportive influence of the above data, we are seeing Saudi exports rebounding thus far in June. Not only that, but export loadings have also picked up this month from a number of different countries (think: UAE, Iraq, Angola), while higher Libyan and Nigerian production is reflected through in higher exports.
Nearly six months through the OPEC / NOPEC production cut, and it is very much still a case of whack-a-mole for the various players: one month they duck lower, only to poke their head higher the next month. All this leaves OPEC exports at basically the same level as back in October.
http://blog.clipperdata.com/your-blog-post-title-here-1497352830901
US crude exports
Scott Sheffield (Pioneer): We need a consistent spread of $2.50 between WTI and Brent for increased exports. Lifting oil export ban is a key reason for surging Permian production.
Brent-WTI spread vs exports, chart on twitter: https://pbs.twimg.com/media/DDUnYUEUAAE4H0v.png
Recent interview with Joseph Tainter.
https://www.peakprosperity.com/podcast/109453/joseph-tainter-collapse-complex-societies
Hello, can you explain who Joseph Tainter is?
https://www.google.com/search?q=joseph+tainter&oq=joseph+tainter
It is excellent.
I listened to it last night.
Tainter was sure head of the game!
Full 93 minute lecture on YouTube.
We’ve talked about whether Uber is overvalued. Yes, it is. And maybe the valuation will come back to Earth.
Uber as a company has had many problems. The concept itself is a legitimate one, and will likely continue on in some form by other companies, even if Uber doesn’t stay in the mix. Or Uber could become a better company and stick around.
Uber's Missteps Should be a Cautionary Tale to the Tech Industry – Shareable: Op-Ed: “This week, news broke that Uber’s investors demanded and got CEO Travis Kalanick’s resignation. The company has been embroiled in controversy from the get-go, and Kalanick should have been let go much sooner. The fact that the company’s investors backed Uber with astounding $15 billion and tolerated its behavior for so long speaks volumes about their lack of leadership. Some of Silicon Valley’s most powerful people backed an illegal enterprise — which is exactly how the Harvard Business Review describes it — that willfully and systematically broke the law, racked up over $150 million in fines, lied to the public, strong armed local governments around the world, abused employees, exploited drivers, violated users’ privacy, and triggered thousands of sexual harassment complaints.”
“People can can support and create alternatives, like platform cooperatives, where all stakeholders can have a say and a share in a tech enterprise. There’s RideAustin in the U.S., Stocksy United in Canada, and Fairmondo in Germany, all examples of enterprises that put people and community first. We can also create alternatives to Silicon Valley’s wealth-concentrating ecosystem, like the Emilia Romagna region in Italy, where wealth-spreading cooperatives produce 30 percent of its GDP. More than a possibility, it seems a necessity if we value freedom, fairness, and a future worth having.”
Would love to hear Fernando chime in about the current situation in Venezuela.
Well, China and GS are betting the government will stay together until the Chinese Refinery for heavy oil comes online.
Fernando is betting they won’t.
Lay down your cards.
One thing for sure, Venezuela in not going back to US Client State status, as that is out of the bag.
We are heading for the warmest climate in half a billion years
https://www.skepticalscience.com/heading-for-warmest-climate-half-billion-years.html
Future generations are quite likely to shake their collective heads in total disbelief of how scientists using mathematical models with infamous levels of inaccuracy were cunning enough to predict warming centuries into the far off future within some tenths of a degree of apocalyptic levels. These people will have hatred in their hearts indeed over the global mass panic the scientists will have despicably created, which further will have resulted in an inevitable establishment of draconian laws needlessly halting the march of human progress worldwide, nations relinquishing sovereignty in order to please a one world government, and billions of people duped into sacrificing economic and personal freedoms. No, with the track climate science is on now, the future does not look at all bright, but the reasons for that are most assuredly not from any rising temperatures.
And to show their gratitude, they will erect a huge statue to you! It will look something like this!
.
Or more likely they’ll be thinking this of you and your ilk …
While Fred and George are correct, a more technical discussion of this comment is to identify a “Dialogue Pair”, a non-response to Hightrekker’s comment attempting to re-frame the discussion as ideological rather than scientific. Dialogue Pairs are a standard technique of Media Manipulators, whether professional or amateur.
-Lloyd
Refreshingly overt
What are you going to do about it?:
EPA chief met with Dow CEO before deciding on pesticide ban
WASHINGTON (AP) — The Trump administration’s top environmental official met privately with the chief executive of Dow Chemical shortly before reversing his agency’s push to ban a widely used pesticide after health studies showed it can harm children’s brains, according to records obtained by The Associated Press.
Environmental Protection Agency Administrator Scott Pruitt’s schedule shows he met with Dow CEO Andrew Liveris on March 9 for about a half hour at a Houston hotel. Both men were featured speakers at an energy industry conference.
Twenty days later Pruitt announced his decision to deny a petition to ban Dow’s chlorpyrifos pesticide from being sprayed on food, despite a review by his agency’s scientists that concluded ingesting even minuscule amounts of the chemical can interfere with the brain development of fetuses and infants.
I’m retired now, and no longer spend much time keeping up with particular chemicals and the issues associated with them.
And while I do not support Trump, neither do I get all ga ga religious and climb up on a moral high horse when it comes to public health issues and agricultural and industrial chemicals.
NONE of them are GOOD for us, or good for the environment, strictly speaking. But we are compelled to use them, for now, and for some time to come, or else we eat our dogs and other pets, and the obesity problem will solve itself in a hurry.
The worst ones, historically speaking, have been banned in the USA and most other western countries, and there are some more that most definitely OUGHT to be banned, because there are workable substitutes and cultural practices that allow continued crop production at reasonable costs.
What I’m saying is that there IS a necessary trade off in every case when deciding on the use of agricultural chemicals. Rich people can afford organic food. Poor people can’t.
And I have BEEN out on the farm, forever, and thru a good ag university,and I DO keep up, in general terms. There is no way in HELL we can go to organic farming on the grand scale in the short or near term, here in the USA, or just about anywhere else, and still feed the existing population, without disrupting society in such a brutal fashion that Mao’s Great Leaps Forward are the relevant examples in understanding the costs of TRYING to go organic.
Long term, it’s at least theoretically possible to farm on the GRAND scale, and feed everybody.
Of course it’s also theoretically possible to do away with ICE cars, and coal fired electricity, etc, etc.
But actually doing these things takes decades, and in the end……… we will likely have to make some sacrifices to accomplish them, serious sacrifices, perhaps, depending on one’s pov.
OPEC, have no fear: The U.S. oil-shale output crash is here
Analyst says a crash in U.S. shale-oil production is ‘starting now’.
Concerns over the ability for U.S. shale-oil production to offset efforts by other oil producers to rebalance the market have been greatly exaggerated.
The energy industry is already suffering from the impact of spending cuts over the past several years, said Phil Flynn, senior market analyst at Price Futures Group, in a webinar held Tuesday afternoon.
“We’re losing investment in the energy industry,” he said. “It’s taking its toll.”
Global energy exploration and production capital expenditures are expected to fall by 22%, or $740 billion, between 2015 and 2020, he said, citing a report from Wood Mackenzie issued last year. Including cuts to conventional exploration investment, Wood Mackenzie said that figure increases to just over $1 trillion.
Discovery of new oil fields has already “plunged” to its lowest level since 1947, as exploration companies cut back in the wake of the drop in oil prices, Flynn said. Year to date, West Texas Intermediate crude CLQ7, -0.36% and Brent crude LCOQ7, -0.11% prices have dropped by roughly 18%.
Still twelve months before the train of projects started in the high price years is pretty well past though. But with continuing low prices, not much discovery success and few FIDs recovery to a rebound for a significant number of new, large conventional projects is now probably out in 2023 or 2024. Can TLO fill the 2019 to 2023 gap? I’m pretty sure not from EF, Bakken or Niobrara.
“We’re losing investment in the energy industry,” he said. “It’s taking its toll.”
No, they are losing investment in the ‘Fossil Fuel Industry’… Different!
Here’s an interesting thought. How much money is being invested in renewable energy, in given countries, and globally, compared to the amounts that have been typically invested in fossil fuels on an annual basis, in recent years , especially the years prior the last oil price crash???
Somebody someplace has surely charted this information. Thanks in advance for any links.
I have yet to fathom why we have a few people coming here to post “everything is going great in oil these days.” All I can assume is that they have some stock or leases they want to unload on someone who doesn’t know better.
Low oil prices may finally be starting to dissuade investors ?
Shale Rebound Runs Out Of Steam At $40 Oil
By Nick Cunningham – Jun 27, 2017
Early signs of a growing wariness among banks and investors are starting to emerge. The Houston Chronicle reports that oil companies have only raised $3 million in new equity issuance so far in June, a massive drop off from the $1 billion raised in May. That is also down from the roughly $8 billion that flowed into the shale industry in the three months after the OPEC deal was announced late last year. Some investors have “little-to-no interest in providing a second lifeline to the industry,” according to Tudor, Pickering, Holt & Co.
http://oilprice.com/Energy/Oil-Prices/Shale-Rebound-Runs-Out-Of-Steam-At-40-Oil.html
Is it all price or is some of it to do with geology (e.g. no more sweet spots)?
There is still enough room in sweet spots, otherwise the light would have gone out.
I would guess overall both price and the availability of sweet spots. Plus those new semi automated electric rigs cost $25 million each.
There are so many other places to put their money that most investors have no loyalty to gas and oil companies. It isn’t about politics to them. It’s where they think they are likely to make the most money.
The Bakken and then the Permian generated their excitement and attracted money, but now the reality of expenses and gas and oil prices have become apparent to the press and the analysts and they see there’s a limit to the present and future for these companies.
And Trump and his administration, wanting to open up even more areas for drilling, threaten to keep oil prices low for an even longer time. The solution to a glut isn’t to put more oil on the market. Thinking that we’ll deal with that glut by exporting it may not be a solution, either, because it is hard to predict what global demand will be.
FYI equity issuance yields cash and with loans are included in the now tiresome celebration of neutral or positive cash flow.
Earnings. Negative.
Rystad assumes “the expected recovery in the oil price” but as costs are in Rubles it difficult to guess Russian investment sentiment?
Rystad – Russia to deliver growth even under OPEC compliance – June 2017
In 2017-2018, we expect the start-up of important projects such as Yurubcheno-Tokhomskoe, Vladimir Filanovsky and Novoport Phase 2, and Roman Trebs and Anatoliy Titov. Imilorskoye, Kuyumba and Savostyanov are among the largest discoveries that are expected to come on stream in the future.
https://www.rystadenergy.com/NewsEvents/Newsletters/EandP/eandp-newsletter-june-2017
Oil pipeline firms' discounts rile clients, roil markets | Reuters: “U.S. pipeline operators are selling their underused space at steep discounts to keep crude flowing – angering shippers and distorting an already opaque market for oil trading.”
The free version is available today…
IEA: Oil Market Report: 14 June 2017
on this page: https://www.iea.org/oilmarketreport/omrpublic/currentreport/
The high for OECD crude inventories in 2016 was March: 1234 million barrels
The high for OECD crude inventories this year so far was March: 1244 million barrels
“Preliminary data show oil stocks falling in Europe, Japan, Singapore and Fujairah in May, but rising in the US and China. Floating storage has fallen further to its lowest since December 2014.”
Don’t know what to make of it. IEA assumes that US will continue to increase output in 2018 and that demand growth will go back to 1.4 mbd.
US oil production declined in 2016. There is no “continue to increase output”.
Year-on-year decline, month-on-month increase.
The issue, I think, is that the forecast is inconsistent. IEA seems to assume that the glut (elevated crude oil stock/low oil price) will persist well into 2018 and US LTO extraction will increase. However, LTO is unlikely to continue to increase at the current rate if the oil price stays this low (IMHO). It seems to me that we will have one of these scenarios: i) low oil price and slowdown of LTO expansion or, ii) high oil price and more LTO, but not both at the same time.
There are still a lot of people who are driving older larger cars and pickups that are gas hogs due to the fact that they are running and paid for, but every major breakdown takes one such old car off the road. The actual average fuel economy of the vehicle fleet may be a little higher than estimated for this reason. The bigger newer cars that are selling so well generally do as well on fuel economy as the somewhat smaller older models built back in the early two thousands.
In the meantime, this article from Petroleum World has a lot to say about what’s going on IN and AROUND Venezuela. The nearby countries are highly conflicted in terms of wanting to denounce Maduro, but they remain dependent on Venezuelan oil.
http://www.petroleumworld.com/storyt17062801.htm
Hi all,
Two new guest posts are up.
The first is by George Kaplan on Mexico’s Oil Reserves and Oil and Natural Gas output.
http://peakoilbarrel.com/mexico-oil-reserves-and-production/
This will be the Petroleum thread for this week, please keep other topics besides oil and natural gas related topics in the other thread (second guest post below).
The second guest post is by Islandboy on the EIA’s electric power monthly.
http://peakoilbarrel.com/eias-electric-power-monthly-june-2017-edition-with-data-for-april/
This post should be where comments on non-Petroleum topics are placed.
Thanks to George Kaplan and Islandboy for these contributions.