When will Peak Oil actually arrive? There has been considerable debate on that point recently. Well if you are talking about “Conventional Crude Oil” it arrived in 2005. But in many cases unconventional crude oil works just as well so I think we must count that. I will comment on that at the end of this post below.
The chart below is kb/d with the last data point, 2013, is the average through October.
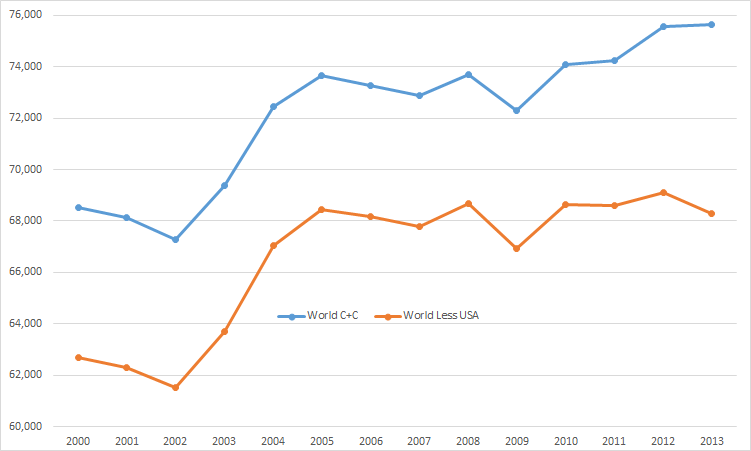
Averaging the first 10 months of 2013, World oil production was up only 66,000 barrels per day. And without the US LTO input, world production would have been down 807,000 barrels per day, lower than the 2005 level.
And it is all about LTO, primarily it is about three oil plays, the Bakken, Eagle Ford and the Permia.
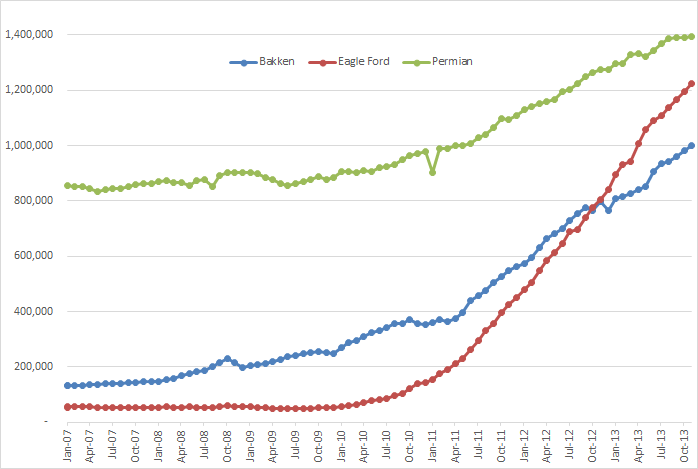
The data for this chart was taken from the EIA’s Drilling Productivity Report. The data is through December 2013 but the last four months must be taken with a grain of salt. They are nothing but a wild guess from the EIA. For instance December production in the Bakken was down over 50,000 barrels per day but the this report has the Bakken up by over 20,000 bp/d. Not to worry however they will correct the data in three or four months.
I am not at all clear on what the Permian really is. That is, is it shale oil or is it a conventional field. The Permian Basin has been producing oil for 90 years. Now a lot of people are referring to it as “shale oil” But the Texas RRC does not use the word at all in their description of the Permian Basin. I think it is basically a conventional field. Perhaps there is a small part of it that is shale, after all, the Permian is many fields, not just one. But if some oil man could enlighten us on what the Permian really is, it would be greatly appreciated.
But many in the oil business are having second thoughts about shale oil.
Wells That Fizzle Are a ‘Potential Show Stopper’ for the Shale Boom
The average flow from a shale gas well drops by about 50 percent to 75 percent in the first year, and up to 78 percent for oil, said Pete Stark, senior research director at IHS Inc.
“The decline rate is a potential show stopper after a while,” said Stark, a geologist with almost six decades in the oil patch. “You just can’t keep up with it.”
Geologists Jeffrey Brown gives his take on all this:
The net increase in US Crude + Condensate production (C+C) from 2008 to 2013 was about 2.5 million barrels per day (mbpd), i.e., from 5.0 to 7.5 mbpd. I’m assuming that the decline rate from existing production rose from about 5%/year in 2008 to 10%/year in 2013 (as an increasing percentage of production comes from high decline rate tight/shale plays).
Let’s assume that we see another 2.5 mbpd increase in net production by 2018 (to 10.0 mbpd in 2018), and let’s work backwards from there. Let’s assume that the decline rate from existing production continues to increase at 1%/year per year, hitting 15%/year in 2018.
So the projected volumetric declines from existing wells would look like this:
2013: 7.5 x o.1 = 0.75
2014: 8.0 x 0.11 = 0.88
2015: 8.5 x 0.12 = 1.02
2016: 9.0 x 0.13 = 1.17
2017: 9.5 x 0.14 = 1.33
2018: 10.0 x 0.15 = 1.50
So, in round numbers and based on the above assumptions*, we would need about 7 mbpd of new production from 2013 to 2018, just to offset declines from existing wells. And we also need new production to show the net increase from 7.5 to 10.0 mbpd.
For example, the assumption is that we would need 0.75 mbpd from 2013 to 2014, to offset declines, plus another 0.50 for new production, for a required gross increase in production of about 1.25 mbpd from 2013 to 2014, to show a net increase of 0.50 mbpd.
So, based on all of the foregoing, in order to show a net increase of 2.5 mbpd from 2013 to 2018, I estimate that we would need on the order of 9.5 mbpd of new gross production through the end of 2018. Or, based on the foregoing, in five years we would need to basically do what it took the US oil industry decades to do, as we approached our 1970 peak rate of 9.6 mbpd.
And everyone is complaining that it costs way too much these days to produce oil. Even Oman is saying the costs are way too high.
Gail Tverberg has strong opinions on this subject and dedicated her latest post to explaining in:
Beginning of the End? Oil Companies Cut Back on Spending
She says capex is way too high and uses data from Goldman Sachs to prove it.
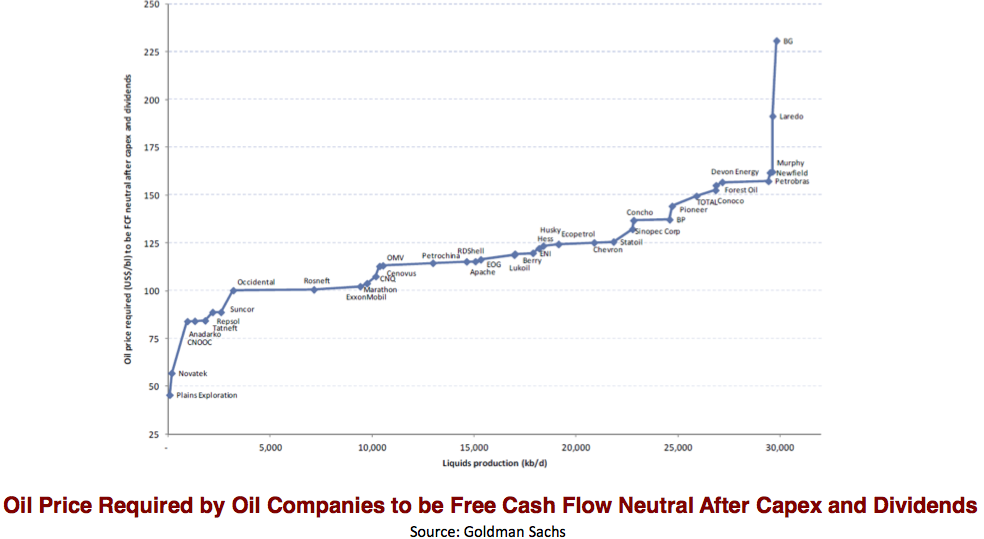
With that kind of capex required how can anyone make any money? In fact a lot of companies are losing money:
World’s largest drilling company posts huge loss
And if that isn’t enough the per barrel marginal cost of non Non-OPEC oil, last May, was $104.50. It is likely over $110 per barrel today.
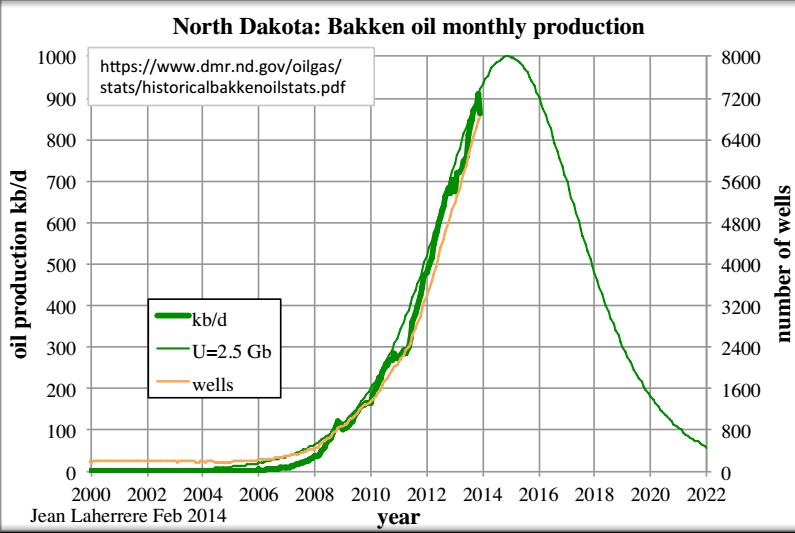
Jean Laherrere has updated his projection for Bakken Production based on the latest December data. He sees the Bakken peaking toward the end of 2014.
But when will crude oil, or C+C peak. We can only guess. It is a little like predicting the weather, like saying there is a 50% chance of rain tomorrow. I will give my peak oil prediction in the same manner but with increasing probability as we move further along the calendar. My opinion is:
There is a 10% chance that the peak was in 2013
There is a 25% chance that oil will peak in 2014 or before.
There is a 40% chance that oil will peak in 2015 or before.
There is a 70% chance that oil will peak in 2016 or before.
There is a 90% chance that oil will peak in 2017 or before.
212 responses to “When Will Peak Oil Actually Arrive? Costs Way Too High and Rising”
In regard to assumptions about the decline rate from existing US oil wells (this would be the decline in production from 2013 to 2014 if no new wells were completed in 2014):
*I think that we would all agree that a higher percentage of US natural gas production comes from tight/shale plays, versus the current percentage of crude oil production that comes from tight/shale plays. I frequently reference the 2013 Citi Research report which put the estimated 2013 decline rate from existing US natural gas production at about 24%/year, which implies that the industry has to replace 100% of current natural gas production in a four year period, just to maintain current production for four years.
Hi Ron,
As Webhubbletelescope taught us long ago (around 2005 as I recall) if extraction rates can increase we might hold off the decline for quite a while. So your guess at the peak is not very different from what I would guess. Where I think I would get strong disagreement from most people at Peak Oil Barrel is that if the World Economy does not go down the drain when the peak is reached, that we might limp along on a plateau for many years. Currently extraction rates are on the order of 2.6% of mature reserves, Norway has an extraction rate close to 20 %. Below I present a scenario with a URR of 3200 Gboe (gigabarrels of oil equivalent) for C+C+NGL where extraction rates rise to only 5.2% from the current 2.6% level, if we can go to Norwegian levels the plateau might be extended further. Note that Jean Laherrere’s World Scenarios often assume about 3000 Gb URR for all liquids. This scenario is optimistic, but the URR is only a little higher (7%) than someone who knows much more than me.
Dennis, now I know where you get your optimism from. You have the “bumpy plateau” lasting for about 35 years. Really now? Do you think that is reasonable? Silly question because obviously you do.
But countries do not stay on a plateau. They peak then decline, all within a few years. If we could coordinate all countries where they would all peak sequentially, one every year for 35 years, then your scenario would be feasible. But that is not going to happen.
In fact we have been on that bumpy plateau for eight years and it cannot possibly last much longer. When oil peaks the decline will be slow at first, perhaps no more than 1% per year for two or three years. Then it will start to accelerate to between 2 and 4% per year. That’s when things will really get tough. And if some countries, like Russia, start to hoard oil, cutting exports in half or so, then the proverbial excrement will really hit the fan.
What happens when we hit peak oil? Nothing, absolutely nothing! We will not even know it until perhaps two or three years later. But to believe that after the world oil supply starts dropping at 3 to 4 percent per year, year after year, that life will only be a little harder, and we will all figure out a way to get by, is to believe in miracles.
No, no, no. That is when things starts to collapse. Civilization as we know it will be over. Sorry about that.
And I’ll just add that even if “we” (meaning the global human population) have been on an an oil production plateau since 2005, we have not been on a reproduction plateau. Whereas we were then 6.5 billion, we are now 7.2 billion. And many more of those billions – see China as exhibit A – are stepping into fossil fuel dependent lifestyles, so the ‘production’ plateau is stretched ever more thinly among more and more of us. Toss in the net energy considerations, which includes some of the ‘oil substitutes’ having lower energy density than crude, and the declining EROEI of pret apita at all – we are instead slipping down the slope. Then there’s WT’s net export thingy… When one looks at all those aspects together, I don’t see how the cornucopians sleep at night 🙂 And I didn’t even mention Gail’s debt diatribe…
And I’ll just add that even if “we” (meaning the global human population) have been on an an oil production plateau since 2005, we have not been on a reproduction plateau. Whereas we were then 6.5 billion, we are now 7.2 billion. And many more of those billions – see China as exhibit A – are stepping into fossil fuel dependent lifestyles, so the ‘production’ plateau is stretched ever more thinly among more and more of us. Toss in the net energy considerations, which includes some of the ‘oil substitutes’ having lower energy density than crude, and the declining EROEI of pretty much every liquid fuel, and we are not on a net per capita plateau at all – we are instead slipping down the slope. Then there’s WT’s net export thingy… When one looks at all those aspects together, I don’t see how the cornucopians sleep at night 🙂 And I didn’t even mention Gail’s debt diatribe…
Ron,
It is but one scenario. If prices rise and extraction rates rise, the plateau might be extended, this is not a prediction, it is a low probability scenario maybe a 1/4 chance. A slow decline could easily be in the cards, the 1 % decline that you suggest for 2-3 years before “things will really get tough”, could be extended for quite a while especially if extraction rates can rise from 2.6% to 10 % over the next 40 years. I was wrong about Norway, I was looking at an older analysis. A more up to date analysis based on data from Rune Likvern and using Webhubbletelescope’s Shock Model suggests about a 12% extraction rate for Norway. So I think the upper limit for World extraction rates 35 years from now might be about 10 %. A scenario with a 1 % decline in oil output from 2030 to 2050 can be created by raising extraction rates from the present rate of 2.6 % in 2013 linearly to 3.8 % in 2050.
See chart, note the green + are BP data for c+c+ngl up to 2011 and then a 1 % decline from 2030 to 2050. I would put the likelihood of the scenario in the chart below a little higher maybe 50%, but only if the 1% decline proves manageable for society (as in not total chaos).
Old article from Gail explaining among other things the energy content of substitute liquids compared to conventional crude. There are also EROI differences. http://ourfiniteworld.com/2012/04/09/what-the-new-2011-eia-oil-supply-data-shows/
Hi Robert,
That is why I used barrels of oil equivalent for NGL. For those who are not familiar with this concept, a barrel of NGL has about 70% of the energy content of a barrel of crude oil so we multiply a barrel of NGL by 0.7 and voila we have 0.7 boe. There are EROEI differences as well, but for those who believe that the importance of liquid fuel is of the highest order (due to its high energy density and convenience) other types of energy (natural gas, coal, wind, solar, and nuclear) can be used in the extraction process. I am not arguing this can go on forever, my contention is that the energy cliff that many people forsee may arrive later, perhaps we will attempt to make some changes in the mean time, because the cliff will arrive and the longer the plateau is extended, the steeper the decline on the downside. A gradual decline would be a much better scenario, but I do not really have a lot of control over what path society will take, hopefully prices will rise enough that people realize that something needs to change, wind, solar, and nuclear may become more competitive with fossil fuels, maybe a very difficult transition will take place. Actually a difficult transition of some sort will take place, how difficult it is depends a lot on how soon we begin, 1980 would have been a much better time to begin, hopefully we will not waste the next 34 years.
Jeff,
I was looking at the Shale Gas Production in the U.S:
2011 U.S. Shale gas production (gross) = 8,500,983 Mcf or 23.2 Bcf per day
2012 U.S. Shale gas production (gross) = 10,296,572 Mcf or 28.2 Bcf per day
2013 U.S. Shale gas production (gross) = 11,300,000 Mcf of 31.0 Bcf per day (estimate)
I believe the Marcellus was instrumental in pushing that estimated 2013 total to 31 Bcf per day. I hardly doubt the Eagle Ford, Marcellus and maybe the Utica will be able to add 16-17 Bcf to offset that 24% decline we agree upon.
I think 2014 may indeed be the year we may get the SHALE GAS ENEMA. If not 2014, probably the next year.
Dennis,
The one thing that Charles Hall (top mind on the study of the EROI) said when he retired in a recent interview, “I tried to warn you all…LOL, now it’s your problem.”
I thought that was an interesting way to put it, but that is what Charles said to James Howard Kunstler regarding the serious problem we face with the falling EROI of energy.
Charles believes we need something north of say 10/1 EROI to sustain our modern society — maybe even higher. Shale Oil and Tar sands at 5/1… won’t pay the bills.
I am not even going to include the INSANITY of OIL SHALE at 2/1 (at best) EROI.
The manufacture and printing of hundreds of Trillions of Derivatives may be a good way to DELUDE the masses of an illusion of growth, but I don’t think we have a lot of time left before the House Of Cards comes down.
steve
Steve,
If you talk to people like Rockman, the EROEI concept just is not very relevant in the energy business. Oil and natural gas producers are in business to make money not energy.
Dennis,
I realize that the Energy Industry could care less about the EROI. However, the falling EROI is killing their bottom line. Hence the new realization of selling projects and cutting back on exploration by the Oil Majors to keep their clients, the shareholders happy.
Which you correctly stated Dennis… the Oil Majors are in the business of making profits, not producing oil.
The problem with society today is the LEFT HAND could give a RAT’s AZZ of what the RIGHT HAND is doing. This is our curse. Even though we may smack ourselves on the back bragging how we took dominion over the earth and advanced technology… Mother Nature gets the last laugh.
While I do enjoy debating these issues and researching energy, mining and the precious metals… in the whole scheme of things, we are a pathetically egotistical lot.
steve
Steve,
I agree.
And while I’ve no doubt that Rockman knows his business, it is also indisputable that money has no intrinsic value, and therefore in the grand scheme is useless to us, whereas energy, of course, has great intrinsic value, so as its ROI declines it matters greatly to society, no matter what the oil industry thinks…
Hi Clifman,
What is intrinsic value? Is it the same for you as it is for me? How is it measured.
If a thing can in and of itself do something of worth. Energy can do work. Food provides sustenance. Water & air also keep us alive. Fertile soil grows food. Money can only sit there. It can feed our dreams, but in and of itself… utterly worthless.
Clifman is right about intrinsic value. It is a word used very frequently in options trading. If an option is “in the money” it has intrinsic value for the amount it is in the money. For instance if you hold a call on stock x at an exercise price of $40 and the stock is currently priced at $41 then the call has one $1 of intrinsic value. However the current price of the call may be $2.
That extra $1 of premium over the intrinsic value will dwindle as time passes. At expiration a call is worth exactly what its intrinsic value is, that is the amount it is “in the money”. If a call is “out of the money” at expiration then it is worthless because it has no intrinsic value. That would be the case if you hold a $40 call on stock X and it sits at $39 at expiration. You lost the total premium you paid for the call. You may have paid $2 for it and you lost everything. But if the stock sits at $45 at expiration then you get $5 for the call. You made 150% on your money.
Options trading is a get rich or go broke game.
Ron,
In clifman’s world options would have no intrinsic value, since they are simply pieces of paper(or information stored in a computer somewhere) assigned dollar values by the market. I think he would look at them in similar terms as money which has no intrinsic value. He did not answer the question of measurement or the subjective nature of value. What does he think of a work of art, or a piece of jewlry? Do they have intrinsic value? Which has more or less intrinsic value?
Dennis,
I get into this debate on “Intrinsic Value” with many on the subject of gold and silver. If we are going to be ABSOLUTE… nothing contains intrinsic value…. it’s all subjective So arguing the point is like a dog chasing its tail.
However, certain things have “UNDERSTOOD” intrinsic value. Gold and silver, for instance, have intrinsic value because you can go just about anywhere in the world and most people will understand their worth.. well maybe not Americans as we have be lobotomized from the neck up on the subject of money.
Regardless…the U.S. Treasury can print a new crisp $100 bill for 12.5 cents a piece. It takes the gold industry $1,250 now to produce an ounce of gold.
Thus, the Treasury can print $1,300 worth of Benjamin Franklins for a measly $1.63. This is what the Gold and Silver mining industry has to compete with…. PAPER GARBAGE.
U.S. DOLLAR = Fiat Currency
GOLD & SILVER = Money
Every time I go to the Bank I ask for a withdrawal of Fiat Currency… not money. They look at me strange, but it’s not my fault the public has been bamboozled for the past 43 years.
steve
Dennis, I am simply giving you the definition of the word “intrinsic” as it is used in everyday language. When I was options trading and a stockbroker, I used the word many times a day.
I am sure you are aware of the fact that the meaning of a word changes as the context of how you are using it changes. I can fly and a bird can fly. But when I say I can fly I do not mean I can literally fly like a bird. I require an airplane to fly.
Likewise the meaning of the word “intrinsic” changes depending on how you use it. Clifman is correct that money has no intrinsic value, meaning it is not something you can eat or use as a tool. I am also correct in saying the intrinsic value of an option depends on how far it is “in the money”.
If we both, Clifman and I, wrote the dictionary demanding that they change the meaning of the word they would tell us both we are just silly. The meaning, in this case, depends on how you are using the word.
But basically we are both using the term to mean “of actual value”. It is just that I would, in my example, regard money as having actual value where he would not. I am saying that we are both using the term correctly, he is just using it in a different context than I.
Here’s a little thought experiment to make the point: You are tasked with building some grand infrastructure project – say Hoover Dam. There are 4 unlimited ‘piles’ of resources available to you, of which you must pick 3, then use nothing else, to do the job. The 4 ‘piles’ are energy, raw material, labor and money*. Choose well…
* And yes, money could be cash, gold, options, stocks, electronic blips – any form you like. All equally worthless (except gold’s value in making things) unless traded with someone for something else… of actual use/value.
Clifman,
This is the big problem today…. way TOO MANY PAPER contracts chasing very little in the way of physical assets.
I keep bringing up gold because I think we are going to hear a lot more about the shiny yellow metal in the future.
The Chinese imported a record 247 metric tons of gold in January — ONE MONTH. That is more than the total monthly world mine supply.
The Big U.S. Dollar reset is coming. I don’t know when it will occur, but when it comes… the public will not be prepared for a 20-30% devaluation in one day.
steve
Clifman,
Interesting thought experiment. It is not the world we live in though. And you never answered my question about how intrinsic value is measured. Generally speaking in any world I can imagine there are not unlimited piles of resources that are freely available. You also side stepped works of art and what their intrinsic value is (if any). Money is both a medium of exchange and a store of value (though not a very good one unless the rate of inflation is zero). In society as it is currently constituted, an unlimited pile of money (or better yet a bank account with a 1 followed by 12 zeroes, would enable me to build a damn by buying the goods and services to do it.
Dennis,
Starting to feel like beating the proverbial dead horse, but I’ll respond since you asked. And let me first say that while it’s clear our views of the future differ widely, I very much respect your analytical ability, and all the work you’ve put in modelling the Bakken. Also appreciate your work helping Ron manage this site. So…
No, there are not resources freely available. That’s just the point. They all have costs. It takes energy to find, extract, process & utilize them. As you point out, we live in a society that has laid dollar values over everything (except, of course the env’l, social & other externalities we choose to ignore, which, as AGW is proving, have very real costs nonetheless, but that’s another topic). So we come to think of dollars as having the value of comfort, food, mobility etc. It doesn’t. Saw a cartoon once of a Wall St. type running down the street with a lion in pursuit, tossing big bills behind him in a vain effort to find the price of not being eaten. Good metaphor for the human predicament at present, IMO. We think money can ‘produce’ ever more energy & resources, provide us with an ever brighter, infinitely growing future. It can’t. The real world has real limits and cares absolutely nothing about what financial markers we make up in our heads to assign value to any of it. This is why EROEI matters, even though as Rockman pts. out, the oil patch is ignorant of it. They want dollars, so will burn up one form of energy that’s cheap to get at the one with a higher dollar value, not caring if the energy balance is horrible. Society could have used that cheap energy to better purpose – maybe not today but certainly in an even more energy scarce future, to generate electricity, run a tractor, lots of very valuable uses, but won’t be able to, ’cause it was burned to ‘make money’. Guess I strayed a bit there, but the underlying pt. is that real things matter – energy, soil, water, clean air, stable climate, mineral resources. Money is a fiction of our imaginations. When I say it has no intrinsic value, I mean you can’t eat it, can’t heat your house with it, can’t grow food with it, can’t drink it. You have to give it to someone else who shares the mental fiction that it has value in exchange for something that has its own intrinsic value, which you then make use of. Whew!
As to art… has never meant much to me, so I’ll throw the stars at night and wild places in the same bag so that I can say, yes, I get your point. These things have emotional value to us, but that of course varies widely depending on the observer, so that’s not really what I’m talking about here. Is it Maslow who developed that hierarchy of needs? So art etc. would be near the top, not really necessary for life, but nice and certainly desired for a full life. The intrinsic value I’m talking about are of those things that provide for the basis of survival. In the culture we swim in, money plays a role, yes. But in the end, I’d rather have a donut than a dollar, firewood than a Franklin, soil than a savings account…
Clifman: Art has different value to different people. Even different artists have different value to different people. But don’t you see that the situation is the same with commodities? Different segments have different indifference prices. This is the basics of how a demand curve is created and is econ 101.
Nony- No. A BTU will provide the same amount of heat, warm my bottom the same as it will yours, regardless of any commoditization we try to lay upon it. I know I’m the outlier here and pretty much anywhere in this culture, but dollars are ultimately worthless. Energy & other resources have innate worth, ’cause they can do things of value. Some of the minds to read on this include Charles Eisenstein, Charlie Hall, Herman Daly, Steve Keen, Robert Costanza, Nate Hagens…
Hi Clifman,
You may think our points of view are more different than they actually are. I understand what you are saying about money. I was trying to get you to think about “intrinsic value” and whether it has a lot of meaning, to me it does not.
I am not quite sure if you noticed, but you never answered the measurement question, unless when you talked about BTUs you mean that energy is the proper measure of value so that we might use Joules or BTU’s to measure value.
My point is that the intrinsic value of a thing cannot be measured objectively, it depends on the person, I may think a nice pair of skis are valuable, you may not care for skiing and think that they had no value or certainly less value than the avid skier. Money is quite useful as long as others are willing to exchange something that I deem to be valuable in exchange for money so that they can exchange the money for some other thing that they think is valuable. You are certainly correct that if people were unwilling to exchange goods and services for money, then the money would have no value. On that point we are in complete agreement.
Why do I think looking for measures of “intrinsic value” are a waste of time? First because any such measure is simply a theoretical construct, one can create an “objective” value system based on labor (see Ricardo and Marx), or energy or even capital (and turn Marxian economics on its head). If you have read “The Energy Trap” blog post by Tom Murphy then you might realize why I think using energy as a measure of value might lead to less willingness to invest in renewable energy than the current paradigm. In our current way of organizing society (which I agree is far from perfect), the problem that Murphy raises of people being unwilling to invest today in technology with a high level of embedded energy (such as solar, wind, geothermal, hydro, or tidal power) because they will have less energy available tomorrow is largely hidden from view. From my perspective moving to a paradigm where we concern ourselves with EROEI, may be counterproductive if it leads to an energy trap. Under the current capitalist system there are many problems, but if externalities were valued appropriately (including carbon emissions) through taxation or fees, the system does a good job of allocating resources efficiently. Is it a perfect system? Not at all, just the best we have come up with so far (particularly in the UK and Switzerland where they have control over their money supply.)
So how does this imperfect system deal with peak oil? In Europe they institute high taxes on liquid fuels, and encourage renewable energy, they develop a robust public transit system. They also have pretty low fertility rates, though East Asia is even better on that front. The higher the price of liquid fuels (and fossil fuel in general), the more incentive there is to invest in Wind, solar, and geothermal and the HVDC transmission system needed to support them. Easy to accomplish? Absolutely not. On transport there will be be fewer and fewer cars driven by fossil fuels as prices rise and a small percentage will be replaced by hybrids and electric vehicles, most people will be priced out of the private vehicle market (cars and trucks) and will walk, bike or ride public transportation.
Also note that if the world moves towards East Asian fertility rates of 1.5 births per woman, there will be a dramatic reduction of population to 2.5 billion by 2200 see
http://www.demographic-research.org/volumes/vol28/39/28-39.pdf
Chart below with different fertility rates (0.75 to 2.5) and life expectancy of 90. (I don’t think anything below 1.5 or above 2.0 is realistic long term.)
I was just going to not bother having the basic argument. For one thing it’s somewhat philosophical. (I.e. even if you think personal indifference prices are vaporous, they still dictate results that we see in markets.) It’s just not used to having these types of discussions, especially with people not exposed (properly) to the view that they are contesting.
Even if you think a physical metric is the only important thing, why energy? I mean a cement pillar of ceramic has no energy content (in terms of combustion potential). But it has physical features (load bearing capability for instance). Actually has a complex list of physical attributes if you look at dynamic versus static, shear, compression, tension, etc. Then there is chemical resistance, hardness, temperature behavior, etc.
Even for a fuel, energy density is a difference. Or for crudes, their hydrocarbon ratios.
If you had predicted a 2016 peak back in 2005, they would have thought you a total optimist. And you seem to have moved out a year from that earlier “end of 2014” call. We’ll turn you into a cornie, yet. Come on in…the water’s great!
Kidding: thumbs up for making a prediction.
Nomy, the 2014 to 2015 thing was about the Bakken. There is a difference between the Bakken peaking and the rest of the world peaking you know. Also I am saying that there is a 10% chance that the world C+C peaked in 2013. However it is very likely that when LTO peaks in the US, the world will be at peak also. Will the rest of LTO peak at the same time the Bakken peaks? I doubt it but the two peaks will likely not be more than one year apart.
OK.
Hi Ron,
Just to clarify, you are betting that the LTO peak will be in 2016 and will coincide with the world peak (maybe at around a coin flip on the odds.) Do I have that right?
And I realize I am not quoting you and you have said none of these things, just seeing if I am understanding correctly what your opinion is.
From Ron’s statements you can indeed deduce that he expects the biggest chance of peak oil to occur in 2016 (30%) followed by 2017 (20%)
No Enno that is not right at all. I said, I believe, there is a 70% chance it will happen in or before 2016. That is not the same thing as saying there is a 30% chance it will happen exactly in 2016.
And because I say there is a 90% chance that it will happen in or before 2017 in no way implies that I think there is a 20% chance it will happen exactly in 2017.
Statistics simply do not work that way. If it has not happened by December 31st 2016 then the chances would be entirely different for 2017.
As I explained in another comment, if your life expectancy is 75 at birth, then on the day you reach 75 your life expectancy in no longer 75. It would be some figure greater. Surely you can understand that.
Ron, as Dennis also explained, these probabilities can be deduced.
Sure, as you, Dennis and I all agree, probabilities change over time, so I agree with your life expectancy example. But you make these probability statements all at this moment.
Example : if I always get my salary in the 3rd or 4th week of the month, and the chance that I get it in the 3rd week is 40%, then that means that right now (suppose we’re in week 2) I expect the chance to get my salary in week 4 is (100%-40%=)60%. Of course, once we enter/leave week 3, these probabilities will change as they are dependent. But that will only change with time, at this moment I can make definitive statements about the probability in week 4. Do you agree with this example?
I would not have argued this point, but as you seem so adamant on your position, and I am also fully convinced about mine, I don’t mind to clarify this discussion until its conclusion, until hopefully one of us has learned something.
Dennis, no I am not betting it will be in 2016 I am betting it will happen during or before 2016. That is totally different than betting it will happen exactly in 2016.
Hi Ron,
The probabilities are additive. First the life expectancy does change over time, I agree with that. For example when I was born my life expectancy might have been 65, meaning that there is a 50/50 chance I will make it to that age upon birth. The odds are very different when I am 60, at that point (depending on my health), my odds of living to 65 would have increased to 80% (I am not an actuary I am guessing).
The thing we are looking at in the present example is different. It is odds of living to 20, 30, 40,…, 60, 70 at birth. So lets say at birth the chances I will die at age:
20 or earlier -1%
30 or earlier-5%
40 or earlier-10%
50 or earlier-20%
60 or earlier-35%
65 or earlier-50%
These probabilities add up (because I can only die one time).
die 21-30 4%
31-40 5 %
41-50 10%
51-60 15%
61-65 15%
So for any age range 0 to 30, or 30-65 you just add the probabilities.
0-30 =6% or 31-65 =45%
I agree with Jean Laherrere that we will peak in late 2014 or earlier. We won’t know for sure, though because the government reported data will intentionally obscure the truth. They will include ngl’s et.al.
Ron, you have so clearly described the situation with your 2 key oil production charts: US and all else. All else has peaked long ago, 2005 to be precise. So, it all depends on shale which you have discussed here with others. My take on shale is pretty clear from the initial shale play: the Bakken. The Bakken growth rate in production is slowing. While it fell in December due to weather, the growth rate had been declining before then. I think by the end of summer, the Bakken growth rate will be close to zero:
ND ND ND
Change Change %
When the Bakken peaks in 2014, the world will peak as well.
Coolreit, if you use the HTML “pre” function then your post will look exactly like what you typed in.
That is < then pre then > and after your data < then /pre then >.
I have done that to the table in your post above.
Ron:
Thank you for fixing my format!
Hi Coolreit,
Using the output data in your comment and charting output vs month where Nov 2012 is month 1 and Dec 2013 is month 14, I applied an exponential trendline which shows a 2.2 % rise in output per month (until the December drop, but all datapoints were used for the trendline). Also notice that the rate of increase was slower before June 2013 (month 8) and more rapid from June to November (month 13). So not much of a slowdown over the period you covered except for the weather related December drop. If you covered a longer period, back to 2010 or even 2008, you would see the slowdown in rate of increase. Also note that this is about a 30 % annual increase (1.022^12=1.298), earlier (2008-2011) the Bakken output was doubling about every 18 months which is about a 60 % annual rate of increase. Your basic point is correct output is not rising as fast as before and that the peak will certainly arrive soon, perhaps in 2014 or as late as 2017, my money is on 2016+/- 1 year.
Looks pretty linear. Of course the CAGR (% rate of increase) will slow down as the total gets larger (basic math). But a linear increase doesn’t seem so awful.
It’s sort of strange though. I’m more used to things being exponential up or down or maybe sigmoid. Perhaps we are at the inflection point of a sigmoid?
Nony,
I am pretty sure you nailed it, it looks we are close to an inflection point, for now we are still concave up (second derivative slightly positive), notice the exponent on the exponential fit is positive, but I think this will change over the next 12 to 24 months to concave down and the peak will likely happen 6 to 12 months after that so 18 to 36 months (roughly) to peak for the ND Bakken, though 30 months is my best guess.
Hi Ron,
The pre function only works for administrators or possibly editors, only the HTML tags below the “you may use these HTML Tags and attributes” can be used by everyone else. I would change that if I could but I have not been able to figure out how to make those features available to everyone. Can you do that in the comment box or do you have to use the editor the way you do with img tags?
Rockman is sorely missed at least by me.
He is absolutely right for now and he will continue to be right until –well , until he is wrong.
Some kinds of energy are still dirt cheap and still extremely plentiful and so long as cheap coal for instance can be utilized in the production of oil that sells for a lot more than coal per unit of energy oil companies will buy coal and sell oil.
( The coal is used indirectly and bought indirectly as electric power and embedded energy in steel and so forth. )
It really doesn’t matter from a dollars and cents pov if energy is wasted so long as the process generates some excess dollars and cents.
Sooner or later it will matter.I don’t know how long that will be, but eventually the gap in the prices between the energy in coal and the energy in oil will begin to close.
Once natural gas becomes scarce enough the it will no longer be possible to profitably burn it in the process of producing oil because we need nitrates even more than we need oil.
We will starve without synthetic nitrogen fertilizers and natural gas is the key feedstock in the manufacture of these fertilizers.
Of course there are other ways of manufacturing ammonia which is the key intermediate feedstock but the by far most economical process starts with natural gas and this will be true so long as natural gas is cheap.
At some price point we may again use electricity to make the ammonia which used to be done back when there was plenty of excess cheap hydro. So far as I can remember the last plants making ammonia this way closed up a long long time ago.
EREOI matters but just not yet.But it will matter and it is not a question of if but when.
Wind power is supposedly unaffordable according to the fossil fuel lobby but I will not be surprised to read here someday that instead of powering all those fracking pumps and drill rigs with diesel that it has become more economical to build power lines out to the oil fields and lay temporary cables the last few miles and move or extend them from well pad to well pad. Then they can frack and drill when the wind blows and the rest of the time they can do it with coal.
I may be wrong but I think I remember reading about solar power being used some places in mid east oilfields now because it is already economical to do so. The electricity made by pv panels cost less than electricity generated by burning some of the oil, making it profitable to save the oil for sale.
If the price of oil doubles again the sand country oil fields may become home to the worlds largest and fastest growing solar farms.There are a hell of a lot of electric motors in oil fields and in sand country and almost all of them are running on oil fired electricity. Theoretically oil companies there could cut their own oil consumption by close to half by using oil fired electricity only at night.
Farmer Mac Wrote:
“I may be wrong but I think I remember reading about solar power being used some places in mid east oilfields now because it is already economical to do so. The electricity made by pv panels cost less than electricity generated by burning some of the oil, making it profitable to save the oil for sale”
That depends on what they are trying to power. They are using it to power remote sensors that send data back wirelessly. These monitoring stations need less than a Kilowatt to operate. This is like using small solar panels to power calculators. I very much doubt they are using PV to power pumping stations and other machines that need dozens to hundreds of kilowatts.
PV is often used in remote locations simply because it more economical than running power lines many miles from the grid and if you really don’t need a lot of power. You would have to run all night, and on cloudy days, off the battery. However pumps are usually powered by gasoline when they are too far from the grid. Grid power is the cheapest if you are close enough that it does not cost a fortune to run the lines.
I doubt you would ever see an oil well pump run from PV. But I have noticed, in Pensacola, billboard lights powered by PV and even a few powered by wind.
Like isolated windmills pumping water
http://oldbogus.livejournal.com/121254.html
Hi Techguy
I m sure you are right about solar being used in mideast oil fields for remote sensors and so forth but that sort of use is old news and has been common place for a long time even in locations with a poor solar resource.
I think I am right in saying that solar is being used to offset some internal oil consumption in the sand country oil fields but I did a very poor job of describing how it happens.
There are some fairly large solar farms there already that feed into the grid and the grid provides electricity to the oil industry and so they are using solar in that sense and supposedly it
is more profitable to generate the juice with solar and sell the oil.
Given that the entire generating capacity, or very close to the entire capacity , of these countries is oil fired, the awesome solar resource (sunny almost every day), the dramatic recent reduction in the cost of pv, and the high price of oil, I am willing to believe that solar electricity is being substituted for oil fired electricity for no other reason than that it is now bottom line profitable to do so.
But I can’t prove it and I have so many energy related sites bookmarked I have little hope of finding this article again. If I get ambitious I may look for some proof but tonight I don’t feel very energetic.
I got ambitious enough to google it and got this very quickly indeed.
Since Saudi Arabia relies so heavily on oil for electricity production, measuring solar grid parity in Saudi Arabia is best done by comparing the cost of solar electricity generation with the opportunity cost of burning oil for electricity rather than export. According to ClearSky Advisors’ analysis, solar energy in Saudi Arabia is currently cost competitive with oil fired power plants. The analysis states that with currently available technologies and cost structures, large-scale solar PV costs less than $0.15/kWh, while the opportunity cost of burning oil for electricity costs the Kingdom between $0.127-$0.174/kWh.
Any large increase in the price of oil will definitely make it profitable for the Saudis to use solar more and sell the oil saved thereby.
This is from a company that specializes in solar investments and it may be a little on the optimistic side but there is no question about the Saudis investing heavily in solar in the near future and they have announced long term plans for solar that are extremely ambitious .
Further more solar thermal is now up and running commercially in at least a couple of places making steam to use in enhanced oil recovery.
“This is from a company that specializes in solar investments and it may be a little on the optimistic side but there is no question about the Saudis investing heavily in solar in the near future and they have announced long term plans for solar that are extremely ambitious.”
Yeah, you can pretty much never, ever believe an industry source. Panels cost money up front. They abrade in sandstorms, the get things blown into them by the wind, you have to buy replacements, the batteries die and have to be replaced blah blah blah. Hell, even on spacecraft gamma particles start to break down the lattice structure of the blah blah blah and you get negative exponential (as particles start going thru holes already made) declines in power over time.
It ain’t magic and it’s not going to solve anything. There are ballyhooed efficiency increases screamed to the world as “new records” every year or two of 30ish% and more, but if you try to go order some panels you will be lucky to get 15%, which hasn’t changed much in quite a few years.
Always beware hype.
Hi Watcher,
At Do the Math, a blog by Tom Murphy, he looks at both solar and wind
in the following piece:
http://physics.ucsd.edu/do-the-math/2011/12/wind-fights-solar/
You are correct that it isn’t magic, but the solar resource is plentiful, and the wind resource is pretty large as well (but quite a bit less than solar).
Murphy is not optimistic that we will ever transition to renewables however because of the Energy Trap:
http://physics.ucsd.edu/do-the-math/2011/10/the-energy-trap/
Part of his argument in the Energy Trap post relies on arguments related to EROEI.
As energy becomes scarce we will need upfront investments(in solar, wind, or nuclear)to provide future energy needs and these investments have a lot of embedded energy. Murphy argues that society will be unwilling to forgo current energy consumption to provide for future energy needs.
In the real world nobody really considers EROEI, and based on Dr. Murphy’s arguments this is probably a good thing (because we would fail to invest appropriately for the future.) As the real price of fossil fuel rises, solar, wind, geothermal, and nuclear all become more competitive, businesses and consumers will invest in these technologies because it makes economic sense. Nobody knows what the embedded energy of a particular product is, they look at prices (consumers) or profits (businesses).
Dr Murphy is somewhat recently Dr.
At earth surface the solar constant is about 1 kilowatt/square meter averaging out cloudy areas of the planet vs sunny. That’s with 100% efficiency.
A lousy 110 horsepower Camry is (745 watts/hp) 82 Kw required to do the same thing as a proper gasoline powered one on an instantaneous basis. That Camry will take you 500 miles on a tank of proper gasoline.
So you want to get that 82 KW? That’s 82 square meters on the roof with 100% efficient cells. With actually existing panels you can buy it’s 7X that. Good luck with that. You want to go 500 miles? Haul a $100K Tesla class battery behind you, and plan on an overnight recharge every 120 miles.
You get rather better miles per watt on a spacecraft in orbit. Doesn’t haul much food, tho.
That 82 KW is peak power output (not energy input) . In normal driving a sane (ie European ) car needs about 10KW average at the wheels. My car holds 45 litres of diesel (at about 10KWh a litre) and will cover over 700 miles at moderate speeds. That is about 35KW at an average speed of 55mph, but the engine is only about 25 % efficient. A Nissan Leaf uses about 20KWh to do about 80 miles. The motor is nearer 90% efficient, so it uses about 14KW out of the batteries.
We do not drive 24 hours a day. To recharge a 20 KWh battery over 10 hours at 15% efficiency would need 14 Sq Metres. A lot, but most houses cover a larger area.
Hi Ralph,
Thanks. Note that not everyone drives 80 miles each day. Is the 15% efficiency for the PV, I am guessing that there are losses as well in the charging process (I have no idea how large they are).
Lets say someone works for 8 hours and commutes 1/2 hour and maybe spends an hour on errands on work days. That would leave 14 hours for charging and using your numbers I think the area needed would be reduced to 10 m^2, if only 14 kWh are needed per day, a 4 KW system should be close to taking care of the car.
Also I drive about 20k miles per year which is about 55 miles per day so I would only need about 10 kWh per day.
if I were to do a system for my home (I use about 300 kWh per month) an 6 kW system would be enough for the car and home use in a grid tied system.
Which means you’re using the grid as your battery.
And I carefully said “to do the same thing”. A Camry might not haul one light guy at 55 mph. It might be called on to haul 5 people, in a Montana winter at -20 degrees F at the Montana speed limit, which is north of 80 mph and some places unlimited.
If Europe doesn’t like that kind of driving, they are entitled to like what they like. They are not entitled to dictate what others like, unless the EU wants to do that by force, aka, military suppression of US consumption. If the EU can do that by force then they gain that entitlement. Good luck on that. I don’t think the EU has a military.
The idea of probability of peak increasing going forward seems to me a very rational way to predict that point in time when there are so many variables. The exact moment of peak means nothing except perhaps academically. The financial interactions with production or the lessening thereof are what will cause and have seemed to already have caused economic havoc. I tend to put my faith in math more than in magic so barring a miracle of Biblical proportions I guess that the peak of LTO means the peak of oil and all that it may imply. LTO may have bought a bit of time but it would seem that like the Alaskan finds it was time merely wasted as far as transitioning from FFs is concerned. Maybe it is for the best that the public indulges in the conveniently provided bread and circuses as when circumstances make it apparent that our “leaders” were guilty of lies of omission at the very least they may become a bit …irritated and …emotional.
Yup. If only the public understood what they are about to be angry about.
There are some new regs out today involving the transport of crude by rail.
http://online.wsj.com/news/articles/SB10001424052702303880604579405412862500426?mg=reno64-wsj&url=http%3A%2F%2Fonline.wsj.com%2Farticle%2FSB10001424052702303880604579405412862500426.html
I suppose people in Japan have a little better handle on peak oil and fossil fuel supplies in general than most other people.
Even after Fukushima they are going to restart their nukes pretty soon and I will not be at all surprised to hear that they are building new nukes five years from now.
http://news.yahoo.com/japan-plan-keeps-nuclear-key-energy-source-053009295.html
Japan is a compact country and already gets by with relatively little oil considering the size of the country”s economy .
If battery prices come down as much as most industry analysts think they will over the next few years the Japanese can cut their consumption of oil even further.
Japan is a compact country and already gets by with relatively little oil considering the size of the country”s economy .
Japan uses less per capita than the USA but about 3 times as much as the average citizen of the world. That could hardly be considered as “relatively little”.
Per capita consumption in gallons per day
Bingo.
It’s nice to realize others understand. US oil consumption is 24ish% of the global annual total and has 4% of the population and that’s where the GDP comes from, boys and girls.
You want that GDP, you burn oil. You don’t burn oil, you don’t get the GDP.
Japan burns something like what, 4 mbpd? And produces nada.
Good old China and India are coming. They are coming fast. And they are NOT going to allow the US to maintain that 24:4 ratio. There is no reason for them to tolerate such subordination in perpetuity. They MUST act to suppress US consumption.
Once down the road with shale, can society ever turn back until it collapses in a heap. Drill/price rise/drill
faster/price rise/drill still faster. More and more resources. Fewer and fewer rents left over to support
governments and social systems.
Keep drilling faster. 🙂
I’m actually not kidding. Replacing decline has been an issue from the first well drilled. There was some cornie who used to cite a book from 1919 talking about the problem of replacing decline. Given no new wells, the world’s oil production will drop (has always been so, will always be so). The key is drilling faster, drilling better, squeezing the towel.
And I’m saying this will work (maybe it will, maybe not). Nature does not have to favor us, just because we want oil. The prolonged high price of oil is a very disturbing factor compared to the 84-2004 low price regime. Then again, the futures curve trends down (but not radically down).
What to make of it? I donno.
Heck, I don’t know how to calculate if OPEC (or SA) is acting to control prices or is pumping full out. If they are pumping full out, it’s actually a worse situation for us than if they are exercising market power.
There is something to this perspective.
The most dangerous thing Quantitative Easing has done is expose the whimsical nature of money. If the system is at risk and needs more, then you print more, whether there is any basis for it or not.
And in that context, if you will have people starving for lack of food transport unless companies drill for oil, even at a loss, then you will print up money — in complete cooperation with other central banks, which prevents currency collapse, and hand the money to the drillers.
Which is why I don’t watch particularly the economics of oil production. If you need oil and it’s not economical, you can just make it economical by decree.
While EROEI is ignored by the industry in decision making, in the end it is all that matters.
“While EROEI is ignored by the industry in decision making, in the end it is all that matters.”
Thank you for saying this.
“Even after Fukushima they are going to restart their nukes pretty soon and I will not be at all surprised to hear that they are building new nukes five years from now.”
I think they just built themselves a doomsday machine with all these nuke power plants. Sooner or later there is going to be a issue that causes one of the spent fuel pools to catch fire, than its “sayonara” for Japan and probably a large region in Asia. Humanity can survive without electricity, however it can’t survive a nuclear wasteland. There is no difference running these plants as giving a five year old a gallon of gasoline and a book of matches and not expecting a tragedy. Fukushima has already damaged a third of the pacific ocean and its by no means anywhere near controlled.
Sorry Farmer, but I don’t subscribe to the idea of using nuclear power. Its the death of the planet, Mutual assured destruction. FWIW: I believe a nuclear war would be survivable, without the nuke plants. I don’t believe humanity or any vertebrates will survive if the worlds nuclear reactors (~440) meltdowns. Even a loss of less than hundred will probably end humanity.
“If battery prices come down as much as most industry analysts think they will over the next few years the Japanese can cut their consumption of oil even further.”
Japan is bankrupt. It has the highest Debt to GDP in the entire industrialize world, and the only way it still functions, is by printing Trillions. It would not surprise me if Japan endures an economic collapses in a few years. I can’t see how Japan can safety manage its Nuclear program with an unsustainable economy.
Japan’s government debts are largely to its own people. The Japanese people reached peak consumerism 25 years ago, and have been saving their earnings ever since. The government uses these savings to build huge infrastructure projects in a forlorn attempt to boost GDP. So when the people realise that their retirement savings have been thrown away they will be angry, but how they show that anger will depend on their national character. They may simply throw their leaders in jail and go back to a poorer way of life.
Japan reached peak consumption in 1996 at 5.739 million barrels per day. In 2012 they consumed 4.726 million barrels per day. The EIA does not give their 2013 consumption.
Always useful to note that GDP has the implicit price deflator in it to yield the Real number and so whilst Japan may report 0% of 0.5%, they are lying — much as the US does. All you gotta do is gin up the inflation adjustment and you can make the real report be whatever you want.
And that’s where the Japanese oil consumption went.
Ralph Wrote:
“So when the people realise that their retirement savings have been thrown away they will be angry, but how they show that anger will depend on their national character. They may simply throw their leaders in jail and go back to a poorer way of life.”
Its at bit more complex than that, as Japan has demographic issues with too many young people to support its economy. The majority of its labor force is approaching near retirement age. While these people could continue to work into thier 60’s and 70’s it difficult to see them working in labor intensive (industrial) jobs which has been the backbone of Japanese exports. Japan depends on food imports, and imports 60% of its food (Source USDA: http://www.ers.usda.gov/topics/international-markets-trade/countries-regions/japan/trade.aspx)
Nice post Ron. I much enjoy the fact-based discussions.
I also take away from this that you say the peak is in 2016 (30%), or the year before/after (2/3). 🙂
In general I don’t care so much for predictions, as I belief some things are not knowable. There seems to be a human craving to want to know the unknowable. I am in rural China at the moment where a favored occupation of the elderly (besides playing cards/mahyong) is to make predictions about people’s lives based on their birthdates/times.
The exact peak oil date is indeed not so important. To me it doesn’t matter whether the peak will be in 2016, or 2025. Much more important is an understanding of the forces at work to get a feel how things could turn out. A lot of good information has been presented on this site that reveals some of those forces.
I think it is rational to expect that the main period of what Rockman has called the Peak Oil Dynamic will play out in the coming several decades, and that the first effects are already here for some time.
To me it doesn’t make sense when people try to debunk peak oil or the dynamic. Consuming a finite resource will lead to a maximum extraction rate at a certain moment. You can even predict that that moment will happen after some time of rising prices of extraction compared with the capacity to pay for it. How could you possibly argue with such a truism. All kinds of consequences can be deduced from this. The first effects are of course that average extraction costs even rise faster than prices, and it is quite hard to ignore seeing that already happening for at least some producers. They will start by paying more dividends, buying back shares, and selling pieces of their business, which is all an acknowledgement that they don’t see enough profitable opportunities. At a certain moment we will need to make the transition to other energy sources, and that is an incredibly massive task, but there is just no other way.
I am not a doomer like some here to expect the collapse of civilization because of it. Not necessarily because I belief in the good of people, but I do think incentives are the main motivator of behavior. Very few people will be incentiviced by a collapse of civilization. Not much fun becoming a billionaire if people are not interested in your cash anymore. Another reason for my optimism is the rise of humankind over the last million years , which is incredibly amazing to me. I think few people understand the forces behind this rise. It’s not that people are/were so very smart, unfortunately, but there has been a great desire to communicate and improve the lives of your close ones. I have not the impression that the peak oil dynamic is going to be one of the major issues for humanity during the last million years. Throughout history some part of the population always felt doom was close ahead, and many very severe challenges were overcome. I don’t think that view is blind optimism as some may here.
But it could well be one of the main challenges during our lifetimes, as are some of the other real issues like the overuse of other resources. It is also my impression that this dynamic is not highlighted sufficiently by the media or governments and the consequences could be/are already nasty for many, which is for me why I started to visit this and related sites. I think spreading good information about these issues is the best way to start dealing with them. So, Ron, even if you don’t, I also belief you are contributing to the solution 🙂
So, keep up the good discussions. I am also happy to see that different views are spoken out as how could you possible get a better understanding of the relevant factors if don’t try to argue both ways.
I also take away from this that you say the peak is in 2016 (30%), or the year before/after (2/3). 🙂
No, that’s not quite right. I said there is a 70% chance that the peak will be in or before 2016. That could be any year before including 2013.
If there is a 40% chance of something to occur before 2016(excl), and 70% chance of the same thing to occur before 2017(excl), as you say, and assuming it can’t happen more than once, then there is no other way than to conclude that there is a (70-40=)30% chance that it occurs exactly in 2016. Right?
Similarly, given your statements, there is a (90-25=) 65% (= roughly 2/3) chance of peakoil to occur within 2015 – 2017.
Not that’s it that important, but I can’t see how it is not right.
Okay, I am not going to argue the point further but that is definitely not right at all. Just because there is a 70% chance that an event will occur before 2017 in absolutely no way implies that there is a 30% chance it will happen in 2016.
If the weatherman says there is a 50% chance of rain on Tuesday and a 50% chance of rain on Wednesday, that in no way implies that there is a 100% chance of rain during those two days.
If, at birth, there is a 50% chance you will live to the age of 75 then if you reach the age of 74 then the odds change. There would then be a far greater than a 50-50 chance of you reaching 75. The average life expectancy at birth is not the same as the life expectancy at 74. If the life expectancy at birth is 75 then the life expectancy at 74 could very well be 85 or more.
Statistics is not an easy thing to understand I know, but you have it completely wrong.
Hi Ron and Enno,
In Ron’s opinion:
“There is a 10% chance that the peak was in 2013
There is a 25% chance that oil will peak in 2014 or before.
There is a 40% chance that oil will peak in 2015 or before.
There is a 70% chance that oil will peak in 2016 or before.
There is a 90% chance that oil will peak in 2017 or before.”
2013= 10 %
2014=15 %, 2013 to 2014 is 25%=10%+15%
2015=15 %,2013 to 2015 is 40%=10%+15%+15%
2016=30%,2013 to 2016 is 70%=10%+15%+15%+30%
2017=20%,2013 to 2017 is 90%=70%+20%
2018 or later-10%, 2013 or later=100%=90%+10%
I agree with Enno.
But you are both correct that it is not worth an argument.
Also the weather forecast for two different days is about two events rain Tuesday or rain Wed, we are unlikely to have peak oil in 2013 and in 2015, we are assuming there will be a single year where a peak can be defined.
The life expectancy argument is also not relevant, the odds change as you age, just as the odds that you would give on the peak would be different in 2005, 2014, or 2020, we are talking about what you think the odds are at present, just as we would look at life expectancy at birth and look at odds of living to 50, 60, 70, or 80.
I agree with Enno and DC. Please don’t ban me. 😉
Dennis, and here I thought you were a math major. The only parts you got right was the first and last. I believe there is a 10% chance the peak happened in 2013 and a 10% chance it will happen after 2017.
The term by a certain date does not imply on a certain date.
Again, statistics simply do not work like that.
Hi Enno,
Actually its physics and economics, my math only goes up to linear algebra and multivariable calculus.
Ron
Lets say I tell you that I think the peak will be before 2017 and I think the odds are 40% that this will happen. What would you deduce about what I think the odds are that the peak will happen in 2017 or later?
Hi Ron,
“There is a 10% chance that the peak was in 2013
There is a 25% chance that oil will peak in 2014 or before.”
Let’s try it this way, what do you mean when you say 2014 or before? I am assuming that you think output in 2013 will be more than 2012, so it does not mean that the peak will be in 2012 or any earlier years. I would interpret “2014 or before” as either 2014 or 2013, I am assuming that you think the peak will be in one of these two years, if it happens “in 2014 or before.” Now let’s think about the odds of rolling a 1 or 2 on a roll of the die. There is a 1/6 chance of a 1 and a 1/6 chance of a 2 so the odds of rolling a 1 or a 2 is 1/3=1/6+1/6. Likewise since you think the chances of a peak in 2013 or 2014 is 25% and you also think the chances of a 2013 peak are 10%, then you must also think that the probability of a peak in 2014 is 15%. To deny this would be like the following statement, I believe the chances of rolling a 3 or a 4 is 1/3 and that the chances of rolling a 3 are 1/6, but that doesn’t mean you can say anything about the probability of rolling a 4 (oh yes I can, it’s clearly 1/6.)
http://en.wikipedia.org/wiki/Probability#Summary_of_probabilities
If two events are mutually exclusive the probabilities are additive.
So event A is peak oil in 2013, probability=10 %
and event B is peak oil in 2014, probability=15 %
Event A or Event B (peak oil 2014 or before)=10 %+15%=25%
And I am done.
LOL! This is too funny! You guys remind me of the the CNBC hosts that debate and over-analyze an economic statistical figure.
Its not possible to really estimate when production will peak as there is way too many variables that have not to do with geology will influence production. We have the middle East destabilized, a massive debt ponzi scheme in the industrial world. A potentional geopolitical crisis in Asia (Japan-China, or North Korea). A major economic downturn could cut production for an extended period resulting in a plateau or demand destruction. We could have a War that cuts exports in the middle east or some other region.
We are already pass the peak! Since about 2005 the price of oil has risen considerably high and that it was the higher price that permitted soaring CapEx spending by Oil producers to increase production. Peak conventional oil happened in 2005 an I believe in time, historians will refer to 2005 as the peak year since past that date, prices soared and the western economies began their permanent downturn. Peak Oil is really about future economic growth, fueled by cheap and abundant oil. I doubt think anyone can argue that we will ever see energy as cheap as we did prior to 2005, which is really the only thing that matters. The battle is over, the war is lost, you guys are just watching to see which crippled soldiers limp away from the battlefield, count causalities and bodies.
The only thing supporting production is the debt ponzi scheme. I will make a prediction and I am certain it will be correct: The year global production peaks in Mb/d is the year the Debt Ponzi pops. Once the Debt ponzi crutch is gone CapEx for non-conventional production will disappear overnight. The same with the massive amounts of investments in maintain existing conventional production.
Exactly Dennis, thank you.
You honor your math major 🙂
I PREDICT…. 100% PEAK OIL after 2014.
steve
That doesn’t work Steve, I need 2 statements to make a deduction. How much chance of having peak oil after 2018?
Enno,
LOL.. I like my original forecast. I think there is a 100% chance we peak sometime after 2014.
steve
Steve, that is quite bold. I will go further the chances are 200% 😉
Dennis,
I will match and double your bet… 400%.
steve
Hi Ron,
there is a 0% chance that the peak was in 2012 or before
“There is a 10% chance that the peak was in 2013
There is a 25% chance that oil will peak in 2014 or before.
There is a 40% chance that oil will peak in 2015 or before.
There is a 70% chance that oil will peak in 2016 or before.
There is a 90% chance that oil will peak in 2017 or before.”
There is a 100% chance that oil will peak after 2012
I believe the following is equivalent:
10 % chance peak is in 2013
25% chance peak is in 2013 or 2014
40% chance peak is in 2013 or 2014 or 2015
70% chance peak is in 2013 or 2014 or 2015 0r 2016
90% chance peak is in 2013 or 2014 or 2015 or 2016 or 2017
100 % chance peak is in 2013 or 2014 or 2015 or 2016 or 2017 or later
Lets compare to the following when rolling a single die (cubic):
10% chance of rolling a 1
25% chance of rolling a 1 or 2
40% chance of rolling a 1 or 2 or 3
70% chance of rolling a 1 or 2 or 3 or 4
90% chance of rolling a 1 or 2 or 3 or 4 or 5
100 % chance of rolling a 1 or 2 or 3 or 4 or 5 or 6
We have an unusual die.
A fair die would have been 1/6, 1/3, 1/2, 2/3, 5/6, 1.
But as in the case of a fair die where we could find the probability of a 2 by 1/3 minus 1/6 which is 1/6, our unusual die has a 25%-10%=15% probability of a 2, likewise the 3 has 40%-25%=15% probability, next 70%-40%=30% is the probability of a 4, the 5 has 20 % probability (90%-70%), and the 6 has a 10% probability (100%-90%)
These ideas are the basis for
2013=10%
2014=15%
2015=15%
2016=30%
2017=20%
2018 or later=10%
Peak Oil is fascinating and I can’t tear my eyes away. I’ve been following the data for many years now would say that I am addicted to any news in regards to energy, always waiting with baited breath for a production decline which may or may not represent the start of the down-slope. Why? I don’t really know. I guess it stems from wondering about what changes will happen once the down-slope starts and the trend becomes clear.
Will we continue to fumble on attempting BAU?
What will happen to world economies?
Will governments come together and implement sensible policies or rationing?
Will we have eventual social chaos or war?
Will life go on largely as normal and peak oil be a non-event?
Will the cornucopians or doomers be right? Or will a middle-ground occur.
So many questions! Given that I thought the peak would be earlier 2010’s I now had to revise my own original estimation and would not be entirely surprised if the peak if further off than some think. Maybe I need to forget about peak oil for a while and focus on other things! The anticipation is killing me 🙂
Leslie Corrice is an excellent source of news and information about Fukushima and other nuclear issues including radiation hysteria http://www.hiroshimasyndrome.com/fukushima-commentary.html
Ron made a reference to this article (Wells That Fizzle Are a ‘Potential Show Stopper’ for the Shale Boom) which contains the new meme for the LTO companies — software! Yes, software to the rescue. Here are some choice tidbits.
“The oil patch needs more brain for its brawn.” Hmmm…I see, the problem all along has been too many bulked up geologists who spend their time at the gym instead of studying.
“The reason is enough to give pause to anyone enjoying the benefits of cheap, abundant energy produced in the U.S. “ Oh, man, have I ever been enjoying that cheap abundant energy. Just had a cheap, abundant energy party down in my man cave last week. Woo hoo.
“New wells are fizzling out in their first year, threatening the 3-year-old oil boom.” Dude, did you have to bring me down? Is there an answer? There must be some really really smart people working on this problem.
“The challenge is forging alliances between two groups who previously rarely needed to work eyeball to eyeball — the people who know rocks and the people who poke holes in rocks.” Huh? What the hell are you talking about man? Are you talking about drillers and geologists? WOW! And all this time I thought the drillers and geologists worked together. How could they have missed such an obvious opportunity?
“Halliburton engineer Ron Dusterhoft, who was charged with marshaling a SWAT team of experts to tackle the problem, can now see a solution using artificial intelligence software dubbed Cypher. One Texas well that the team studied for months should have been drilled deeper, at a different slope, to really hit the sweet spot for oil.” Yeah Baby! I love SWAT teams. So these dudes flew in on black helicopters and used artificial intelligence (the best kind of intelligence I’m told) and they hit a sweet spot on one well. Go SWAT, Go SWAT!
“A lot of these wells aren’t performing well because they just haven’t been put in the right place,” he said. So THAT’S why they aren’t performing! Guys, come on! Put down the barbells and start putting the wells in the right spots!
“Just when the nation is hastening its march toward energy independence, the industry is concerned about crummy rock causing shale wells to sputter, some dropping as much as three-quarters of their output in the first year. That forces drillers onto a hamster wheel: They have to drill more wells, faster, to keep production up and satisfy investors, who in turn see costs rising and profits suffering.” Much as I would pay to see drillers forced onto a hamster wheel, I wouldn’t want to do it if it means investors not being satisfied.
The industry has so far been able to live with the decline curve problem because operators have been able to scratch out better initial production in wells, Stark said. “If you don’t have that improvement, then you get stuck after a while and have to drill more and more wells just to stay even,” Stark said. OK, OK, I know this is the big build up. Things are looking bad but there’s an answer, right?
Now, energy companies including Halliburton and Schlumberger Ltd. are realizing they need to buttress their efforts with brains before brawn.
Dusterhoft was charged with assembling a SWAT team of engineers and geologists at Halliburton — something new in shale drilling where the two disciplines traditionally minded their own tasks: geologists found the oil, and engineers figured out how to drill the well.
Understanding the peculiarities of shale rock requires bringing both into the same room for the first time. Yeah, let’s get those geologists and drillers into the same room. Sounds like a start. Why the heck didn’t they think of that before?
Before the hunger for more science and technology, the industry was essentially drilling wells blindly, said Peter Duncan, a former geophysicist at Royal Dutch Shell Plc who founded Microseismic Inc. Operators originally viewed shale rock in the “layer cake” model, thinking all of the rock was the same. Real-world experience showed that’s not the case, he said. Silly operators. I’m getting hungry for more science and technology, how about you?
Commingling the expertise of their scientists through a software program Schlumberger calls “U-ROC” has led to an almost 30 percent increase in production in some wells in the Eagle Ford, Cordes said. U-ROC! I love it! It has a cute name! I want in on some of that U-ROC magic, where do I send my money?
They’re starting to figure it out. Laredo Petroleum Inc. shares doubled in the five months after it talked on a call with investors in May about working with Halliburton on well-spacing and by using a “science-based approach” in West Texas’ Permian basin. Oh Baby, do they ever have it figured out. Shares double after a call to investors? It’s like printing money. It’s better than printing money!
By August, Laredo said it had its best-ever results in the Permian and that it was “among the best” of all peers working there. The well’s success was attributed partly to Laredo’s own internal efforts to pump more time and money into the science of drilling and production, said Ron Hagood, a spokesman at Laredo. And oil company executives never lie or exaggerate, so it must be true. But exactly what does “among the best” mean? And what does “of all the peers working there” mean? And what does “attributed partly” mean? Could you please be a little more specific? No? No way in hell you say? Shut up you say?
THE BIG FINISH
Ultimately, Dave Dunlap, chief executive officer at Superior Energy Services Inc., said he doesn’t ever see the decline curve challenge going away entirely.
“We’ve drilled all the good stuff,” he said. “These are very poor quality formations that I don’t believe God intended for us to produce from the source rock.” Man, and I was just starting to feel good. You’re a bummer. And if God didn’t intend us to produce from that rock how come we’re doing it? Are you saying God is wrong?
Awesome post, man. “Come on guys, put down the barbells!” 😀
I think the high decline rate was pretty well known. We’ve put thousands of holes into the Bakken and have data based on current development scheme going back to 2008. This pitch seems more aimed at companies that haven’t been drilling in the shale than those that have.
Hilarious…
I re-posted it over at the Hedge….
http://www.zerohedge.com/news/2014-02-26/russian-lukoil-halts-oil-supplies-ukraine-odessa-refinery#comment-4481181
In other news:
This from seeking alpha. Talking about how Schlumberger is going to profit from KSA’s attempts to squeeze more out of their aging fields.
“The increasing rig count will lead to growth for the oil-field services companies in Saudi Arabia, resulting in increasing expenditure by Saudi Arabia’s national oil company, Aramco. Aramco’s capital expenditure budget between 2003 and 2013 increased from around $4 billion to around $40 billion to recover more oil from oil reservoirs.”
Ten times growth in capital expenditure and production has grown how much?
As Saudi Arabia tries to increase its production output through reservoir optimization, the OFM service could experience higher demand in the coming quarters.
Reservoir optimization — squeezing the sponge harder.
Good news for oil service companies, not so good for the world.
Calhoun, thanks for the link.
Question: If Saudi Arabia has, as they claim to have, 264 billion barrels of proven reserves, then why have they multiplied their capex by 10 trying to squeeze more oil from their old reservoirs? The answer should be obvious to everyone, they really don’t have 264 billion barrels of proven reserves.
Depletion drives supply curves to the left. Knowledge drives them to the right. I’m not saying who “wins”, just that both factors occur.
Yes. Sorry. Lysdexic. 😉
I know of wells in the Bakken that have been pumping oil from the ground, one well in particular is in its 50th year of production and doesn’t seem to want to stop.
The decline rate on a Three Forks well that I have followed is at 75 percent. The well began producing 400 barrels per day and is at a 100. Seems to be the case across the board, however, new wells drilled in an old field do produce more than the first well in the field. Production increases are a possible with new technologies and innovation. It does happen. What was once 1 became 10 overnight. I see it happen.
The plan for the Bakken is closer to 60,000 wells, not 25,000. Wells are going to be drilled over the next 15 years at a non-stop pace. 150 conventional rigs and may also include continuous motion rigs drilling at a pace of 2 per month in 180 months is going to be 54,000 wells, add that to the current 9000 plus, it is going to be enough. 100 barrels per day per well averaged will produce 6 million barrels per day.
At 11 million dollars per well, the investment needed will range in the 700 billion dollar range. I think the math is correct.
If you follow the daily activity in the Bakken, you will and do see wells that have an initial production of 1200 to 4800 bpd. McKenzie County is the sweet spot these days.
I do predict the wells will probably produce oil for 100 years and there are oil wells in the Bakken that have pumped more than 60 years, so the proof is in the pudding. The Bakken is going to produce oil until the cows come home.
The Peak Oil Cliff is closer to 2045.
A well drilled 50 years ago would have to be in a conventional reservoir, no? My understanding is that they didn’t frack 50 years ago. Conventional reservoirs have much longer life spans than fracked wells, don’t they?
In any case, it’s true that low production stripper wells will provide an important cushion for the United States as more productive fields deplete. However, the $700 billion you quote is based on today’s costs — don’t you think drilling costs will increase in the future? Even at $700 billion, that’s a lot of money — what price of oil will be needed to support that? And then there’s the issue of where to drill. It’s one thing to have the ability to drill, it’s an entirely different issue to have places to drill. Do you think there are sufficient sweet spots left to carry us through to 2045? Of all the forecasts of a peak oil date I’ve seen, yours is by far the most optimistic.
If one chooses to believe* that the finite sum of discrete sources of oil that peak and (rapidly) decline will result in what one Texas Railroad Commissioner called “Relatively boundless” resources, many scenarios are possible.
*AKA cognitive dissonance
Jeff,
I think cognitive dissonance may be an incorrect diagnosis, delusional might be the more accurate description.
As noted above, if we take an optimistic view, and assume that US Crude + Condensate (C+C) production hits 10.0 mbpd in 2018, and assume–in my opinion–a conservative estimate that the overall decline rate from existing production increases from about 10%/year in 2013 to 15%/year in 2018, then we would need to put on line something like 9.5 mbpd of new production in five years, in order to offset declines and to show a net increase of 2.5 mbpd (from 7.5 mbpd in 2013 to 10. 0 mbpd in 2018).
For an example of why I think that an increase in the gross decline rate (decline from existing wells) from 10%/year to 15%/year is a conservative estimate, consider the fact that the observed net decline rate in Alaskan production from 2005 to 2012 was 7%/year (this is the net decline rate, after new wells were put on line; the gross decline rate from existing wells would be higher, and these are of course conventional wells). And as noted above, Citi Research estimates that the gross decline rate from existing US natural gas production is about 24%/year.
In any case, for the sake of argument, let’s assume that we hit 10 mbpd in 2018, and let’s assume we stay there for 27 years, until 2045, at a fixed gross decline rate of 15%/year. We would need 1.5 mbpd of new production every year, just to offset declines, or about 40 mbpd of new production over a 27 year period, in order to maintain 10 mbpd for 27 years.
Walter,
I suppose you are honestly optimistic but you are forgetting some facts. Every body is entitled to his owns opinion but not his own facts.
I will not argue about a typical Bakken well starting at 400bpd and putting out 100bpd four or five years down the road.
But five years after that any typical Bakken well is going to be down into the twenty barrel class or thereabouts.
Other tight oil plays may do better or worse but so far there is so far as I can see no evidence that they will do better.
And the decline in output of conventional crude is proceeding apace at anywhere from a two or three percent on up to as high as six or even eight percent annually depending on whose figures you use.Conventional crude plus condensate makes up well over ninety percent of the total supply and tight oil output will have to grow by millions of barrels annually in order to just hold supplies constant even before considering the scary decline rates of TYPICAL tight oil wells.
We will be damned lucky if we have even ten more years of stable oil supplies and even then we will be sharing that supply with a a fast growing Asia.
The very best peak oil metric is supply per capita any way because the peak in and of itself is important in the grand scheme of things only because once the supply per person starts dropping of noticeably we are going to be in a world of economic hurt.
Barring a miracle in the oil industry peak oil per capita is history.
My personal opinion is that we are still on a conventional plateau that might possibly last as much as a couple more years but most likely not. Depending on how you eyeball the production graph for the last ten years some people who actually study the production records ( I have only eyeballed the graph) think the plateau portion of the historical production record has definitely started to trend down.
They may be right. I certainly wouldn’t bet against them.
I would bet my last can of beans that the world will wake up to peak oil well within a decade because it is going to smack the world upside the head like mugger’s brick.
According to North Dakota’s own data production per well per day, in the Bakken, dropped from 134 barrels per well to 126 barrels per well in one month. And that is even counting all the new wells that came on line in December. That is one hell of a drop and should tell you something about the sustainability of Bakken wells.
Hi Ronald,
If you look at this paper:
http://pubs.usgs.gov/fs/2013/3013/fs2013-3013.pdf
A report by the USGS which estimates a mean undiscovered TRR in the ND Bakken/Three Forks of 5.8 Gb. When you look at the risked well totals in the sweet areas of North Dakota you get about 21,000 wells, if you add in the non-sweet areas except the three forks where the non-sweet EUR is only 85 kb you get an additional 10,000 wells for a grand total of 31,000 wells. Note that some of these non-sweet areas have a pretty low EUR of 154 kb and 178 kb which may be too low for profitability so even 31,000 wells is quite optimistic, 25,000 wells is a better guess unless oil prices rise a lot to maybe $118/barrel in 2013$.
DC, have a lot of respect for your unbiased opinion and for the USGS as a middle course between cornies and doomers. Just sharing a small qualitative data point (not mean to argue, just grist for the mill):
http://www.thedickinsonpress.com/content/helms-well-site-footprints-changing
(Obviously the guy is a bit of a cheerleader. Then again, ND state’s estimates from a couple years ago ended up being more realistic than USGS, Rune, Picollo, etc.) In particular, the comment at the end is interesting.)
Ok 8 to 14 Billion barrels vs 6 to 11 for the USGS, I still think the USGS estimate is better, I have been wrong before. So it looks like the Mean estimate is probably 8.5 vs 11 a difference of about 2.5 Gb. I could split the difference with a mean of 9.75 Gb, but my gut says that is probably too high.
It’s still curious to me:
1. First year IP not dropping. This definitely shows a very different kind of feature than most conventional plays. I really do think it makes sense more to talk of it as a continuous resource (with some differences in sweetness) than a set of different fields as Rock advocates. It’s more like a vein of ore than a trend with little pools of oil.
2. Rig count: 2014=2013=0.8*2012. This is really strange to me. I would expect that if the play is desirable, that rig counts should keep climbing. Or if exhausted, that they would start dropping. But instead we see this strange phenomenon of 2014-2013. Yeah, with efficiency increases, we are still getting enough well drilled to raise overall production. But if it’s a desirable play, wouldn’t the dollars incent more rigs to be here? [And have a much bigger rate of production increase?] Is there some bottleneck (pads even being the bottleneck? takeaway?)
Excellent point Nony, I was curious about that 2nd point as well. If you’ll ever hear an answer from the industry on that please tell.
I have said it before, I think fracking crews and equipment is the bottleneck, others think it is roads and/or trucks, perhaps it is a combination of all three. Rigs at there present level have been able to stay ahead of the fracking so there is no need for more rigs. Also early in the development of the play there was a lot of moving around to get some production on leases to secure them. Most of this has been accomplished and now multi well pads are used to drill more wells on a single lease, this saves time moving in and rigging up which makes each rig more efficient.
If that is the case, and rigs are at least for now not the bottleneck anymore, then the rig count also has lost its meaning as a valuable predictor.
Enno,
That is correct. The NDIC should look at what is the bottle neck, is it roads and/or trucks as Watcher thinks (please correct me if this is wrong, you may think it is fracking crews/equipment and roads/trucks) or fracking crews and equipment or is it a combination of these?
Something that the Director’s Cut tracks each month is the number of wells waiting on fracking services. Dec 2013 this number was 635 wells.
https://www.dmr.nd.gov/oilgas/directorscut/directorscut-2011-09-12.pdf
In the Director’s cut from Sept 2011, Mr Helms made his first mention of wells waiting on fracturing services, though for the previous 5 months he had talked about the idle well count which is related.
From the Sept 2011 comments section:
“The idle well count dropped significantly to 816 wells in July, but normal is 450, indicating a continuing backlog of over 350 wells waiting on fracturing services.”
Over the last 30 months this backlog of wells waiting to be fracked has increased to 635. I think a better metric is the % of idle wells, which in July 2011 was 12.4%, in July 2013 the % idle wells was 9% (so that we attempt to eliminate weather differences). In Sept 2013 idle wells were also 9 %, Nov 2013, still 9% and in Dec 2013 idle wells increased to 10.5%. In Sept 2011 idle wells were 11%, Nov 2011 idle wells were 10.8%, and Dec 2011 idle wells were 10.9 %.
Based on these numbers I have changed my thinking and maybe fracking is not in fact the bottleneck and Watcher is correct about the roads and trucks or that there is no bottleneck, though takeaway capacity in trucks, pipelines and rail may prove to be the bottleneck.
One mistake that Helms seems to be making is that he assumes a normal number of idle wells of 450 wells which he has not updated since first introducing it in Sept 2011 (applied to July 2011 preliminary data). In July 2011 450 idle wells was 6.8% of wells capable of producing, if we apply this percentage to the wells capable of producing in Dec 2013 we get 761 idle wells as the “normal” number of idle wells (6.8% of all wells capable of producing). This would reduce the number of wells waiting on fracturing services to 422 wells which is not that different from July 2011 (where the number was 361 wells) especially considering the terrible December weather.
Also note that in Nov 2013 using this same method we get only 283 wells waiting on fracturing services. Nov 2013 there were 1035 idle wells, 6.8% of all wells is 752 idle wells for the normal % idle, 283=1035 minus 752, 283 wells waiting on fracking.
For some reason Mr Helms has reduced the normal % of idle wells to 400 wells in Dec 2013 which is about 3.6% from the 6.8% level in July 2011. Perhaps some industry guys could give us a fell for what a typical number of idle wells should be in % terms, perhaps 5% makes sense for a “normal” % of idle wells?
Interesting that when I use 5% for a normal % of idle wells for July 2011 and Nov 2013 I get almost the same number of wells waiting on fracking services (487 and 482), this could just be coincidence.
You know what would be interesting is to know if drilled but not yet fracked wells have an expiration date. If you drill but don’t push the fracking stuff in for a month, or five, does the horizontal lateral start to close?
Now that would be cool.
When I receive letters from mineral corporations to buy the minerals on the acreage, I have to believe that the corporation is confident that there is oil to be found and pumped out of the ground.
I would also want to believe that when the well is drilled, that the oil is there.
99/100 wells drilled in the Bakken strike oil. Probably closer to 100/100.
I can accept the amount offered, 5x of the land value, or I can lease and receive a royalty or I can not lease and be a non-participating owner or I can participate in the cost of the well and receive all of the oil income less costs and expenses.
I can accept pennies on the potential dollar return or I can reject the offer.
It’s an easy decision.
The Bakken has much more oil that is recoverable than is believed by even the most cynical of skeptics.
Hi Ronald,
I would be careful about believing the hype from the oil companies, I think the USGS or NDIC would be your best bet for information. Currently the high end of the USGS estimate for the Bakken Three Forks in North Dakota is 11.5 Billion barrels, and a recent estimate (in a link by Nony above) by Lynn Helms is 8 to 14 billion barrels, the low end of the USGS estimate is about 6 billion barrels of oil. I think your best bet would be to figure on 8 to 10 billion barrels, and it would be safer to assume the low number but you seem to be an optimist so you could go with the 10 billion barrel number. Also remember that when you add in economic assumptions to figure economically recoverable resources, the total URR drops by a billion or so barrels with fairly reasonable assumptions.
Ron,
I see that your C&C total includes LTO. Does it also include bitumen?
Yes, it includes everything the EIA reports as Crude + Condensate and that does include bitumen/
Thanks for your prompt reply, Ron.
I don’t know if you’ve already done this (I don’t recall ever seeing it) but it would be illustrative to show a composite graph of conventional C&C, topped by LTO, topped by bitumen.
This would show clearly the decline of conventional, pumpable C&C which has been our mainstay for 156 years. It would also demonstrate how we are increasingly forced to turn to unconventional, more energy-intensive sources for our liquid fuel supply.
You are doing excellent work, Ron
Rick, I would love to do such a chart but unfortunately I do not have the data. To my knowledge no one published data on bitumen. For LTO the EIA publishes their “Drilling Productivity Report” but that includes a lot of conventional oil from the Permian basin in Texas. I might do that anyway however. Look for it in a few days.
Bitumen stats
Ron, this should help:
http://www.capp.ca/library/statistics/basic/Pages/default.aspx
CAPP says (2012) oil sands (mined + in situ) is 1.744 mbpd. This fits with what I’ve seen elsewhere (that oil sands are now around 1.8). Dave Hughes may have better info, but I think we’re in the ball park here.
One further suggestion, if I may: please separate the mine-able from the in situ. Eventually Canadians will wake up and find that most of our conventional oil and most of our mine-able bitumen is gone, leaving our grandkids dependent primarily on in situ bitumen.
Such a graph would illustrate the shift as conventional declines and our supply has to be padded on top with lower-grade sources. Some day there might even be some kerogen to add as the icing on the cake, so to speak.
Thanks for considering this, Ron
Rick, this is two years of Oil Sands production, 2011 and 2012. I can’t make much of a graph with just two data points.
I think Oil Sands production is far more stable than LTO. That is they can keep this up for many years where LTO will start to decline fast unless they keep drilling more wells in new places.
And I do have several years of monthly data from on LTO production, such as it is. That is I have the data from the EIA’s “Drilling Productivity Report”. They have production data on all the shale fields though they just guess at the last six months or so. And they include a lot of conventional oil with what they call LTO. Anyway I will see what I can do.
Hi Ron,
An idea for trying to capture the LTO in the Permian is to back out the Permian output that is not from the Spraberry trends recent rise (starting about 2005.) So in 2005 Permian output was about 685 kb/d, just subtract this from the numbers in the EIA’s DPR and you may get a (very rough) idea of LTO output from the Permian.
See
http://peakoilbarrel.com/will-peak-oil-actually-arrive/comment-page-3/#comment-10311
An alternative would be to take the average Permian output from Jan 2007 to Dec 2007 in the DPR and assume that is mostly conventional, subtract that average from all of the Permian data in the DPR to estimate LTO from the Permian.
Also Ron you can use Canadian statistics to get the bitumen data, if you want to do it, I agree that the bitumen output is likely to be more stable.
Complex chaotic systems are not inherently predictable with much accuracy. A range of possible outcomes and their probabilities is a good approach. When the timing of x is uncertain, as is peak oil (and here I mean all C&C from all sources) then it is wiser perhaps to focus on the function of x, f(x) which can be qualified. When peak oil arrives we know there are functions of that event which are predictable. Cascading debt default will be one of the first likely dominos. The political and fiscal policy responses to that and their effectiveness are not very predictable so it is more useful to get down to a more granular level of f(x). Increasing unemployment, reduction in social services, reduction in servicing pension benefits, disruption to the supply of medicine and food, increased social upheaval, rapid deflation of paper assets, increased capital controls. Often I feel that the debate over the timing of peak oil is a nice intellectual distraction from the reality of facing up to the function of that event. The resources to deal with the coming reality will be inherently limited by that reality. Information, being fractal in nature is infinite and so we can debate forever. It is very useful to remember however that their are limits to all information and analytic systems. To live ones life in this information reality is like being a candle in the wind. If instead we choose to live primarily in the reality governed by the underlying universal laws, then rather than living in a world filled with noisy information signals, it is a world that is stable and tranquil. Information is vital, but it isn’t absolute. Use what little emotional energy you have to deal with what is coming, because it is coming, of that we are sure.
Want to know what it’s like working the Bakken in winter? Please watch Video
I hear it is pretty hellish. But there is still a kind of mountain manly aspect of it. It almost seems like Colorado or that steel invention in Atlas Shrugged. Last dying gasp of American capitalism. Gotta respect that, man.
Read this: http://themilliondollarway.blogspot.com/2014/02/putting-really-important-things-into.html (scroll down from the coffee/donuts)
I just watched it. The guy is a whiner. Pioneer spirit…not.
Hard to make a case for capitalism when printed money creates 0% interest rates financing drilling.
Yes, I know the guy is shilling his website (how the hell is that going to work out?) but you still get a sense of what it’s like on the ground.
This link is about saving the gas instead of flaring it.
http://www.ibtimes.com/energy-companies-seek-ways-capture-natural-gas-north-dakota-oil-boom-1557877
Just got interested in how much LTO relies on trucking. I learned a lot. Gives EROEI a whole new meaning. Bottom line, it’s like a huge rube goldberg machine. No wonder they saved the Bakken for last — who would have come here if there was easier oil someplace else?
Road dust control
Guy spends his nights driving 5 miles an hour spreading water on roads to keep dust down.
Bakken Trucker
Guy’s a real character, interesting just to hear him ramble on. Hauled crude, water, dust control. Says “Frackers are an interesting breed.” Has interesting comments especially about 30 below temps.
Hauling separated water Oil is heavier than water? OK, the guy got that backwards but still learned something I didn’t know. I guess they use the separated water for new fracs.
Crude trucker
Truck carries 215 barrels of oil – they must need a whole lot of trucks out there. The truck weighs 120,000 lbs. That’s gotta do something to the roads. Talks of hundreds of rigs and flares at night.
Oilfield Transload Facility
Very short but I just love the visual — so many tank cars waiting to be filled.
Hauling gravel
You also have to haul gravel to the pads. Who knew?
Whole long line of trucks
That is quite a line of trucks, and it didn’t look like much of an offloading parallel configuration.
When you see lines of trucks (or cars), with gaps developing between them that means someone turned off their engine because the wait is so long to drift forward a few feet.
It obviously takes a while to design and build prototypes of new equipment and then some more time to put it into production so it is not too surprising that Bakken operators are just now getting started saving the gas that comes from wells too far from pipelines to get them hooked up.
These are more or less self contained trackable units that can compress the gas and put it into a storage tank and it seems they are also capable of stripping out some of the more valuable fractions for separate sale. Once these units become common it is likely that most of the new equipment sent to the Bakken will be dual fuel enabled because the savings on diesel can easily run into hundreds of dollars per machine per day.
A really big diesel engine up in the two to three thousand horsepower class can upwards of a hundred gallons an hour but there probably aren’t very many that big out there except the ones on tracking trucks that drive the pumps.
A five hundred horsepower truck usually uses around fifteen gallons an hour when it is actually hauling a heavy load.That might be as much as ten out of twenty four hours with two shifts running. The rest of the day will be consumed by loading and unloading and deadheading at half throttle or less.
It looks like the U.S. had another drop in oil production this week:
Table 1. U.S. Petroleum Balance Sheet, Week Ending 2/21/2014
Declines in the GOM, declines in Alaska, declines in legacy wells, massive declines in tight oil wells, is it all starting to become too much for new tight oil wells to offset, or can all of this be attributed to bad weather?
I wouldn’t over read into a single week. If we were on the decline curve, would a single week going up convince you that decline had stopped? There’s a lot of wells in the Bakken waiting for spring fracking.
Nony,
The key word in my post is another. I don’t have time at the moment to get the links but you can search for yourself and see that over the past month or so there have been a few weeks in which production either dropped or remained flat. Additionally, production overall has been flat for the past month.
I am confident that there will be a lot of wells fracked this spring, but there will also be a lot of wells closed. The recent data seems to be at least suggestive of the Herculean effort needed to overcome the depletion rate of existing production and that anything that nips at the heals of the process can cause a faltering of production.
The Bakken is seasonal and has been for every year so far. As it becomes more a part of the total, it’s seasonal impact has more weight. More interesting to me is the drop in Texas. (IOW, supports your hypothesis more). That said, I would still be wary of a couple weeks in winter.
It takes over 3 months to frack a well.
Hi watcher,
A good part of that 3 months is waiting in line, I don’t think the process takes that long.
I found this:
“The purpose of fracturing a well is to open the well bore at the production zones (gas, oil) to allow more of the product to flow. The actual frac, depending on the various factors above can take a couple hours to a couple days. Once the frac is done, they will usually see if the well will flow on it’s own and what type of production thay can get out of it. This will help them decide if they need to install a pump, freeflow or abandon the well. ”
This guy claims 8 years working in the oilfield. If the information is correct and it only takes a couple of days to frack the well, then most of the three months is just waiting for a fracking crew to become available.
Other web sites have said about two fracking stages per 12 hour shift, so if we assume 12 hour shifts, but only M-F workdays a 30 stage frack would require 15 working days or 3 weeks, add in Murphy’s Law and realistically it would be a month to complete a 30 stage frack job. If the shifts were only 8 hours, then the job would take longer, but on the website I looked at it sounded like 12 hour shifts was the SOP.
Ya, I knew it was the waiting in line thing. Not sure what I was addressing with my comment — which is correct, sorta.
However, how do you use up millions of gallons of water in just a day or two? Hmmm.
I understand this is away from the posts ,but I was wondering what happened to the “Petro Carib” project started by Chavez to provide subsidized crude to the Caribbean islands ,Cuba and other Latin American countries ? Is it still on ? If not then what is happening in the countries that were in this program ? Island boy ,are you around ?
It’s interesting that February, 2014 is the three year anniversary of the monthly Brent price recrossing the $100 mark.
Brent was above $100 for six months in 2008, while Brent has been above $100 for 35 of the past 36 months (through February, 2014).
Hi Ron, (and others)
I have read your posts for years and appreciate this latest forecast, Ron. PO is unfolding and it may prove to be a very interesting decade. I have to return to my roots and appreciate that change is opportunity. It is, isn’t it?
What can go wrong? In my area (Vancouver Island) Quinsam Coal just laid off 36 miners last week. I assume the much touted Sable River coal deposits and proposed new mine, with a new road and/or railway to Port Alberni, is now on hold. Reports cited softening demand as the reason.
Paulo
Sounds like that has more to do with environmental restrictions on coal and natural gas competition than peak oil. To the extent that oil and coal compete with each other, running out of oil should lead to more coal, not less. And I sure don’t think they are slowing those mines down because of running out of coal!
“I have to return to my roots and appreciate that change is opportunity. It is, isn’t it? ”
No. Not if the change is from 70 beats per minute to zero.
The mine still has 110 employees. So, it was a 25% cutback.
Yes, thermal coal prices have been soft for a while
Thermal Coal Price
Say Paulo, Is there any good farmland in the Sayward area? (i live down south on the island)
I got drank in Esquimalt back during the service. Bar where you could sing and throw your peanut shells on the floor. Then we actually caused an international incident. CO got a letter of reprimand. 🙁
Off Topic but what the heck is this?
https://www.middleeastmonitor.com/news/middle-east/9875-saudi-threatens-to-isolate-qatar-for-its-support-of-muslim-brotherhood
I thought they were partners in Syria and assumed that meant everywhere else.
It is probably wildly optimistic and my reasons are based on what I see and have seen happen. Maybe the future production is estimated too high and there in lies the fault, but it does seem that the production can continue with steady increases from the formation.
The monthly oil production does have a steady increase in the daily oil produced per well of about 40 percent from the monthly statistics totals, which includes all formations
.https://www.dmr.nd.gov/oilgas/stats/historicaloilprodstats.pdf
The far right column does show an increase in production of oil per well. Higher bpd in some wells seem to have an impact.
Any Three Forks/Sanish formation pooled oil is Bakken oil, any Lodgepole formation pooled oil is Bakken oil, the oil is expelled through fissures in the upper and lower shales from oil formed in the Middle Bakken. At the bottom of the lower Bakken shale is the Three Forks and above the upper Bakken shale is the Lodgepole.
More production in the future is the reality, regardless of the depletion rates.
Will it stop Peak Oil? No. Peak Oil is here, the cliff is either 1 year away or 30 years away, but it’s going to be here soon enough even at 30 years away. Tough to ignore it, easy to deny it, but I’m afraid it’s true.
It’s a grim future any way it is analyzed.
.
Hi Ronald,
When you look at all of North Dakota the daily oil per well has increased from 29 b/d/well in 2003 to about 95 b/d/well today, this is because of the new production from the Bakken. If you look at Bakken statistics:
https://www.dmr.nd.gov/oilgas/stats/historicalbakkenoilstats.pdf
and look at the daily oil per well it has increased from 8 b/d/well in 2004 to 145 b/d/well in 2010 and has since fallen to 126 b/well, that does not bode well for North Dakota Oil production, but it is likely just a winter weather issue.
In a world with a constant addition of number of wells and a constant quality of well*, the production per well would be expected to drop just because new wells become a smaller percentage of the total. Net production would still be rising and the desire to drill another well would not be lessened. It’s just math.
I think when the first year cum total of the average well starts dropping that shows more how we are running out of sweet spots and new wells are less desirable because of downspacing or working the fringes of the area. And TF is in a way an intrinsic non sweet spot, not as good as MB.
*Sort of what we’ve seen for last couple years and what we expect for 2014.
As to your question about what is the Permian, it is many things. Primarely, it is the basin with the largest cumulative production in the country, but most of those legacy fields are now under waterflood and in decline. There are two ways in which production is increasing in the Permain. The first is production comming from may of the source rocks (but not all) for the shallower Permian aged reservoirs (thus the name of the basin) from the Wolfcamp, Spraberry and Bone Springs formations. This production has been slower to develope that the Eagle Ford or the Bakken, but in my opinion the three will have larger ultimate recoveries than both. The other factor is CO2 injection in both the main pay as well as the transition zone & residual oil zone of conventional reservoirs. This has increased production and also lead to decreased declines for many of the fields that are under CO2 flood. Hope that helped.
I just realized that I can’t spell. Oh well, the point is still there.
Yes ManBearPig, that definitely helped. Thanks a million.
Thanks ManBearPig,
A couple of quick question on LTO in the Permian.
1.When I look at drilling rig counts from Baker Hughes it looks like most of the oil rigs in the Permian are vertical rather than horizontal rigs. Is there something about the Permian Basin that makes it difficult to use the horizontal rigs?
2.Are there already so many vertical holes drilled (in the sweet spots especially)it makes it difficult to find a lease where a horizontal well can be drilled?
Quite a lot of the recent rise in Permian output for the last 10 years has been from the Spraberry, the Wolfcamp and Bone Springs is harder to track using the free data from the RRC. If you have access to better information it would be helpful to see the % of Permian output from the Bonesprings and Wolfcamp formations. See Chart below for 5 largest fields in Permian basin(right axis) and Permian output. It looks like about a 150 kb/d increase in Permian output from 2007 to 2012.
Again I appreciate you educating us on the Permian.
A link on the Permian: http://www.rrc.state.tx.us/permianbasin/
Dennis,
I’ll address your first two questions, which are easier to address than the third point that you raise.
1) I would not say it is difficult to drill horizontal wells in the Permian, but the geology is different than both the Bakken an Eagle Ford. In the unconventional Permian, the gross pay interval is 1000-1500 ft thick (possibly thicker, depending on the area and specific basin that you are in), which is pretty much impossible to reach with a single lateral well. The solution, for the time being, is to complete the vertical wells with large fracks similar in size to horizontal completions. However, there are many horizontals being drilled as well, for now it seems to be operator preference. You also have to take into account that there are thousands of conventional fields in the Permain that have infill wells drilled every year to improve EUR for the fields. I would guess that a large number of the rigs are for that purpose.
2) Im not sure a “sweet spot” has been established in the same way that it has been in the Bakken. There is an understanding that a large unconventional resource base exists, but the extent is not yet known. The Permain Basin covers an area roughly 75,000 sq-miles, and operators are poking holes all over it looking for unconventional production. For now, the best unconventional production has been close to the platform (here is a link to what the general layout of the basin is, but I dont know how to embed it: http://upload.wikimedia.org/wikipedia/commons/3/38/Permian_Basin.jpg), but that could change as time goes on.
With respect to that image, I think that it is actually a little missleading. The Spraberry can actually contain both the Spraberry and Wolfcamp in the Midland Basin and the Spraberry and Bone Springs in the Delaware Basin. Operators can, and have, been commingling their production through these intervals, so “Spraberry” production can be much more than just Spraberry (this goes back to the 1000-1500 ft of gross pay). I am not aware of any available data that break up production by individual unconventual play in the Permian at this time, but the Spraberry, Wolfcamp, Bone Springs (and posible the Cline in the future) contrible to the overall unconventional portfolio. Pioneer estimates that the EUR from uconventionals in the Permian is second only to the Ghawar (http://3.bp.blogspot.com/-S0YCikch-Z8/UmlRg6MsetI/AAAAAAAAqWg/Qedvm7r690A/s1600/spraberry3.png), and while I think that is a very optomisic number for an unconventioan play, I do think it will end up being the biggest in the US. Hope this helps.
Here’s a map of the different plays within the basin.
http://info.drillinginfo.com/inside-driliinginfos-map-drawers-1-permian-basin/
I guess it is a little bit like the Williston with Bakken, Three Forks, and possibly Tyler as different layers with different areas. But Permian basin even more complicated.
Nony,
Very nice map. Thx!
*Preens* Thanks, man.
If you do some google image searches for sections of the platform, those are also helpful. I get the impression that Delaware Basin versus Midland Basin is the big division for the Permian. The Delaware is deeper and on the west. Also, the drilling info map makes it look like some of the sediment layers are actually non-continuous (unlike the layers in the Williston, which differ in areal extent but are continuous).
I had no idea what a platform was, but I looked it up on Wiki (which is never wrong, right? ;)). Apparently, that is some sort of hard non-sedimentary rock that is kind of like a pedestal under layered sediment rocks. So it’s a geologic feature, but not oily. I guess this is why the DI map has it sort of separate from the plays in the legend.
ManBearPig,
Thank you that was awesome. Would it be correct to assume that quite a bit of the Spraberry output in the RRC Chart I posted over the period from 2005 to 2012 is a combination of Spraberry, Wolfcamp, and Bonesprings output (and maybe 90% of it would be considered LTO)?
Dennis,
Yes and no. More recently I would say yes. It started with the Spraberry, so the initial increase would be just Spraberry. As time has gone on, the other plays have started to contribute more and more. How much do they add? I have absolutely no idea. The only way to get a relatively accurate estimate would be to look at wells that completed in multiple zones and check their well tests for each zone filed with the TX RRC or the NM OCD. Since Bone Springs is just in the Delaware Basin, it is also possible that its production is kept seperate from the “Spraberry Trend” production from that graph (look at the NM state gross production curve from the EIA, the recent change is mainly the Bone Springs and Wolfcamp). In the Midland Basin the term is Wolfberry (Wolfcamp-Spraberry) and in the Delaware Basin it is Wolfbone (Wolfcamp-Bone Springs). I would say that basically 100% of that production could be considered LTO.
I sure would like to be a fly on the wall and listen in when Elon Musk talks about oil with his closest friends and executives. My guess is that he has somebody on his staff whose job it is to summarize the oil news and the content of blogs such as this one for him and that sometime later this week he will read a line or two thats says Ron Paterson has said thus and so on Monday, Tuesday, and Wednesday.
If it were any body else I would discount talk of a mega factory to big enough to produce 500,000 car sized battery packs per year but he has the track record of doing what he says he will. Some of that record is certainly due his being very lucky in terms of place and time;for instance buying his automobile factory full of basically brand new machinery for a nickel on the dollar if I remember correctly.
But as Yogi said about one or another of his teammates shaking his bat at the far outer grandstands indicating a home run coming up, it ain’t bragging if he can do it.
Musk will probably make a killing selling his cars when gasoline hits eight or ten bucks a few more years down the road unless business as usual just keels over like an old man who has had a massive heart attack.
We better hope that there is no shark fin decline in oil supplies or the fecal matter will hit the fan so thick and fast that the only people laughing will be the ones who are forted up in doomsteads.
I don’t have a doom stead as such but our old farmhouse is masonry with a new steel roof and we have our own water supply and a ton of secure storage and wood heat and I can get buy with very little in the line of purchased food and materials if my savings and income dry up.It’s not too hard to raise enough beans and veggies to eat even without any purchased fertilizel or pesticides if you know how.
God help the millions of people who live in apartments and are totally dependent on jobs that are in turn dependent on other folks having plenty of disposable income.
Making a living cutting hair or selling fashionable clothing isn’t going to work for very many people a decade from now………………..
But there will probably still be more than enough people with money to buy as many Teslas as Musk can build.
I find Tesla to be a schizophrenic company. They seem to be a very high tech company full of smart people who can’t seem to count. When GM or Ford report their monthly car sales, they report Chevrolet 10,843, Mustang 8,467. When Tesla reports monthly car sales, they report about 4500. Go figure.
Petrobras cuts $16bn from investment plan
By Samantha Pearson, FT.com, in São Paulo
Another company cutting investments.
Kopits posted on Gail’s blog, he mentioned Petrobras’s main problem is the fixed prices set by the government for retail gasoline and diesel.
In any case, gotta sell sell sell! 😉
The title says it all.
http://www.washingtonpost.com/blogs/govbeat/wp/2014/02/25/a-very-brief-history-of-the-state-gas-tax-on-its-95th-birthday/
Cold Snap Tests High-Performance Homes
By Ted Cushman. the Journal of Light Construction, Posted on: January 27, 2014
We could have started down this path over three decades ago!
Wonder how it does in overcast conditions?
Way, way better than anything else built. It’s just lots of insulation and making sure hot air doesn’t leak out of the house. Solar heat gain is just a bonus.
Hi Nony,
As I understand it, wood stoves work fine in cloudy weather, maybe you have a different model than mine ;).
The passive solar houses, when built correctly, require very little thermal input, a 30,000 BTU wood stove is pretty small. I am sure that the heat pump would be adequate even in very cold overcast conditions and generally temperatures are not as low when it is cloudy in winter. The clear sky days are the really cold days, and this is when you get the maximum solar gain.
Just want to help avoid confusion. I’m not an expert, but have studied up a bit on the Passivhaus – there are some good videos out there, among other sources. A Passivhaus is not a passive solar house. Two different animals. The P-haus, as aws said, is designed primarily to minimize heat loss via superinsulation and extremely detailed attention to the building’s air barrier. Generally, appliances and body heat are all they need for heat. Solar gain is a bonus, and the heating plant is often only needed in extreme circumstances. So the answer to Nony’s question is that a Passivhaus does just fine in cloudy conditions – it doesn’t much care.
I thought that heat pumps only work down to -5 degC.
One other important element is ventilation. Since a PassivHaus has very little air loss, exhaust air should be gathered from the kitchen and bathrooms and exchanged for fresh air which is usually supplied to living areas. And because the ventilation is now controlled you can easily recover the heat from the exhausted air. Or vice-versa in a hot humid climate.
Anyway this came into my inbox yesterday. It’s a bit building science geeky but I think the crowd here can handle it. Worth watching the videos.
Looks like the ERV has a 90% recovery efficiency which is impressive.
Dr Jennifer Francis and the Year-Long Blocking Pattern
by robertscribbler on February 26, 2014
For a blocking pattern to have persisted for such a long time is somewhat unprecedented. According to the standard definition of blocks (what I’m referring to as blocking patterns) the systems generally tend to last for days or weeks. The most powerful of blocks, like the Bermuda High, tend to last, at most, for a season. But this West Coast and Pacific block has now remained in place for nearly a year. A more solid validation of Dr. Jennifer Francis’ hypothesis — that sea ice melt can result in large Jet Stream meanders and ‘stuck’ weather patterns — is difficult to find.
Whoever posted the New Yorker ITER link: great link. Total EU-like clusterf*#&. And then when he said it would have economics of wind? Sorry, we would do breeder reactors way way way before that.
http://www.newyorker.com/reporting/2014/03/03/140303fa_fact_khatchadourian?currentPage=all
Dream of U.S. Oil Independence Slams Against Shale Costs
….”Just a few of the roadblocks: Independent producers will spend $1.50 drilling this year for every dollar they get back. Shale output drops faster than production from conventional methods. It will take 2,500 new wells a year just to sustain output of 1 million barrels a day in North Dakota’s Bakken shale, according to the Paris-based International Energy Agency. Iraq could do the same with 60.”
Consider Sanchez Energy Corp. (SN) The Houston-based company plans to spend as much as $600 million this year, almost double its estimated 2013 revenue, on the Eagle Ford shale formation in south Texas, which along with North Dakota is one of the hotbeds of a drilling frenzy that’s pushed U.S. crude output to the highest in almost 26 years. Its Sante North 1H oil well pumped five times more water than crude, Sanchez Energy said in a Feb. 17 regulatory filing. Shares sank 7 percent.
“We are beginning to live in a different world where getting more oil takes more energy, more effort and will be more expensive,” said Tad Patzek, chairman of the Department of Petroleum and Geosystems Engineering at the University of Texas at Austin.
Drillers are pushing to maintain the pace of the unprecedented 39 percent gain in U.S. oil production since the end of 2011. Yet achieving U.S. energy self-sufficiency depends on easy credit and oil prices high enough to cover well costs. Even with crude above $100 a barrel, shale producers are spending money faster than they make it. …. rest of the article:
http://www.bloomberg.com/news/2014-02-27/dream-of-u-s-oil-independence-slams-against-shale-costs.html
Regards,
Nawar
Anybody who thinks fusion power is going to come to our rescue should read this article and then contemplate a bit of basic math.
There are literally thousands of problems that must be solved before a fusion reactor can be built and even then it would be only prototype and would need another couple of decades to become a practical reality.
Now consider this. The odds of solving a string of problems that must be solved in order to reach a goal is the product of the odds of solving each individual problem all multipled together.
So if the odds of solving ‘problem A” are ninety nine percent and ”problem B are ninety nine percent and ”problem C” are ninety nine percent then the chances of reaching the goal in this case is 0.99×0.99×0.99.
Thats still pretty good but when there are thousands of problems some of them will not be solved at all until many different approaches have been tried and when a solution that works has finally been found then it may have to be discarded because it cannot be implemented due to being incompatible with the rest of the reactor machinery. So it will be back to the drawing board for new solutions for possibly dozens of problems and after the reactor is finally built lots of bugs will be found that will take more years to correct.
There is a book or a play or maybe a movie called ”A Bridge Too Far ” . These four words say it all about practical fusion power.We will be bankrupt a long time before ALL the problems are solved.
Sorry I forgot the link to the article I refer to in my 9:21 comment.
http://www.newyorker.com/online/blogs/elements/2014/02/video-how-to-put-a-star-into-a-bottle.html
The funny thing is how it is such a Frenchie, EU, UN, Japanese type gaggle. I think what really pisses them off is that if the USA got all thuggish Big Science manly and said “we did Manhattan Project, we did man on the Moon, STFB”, then they know that we would get it done. Boom! Just call up General Atomics and Bechtel, print another 30 billion and get the fooker done. Probably cost us less money than screwing up Iraq for 10 years.
That’s what really pisses them off. That they’re going to fail and they know we could do it, with one hand behind our back. We’re the adapt and overcome Marines. Look at the Bakken, red meat gettirdone Americanism.
Joking. Or am I? 😉
I hope you’re joking because no we can’t giter done this time. The job is just too big.I know this is heresy according to the gospel of Yankee invincibility but it is never the less true.
If business as usual were to last another fifty years then a fusion reactor just might be possible.
But we are already broke and there isn’t a snowball’s chance on a red hot stove that we or anybody else will continue to fund such an expensive long shot project that won’t pay off in the lifetime of the people who have to appropriate the money for it.
The money for fusion should be diverted immediately into research with a potential for paying off within the easily foreseeable future.
Otherwise once overshoot really starts to bite and the entitlement checks don’t arrive on time, the public is apt to get tired of funding research altogether and then there won’t be any researchers at all excepting those funded by businesses.
When they said the final price would be like wind, my brain turned off. Breeders make so much, much more sense.
I do think we could get it done. Heck, look at the Manhattan Project.
That fusion project story’s problems are much more around the organizational aspects than the engineering. Too much foofoo internationalism going on. Need centralized design without having 10 different countries with veto power.
My understanding from comments made elsewhere is that Steven Kopits has lost his job? If so that is a very great shame as his analysis of the oil industry is fascinating.
The US crude oil production growth fell again last week. Defined as the 52-week average weekly production over the last 52 weeks less that in the previous 52 weeks, the 52-week growth in the US crude oil production declined from 1241 thousand barrels per day in the last week of 2013 to 1211 thousand barrels per day in the third week of February. After peaking during the last three weeks of 2013, the 52-week growth has declined for eight consecutive weeks, with an average decline rate of 3.75 thousadn barrel per day per week. At this rate, it would take approximately 320 weeks or more than six years for the US oil production to peak.
For the week of February 21 itself, the weekly production was only 963 thousand barrels per day higher than 52 weeks ago.
1. Took me a while to head scrunch through the difference of two trailing last year, weekly numbers. As said, it’s a measure of derivative of production. You could say we had past the inflection point (if that trend stays true).
2. It was a pretty bad winter cold snap. YEah, you are doing trailing year which dilutes it and eliminates seasonality…but it was a harsher winter than last year and we know lots of wells in the Bakken are unfracked. And just a caution in reading into a couple data points. So…maybe it really is the inflection point. But…not sure.
3. Only a million higher than last year. Only 14% growth. 😉
That’s correct. It’s derivative of production.
It could be bad winter. We’ll find out. Note that the current trend points to a peak in level about 320 weeks from now. The implied peak year is 2020, more conservative than the current EIA projection. So the chance is that this is indeed an inflection point (a turning point for the derivative itself) and decelerating slope will become steeper.
Also look at about SEP2010 to SEP2011. We’ve already had one turning of the derivative (and this was well after the 2008 price shock), but then it turned up again. So, gotta be wary of this thing not being a simple bell curve with an inflection point, but more variable.
Oh…I forgot to say: attaboy. Seriously. Thank you for the good analysis.
Pretty sure the weekly numbers are from models, not measurements.
This one compares the monthly oil production growth with rigs in operation. Rigs in operation are shown on left scale (updated to January 2014). Annual change in oil production is defined as the total oil production over the last 12 months less that in the previous 12 months (right scale, updated to November 2013).
Annual change defined in this way peaked in September 2013, at 365 million barrels. It was down for both October and November. By November, it was down to 349 million barrels. It will take a few more months to decide if this has become a trend.
The preivous downturn happened in February 2013, just for one month.
Both of those downturn points might be the Bakken seasonal decline. It’s big enough that it is 1/8 of total production.
Is rotary rigs in operation, all rigs (oil and gas) or just those drilling for oil. We’ve seen movement between the activities based on the price of gas.
Looking at the about 2012-2014 time period, the rate of growth seems rather constant (linear growth) even though rigs drilling still went up. Could be Bakken and EF getting more efficient (number of wells/rig increasing from more pad drilling). And then the other rigs doing less successful holes (e.g. exploration in Utica, TMS). For the Bakken only, our charts have shown no downturn yet in average productivity of a well.
In response to some justified criticism that I need to simplify my net export presentations, I have been working on trying to do just that. Following is a short summary of the approach that I am working on.
ELM & ECI Ratio
First, based on a simple mathematical model for a hypothetical exporting country that I called “Export Land,” I observed that given an ongoing production decline in a net oil exporting country, unless they cut their domestic oil consumption at the same rate as, or at a rate faster than, the production decline rate, the resulting net export decline rate will exceed the production decline rate, and the net export decline rate will accelerate with time. Furthermore, if the rate of increase in consumption exceeds the rate of increase in production, a major net oil exporting country can become a major net oil importing country, prior to a production peak, e.g., the US & China. I call this the Export Land Model, or ELM
I have labeled the ratio of production to consumption in a net oil exporting country the Export Capacity Index (ECI). If the ECI Ratio is declining then, by definition, a net oil exporting country is headed toward zero net oil exports (when they hit an ECI ratio of 1.0). Based on the following Six Country Case History, a declining ECI ratio predicted net export problems ahead, even as the Six Countries showed a slight increase in production from 1995 to 1999.
Six Country Case History
The Six Country Case History consists of the six major net oil exporters that hit or approached zero net oil exports from 1980 to 2010 (excluding China). As noted above, China & the US are special case histories, and if I had included China, the Six Country Case History (or more accurately the Seven Country Case History) would have looked even worse. The Six Countries are: Indonesia, UK, Egypt, Vietnam, Argentina, Malaysia.
The Six Countries showed a definite inflection point in production in 1995, when production virtually stopped increasing. In 1999, their combined production was only 2% higher than their 1995 production. Because of rising consumption, their net exports fell by 6% from 1995 to 1999, and their ECI ratio fell by 5% from 1995 to 1999 (down from 1.71 in 1995 to 1.62 in 1999). The killer number was the decline in remaining post-1995 Cumulative Net Exports (CNE).
Remaining Six Country post-1995 CNE fell by 54% from 1995 to 1999, as production increased by 2%. It took the Six Countries 12 years to go from peak net exports (1995) to zero net exports (2007). A rough, but consistent rule of thumb is that about half of post-peak CNE are shipped one-third of the way into the net export decline period. The four year Six Country decline in remaining post-1995 CNE (54%) is consistent with this rule of thumb.
Following is a link to a graph showing the normalized production, net exports, ECI ratio and remaining post-1995 CNE by year for the Six Countries, with 1995 values set equal to 100%. My point is that the 1995 inflection point in production and net exports is analogous to the 2005 inflection point in production and net exports for the (2005) Top 33 net exporters.
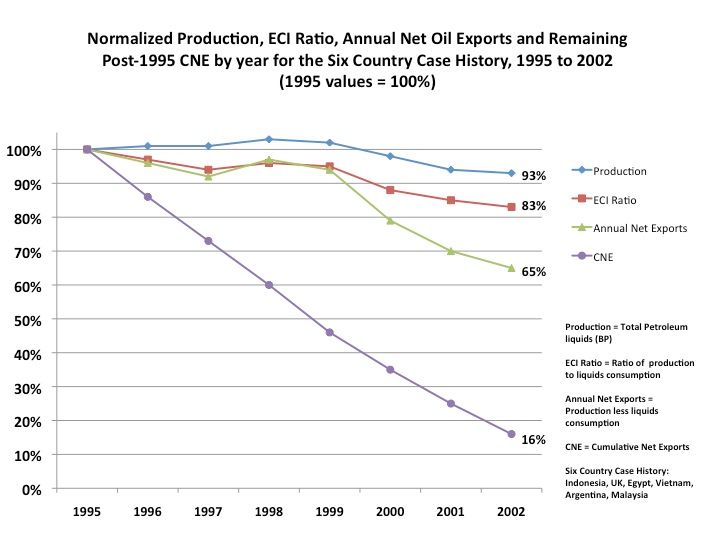
Note that by the end of 2002, as production had only fallen by 7% from 1995, they had already shipped 84% of post-1995 CNE. As noted above, the early decline in the ECI ratio was a warning of what was going on regarding post-1995 CNE depletion, even as they showed a slight increase in production from 1995 to 1999.
Note that based on the seven year 1995 to 2002 rate of decline in the Six Country ECI ratio, estimated post-1995 CNE were 9 Gb (billion barrels). Actual post-1995 CNE were 7.3 GB, so the estimate for post-1995 CNE, based on the seven year decline in the ECI ratio, was too optimistic (by 23%).
(2005) Top 33 Net Oil Exporters
I have labeled the combined output from the (2005) Top 33 Net Oil Exporters as Global Net Exports of oil (GNE). Note that Vietnam, Argentina and Malaysia are included in the Top 33 data base, although they don’t have a material impact on the data set.
The Top 33 data set is based on EIA data. As of 2012, production (relative to 2005) was up slightly, by 2%, net exports were down slightly, by 4%, the ECI ratio was down by 13% (from 3.75 in 2005 to 3.26 in 2012).
Just as we saw with the Six Country Case History, the killer number is the decline in remaining post-2005 CNE, which is estimated to be down by 21% in only seven years. As noted above, this estimation technique, extrapolating a seven year ECI Ratio decline, was too optimistic for the Six Country Case History.
Incidentally, by definition, the remaining supply of post-2005 Top 33 CNE is declining, the only question is what the depletion rate is. But whatever the depletion rate is, again by definition, the depletion rate is accelerating, i.e., it is not in dispute that we are burning through a falling volume of remaining post-2005 Top 33 CNE, the question is how fast are we burning through the remaining supply?
Any comments?
Let’s assume that you have $100,000 in the bank, and you withdraw $10,000 per year. You would take out 10% (10/100) of the balance the first year, 11.1% the second year (10/90), 12.5% the third year (10/80), and so on. So, the year over year simple percentage depletion in the remaining bank balance accelerates.
In regard to net export declines, the biggest post-net export peak declines in post-peak CNE (Cumulative Net Exports) tend to be early in the decline phase.
As noted below, in 1999 combined Six Country production was 2% higher than 1995, but in 1999 the Six Countries shipped 23% of remaining post-1995 CNE.
In 2012, combined production from the (2005) Top 33 Net Exporters was 2% higher than 2005, but in 2012 I estimate that they shipped 3.7% of remaining post-2005 CNE.
Observed Year Over Year Simple Percentage Depletion in the Remaining Volume of Post-1995 Six Country CNE (Cumulative Net Exports):
1996 14.0%
1997 15.1
1998 17.8
1999 23.3
2000 23.9
2001 28.6
2002 36.0
Year Over Year Estimated Simple Percentage Depletion in the Remaining Volume of Post-2005 Top 33 CNE:
2006 3.0%
2007 3.1
2008 3.2
2009 3.4
2010 3.5
2011 3.6
2012 3.7
Jeff,
Well I don’t know about this depletion stuff. Had coffee with my neighbor Roy yesterday, an old God fearing fellow, and he assured me that running out of oil is just a big lie, that the earth creates oil all by itself, that when a well runs out you just have to give it a few years to rest. Now old Roy has a lot of clout in our community and I haven’t heard anyone call him out on stuff very often so maybe you should rethink some of them ideas you’re bin spouting. Roy’s also pretty good at witchin for water — they say. So there’s your proof isn’t it?
Doug,
I have the same sort of chat with many individuals in my neck of the woods. That seems to be the KNEE-JERK reaction — “there’s plenty of oil in the ground, we got a lot of cap wells.”
Maybe Roy needs to look at some of the Shale Gas Financial Reports as well as some of the Majors. But of course, they are manipulating the data.
It’s impossible to get people to think differently… that is until the day the EARTH IS PROVEN TO BE ROUND.
steve
Another Peak Oiler made some kind of comment a few weeks ago to the effect that he had moved from activism to something more akin to being an observer/commentator, which I guess is mostly my position too.
On some days, I think I would have more success trying to get my Yorkie to understand “Net Export Math,” than getting someone in a policy making position to accept the concept.
By the way, when asked about when Saudi Arabia might approach zero net exports, I point out that it’s pretty much irrelevant, because in my opinion the largest percentage depletion in post-2005 CNE (Saudi Arabia specifically and globally in general) is happening right now.
Here are the Six Country post-1995 CNE (Cumulative Net Export) depletion percentages in four intervals of three years each (1995 to 1998, 1998 to 2001, 2001 to 2004, 2004 to 2007):
First Quarter (of 12 year net export decline period):
40% of post-1995 CNE shipped
Second Quarter:
35% of post-1995 CNE shipped
(But 58% of remaining post-1995 CNE)
Third Quarter:
21.5% of post-1995 CNE shipped
(But 86% of remaining post-1995 CNE)
Fourth Quarter:
3.5% of post-1995 CNE shipped
(100% of remaining post-1995 CNE)
Note that even as the volume of net exports shipped every quarterly time period dropped, the quarter over quarter depletion rate, in terms of remaining CNE, accelerated.
Let’s assume that instead of hitting zero net exports in 2007, that the Six Countries were able to maintain the fourth quarter (2005 to 2007 inclusive) net export rate for 12 more years, so that instead of hitting zero net exports in 12 years, they hit zero net exports in 24 years. Based on this premise, they would only boost their post-1995 CNE by 14%.
Note that the only way we will not see a similar pattern globally (in terms of depletion per quarter) is if–when faced with inevitable production declines–that the net oil exporting countries cut their domestic consumption at the same rate as, or at a rate faster than, the production decline rate. Of course, dramatic declines in exporting country consumption (given an overall production decline) would only slow the rate of decline in net exports, but in any case so far, it does not look promising.
Here are the observed 2005 to 2012 rates of change in the (2005) Top 33 Net Exporter’s ECI* ratios, by country:
http://i1095.photobucket.com/albums/i475/westexas/Slide1_zps5a656e89.jpg
*Total petroleum liquids + other liquids production divided by liquids consumption, EIA
To return to the $100,000 analogy, let’s assume that you had $100,000 in the bank on January 1st.
In the first quarter of the year, you spend $40,000, 40% of balance at the beginning of first quarter.
In the second quarter, you spend $35,000, 58% of balance at the beginning of second quarter.
In the third quarter, you spend $21,500, 86% of balance at the beginning of third quarter.
In the fourth quarter, you spend $3,500, 100% of balance at the beginning of fourth quarter.
Based on a mathematical model and recent histories, this is what a net export decline period looks like.
Sorry, what was your point? What’s the key insight? I honestly can’t follow (to agree or disagree).
Nony,
I think Jeff is trying to explain some basic PO arithmetic. In a country where 25% of the population don’t realize the earth goes around the sun you do expect this to be a challenge, perhaps an impossible undertaking in your case.
Re: Nony
Perhaps it might help if you start with my first post, which starts as follows:
“In response to some justified criticism that I need to simplify my net export presentations, I have been working on trying to do just that. Following is a short summary of the approach that I am working on.”
Following is al link to the paper that I am working on updating:
http://www.resilience.org/stories/2013-02-18/commentary-the-export-capacity-index
In any case, I suspect that you are not alone. Almost no one has any understanding of “Net Export Math,” or in the alternative, they choose not to understand it.
Okay, I understand your arguments and math, and I think ELM (Export Land Model) is a valuable insight and GNE (Global Net Exports) is important to track.
What I fail to understand is why GNE/CNI (China+India Net Imports) is a good way to present the data.
It seems clear that GNE will decrease and CNI will increase. But, GNE/CNI will not approach 1. Instead, the GNE will be divided somehow between the West and China+India — if we are lucky, divided by price and ability to pay, or if unlucky, by war. But, it will not happen that China+India gets it all and the West gets nothing, so the ratio will never approach 1.
IMO, it would be more effective and valuable to simply show an extrapolation of GNE in million barrels/day together with projections of Western demand and China+India demand, with a gap between GNE and total demand, just as you show a gap between earlier rates of increase and actual. The gap would make it very clear that we are facing a clear and increasing problem, and how big the gap will be.
I agree that the GNE/CNI ratio will not hit 1.0, but the fact remains that Available Net Exports (ANE), or GNE less CNI, fell from 41 mbpd in 2005 to 35 mbpd in 2012.
It will be interesting to see what happens over the next 10 years, but following is a graph of normalized liquids consumption versus annual Brent crude oil prices from 2002 to 2012.
And here is an ANE “Gap” Chart:
Here’s more news about big oil and big troubles.
http://www.businessweek.com/articles/2014-01-31/big-oil-earnings-reports-reveal-big-production-problems
Pardon me for adding my 2 cents.
You cannot continue to burn through 88 million barrels of oil each day and conduct BAU with no consequences. Depletion begins immediately and without any delay.
The only way you can replenish the supply is to obtain more. Plenty of oil, just too much demand. No such thing as peak investment, if you want oil, you spend the money to find it, obtain it, and make sure it goes to a thirsty market. Money is no object, at all. If a new well blows off the top, shoots a 20 foot wide column of oil 200 feet high and gushes for 558 days straight in a row, I will become a believer in a new oil boom, until then, it is a downhill slope on the graph. The US exported 40 percent of its oil in the early years of oil development.
In the early days of oil, an oil company official stated the he would drink every gallon of oil west of the Mississippi, such was the pessimism of oil abundance after Titusville went dry. Peak Oilers existed from the beginning. Indeed, John D. Rockefeller seriously considered abandoning the oil business and returning to the produce business, where he began business in the world of business. It was a grim outlook back then because supplies dwindled quickly and the grim outlook was the prevailing zeitgiest until more oil was discovered near Beaumont. Lucas No. 1 changed everything, Lakeview No. 1 made life even better, the mother of all oil spills. More oil west of the Mississippi was a blessing in disguise, to become an unwanted curse in today’s world.
Rockefeller gambled, bought 40 million barrels of malodorous oil @ 15 cents per barrel, skunk oil, bad for kerosene, then hired Herman Frasch, who cracked the oil and removed the skunky odor, and the rest was history. Light bulbs replaced kerosene lamps and gasoline replaced kerosene. Nice to have some sulphur in large quantities. Nice to have a car and not a horse to get you there and nice to have a tractor to pull tons of equipment and do some heavy hauling. Train engines that burned fuel oil instead of coal and used ICE powerplants to power the electric drive allowed the railroads to print modern, streamlined engines photos on their calendars. Oil makes the world just a better world. Then along comes the jet engine and oil is even more desirable. Even greater demand on ever increasing supplies until the increasing supplies fall short again. Peak Oil for real this time around.
Hard to stop oil when the demand outstrips the supply every single day.
Gotta get more because you want more, not because you need more.
Plenty of coal and coal gasification works too.
The coal reserves are estimated to last 1500 years, so energy can be supplied into the future for quite some time. King Coal will remain King Coal. Natural Gas is probably inexhaustible. China used natural gas in 2000 BCE and had a distribution system using bamboo. Supply issues are the only roadblock.
Hydro, solar, ocean currents to provide the energy to transform it into electricity, all . Golden eagles in California are on a steady decline because of wind towers, ergo, wind is environmentally hazardous to protected species. Forget wind, it won’t work. Solar will be a bright spot in the future of energy production.
We are now forced to use nuclear and are forced to train people to be nuclear physicists to chair a committee to regulate nuclear power until the end of mankind.
Oil can last, but strict controls on its use is a priority and the consumer will balk.
A slow down in oil consumption will take place when supplies are dwindling and the demand is thwarted by drastic price increases.
I don’t know if it is an insolvable problem; however, peak oil is real and a real problem.
It’s Peak Oil Day today and every day, just like it was Ground Hog Day every day for Phil Connors in Ground Hog Day.
Ronald,
“You cannot continue to burn through 88 million barrels of oil each day and conduct BAU with no consequences.” Maybe when you throw all that coal and gas into the mix one of the consequences might be turning our planet into a desert — quickly!
Ransquawk tidbit:
e-data-show-oil-loading-rate-at-12-bakken-terminals-fell-to-345-000-bpd-over-past-two-days-vs-550-000-bpd-in-previous-two-weeks-28-02-2014
truncated genscape as the first word. No idea what that is.
Boom.
http://www.reuters.com/article/2014/02/28/oil-bakken-rail-idUSL1N0LX1N720140228
“The Genscape data, made available to Reuters, showed that only 220,000 barrels were loaded at the terminals on Wednesday, the day after the DOT order, an exceptionally low rate.
On Thursday, seven of the 12 terminals monitored by Genscape loaded a total of 470,000 barrels; five terminals did not load at all, although two of those had been operating on Wednesday, according to the data.”
This smells a bit like manufactured excuse.
[…] {1} http://peakoilbarrel.com/will-peak-oil-actually-arrive/ […]
[…] When Will Peak Oil Actually Arrive? Costs Way Too High and Rising February 25, 2014 […]