By Ovi at peakoilbarrel
All of the oil (C + C) production data for the US state charts comes from the EIAʼs Petroleum Supply monthly PSM. The charts below are updated to February 2020 for the 10 largest US oil producing states.
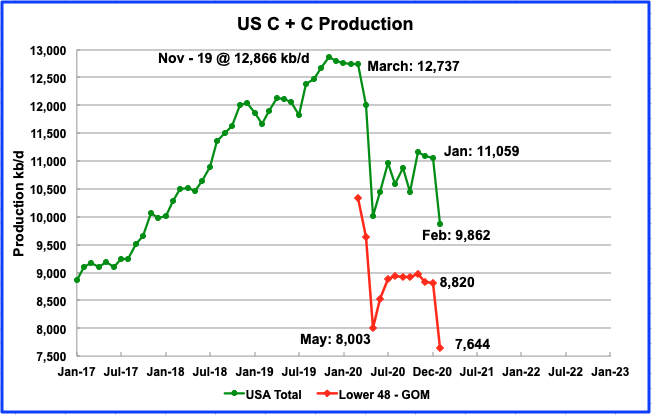
U.S. February production decreased by 1,197 kb/d to 9,862 kb/d from Januaryʼs output of 11,059 kb/d. The decrease was due to the severe winter storm that hit the four US southern states, Texas, New Mexico, Louisiana and Oklahoma. Note that January’s output of 11,080 kb/d in the January report was revised down by 21 kb/d to 11,059 kb/d in the current report.
The April STEO report forecasted US February production would be 10,280 kb/d vs the reported actual output for February of 9,862, an over estimate of 418 kb/d.
In the onshore lower 48, production decreased by 1,176 kb/d, red graph. The reported 1,197 kb/d decrease in the US total output contains an additional 20 kb/d drop from the GOM.
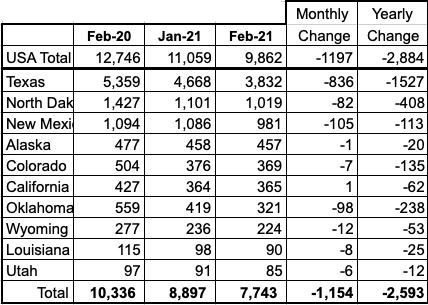
Listed above are the 10 states with the largest US production. These 10 accounted for (78.5%) of US production out of a total production of 9,862 kb/d in February 2021.
Of these 10 states, Oklahoma and Texas had the biggest percentage drops, close to 23% and 18% respectively, relative to January. On a YoY basis, all states had a lower output than last year. On a MoM comparison, only California reported a marginal increase.
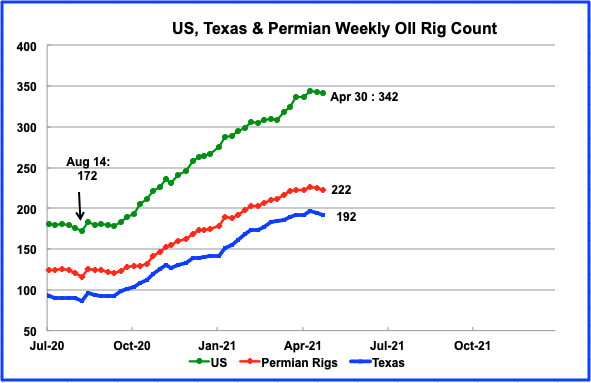
Rig additions continued in the US from the August low of 172 to the week of April 16. For the weeks of April 23 and 30, the rig count decreased by a total of 2.
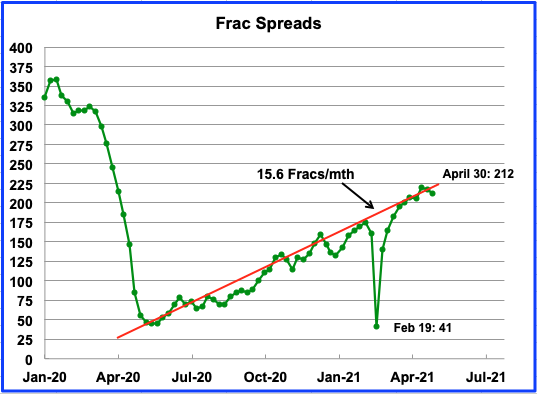
Frac spreads are showing hints of declining in the last two weeks of April, similar to rigs. The average rate for frac spread additions is close to 15.6/mth.
Production by State
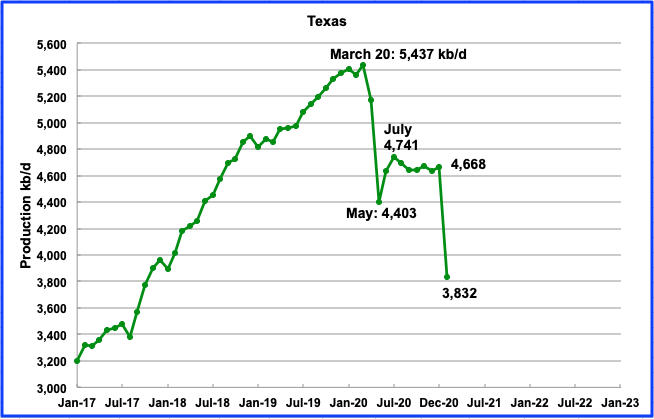
Texas production decreased by 836 kb/d in February to 3,832 kb/d due to the February winter storm.
Texas dropped 5 rigs in the last two weeks of April. Was this a management decision or is it related to Covid? Since Texas removed its mask mandate, the decline in CV cases has stopped. To what level will Texas rebound in March and beyond?
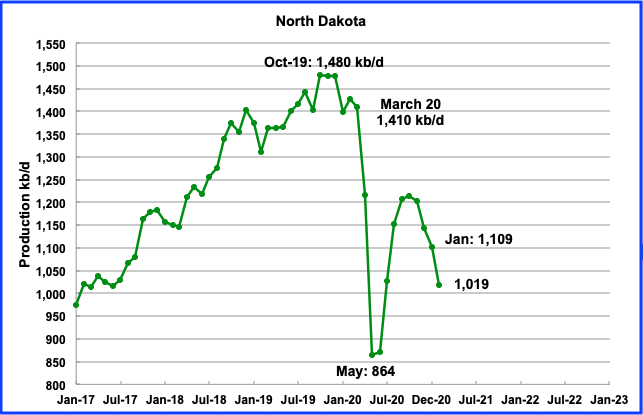
February’s output was 1,019 kb/d day, a decrease of 90 kb/d from January due to cold weather. During February, North Dakota had 13 rigs operating and by the middle of April it had increased to 15.
North Dakota’s oil production dropped in February beyond what state officials had anticipated due to cold weather that forced rolling blackouts in the Bakken. In a recent statement, “State Mineral Resources Director Lynn Helms said that caused gas plants and related infrastructure to go offline for hours at a time. Some oil wells also stopped operating.”
During February, the number of wells operating in the Bakken dropped by 36.
While there continues to be talk of holding back LTO production in the US, Continental will be increasing its production according to this source. “In a conference with investors, Hamm said nearly 70% of the company’s well completions in the second half of 2021 will be in the Bakken. At the start of the year, the completions there represented about 50%.”
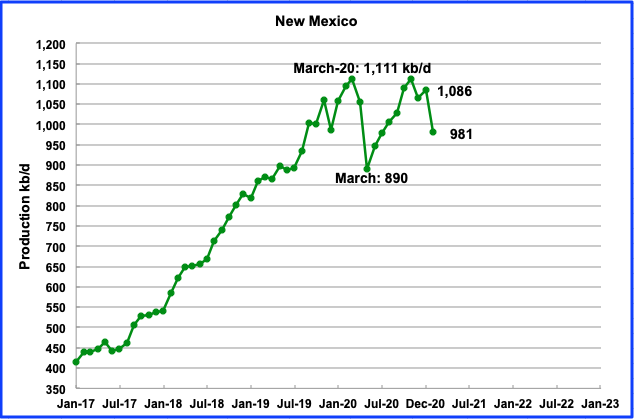
February’s New Mexico production decreased by 105 kb/d to 981 kb/d due to freezing weather.
New Mexico will be enacting tougher emissions rules on oil and gas wells which calls for 98 percent natural gas capture.
“New Mexico, home to the most prized portion of the Permian basin shale formation, became the latest state to impose stricter rules to combat the flaring and venting of natural gas.”
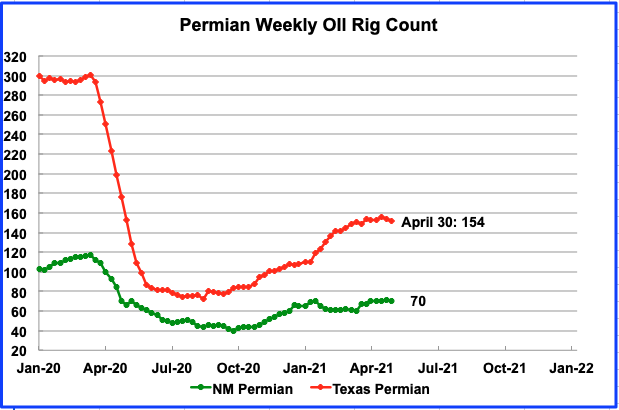
From March to September, the number of rigs operating in the NM Permian dropped from over 100 to a low of 42 in September. In February 61 rigs were operational and by late April had increased to 70. There are hints of slowing in rig additions in both the Texas and New Mexico parts of the Permian.

Alaskaʼs February output decreased by 1 kb/d to 457 kb/d. The EIA’s weekly production report shows that output in April was close to 450 kb/d. Drilling continues in Alaska to try to keep oil output close to 500 kb/d according to this source.
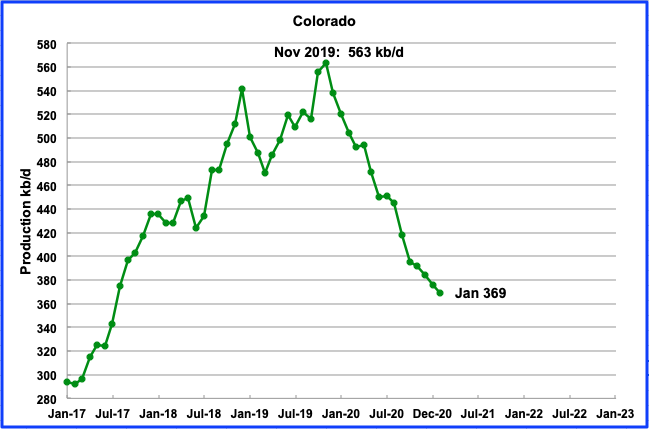
Coloradoʼs February output decreased by 7 kb/d to 369 kb/d. Colorado had 7 rigs operating from mid-January to mid-March but increased to 9 by the end of April.
Declining production continues to be associated with the pandemic and new environmental regulations regarding natural flaring from oil/gas wells, according to this source.
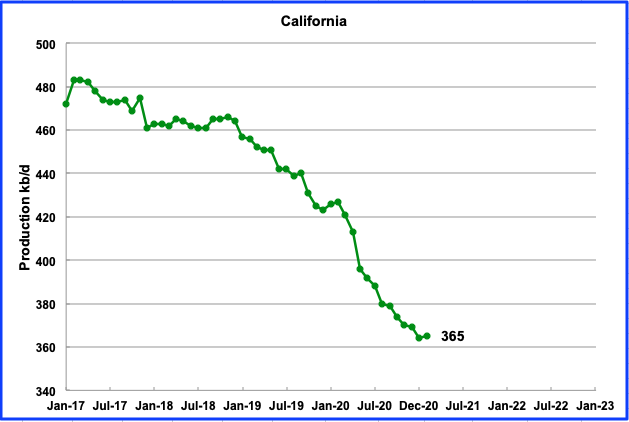
Californiaʼs slow output decline stopped in February. Its production increased by a minimal 1 kb/d to 365 kb/d.
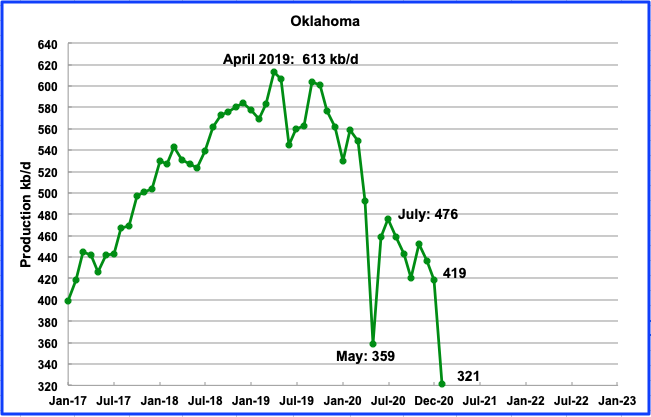
February’s Oklahoma output decreased by 98 kb/d to 321 kb/d due to the winter storm. As a percentage, the drop was 23.4%. During February, 17 rigs were operating. The number fluctuated around 17, +/- 1 up to late March but by the end of April, 21 rigs were operational.
For 2021, Oklahoma’s production is expected to drop by 25% according to this source.
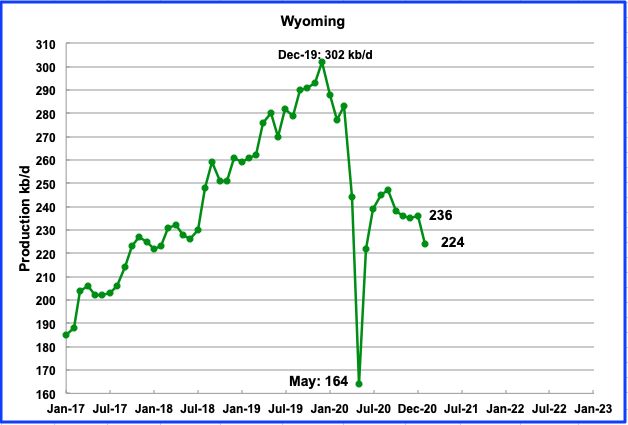
Wyomingʼs production in February decreased by 12 kb/d to 224 kb/d. Wyoming had 3 oil rigs operating in January and they were increased to 4 in February through to the end of March and then back down to three in April.
“Wyoming is one of thirteen states suing the Biden administration to end a suspension of new oil and gas leases on federal land and water and to reschedule canceled sales of leases in the Gulf of Mexico, Alaska waters and western states.“
However before the ban was announced, Wyoming oil and gas boosters succeeded in early January in pushing through Bureau of Land Management approvals for a massive campaign in the Powder River Basin that could see the drilling and fracking of 5,000 new wells, according to this source.
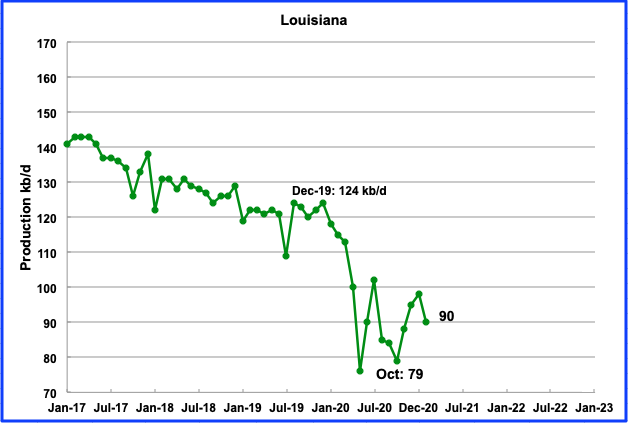
Louisianaʼs output decreased by 8 kb/d in February to 90 kb/d.
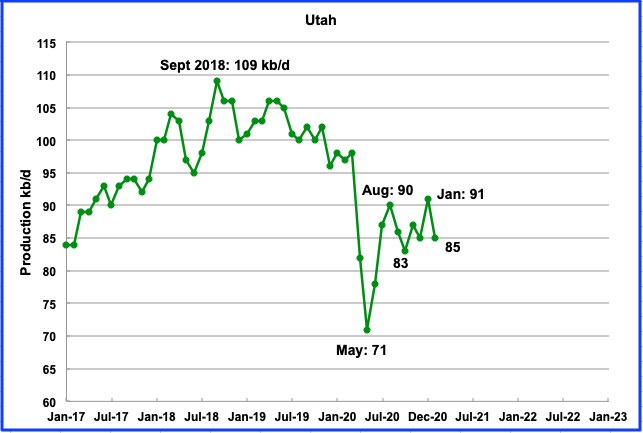
February’s production decreased by 6 kb/d to 85 kb/d. Three oil rigs were operational from January to mid-March. However by the end of April, eight were operational.
Utah joined 12 other states in a lawsuit against the federal government challenging the Jan. 27 executive order issued by President Joe Biden to ban any new oil and gas leasing on federal land and offshore waters.
A company in Utah, TomCo Energy, is working on the development of an oil sands plant. “Subject to the pilot results and the FEED, Greenfield will develop a new 10,000 bopd plant – comprising two 5,000 bopd trains – utilising design improvements and knowledge gained from the POSP pilot.”
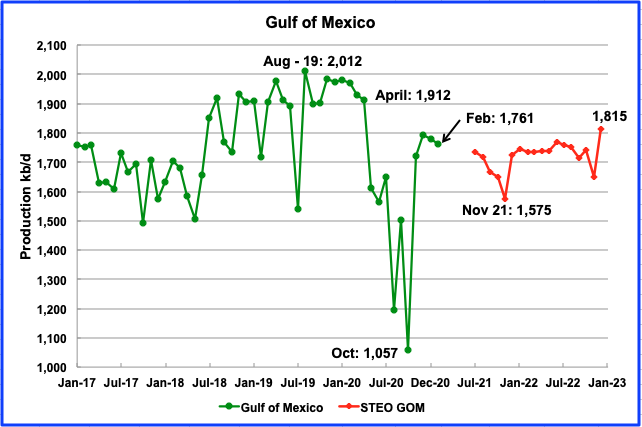
Production from the GOM dropped in February to 1,761 kb/d, a decrease of 20 kb/d. If the GOM were a state, its production would rank second behind Texas. The STEO projection for the GOM output has been added to this chart and projects output of 1,815 kb/d in December 2022.
World Oil Production
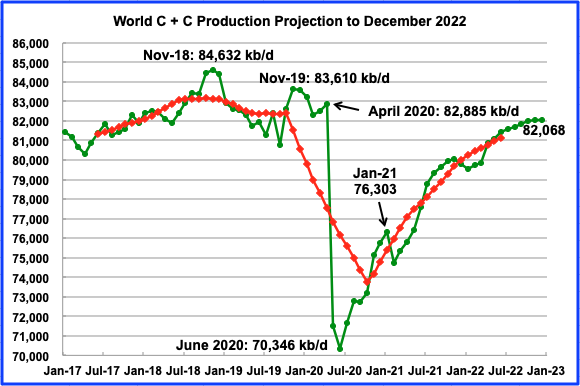
World oil production in January increased by 571 kb/d to 76,303 kb/d according to the EIA. The January report revised December down from 75,936 kb/d to 75,733 kb/d. The biggest contributor to the increase was China, up 164 kb/d.
This chart also projects world production out to December 2022. It uses the April STEO report along with the International Energy Statistics to make the projection. It projects that world crude production in December 2022 will be close to 82,000 kb/d. This is 2,600 kb/d lower than the November 2018 peak of 84,632 kb/d.
129 responses to “US February Oil Production Plunges Due to Winter Storm”
There is something I don’t understand. How EIA can project that the world oil production will be almost at the level of April 2020 in December 2022? If I am not wrong. KSA has apparently so much difficulties to maintain its production that they decreased their production of 1Mb/d in February to announce after a plan to decrease the domestic oil consumption of 1Mb/d to increase the amount of oil for export. And currently, they are at 8 Mb/d : in March 2020, their production was at 10 Mb/d. Russia is in oil production decline and the goal of increasing the production to the level of March 2020 (11 Mb/d) is and will be a goal for a long time as most the oil produced to compensate the loss of production (1Mb/d) will come from EOR (costly) and fracking (even more costly). For the US, I don’t know how the DUC which are currently changed into completed wells and fracked will produce but as the growth of the number of operated rigs is slowing in Permian fields, I don’t know how the decline of the current operated rigs will be compensated in the near future (in 6 or 12 months). I am not speaking of Baker, Eagle Ford and Niobara which are in decline. As the lower 48 states conventional oil production is in decline, as the Alaska oil production is in decline and as the GOM oil production is fairly stable, I don’t know what will be the increase of US oil production in future. But I have a hunch that it won’t be as glorious as the EIA can imagine (predict). Between now and December 2022, there are 6 Mb/d to compensate. If it is not coming the three main oil producers of the world, from where this will come? Iraq : no. They are sparing their oil ressources. Brazil? With pre-salt formations, they will be able to add only a maximum of 500 kb /d. Canada? They are at 5 Mb/d. I am not sure of their possibilities of production growth and even at their production growth rate, they will only add 290 kb/d or so in December 2022. Guyana will produce at most 750 kb/d in 2026. Assuming a constant rate of increase, this will give an additional 120 kb/d in December 2022. The rest of non-opec producer are, at best, only able to maintain their production. Among the rest of OPEC producers ,all are in production decline. There is only Iran which could increase its production but only 1,5 Mb/d at most. With all of this, we are a long way from increasing global oil production by 6 Mb/d until December 2022.
JFF
I cannot answer your questions regarding the EIA. However I can show some graphs that show what they are thinking. Note that these numbers are all “All Liquids”.
As you can see, they are showing no growth for OPEC between December 2021 and 2022. However they are showing US growth of 1.25 Mb/d and Russian growth of 1.15 Mb/d. There is much discussion on this board on what these three will do going forward. Now we know what the EIA is thinking today but we can be sure it will change in the coming months.
Jean, I cannot get into the heads of the EIA analysis and figure out why they make the predictions they do. That is, do they really believe the shit they predict? Or do they do it as some kind of propaganda campaign to keep the shale Ponzi scheme afloat as long as possible because they think it is their civic duty to do so? I just don’t know but I would imagine it is a little of both.
But we must look at the history of all the peak oil predictions. It all started around 2005 when almost everyone thought peak oil had arrived. But it did not happen. Then many thought it had arrived every couple of years since then. But the peak oil prognosticators became fewer and fewer. Now because all the predictions have been wrong in the past, it is just naturally assumed that peak oil will never happen.
So, even though almost every major producer has peak, including the three largest, the US, Russia, and Saudi Arabia, people cannot bring themselves to believe that peak oil has finally arrived, or did arrive a couple of years ago. So all we can do is shake our heads as they continue to predict that oil production will keep going up and almost forever.
But I find it rather fun to watch as finally someone else’s predictions are going up in flames. 😉
Ron , simple answer . “It is difficult to get a man to understand something, when his salary depends on his not understanding it.” . –Upton Sinclair
You’re just full of those expressions. ‘u’
Great post Ovi. Thanks so much!
Survivalist
Thanks. Much appreciated.
Damn, you beat me to it. But yes, this.
It seems more a wishful thinking exercise now, rather than legit predictions bore out by data.
Ron,
Nobody is predicting oil output will increase forever, only that is will increase from the current level to something higher than the 12 month maximum in 2018 in the future. My guess is 2030. The combined output of all oil producers is the number that matters. As oil prices continue to rise as the World economy recovers, we are likely to see rising oil output.
I agree the EIA’s IEO 2019 is likely wrong, but their predictions through 2030 may be reasonable, after that demand is likely to falter and output will decrease, imo.
I agree the EIA’s IEO 2019 is likely wrong,…
You think? 😉
but their predictions through 2030 may be reasonable,
Dennis, the same logic that the EIA used to make their 2050 prediction was used to make their 2030 prediction. That tells you all you need to know.
Ron
That Canadian chart reflects what I have been thinking for a while. At the current time we have a green prime minister who once said the oil sands need to be phased out, even though it is one of the biggest, possibly the biggest contributor to the government coffers. He and Biden are working together on a CC plan.
In addition, we have other players trying to shut down the oil sands. Biden killed Keystone XL. The Governor of Michigan wants to shut down line 5 that passes through Michigan that supplies oil to the US and Canada from Alberta. It has operated safely for 50 years but she decided during here campaign that line 5 posed too great a danger for Michigan. We have had 10 years of objections to Line 3 that passes through Minnesota and recently Jane Fonda showed up to help support their cause. Somehow we keep sending close to 3.5 Mb/d to the US.
However I figure as we hit peak oil somewhere in the next five years and it is obvious everyone, things will flip. I think that the world and the US will be pleading with Canada to share more of their oil. I am wondering if the EIA seeing a similar scenario.
as we hit peak oil somewhere in the next five years and it is obvious everyone
The only thing that would make it obvious is very high prices, right? How high do you think prices will likely go?
The only thing that would make it obvious is very high prices, right?
No, not at all. If your dreams come true Nick, we could hit peak demand in this decade. Or if the Pandemic gets worse instead of better we could hit peak demand in less than five years. Peak demand will be marked by very low oil prices.
This all happens after we hit peak supply in 2018.
However, if EVs don’t take over the world, and the Pandemic does get better, it is very likely that demand will increase into a world of ever-shrinking supply. Then prices will rise. How high? That depends on the economy. A shrinking economy, brought on by the Pandemic, or some other reason, will keep prices from going too high even in the face of a shrinking supply.
Nick G
High prices and people searching Google for “Peak Oil”
Ron
If we assume that 25M EVs will be sold in 2030 which is close 25% of world sales let’s see what that means in terms of crude demand.
A rough split for crude use is 50% transportation and 50% industrial. So if that 2030 fleet were all BEVs, that 2030 fleet, conventional plus BEVs would reduce its crude consumption by 12.5%.
Since the fleet will be a mix of BEVs and PHEVs, a more realistic reduction number would be 10%. Adding up all of those EVs over 10 years adds about 100 M new EV vehicles to the world fleet. So roughly that whole fleet (2020 to 2030) would reduce its crude consumption by 5% since the 2021 fleet only has a small saving.
There are currently 1.4 B vehicles on the road today. So that whole EV fleet would be 7% of today’s world fleet. Probably bigger in 2030. So world demand could be down by 3.5% in 2030.
Considering a growing population and vehicle fleet, along a with natural decline in the oil fields, I think peak oil hits before peak demand and the initial reaction will be higher oil prices, which in itself could move more people to EVs.
My bigger concern with the higher oil prices is a repeat of the 2008 scenario that accompanied those high oil prices.
I think that the tension between supply and demand will begin to manifest itself around 2025 and how it plays out after that is anyone’s guess.
Although rising demand for a resource that is running out seems like it would raise prices, that’s not really how markets work. This is illustrated by other resources, such as fish stocks, which collapse and remain cheap to the end. Around the world one fish population after the next has collapsed, but there was no sign of increased prices before the end came.
Prices are constrained by what is there today, how much it costs to get it and how much people value the product. What happens tomorrow rarely has much effect, despite what the guys on the futures market will tell you. Those markets are just casinos anyway. You might as well as gambler what will come up on the next roll of the dice.
I know this is the oil thread, but I thought I’d see what I could find regarding EV adoption in the Midwest.
I picked the two most blue states in the Midwest, Illinois and Minnesota.
Through 4/15/21, Illinois has a little over 28,000 registered BEV.
Through 2/21, Minnesota has a little over 11,000 registered BEV and another 7,000 PHEV.
Of course, the adoption is centered very much around Chicago and the Twin Cities.
Rapid growth in both States, from a very small base.
Ron,
The scenario is reasonable through 2030, after that much of the oil resource will be too expensive and much of the demand for oil will have been replaced, in addition the expensive resources, deepwater, tight, and extra heavy oil take time to develop, after 2030 oil output will decline, but the prediction for crude plus condensate in IEO 2019 of about 85 Mb/d in 2030 is reasonable, increases beyond that are unlikely, though if demand is there, a plateau might be maintained for 2 years out to 2032. That’s how I see it.
For scenario below, a new peak is reached in 2025 and the final peak is 2030, a plateau of 84 to 85 Mb/d from 2027 to 2032 with average output for those 6 years at 84.65 Mb/d. click on chart for larger view.
Having been in the LTO business in the Permian, unless prices rise to $85 per barrel, there is no way we will see your numbers of 2025. Companies who thought they had 20 years of inventory are now inventory starved. Even in the core of the core, what used to be projected as 8 wells per bench per section now is down to four. The resource may be there but the bottom hole pressures have diminished greatly. I have followed this website religiously over the years and you guys do a tremendous job in analysis but in reality we are seeing significant write downs of producible reserves at current prices.
That’s very significant if pressure has dropped across core acreage.
LTO Survivor,
I start with USGS mean TRR estimate for Permian basin of about 75 Gb, then apply a future oil price scenario along with well economics and EUR based on data from shaleprofile (EUR for C plus C only about 378 kbo for average Permian well completed in 2018). My recent oil price scenario assumes refinery gate prices go to about $75 per barrel in 2019 $ by the end of 2022 and then remain at that level until 2040 (they never rise any higher than this price which corresponds to about $70/bo at wellhead (where I have assumed average transport cost of $5/b from Permian to Gulf coast refineries or export terminals). The ERR for the basin is about 62 Gb based on these assumptions (the 62 Gb includes the 7.7 Gb already produced from Permian tight oil resources.)
If we assume the USGS F95 TRR estimate is more accurate, then clearly output would be lower than I have estimated.
Chart below has a conservative scenario I created in April 2021, based on slow rise in oil prices to $70/b at wellhead by 2025, then flat prices to 2040. A 10% discount rate was assumed, using a 40% assumption would lead to lower output and fewer wells completed.
clicking on chart will bring up larger chart.
LTO survivor,
If I understand you correctly, you use a 40% discount rate for your analysis (essentially this becomes the IRR), I have used a 10% discount rate because that’s the number I see in SEC filings.
I require the discounted cumulative net revenue over the life of the well to be more than the well cost (which I assume is 10 million in 2019$) in my models, so a change in the model to a 40% discount rate vs 10% makes a big difference. For a 10% DR I get 62 Gb, and using all other assumptions the same (prices, costs, taxes, and royalties) with a 40% DR I get about 17 Gb, chart below click on it for larger view.
A permian scenario with same economic assumptions as previously except a 20% discount rate, URR=45 Gb. Permian debt gets paid back in full by September 2026 for this scenario. Total wells completed are 121k for scenario with about 31k completed by March 2021, last well completed in February 2037.
Click on chart for larger view.
Rystad: Oil to Peak in 2026
The rapid adoption of electric vehicles (EV) around the world will probably cause global oil demand to peak two years earlier than previously expected, Norway’s biggest independent energy consultancy Rystad said on Wednesday.
World demand is now seen peaking at 101.6 million barrels of oil per day (bpd) in 2026, down from a forecast made in November of a peak in 2028 at 102.2 million bpd, Rystad Energy said.
“The adoption of electrification in transport and other oil-dependent sectors is accelerating and is set to chip away at oil sooner and faster than in our previous forecast,” Rystad wrote.
Before the outbreak of the COVID-19 pandemic in early 2020, Rystad had anticipated that peak oil demand would be reached in 2030 at 106 million bpd.
https://peakoil.com/consumption/rystad-oil-to-peak-in-2026
HB
On the other hand: “New study explains why nearly 20 percent of electric car owners return to gas.”
This is the interesting statement, “Tesla owners are the least likely to trade back their EVs for gas, but Fiat 500e buyers are much more likely to go back to gas.”
That’s the difference between true believers and discriminating consumers.
https://thehill.com/changing-america/sustainability/energy/551207-new-study-explains-why-nearly-20-percent-of-electric
“That’s the difference between true believers and discriminating consumers”
I don’t think that’s an accurate statement. First off, to get 75 to 80 percent of consumers to repeat a purchase is extremely high. Second, there are somethings ICE still do better than EV’s. Third, the type of EV’s available today don’t meet everyone’s needs and most important fourth but not all, your talking about an entry level Fiat 500e with a range of about 80 plus miles compared to reasonable normal vehicle range of the Tesla.
Last week there was a segment on CNBC projecting 2030 worldwide EV sales at 25.4 million units. That’s only 9 years from now and that is still only about 25 percent of all new sales. Dennis and Ron have been having a lot of conversation of late about peak. I don’t think Rystad projection is far off Dennis projection and actually my own.
It’s a transformation and the process is going to take a couple more decades. It’s going to happen because there doesn’t seem to be any other alternative. This is going to be a lot less painful than the 70’s when the federal government started enforcing emissions laws on vehicles. I look forward to more clear sky’s in the LA basin. I remember back in the 60s, when if you looked down the street. You could only see a 1000 feet and than everything turned gray.
HB
I saw that CNBC segment also and I think that I worked out the growth rate and it was close to 25% per yr. Dennis pointed out in response to what is below in the previous post that the average growth rate has been close to 25%. I find it difficult to use the data from such nascent segment to project out ten years. We are still in the early phases of this segment once we get through this pandemic we will see a more realistic growth rate.
To me the EV market is bifurcated. From what I can see there are four concentrated EV markets in the world.
– California due to its history with car pollution.
– Norway using its massive oil revenues to heavily subsidize EVs along wth other perks.
– China with their heavy EV sales mandate and getting away from its achilles heal, oil.
– Japan also wants to reduce dependence on oil.
Looking at what is happening in two US states provides some insight on how fast the EV take up will occur in the US. California with a population of 39.5 M sold 133,000 EVs in 2020 or put another way 3,360 EVs per million population. New York with a population of 19.45 M sold 21,000 EVs in 2020 or 1,080 EVs per million population. That is a ratio of three to one. it would be a lot higher in other states.
Total US 2020 sales were 296,000. California accounts for 45% of US sales.
My point is that these 4 concentrated regions are not representative of the rest of the world. The only region that will continue to grow at a significant pace will be China with its sales mandate and I think with an eye to becoming a world leader in EV design.
EVs are coming, no doubt, but at a pace that is slower than most prognosticators are forecasting, primarily because of cost.
At its current pace, global EV sales are more than doubling every year. Not a pace likely to continue, for sure, but way above 25% growth:
https://cleantechnica.com/2021/05/01/tesla-siblings-wuling-mini-ev-shine-in-hot-ev-market-global-ev-sales-report/
Sounds like this growth rate discussion is going to carry on for a few more years. ???
OVI,
I think your right about this discussion continuing for a few more years. What’s going to change in a couple of years are most of the major auto manufacturers are going to have large battery factories up and running. GM with two costing 2 billion each, Volkswagen with six, Ford one in South Carolina, etc.
I expect your California region will turn into the U.S. plus Canada with a few hold outs. Norway will turn into Europe for your same reason Japan wants off the oily stuff. China will continue to be all in. They already have stricker fuel mileage mandates than the U.S. and plenty of pollution. Also, I see poorer countries with weak grids and oil rich countries slower to transition.
HB
No EU country can afford the subsidies provided by Norway. Even China has started to reduce its subsidies.
I think that US will settle somewhere closer to New York than California. The middle US is a lot different than California and New York.
I saw a survey recently on what is important to US people. Fixing covid and the economy were right up there around 75%. CC was last at 54%. I take that as an indiction of how fast the move to EVs will be.
Ovi,
Cost will fall and transition is likely to accelerate, there will also be far more choice from GM, Ford, VW, Audi, Mercedes, Kia, and Hyundai. Soon there will be EV pickup trucks to choose from as well. My scenarios take current sales growth trend and assumes a decrease in the rate of growth to 10% or less. Note that sales of oil grew at 7% per year on average from 1935 to 1975 and was demand limited, once EVs fall in TCO to a level lower than that of ICEV, demand will no longer be a limitation, only supply growth will be a constraint on new EV sales.
When smart phones first came out, I thought they would never catch on.
When I saw the first iphone in 2007 (a friend had one), it seemed cool, but I never though I would buy one, how about you?
You seem to think like I did in 2007. Your assessment of future EV growth will be as correct as mine in 2007. 🙂
We will see how it plays out. Global plugin vehicle annual sales growth for new vehicles in 2020 (during a pandemic) was about 42%. I expect this rate of growth will gradually slow to 10% per year over the next 10 years. Say 39%, 36%, …, 18%, 15%, 12.5%, 10% for annual plugin sales growth over the 2021 to 2030 period.
Dennis
As noted above, some organization forecast that there will be 25 M EVs sold in 2030. which is roughly 25% of current sales. Everybody expects prices to fall by then. For me, that means that companies will keep the extra profit.
When I see headlines like this, I have difficulty seeing prices fall.
Tesla Stops Selling 35,000 model 3.
“That price point was repeatedly mentioned by Tesla over the years and in 2019, the automaker finally launched the Model 3 Standard Range version for $35,000 — delivering on a promise made long ago and proving the skeptics wrong. However, the automaker moved away from the product just a few months after launching it.”
if prices are dropping, why can’t Tesla make a profit selling a $35k model 3. I can’t remember the exact numbers but in the Q4-20 earnings report, Tesla’s earnings were around $100 M. Buried in the report, it was reported that they sold $300M in emission credits to the other car companies. $200M lost making cars.
I think it is easier to convince people to buy a $500 iPhone than a $40k car.
https://electrek.co/2020/11/16/tesla-stops-selling-35000-model-3-2021-model-year-refresh/
Yes I finally succumb and bought a refurbished iPhone SE (original). Been upgraded to IOS 14. An amazing piece of technology. I had no choice because my stock broker insists on sending me a confirmation code, randomly, when I access my account.
Dennis
Here is an update on Q1-21 Tesla earnings.
Tesla Made More Money Selling Credits and Bitcoin Than Cars
Tesla recorded another profitable quarter in the first three months of 2021 even with two of its models on the sidelines, posting a net income of $438 million while recording $10.4 billion in revenue. This profit didn’t materialize thanks to car sales, however, which is ostensibly the main business of an automaker.
Rather, Tesla has two main items to thank for posting a profitable quarter: Sales of emissions credits to other automakers, and sales of its bitcoin holdings.
Emissions credits accounted for $518 million in revenue in a quarter that saw a pretax income of $533 million and a net income of $438 million on a GAAP basis. Needless to say, the credits account for almost the entirety of Tesla’s profit for this quarter—in fact, sales of emissions credits have been a major source of revenue for Tesla for quite some time, contributing to hundreds of millions in income for the past few quarters.
The automaker accumulates regulatory credits because it produces only EVs and sells them for a profit to other automakers that are short of these credits.
https://www.autoweek.com/news/green-cars/a36266393/tesla-made-more-money-selling-credits-and-bitcoin-than-cars/
Ovi,
People are already buying cars that cost 35k (average selling price for autos sold in US), there is a slight premium for a Tesla M3. but comparable vehicles (Mercedes C and BMW 3) are similarly priced, in fact even a Toyota Camry, similarly equipped to the M3, has a similar TCO (Telsa a bit better). As oil prices rise and cost of EVs falls the EVs will be the better buy, in addition, just as there were not a lot of apps etc for smart phones at first and connection speed was poor, now many find it hard to live without the constant connection of smartphones. For EVs the charging infrastructure will be built out and most stores, restaurants, hotels, and public parking lots will have level 2 chargers available.
Those that do not will lose business to those that do. A level 2 charger is not expensive to install, electricity is ubiquitous in developed nations.
This is 20th century technology (electric infrastructure) not hard to do. In ten years you will look back and say, boy I was very far from the mark, like me with smartphones 14 years ago, I thought I would never buy one, I think I held out for 4 or 5 years.
I thought the same thing about laptop computers when they first came out, why would I need that? Now it is all I use.
Probably my estimate for future EV transition is too conservative, as Hickory points out (and I hope he is correct.)
As to those who think I believe this is a panacea, they are wrong.
It is simply one of many actions that need to be taken to reduce human impact on the planet. Another is better education for all which will reduce population growth, higher education levels for women correlates quite well with lower total fertility ratios (TFR). If we get the World average TFR to 1.5, population will peak and fall rapidly, this level has already been attained for about 30% of the World’s population, as economic development continues, the World TFR will fall.
I agree with you on this post Dennis. Besides population growth, education should also help the environment.
I would expect when the auto manufacturers in a few years get their battery factories up and running. EV’s will be price competitive to ICE and won’t need government subsidies.
Ovi,
I priced a Toyota Camry at MSRP, loaded XLE V6, this would have similar features to a M3 standard range plus and less power. Price of Camry 38k, price M3 39k. TCO would be lower for M3. Price for M3 is likely to fall over time and price of gasoline and TCO for Camry will rise.
In a few years new ICE vehicles will be like flip phones, have you seen many of those lately?
Tesla has a large battery factory in your comparison. Smartphones a faction of the cost of a vehicle, shorter life cycle and bigger user upgrade. I would expect the EV transition to take longer.
Ovi-
Telsa dominates the EV market in America, but not in Europe or China. Here in Germany, they are in third place.
VW’s best selling EV, the E-up, retails for €21000. Meanwhile the Chines are offering much cheaper cars like the Wuling Hongguang for under $6000. Whether Musk can offer a car at $35K will not decide the future of the EV business.
Facts are useful.
https://www.just-auto.com/news/global-electric-car-sales-up-41-in-2020-iea_id201603.aspx
-IEA- Electric car registrations in creased 41% globally during the pandemic year 2020
-1st quarter 2021 global electric car sales rose 140% compared to same period 2020
-global auto makers offered 370 electric models in 2020, a 40% year on year increase
Material needs for EV transition
https://www.youtube.com/watch?v=n_gvvj56rzw
Not being male. That is an interesting factor cited.
The only Tesla owner I know personally loves his Tesla while his wife hates it. They still have four vehicles, Model S and three ICE.
There are four EV’s registered in my county. Given that the largest employers include an oil refinery, upstream oil production, and two suppliers to the ICE auto industry, I suspect my community is a poor example.
The 20% reverting to gasoline. In Calif. Reason given, charging time.
https://www.zerohedge.com/markets/1-5-ev-owners-california-are-switching-back-gas-because-charging-hassle
This is Calif with no cold weather and green zealots. Elsewhere, likely more.
There are a lot of planned and unplanned blackouts here in California due to the wildfires; that must figure in, too.
” I suspect my community is a poor example.”
Good conclusion.
Mine is also a bad example.
We have over 36,932 registered EV/PHEV’s in this county.
Almost all within the last 5 years.
About 60% of the electricity is hydroelectric.
By the end of the decade almost all new vehicle sales here will be electric.
New drivers in the 2030’s will not even recognize the smell of gasoline…perhaps.
What county and state
Martin Luther King Jr , WA -formally known as King Co, WA
It is not representative of the USA. It is more coastal, urban, educated, multicultural, prosperous and tech savvy than the average USA county, by far.
But it is a good look at where the future is heading when it comes to technological and industrial trends.
I don’t live in the city, or at 7900′ up in the mountains, but this county has both of them.
btw- We happen to see the Electric Transportation Revolution from different vantage points, but it really doesn’t matter what we think. It is interesting to watch, and I find the various viewpoints interesting to ponder. Thanks.
Nice choice Hickory, definitely would be on my short list
Shallow sand,
My wife loves her Model 3.
Regarding the EIA’s GOM production forecast out through 2022; I’m fairly aligned with them through November 2021 but am not sure what is behind their big increase to relatively flat production from December 2021 through about August 2022 or so, unless they think that is when all the production wells that were deferred last year will come online. There are no big projects slated to come online this year, as far as I know. Probably some tiebacks, etc,, but I’m not aware of anything big.
My 2021 average production is not too far from the EIA prediction – EIA is about 1.71 mmbopd and I predict about 1.65.
We do differ more on 2022 – EIA is about 1.75 and I’m about 1.51. I show a continuation of the decline established in 2021 to continue into 2022.
I have the GOM exiting 2022 at about 1.6, while EIA has it at 1.8.
As I commented earlier, I think their increase in late 2022 is due to BP’s Mad Dog 2 and Shell’s Vito coming online. Murphy’s Kings Quay is also a 2022 first oil.
See chart below – note that I am plotting BSEE production data through January 2021. The circled data point is the EIA’s February 2021 estimate.
SOUTHLAGEO
What is causing the 200 kb/d drop from Feb-21 to Nov-21? Maintenance?
Thanks for the idea to add the STEO projection.
I believe the impact due to lack of significant new development drilling investment is kicking in, so you are seeing something closer to the underlying decline. If you remove the 2020 months from around May to October, where you have a combination of Covid shutins and storms, I think you can see this as well – where production dropped from the 1.9 range to the 1.7 range. I see this trend continuing to late 2022 when the new fields kick in.
I may be exaggerating this decline a bit. Right now, I’m not showing the production boost from the “covid” delayed development wells, but that’s because I don’t have them factored into my forecast through 2022 at all. But, in my mind, I’m thinking these wells won’t get spud until early 2022, so their production impact wouldn’t be seen until late 2022. So, if I did factor them in, their production boost would kinda coincide with when the new fields come online.
Given the last couple of years and the growing warmth in GoM waters they might need to revise their assumed hurricane impacts downwards. For the continued drop one impact is that a significant number of wells that were switched to inactive in the Covid impact have not come back online. Once they update their well data, which is usually 1 or 2 days after production data, I’ll post a chart.
Thanks SouthLaGeo,
Below is an analysts report on Continental Resources Q1-21 earnings.
Can someone explain $5.56/mcf. I think this is Canadian. Posted natural gas at HH today is $US2.96 or $Cdn3.64. That is 50% higher than HH. Increasing dividend also.
Impact: POSITIVE
■ Strong FFOPS beat on robust gas price realizations: Q1/21 production of ~308 mboe/d was pre-released on April 13. FFOPS of $2.44 was well ahead of consensus ($2.10) and TD ($1.74), largely due to much higher-than-expected realized gas prices ($5.56/mcf).
■ Dividend re-instated at $0.44/share (annualized): This represents a more-than- doubling of the quarterly dividend, a 1.6% yield (vs. group average of 1.8%) and follows initial instatement in Q2/19, and a subsequent suspension in April 2020 as oil prices collapsed.
■ Outlook unchanged; YE2021 debt targets accelerated: With the 2021 budget intact, CLR now expects to generate $3.1bln of cash flow (+30% vs. prior expectations) and $1.7bln of surplus cash flow (+70%) at $60/bbl WTI/$2.75/mcf Henry Hub. Surplus CF should drive debt reduction to its target of <$4.0bln by YE2021.
■ Well costs still trending lower: CLR is targeting a 30% improvement to Bakken well costs by YE2021 vs. 2018 (7% targeted contribution for 2021). With well productivity largely flat over this timeframe, lower well costs are clearly enhancing the economics. Similarly, in Oklahoma, it is targeting a 42% well cost reduction by YE2021, but here it has also benefited from consistent well performance improvements (a function of less mature plays, in our view).
■ GHG/methane emissions one key area of ESG focus for 2021: CLR has reduced its methane emissions intensities by 58% since 2016 (~1% flaring/venting in Q1/21), while GHG emissions are down 35% from 2016 levels. However, unlike some of its peers, CLR has yet to set out net-zero targets. The full ESG report is to be issued in mid-2021.
There just may be a problem with the EV revolution.
1 In 5 EV Owners In California Are Switching Back To Gas Because Charging Is A “Hassle”
1 in 5 switched back to avoid dealing with the lengthy time it took for their vehicles to charge. (Wait until they find out how the electricity was being generated to charge their cars in the first place!)”
70% of those who switched lacked access to Level 2 charging at home, which can charge vehicles in about twice the time as a normal Level 1 plug. Level 1 charging from a standard home outlet puts out about 120 volts of power. Level 2 is twice that, whereas Tesla’s SuperChargers can offer 480 volts.
“If you don’t have a Level 2, it’s almost impossible,” said Bloomberg automotive analyst Kevin Tynan. It took him six hours to charge his Chevy Volt back to 300 miles of range using a Level 2 charger.
Two thirds of those surveyed also said they didn’t use public charging stations. Good thing Joe Biden is rolling out trillions in EV “infrastructure” for more of these.
Hardman and Tal wrote: “It should not be assumed that once a consumer purchases a PEV they will continue owning one. What is clear is that this could slow PEV market growth and make reaching 100% PEV sales more difficult.”
Tynan concluded: “For all those legacy automakers, that profit and loss piece does matter. And that’s why you’re getting this half effort on electrification.”
This is down to American’s weak electricity infrastructure. But consumers are probably not going to be the main drivers EV buys in the next few years. It will be fleet owners like taxi companies that can provide their own infrastructure.
Worldwide EV sale are growing at an extremely high rate. There are long waiting lists for quite a few models. The limiting factor is battery production.
Here in Germany EVs are now 10% of the market. Sales nearly doubled between Q1 2020 and Q1 2021. VW is outselling Tesla almost three to one. Tesla is neck in neck with Hyundai and Smart. Three of my immediate neighbors now charge their cars in their front yards. It happened very suddenly.
Wait until they find out how the electricity was being generated to charge their cars in the first place!)
Depends on the time of day. As I write, generation in CAISO is about 50% solar. At night supply decreases, but so does demand.
http://www.caiso.com/todaysoutlook/pages/supply.aspx
So it’s not clear to me what your source intends with that remark.
Ron
There is some discussion related this article immediately after Dennis’ chart on the World Oil Shock Model.
The bigger phenomena, especially for those who own their own home, is that once they no longer have to go to the gas station they never want to go back. Not even once.
No oil change also tends to be very likeable.
In a country named Sweden the percent new vehicle sales that are plugin EV’s grew steadily from 10% to 43% in the past 16 months. They have a greater incentive than USA- no domestic oil production.
The best selling vehicle currently is the new VW ID4.
I’ve recently bought a second-hand diesel automatic VW Passat. $10,000 equivalent. It does 55mpg, takes 3m to fill and can make Land’s End to John o’ Groats (900 miles) on one tank. Fast, powerful and quiet. What’s not to like?
Well there’s all those ever so tempting subsidies the grateful British taxpayer continues to lavish on the EV owner. Worth more than $2,000 p.a. for the average driver. But it’s still not worth the hassle of short range and long charging time.
I Norway, which is very developed now when it comes to EVs, there are not many concerns against electric cars to be fair. In fact most people are very happy with their electric cars. And we have come to the phase that there is a group pressure to get one before the 2025 ban on ICE cars.
In Oslo I can say that around 40% of cars are running around on electricity just studying the traffic. The main obstacles are charging points (there can never be enough of them) and it is best to have a cheap one at home, cost of the car while also taking into account lifecycle costs and also the age of the buyer, as some older people don’t want the change. And that’s it really.
In my opinion the high prices for electric cars will drive the supply chain globally to supply more of them in the future. And it has to be that way for while, until there is enough volume for the price to decline. Perhaps that will never happen – if that is the case, we will have more car sharing and usage of taxis/metro/rail/electric buses for ordinary people.
The BOEM well data shows a couple of hundred wells taken off -lne in the Covid and hurricane shut downs have not come back, and may never. I don’t know why there is he big drop in drilling but it’s likely just delayed data.
Most of the effected wells are shallow water and either high water cut oil or some gas. Ovreall WC has dropped about 4%. Production is still falling relatively faster than pre-covid.
Thanks George,
So some of the GOM oil production decline is due to shallow water high water cut, low oil rate wells being permanently (perhaps) shut in. Just from looking at your 2nd chart with just shallow water data, that accounts for about 50 kbopd of less production – 170 or so before and 120 or so after.
Below I give an estimate for future US C C output. It is based on a conservative tight oil scenario (peak at about 8.75 Mb/d) and a continuation of recent trends for onshore conventional, Alaskan, and GOM output, the 2019 peak in US output (12.25 Mb/d annual average) is never reached, but we surpass the 2018 average level of 11 Mb/d (when the World peaked) at about 11.4 Mb/d in 2026. The DC scenario is likely to be low and the EIA STEO is likely to be high, reality will fall between my scenario and the AEO 2021 which has US output rising to 13.5 Mb/d in 2026 and to 13.7 Mb/d in 2029, so perhaps 12.5 / 1Mb/d in 2026 might be a reasonable guess.
API reports a big draw. WTI at new current high $66.15.
Crude -7.69 M bbls
Ovi,
Brent futures at close to $69/bo as I write this.
Somehow Venezuela has managed to claw back from the dead, nearly doubling oil exports to 700K from a low of 370K in October. I wonder how long it can last. The only news out there seems bleak, with the P1 Covid variant having apparently moved in from Brazil and causing a nascent surge.
https://oilprice.com/Latest-Energy-News/World-News/Venezuelas-Oil-Exports-Hover-Around-700000-Bpd.html
EIA came out with another 100k production drop for the past week. I think they are having difficulties with their models. Perhaps they don’t take into account that the child well IPs are roughy 40% lower than the parent well IPs. The only wells being drilled today are child wells. Inventory is drying up quicker than a puddle in the summer on a Midland street.
LTO Survivor
When you say “The only wells being drilled today…”. Are you referring to a particular basin or all LTO basins. Are the child wells, wells that are drilled between previously drilled wells?
Appreciate that I know very little about drilling techniques.
Yes and Yes. These are LTO wells and the amount of pressure depletion from Parent wells to child wells is staggering and completely omitted in earnings reports. The oil resource is still present but with less energy to move it to the well bore and no proven secondary recovery methods yet exist.
We have drilled over 300 LTO wells in the Permian Basin and the per well productivity is going down and fast. Production models that show an increase in production in the US will only happen at a consistent, reliable and hedgeable ( not in backwardation) above $85 WTI. These are the facts. I see it with my own eyes every day.
LTO SURVIVOR
Thanks. Much appreciated info
Sir, welcome to coming out of the closet . We definitely need some individuals who have an ear to the ground . You have confirmed what some here have been saying from a long time (1) Reserves are overstated (2) DUC’s available are actually non viable (3) At $ 75 , LTO was not viable ,is not viable and will not be viable (4) I think it was Matt Simmons who said ” Shale is about using Caviar to make fish stew ” . Looking forward to your valued contributions and active participation .
LTO Survivor.
I’d appreciate it if you would give your views on the profitability, or lack thereof, of operating these horizontal wells once production drops below 25 gross BOPD.
What kinds of issues do you encounter? Are there just a few, or a lot, of what we operators call “problem wells”?
LTO SURVIVOR
There was a company, Crescent Point Energy, that was using water flood to increase production from their LTO wells. Not sure if these were in Canada or the US. They claimed it was successful.
As best as I understood, this is what they were doing. Essentially they were drilling a horizon well between the oil wells, not sure if it was then fracked, since it had to make contact with the oil wells. They then pumped water into it to force more oil out of the oil wells. You might be able to look up what they did and have a better understanding than what I am providing.
That’s not something extraordinary. They started from a low of 300.000 b/d or so during 2020 spring and they raised their production to 525.000 b/d in March of this year. So far so good, if they achieved this, but should I remind you that they have been in decline since the beginning of 2016 and that they were producing 2.4 Mb/d at that time?
Of Interest .
http://energyskeptic.com/2021/the-end-of-fracked-shale-oil/
Indeed, and wow.
I did not get the technical point:
The damage was done by operators who carried out such “massive fracks” that “artificial, permanent porosity” was inadvertently created, reducing the pressure in reservoirs and therefore the available oil.
Unless I am mistaken, the whole point of fracking is to enhance rock permeability in the vicinity of the well. Re-fracking can help reduce counter-pressure by further raising the permeability. This allows to produce additional oil when the rock pressure is getting too low for natural lift.
Hence, I don’t understand why the fracking process would lower the reserves.
See https://www.aogr.com/magazine/frac-facts/study-assesses-interference-between-parent-child-wells
Schinzy,
Great paper thanks. I wonder what LTO survivor thinks of it as he would know more than me.
FAO food price index continues up, “The increase marked the eleventh consecutive monthly rise in the value of the FFPI to its highest level since May 2014.”: http://www.fao.org/worldfoodsituation/foodpricesindex/en/
The index was rebaselined to 2014-2016 = 100, so the danger zone for unrest is greater than 130, compared with 220 previously. We’re at 120 rising fast and possibly due for a big jump as western economies bounce back. I’ve managed to chop off the hundreds in the y-axes numbers but it goes to 160.
George , thanks for the update . There is no comeback ( see my post ) but there are supply chain problems in conjugation with free money floating around that are pushing prices up across the board . For food prices an additional factor is Chinese imports . They are buying grains across the world even from arch enemy India . Seems like the floods and swine flu last year have caused a lot of damage to their food supply .
George- I appreciate the excellent book that you recently recommended-
Arrival of the Fittest: Solving Evolution’s Greatest Puzzle
Brilliant.
Thank you guys. I can’t tell you how much I have enjoyed your website over the past years. I am happy to discuss anything you would like. The Shale business is not a ponzi scheme but does require much higher prices to be truly viable. As we run our capital allocation models, (without using acreage and Administrative Overhead costs), we would not drill any wells with less than a 1.75 times Net Present Value (which is net of drilling and completion capital costs) this should create a 40% IRR. However I don’t believe the actual results will bear out for our predictions due to the surprisingly lower bottom hole pressures. When you take the cost of debt and AO into account, the profit shrinks considerably, hence I believe it only makes sense to drill these wells at $75 per barrel and above. Even then, if investors want returns, production growth cannot be accomplished simultaneously. So where does that bring us? 1. Lower bottom hole pressures=less inventory ie…. lower ultimate reserves 2. Current prices with the current capital structures including debt are just trading dollars 3. Production in the United States at the current rig count and current inventory ($65 per barrel) will keep eroding over time. The only caveat is that if prices rise above $85 and capital costs stay the same (big “if””) in turn the capital allocation models would justify a few more locations per section per bench. Hope this makes sense to you guys.
Thanks for the insight. What I understand is that current 65$/bbl is your breakeven price. Because lending frenzy seems to have stopped somehow, it means that if price stays the same, drilling/completion rate should remain at current level, leading to a slow erosion of LTO production, as was pointed out by EIA’s latest releases.
Since Russia leaked a report stating its production has peaked, this leaves us with even fewer “healthy” producers. OPEC leaders (KSA, Irak, EAU, maybe Iran, Venezuela or even Lybia), Brasil and Canada shall all raise their production to bridge the gap that will appear, should demand come back to pre-covid level.
I can’t imagine world economy roaring back (in real physical terms) without a much higher oil price.
Totally agree. Additionally “depletion never sleeps” and with the lack of investment in 2020 worldwide, I calculate a 4 million barrel shortfall if demand equaled December 2019. This includes OPEC producing full blast save and accept Libya and Venezuela. I also truly believe Saudi Arabia’s excess capacity is very challenged as they are desperately trying to restructure debt.
Saudi Arabia is behaving like a country that is desperately afraid its oil income will soon start to decline dramatically.
Yes they are. I noticed their rig count is roughly half of where it was at this time last year. They are deathly afraid of not making the divide to payment of which they own 95%. Can you imagine how the oil market would react if they missed a dividend payment?
Sir, your posts have been posted verbatim on OFW blog of Gail Tveberg . The public hungers for real information and not from some correspondent sitting on the desk sifting the internet . Take this opportunity to thank Dennis , Ovi , Mr Kaplan , South la etc who make so much effort to collect and present all the info we non oilmen receive .
Sir, this is the most truthful and honest report I have seen from a long time on the shale oil play . Basically what you are saying is (1) At $ 65 you have to take on more debt to continue (2) at $ 75 you are trading dollars ( simply put treading water or the red queen effect ) . (3) At $ 85 you are over the finishing line . Am I correct ? .Tks for clearing the smoke .
Demand and supply issues . I do not see any pickup in demand for atleast 2021 . A simple analysis :
Demand side ;
Latin and Central America ; No chance . Argentina, Venezuela , Ecuador, Chile, Peru ,Colombia etc are all broke . Brazil is epicentre of Covid .
Europe : Double dip recession . All major economies have extended their income support programs till September . Germany till end of December . Spain , France , Italy , Greece have 20% of GDP from tourism . Not coming back . Same for UK .
Africa : Does not count .
Middle East ; Yes , the high oil prices will help the sovereigns , but only to the extent that they will not be digging a deeper hole than they are in .
India : Covid Collapse . Second wave will probably peak in a fortnight and a third wave is expected in October . All traffic in and out is closed .
Myanmar thru Cambodia ; All in limited or extensive lockdown as the Indian variant has travelled into this region .
Australia : Self isolation and now they picked up a fight with their biggest trading partner China .
New Zealand : Same as Australia minus the fight with Australia .
Japan : Lockdown 3 in action . More than 50 % chance that Olympics will be cancelled .
China : If the trading partners are in lockdown then China is also in lockdown . Oil import was down by 11% in April .
USA : Weak recovery and even this will decline once the stimulus checks effect wears off .
Supply :
All countries are past peak ( no one is going to acknowledge it ) . In the last 10 years all growth has come from shale and that party is over .
So now we are in a position where there is no pickup in demand and no growth in supply . Checkmate .
Collateral damage of Covid :
https://www.argusmedia.com/en/news/2210740-lng-vessels-diverted-from-india-as-covid-hits-demand
Weak recovery in USA
https://zensecondlife.blogspot.com/2021/05/all-signs-point-to-weak-recovery.html
China imports
https://oilprice.com/Energy/Crude-Oil/Chinese-Oil-Imports-Dropped-11-In-April.html
Third wave covid
https://www.theguardian.com/world/2021/may/06/covid-third-wave-inevitable-in-india-say-health-experts
Just confirmed that the recovery is a fake .
https://www.zerohedge.com/markets/aprill-payrolls-huge-miss-just-266k-jobs-added-expectations-1-million
Now, we’re getting confirmation what many of us having been saying for years; to maintain a reserve replace ratio of 100%, pay dividends and deleverage long term debt it takes much higher oil prices; I believe upwards of $90, sustained. In the absence of higher prices it requires more credit/debt to tread water and indeed, debt is being added, not reduced in all basins, even the Permian. It does NOT work at $61, as Mr. Coyne so adamantly claims, and there is no possible way over $140B of equity and/or deployed capital in the Permian can be paid back back by 2026. Consolidations and mergers are NOT an effort to improve efficiencies, or create economy of scale, those dudes are running out of A grade locations and they are in a panic.
Rystad now has its panties in a bunch about the amount of free cash flow the shale oil sector will achieve in 2021. It might… because it has slashed CAPEX. Its reserve replace ratio will be way less than 100%. Given the decline rate of HZ tight oil, that is a disaster in the making. Proven developed reserve assets are on the express elevator to the basement, along with relationships with lenders, future cash flow, and credibility. Most these guys already could not eek out a credit score over 600.
Hi Mike,
I do not have the insight that an oil man working in the Permian basin would have. I use the free data from the shaleprofile blog to estimate average new well EUR (both gas and oil) and assume an average well cost of 10 million in 2019 $ that remains fixed in real terms (constant 2019 US$), this implies an increase in nominal costs over time at the average annual rate of inflation. I realize the reality is far from this simple, but is just one of many simplifying assumptions of my model.
My model assumes the average 2018 Permian well has an EUR of about 376 kbo,1750 MMCF natural gas (302 kboe), and 133 kb of NGL. Price of Natural gas assumed to be $1.25/ MMCF at wellhead and price of NGL assumed to be 25% of the crude oil price. Royalties and taxes assumed to be 28.5%, nominal annual discount rate assumed to be 10%, nominal annual interest rate on debt assumed to be 7.4%. At a wellhead price of $63/bo and the assumptions above, the well pays out at 32 months (assuming a $10 million well cost). OPEX is about $7/bo over the first 32 months (per barrel of C plus C produced). Over the entire life of the well (196 months and 7.5 bo/d at abandonment) average LOE is higher at $12.3/bo (royalties and taxes not included). Net revenue over the life of the well at $63/bo is $15.5 million (in 2019 $), discounted net revenue (10% nominal annual discount rate) is $13 million in 2019$.
For my scenario I assume oil price rises to $70/bo at well head. For that scenario the average 2018 Permian well pays out at 28 months (assuming $10 million well cost and EUR of 378 kbo, C C only).
If oil prices are low, then less oil will be produced and debt may never be paid back.
At $85/bo the average Permian well pays out (cumulative net revenue=well cost=$10 million) in 17 months. Cumulative net revenue over the life of the well is 22 million (in 2019 US$), profit per well is 12 million (@10 million well cost). Discounted cumulative net revenue over the life of the well (nominal discount rate=10%) is 18 million.
I agree $85/bo will be better for producers than $60/bo, I disagree that it will be necessary to pay back debt.
“I disagree that it will be necessary to pay back debt.”
That’s a helluva statement, hand; yeow!!
Next thing you know the government will be paying people not to work.
Dennis , I hope that statement was a typo error . Instead of ” disagree ” you meant” agree” . Not expected from you . Debts have to be paid, at least till the economists come up with another theory which is even more extreme then the current MMT .
Keep in mind that governments, multinational and other corporations with deep pocket or political backing, and the very wealthy do not have to pay back debts. Or pay taxes for that matter (Trump for example).
They purchase accountants and lawyers and politicians, rather than pay back debt.
They use methods such as offshoring, bankruptcy, currency manipulation, and creative cost accounting to avoid paying debt and taxes.
Paying debt and taxes is for the rest of us.
That is the reality that we tolerate.
Some don’t even seem to mind.
Hickory, that’s really good input; thanks. For those than can’t resist politicizing taking a dump in the morning, I am sure you will have lots of folks that agree…its expectable the American oil industry would walk debt because most of us are, what, Conservatives?
Good grief. How stupid is that?
The American oil and gas industry is the heaviest taxed entity in America, top to bottom; production taxes to school taxes to sales taxes to Federal income taxes. Only the American shale oil phenomena has skirted that, because its a money loser.
In reality for over a century the US oil industry, that needed debt (not very damn often) paid it back. Its the right thing to do. Its honorable. Its American. Its why we strive to pay our mortgages off and be free of debt. So we can control our own destiny and not be sheep.
There are hundreds workover rigs parked in yards across Texas right now because nobody wants, or needs to work on those rigs. They can get free shit from THIS administration. That is harming America’s oil future and America. Not paying debt back is bad for America; its bad for our children.
There is no “explaining” that statement by Coyne and it is troubling about this forum…Americans that borrow money need to pay it back. Republicans and democrats alike. Period.
“For those than can’t resist politicizing taking a dump in the morning” “or needs to work on those rigs. They can get free shit from THIS administration” “because most of us are, what, Conservatives?”
“Good grief. How stupid is that?”
I will say in our little field we have been through some serious hard times since 2014 when the oil price dropped from $99.25 for the month of June, 2014, to $25 by February, 2016 (those being the prices we were actually paid). Then, of course, COVID caused a horrific price crash where we averaged $35 for the year (which for us was lower than 2016) and where we got just $15 for April, and under $30 for three other months.
Despite this, no operator in our field has filed bankruptcy. Every operator is a small, family owned company. When I bring up “family owned” there seems to be a lot of dislike of that term these days. I don’t get that, but whatever.
I feel this is pretty darn impressive, as our field is very old and depleted.
There are operators that have debt, as there have been sales and mortgages filed. Somehow, someway, payments have been made, at least enough such that there have been no foreclosures and no bankruptcies filed.
However, as we come out of the pandemic, the attitude in the field is still not good. I am not aware of any plans anyone has to drill wells this year. Our field is really declining now. It didn’t take many new wells to stave off most of the decline. But with zero, and with several still shut in, things look bleak.
As for lending, for our field’s production, that has pretty much dried up. Banks are being discouraged to lend on upstream production. That is real.
California intends on there being no more oil production in the State by 2045. This is more important than most realize.
We feel there will be a use for oil for many decades, even if it’s use for light transportation fuel ends. We feel we have wells that will fill that need.
But the public sentiment is horrible. The shale BS has not helped at all, IMO. The public thinks we all use gobs of drinking water, release tons of methane, dispose of loads of water at high pressure, causing earthquakes, and pollute in many other ways.
Shale BK’s have not helped either. I suspect the shale BK’s is what posters here are referring to regarding “debts not being paid back.”
I know many here don’t like my position that what we do has little in common with US shale. There are no hot shot financiers among us. No public companies. Few large private companies.
Everyone we work with is pretty much a small, family owned business. The supply store, the machine shop, the tank truck company, the rig company, the back hoe/track hoe/trencher, the geologist, the electrician, the junker that picks up our old rods and tubing, the injection pump repair company, the down hole pump repair company, the company that rewinds our electric motors, the insurance agent, etc. Everyone we deal with lives in a 50 mile radius. All small town people. All business owners. What I always thought the USA valued.
I think the internet is going to be the downfall of our society. People just fart around on it all day long, claiming to be experts on things they know nothing about. I include myself in that, and I am trying to cut down the time I spend on it.
I really admire two of our “old timers.” They started working when CB radios were the big thing in the oilfield. They have flip phones. Neither have internet on their phone. Neither even have an email address. They get a crap ton of work done, both say, because they don’t “Fu$# around on their phone all day!” Each pump around 50 producers and 20 injectors every day, and they only want each other covering weekends for the other, because they don’t want anyone else, “Fu$#!&g up” their wells, injection plants, etc. They won’t be easy to replace when they retire. Probably won’t be replaced.
Not many on the internet can relate to this stuff. Most everyone now is urban/suburban. There is a big divide in this country between “blue collar” and “white collar.” Blue collar don’t have time to pontificate on the net like us white collar do.
Young people see no future in upstream oil. The lack of workers will end it eventually IMO.
Mike,
Poorly stated by me, I meant that 85 per barrel wont be needed, only 75 to pay back debt, if 10% ROI works for producers, if they need a 40% ROI, then perhaps 85 is the right number.
What is a typical ROI?
Looking back I said I agree 85 per barrel would be better, but disgree that it (meaning 85 per barrel) is necessary in order to pay back debt.
You took my words out of context quoting the second half of a sentence.
I can see how it could have been misunderstood.
Hi Mike,
I said:
I agree $85/bo will be better for producers than $60/bo, I disagree that it will be necessary to pay back debt.
It was obvious to me that “it” in the sentence above referred to “$85/bo” in the first half of the sentence which you left off.
I do think it is necessary to pay back debt, I just do not agree that sustained oil prices at $85/b (in today’s dollars) will be necessary to do that, I contend that $70/bo for crude at wellhead will be high enough for debt to be paid back.
OK, Dennis. I need to move on. A suggestion: try not to run this LTO Survivor fella off; tell your political, anti-oil, anti-Middle America hacks (that THINK, incorrectly, they have the moral/intellectual high ground) to cool it. You’ll all learn something about the real oil and gas business from this guy that’s important.
Mike,
I agree debt needs to be paid back, except by Donald Trump 🙂 .
I said:
“I agree $85/bo will be better for producers than $60/bo, I disagree that it will be necessary to pay back debt.”
Then you said that I said:
“I disagree that it will be necessary to pay back debt.”
To prepare for those who like to misquote or take words out of context, I should have said:
I agree $85/bo will be better for producers than $60/bo, I disagree that $85/bo will be necessary to pay back debt.
I think $70/bo at the wellhead for C plus C, $1.25/MCF for natural gas at wellhead and, $17.50/b for NGL will be enough for debt to be paid back. Higher oil prices will allow debt to be paid back faster.
Hi Mike,
Yes I agree, LTO survivor sounds like he knows a lot, I appreciate learning from him just as I have learned much from you and Shallow sand.
Pretty sure you have mostly not heardcanything negative directed toward you from me. I don’t always agree with you, but that is different.
As to stupid stuff that others say, I let them speak for themselves.
Dennis,
How do you estimate the 133 kb of NGL per well? And how do you estimate the value of these produced bbls and its contribution to well economics?
I use the New Mexico and Texas combined NGL and natural gas output and find NGL per MCF natural gas.
I use shaleprofile data to estimate average natural gas well profiles.
The NGL price I assume is 25% of crude price and Natural gas sold at 1.25/MCF. The barrels of C plus C, NGL, and cubic feet of natural gas all generate revenue to pay well cost and LOE. Net revenue, gross minus cost is discounted at some annual rate, I use 10%, for the disconted cash flow model I assume discounted cumulative net revenue over the life of the well must be more than well cost in order for the well to be completed.
LTO survivor,
So for a discounted cash flow model, what nominal discount rate makes sense? I use 10%, would 15% lead to more realistic results?
Thanks.
Note that for my breakeven model for the average 2018 Permian well, if I use a nominal discount rate of 40% and wellhead price of $72/bo (2019 US$), then cumulative discounted net revenue is equal to well cost ($10 million) after 92 months with well output at about 30 bo/d at that point and cumulative C plus C output at 324 kbo.
For those that think in payout terms, the well pays out at 23 months at $72/bo at well head, (using revenue that is not discounted, but figured in constant inflation adjusted 2019 US dollars), and assuming natural gas is sold for $1.25/MMCF at well head and a barrel NGL sells for 25% of the wellhead price of crude ($18/b of NGL in this case).
LTO survivor,
Thanks, very interesting stuff.
So far the decrease in new well EUR in Permian does not really show up in shaleprofile.com data. That’s all I have to go on.
Rystad view on the international NatGas market and the situation in Mozambique-
“second part of this decade, is instead set to get tighter and could even see annual supply deficits as a result of likely delays in the development of LNG projects in Mozambique due to the country’s worsening security situation…The market could see up to 9 million tpa of supply removed between 2026 and 2030, disrupting global balances.”
https://oilprice.com/Energy/Crude-Oil/Mozambique-Delays-Could-Disrupt-Global-LNG-Market.html
Seneca cliff (rapid decline) scenario has played out for coal consumption in the USA, not due to shortage but due primarily to replacement with Natural Gas- enabled by the technology of fracking.
Coal fueled electricity output dropped by over 1/2 in 13 years, and is almost a mirror image of the Nat Gas fueled electrical consumption over that time frame.
An interesting observation of that graph is that the U.S. is riding a shale oil and gas wave. Funny, everything seems to always go well for the U.S., no matter how badly they try to screw things up for themselves.
However, it does shed a different light on why the past decade has been such a bonanza for U.S. assets, utopians, and true believers in American exceptionalism, and it has nothing to do with the supposed brilliance of Federal Reserve money shell games, but everything to do with further resource production.
You can see when this party ends, it’s pretty much over. Combined with increased populations around the world developing and increasing demand, there will be no way for the U.S. to grab more imports once shale ends. Shale is the end of the American century, it couldn’t get clearer.
Weekly US oil production came out on Wednesday. This chart just looks funny.
Ron , it looks funny to me too (the lows ,highs and the zigzag) , perhaps you can shed more light since you know more about this . However it just confirms that US will never produce 13mbpd again .
Hole in head,
US never produced 13 Mbpd of C plus C.
Dennis , yes not exactly but 12.86 mbpd in Nov 2019 .
In November 2019, monthly U.S. crude oil production averaged 12.86 million b/d, the most monthly crude oil production in U.S. history, according to the U.S. Energy Information Administration’s (EIA) Petroleum Supply Monthly.02 Mar 2020
Wasn’t it Nov 2018?
HT
Look at the first chart in the post or the one below.
OK-
That is US, not global.
I wasn’t paying attention.
Why there are discrepancies between the minimum of 2020 spring weekly oil production chart and the minimum of the chart C C oil production during the same time? I ask this because the 2020 spring minimum is at 10450 kb/d in this chart and the minimum of 2020 spring is at 10000 kb/d for the C C oil production chart. Furthermore, the following minimum (september and october 2020) are more important in this chart (something like 500 kb/d) than for the C C chart.
The weekly numbers are estimates which are never revised. Sometimes they are accurate and sometimes not, I just ignore them they are pretty much useless.
Dennis/Ron
I think the weekly numbers are improving. Only one big miss in May 2020.
Ovi,
Sometimes they are ok, we only know later how far they were off.
East coast Colonial Pipeline shut down due to cyber attack:
https://www.nbcnews.com/news/us-news/cyberattack-forces-colonial-pipeline-shut-major-fuel-line-n1266737
Two months ago semi conductors were the ” new oil ” . Today copper is the ” new oil ” . Unfortunately there is only ” old oil ” and we are over peak with that . Peak oil is a bitch . Readers here are aware of that , but the world is not . Enjoy the ride .
https://www.zerohedge.com/commodities/record-highs-copper-new-oil-could-be-double-here
A new thread January Non-OPEC production has been posted.
http://peakoilbarrel.com/january-non-opec-oil-production-climbs-again/
A new open thread Non-Petroleum has been posted.
http://peakoilbarrel.com/open-thread-non-petroleum-may-8-2021/