Here are the latest oil production numbers from the EIA. All data is in thousand barrels per day unless otherwise noted.
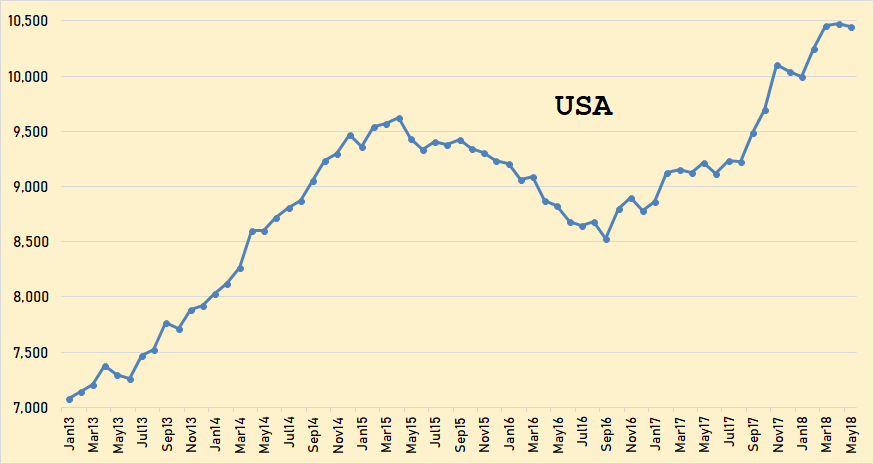
The USA through May 2018. The upward surge has stalled for the last two months. US production was down 30,000 bpd in May.
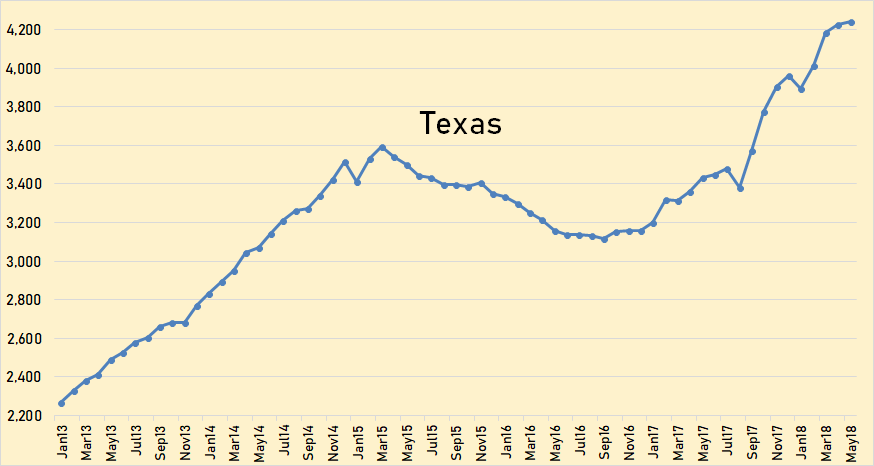
It is a little astonishing how close the Texas chart resembles the USA chart. Texas is, by far, the USA’s largest producer. As Texas goes, so goes the USA. Texas production was up 20,000 bpd in May.
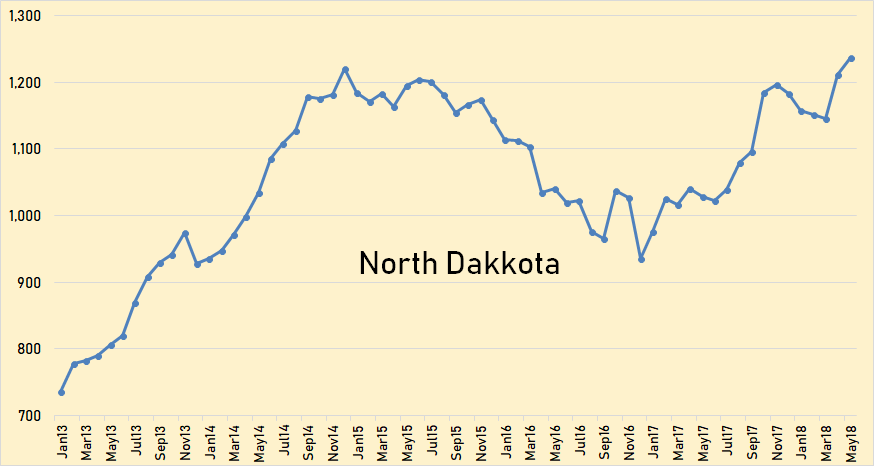
North Dakota production has increased significantly in the last two months. They were up 67,000 bpd in April and up another 25,000 bpd in May.
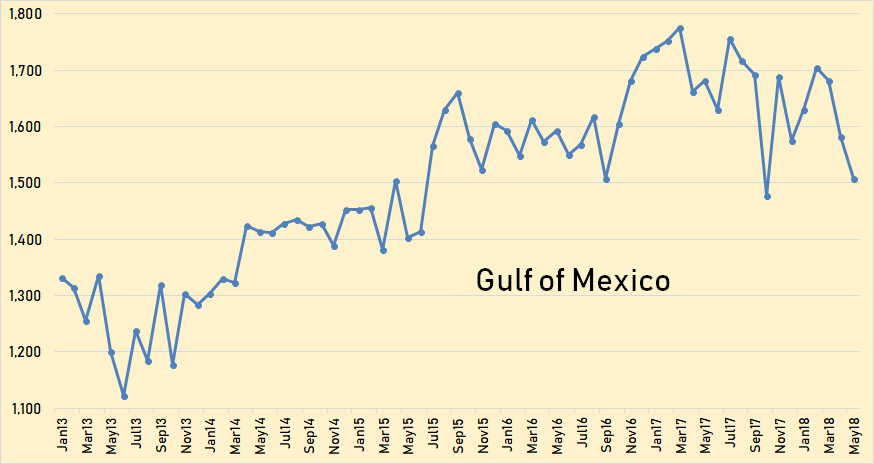
Gulf of Mexico production was down 99,000 bpd in April and down another 75,000 bpd in May.
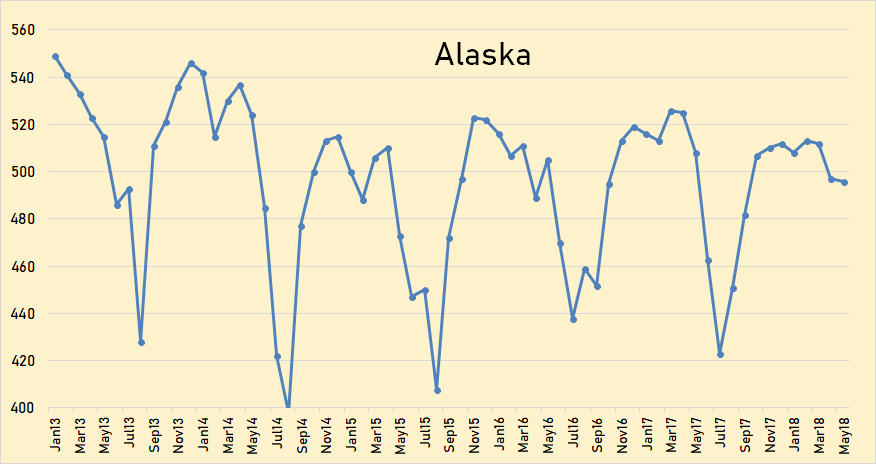
Alaska was down only 1,000 bpd in may but that was 12,000 bpd lower than last may. They are now entering the maintenance season. Expect huge drops in June and July.
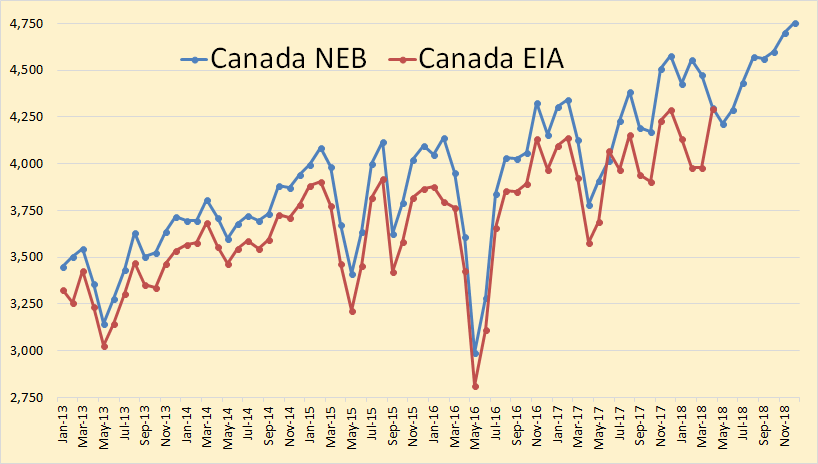
The EIA data in this chart is through April and the National Energy Board data is <b>estimated</b> through December 2018. The EIA data is usually lower than the NEB data but they both agree on April production.
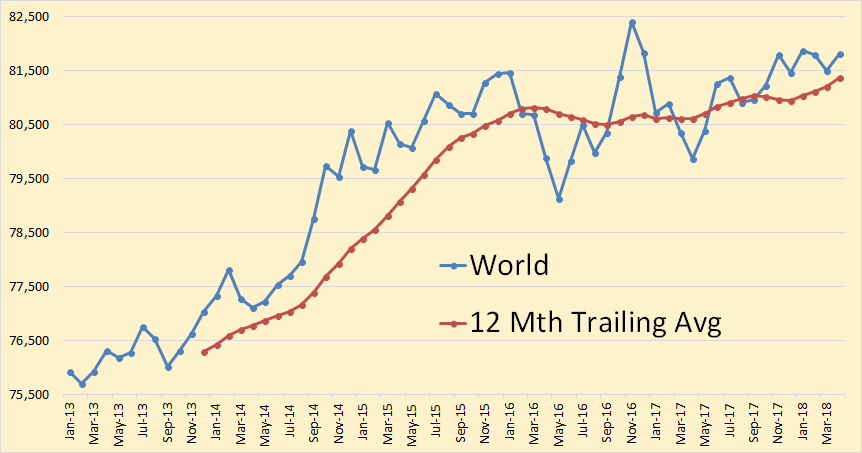
World crude oil production was up 326,000 bpd in <b>April.</b>
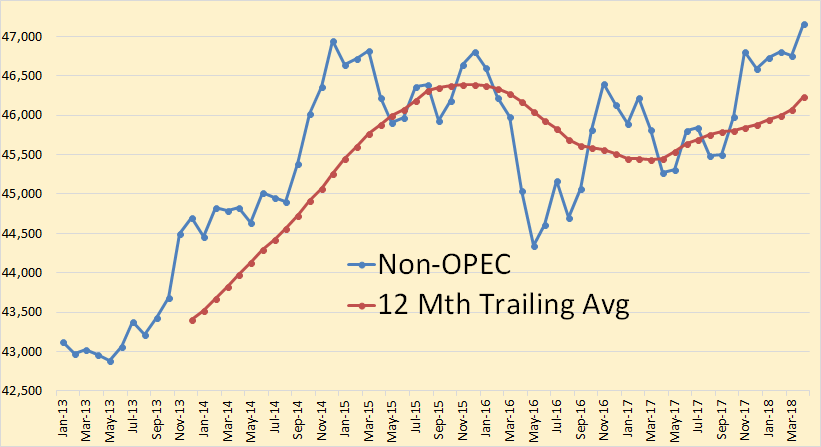
Non-OPEC production reached a new peak in April, up 405,000 bpd to 47,159,000 bpd. Most of that increase was Canada, up 317,000 and the U.K., up 111,000 bpd.
Here I am adding a few charts and comments from ExxonMobil’s 2018 Outlook for Energy: A View to 2040. Their text is in italics. Any bold in their text is mine.
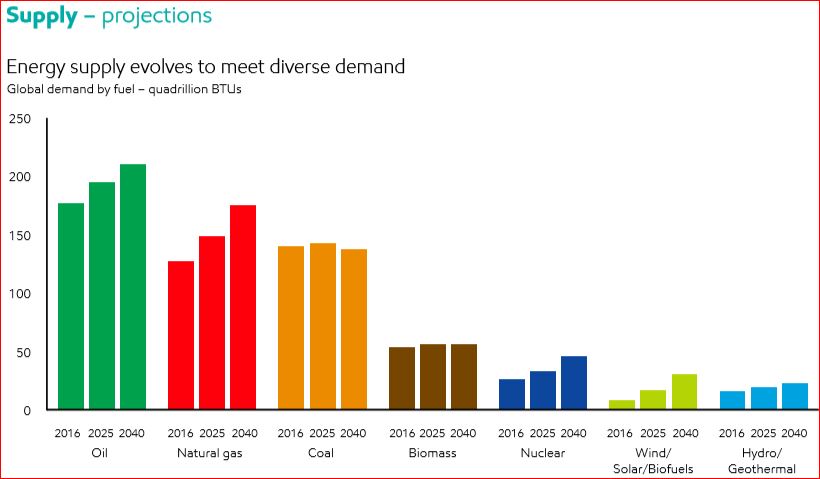
• Technology improvements lead to wind, solar and biofuels increasing, with a combined growth of about 5 percent per year
• Non-fossil fuels reach about 22 percent of total energy mix by 2040
• Oil continues to provide the largest share of the energy mix; essential for transportation and chemicals
• Natural gas demand rises the most, largely to help meet increasing needs for electricity and support increasing industrial demand
• Oil and natural gas continue to supply about 55 percent of the world’s energy needs through 2040
• Coal’s share falls as OECD countries and China turn to lower-emission fuels
• Nuclear demand grows 70 percent between 2016 and 2040, led by China
• Wind, solar and biofuels reach about 5 percent of global energy demand
They assume that supply will always evolve to meet demand.
This is what they say we will need in 2040 and will therefore be delivered by technology.
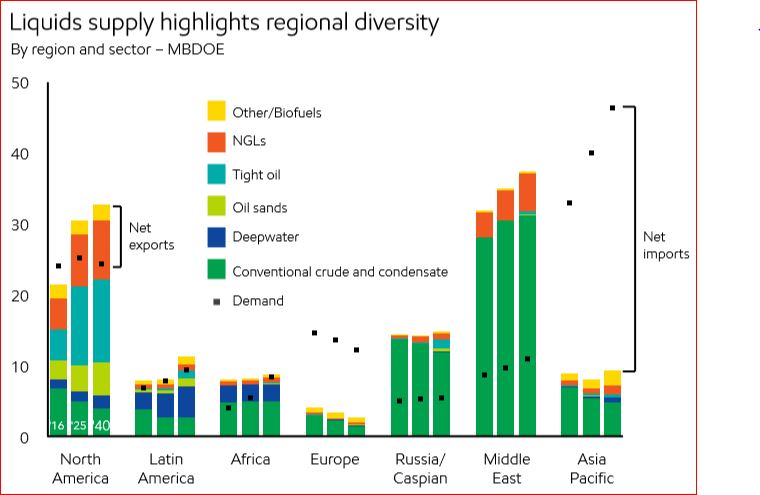
And here is where all that oil will come from. North America is the US and Canada. They count Mexico as part of Latin America. In 2040 they have total North American conventional production down to about 3.5 million barrels per day. They have at about 12 million bpd and oil sands at about 4.5 million bpd as best as I can eyeball the chart.
They have almost all conventional oil coming from the Middle East and Russia/Caspian. Caspian is mostly Azerbaijan.
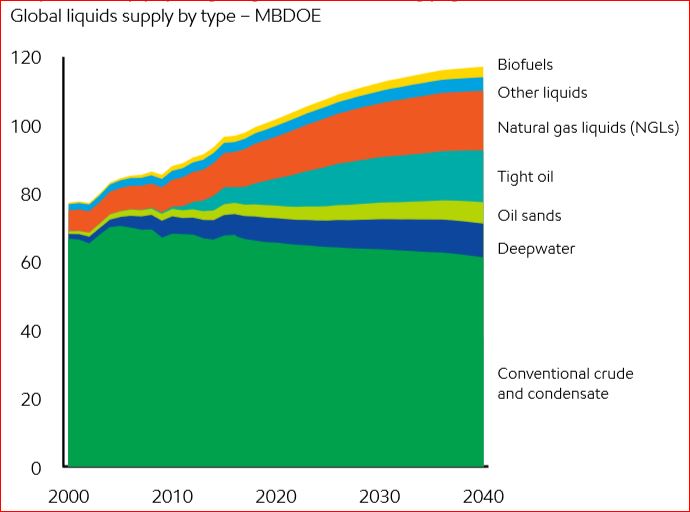
• Global liquids production rises by 20 percent to meet demand growth
• Technology innovations lead to growth in natural gas liquids, tight oil, deepwater, oil sands and biofuels
• Technology enables efficient production from conventional sources, which still account for more than 50 percent of production in 2040
• Most growth over the Outlook period is seen in tight oil and natural gas liquids, which reach nearly 30 percent of global liquids supply by 2040
• Continued investment is needed to mitigate decline and meet growing demand
• Liquids trade balances shift as supply and demand evolve
• North America swings to a net exporter as shale growth continues
• Latin America exports increase from deepwater, oil sands and tight oil supplies
• The Middle East and Russia/Caspian remain major oil exporters to 2040, and Africa shifts to an importer
• Europe remains a net oil importer, as demand and production both decline
• Asia Pacific imports increase to 80 percent of oil demand in 2040
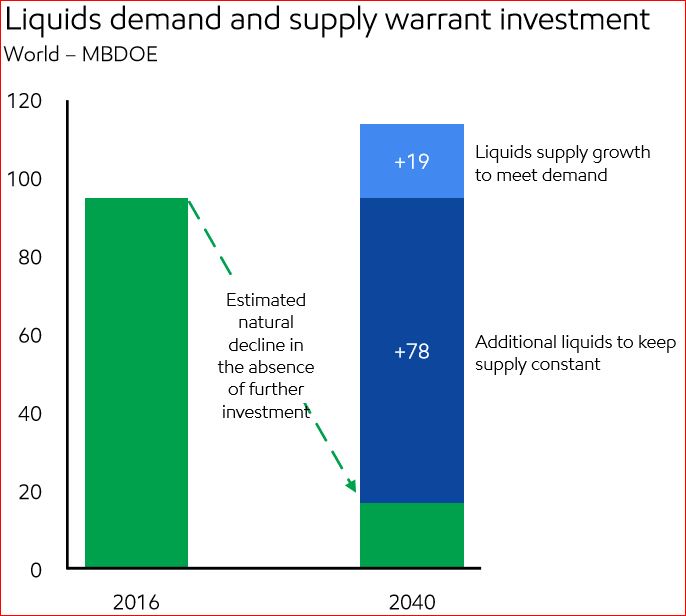
This chart is a little shocking. They have total liquids declining to about 18 million bpd by 2040 without investment. That means if everyone stopped drilling today, or in 2016, that would be the natural decline of what is online today. But to meet demand we will need 97 million barrels per day of new oil.
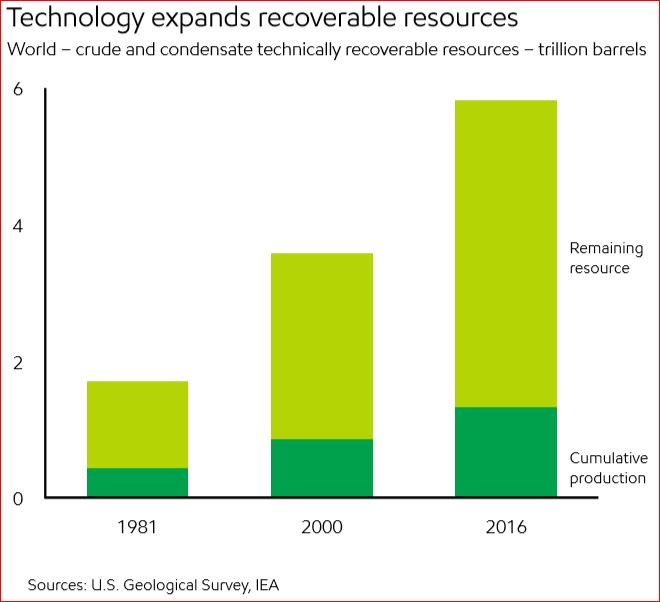
And this is what they say we have left, about 4.5 trillion barrels of remaining recoverable resources.
• Without further investment, liquids supply would decline steeply
• More than 80 percent of new liquids supply needed to offset natural decline
• Per the International Energy Agency, about $400 billion a year of upstream oil investment is needed from 2017 to 2040
• Global oil resources are abundant
• Oil resource estimates keep rising as technology improves
• Technology has added tight oil, deepwater and oil sands resources
• Less than one-quarter of global oil resources have been produced
• Remaining oil resources can provide about 150 years of supply at current demand
So not to worry. Peak oil will not be reached in your lifetime, or in the lifetime of your children, grandchildren or greatgrandchildren. Well, that is if these estimates are correct.
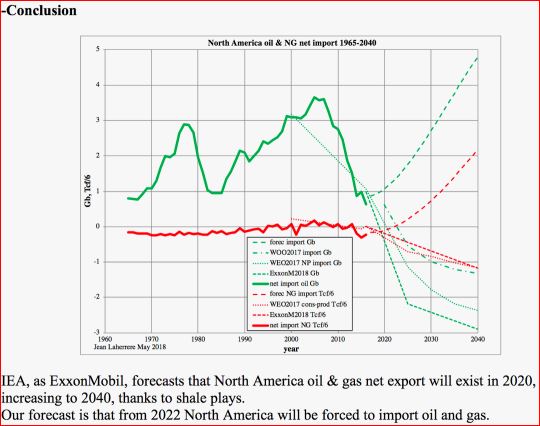
Jean Laherrere has a different outlook. He just posted me the below comments and chart. I could not get the chart to post in the comments section so I put it up here.
dear Ron
In your last good post on U.S. & World Oil Production and ExxonMobil OutlookYou mention the optimistic forecast by ExxonMobil on North America exportI sent you my last papers, which are on the site of ASPO France:
-Laherrere J.H. 2018 “Graphs on North America oil & gas net imports” ASPO France meeting 5 June 2018 https://aspofrance.files.wordpress.com/2018/06/namnetimportforecasts.pdf
-Laherrere J.H. 2018 “US, Canada & Mexico oil & gas production, consumption & net import” May https://aspofrance.files.wordpress.com/2018/05/uscame2018.pdf
-Laherrere J.H. 2018 “Forecasts for Canada oil and gas production” May https://aspofrance.files.wordpress.com/2018/05/canada2018.pdf
-Laherrere J.H. 2018 “Forecasts for US oil and gas production” March https://aspofrance.files.wordpress.com/2018/03/lahall19march.pdf
My conclusion is simple: for North America in 2040 the forecasts of EIA or ExxonMobil should change the sign of exports for oil and natural gas: instead of export it would be import.
205 responses to “U.S. & World Oil Production and ExxonMobil Outlook”
Almost speechless after seeing those ExxonMobil projections. Either they are drinking way too much whiskey at work, or I just don’t understand the nature of the world very well.
I suppose you could take their slide presentation and view it as a plea for more investor dollars to deploy.
The growth they project [chart called ‘Liquid supply highlights regional diversity’] in N.America oil production sure looks like wishful thinking- one to two more additional Texas production equivalents over the next twenty years, without net declines in current output.
Uhmmm…..OK.
wishful thinking -> magical thinking
Fixed
NAOM
I think the resource that they have the most of is Snake Oil.
Well, oil discoveries peaked in the 1960’s..And every year since 1984 oil consumption has exceeded discovery..
I hereby christen the Exxon report the Anti-Disruption Report! The Exxon Has it’s Head up it’s Ass (EHIHUIA), the Exxon Has it’s Head in the Sand (EHIHITS) report and BAU report, were my second, third and fourth choices. Incredible!
I’d love to watch Tony Seba read that report.
I would call it the Exxon “All Is Well Despite What Your Lying Eyes Tell You” report. Incredible optimism and fantasy combined in this report.
LOL! The only thing missing is the part where EXXON says their scientists have been able to prove beyond the shadow of any doubt that CO2 has no effect whatsoever on climate change.
Does the new technolgy mentioned include the monumental new carburator that improves your gas mileage by 100%? or the pill that turns water into gasoline?
Even in Europe cars could just use half of their input in mass and energy when driving around. That would border to magic, I guess.
Looks like we don’t have to worry about peak oil for a very long time. How accurate do you think these forecasts are? These make Dennis’s projections look downright pessimistic in comparison!
Dennis’ projections are slightly on the side of optimistic. This report is a fairy tale for investors. It has no real value.
Guym,
No Dennis’s estimates are perfect. 🙂
Keep in mind for “conventional” C+C my estimates are 2500 Gb (same as Jean Laherrere), 2800 Gb, and 3100 Gb (slightly more than the USGS estimate from 2000).
My extra heavy oil estimate is also the same as Jean Laherrere (500 Gb).
Perhaps my World LTO estimate is a bit optimistic, it is 100 Gb with 50 Gb from the US and 50 Gb from the rest of the World. This compares with a 600 Gb estimate by the EIA and perhaps 240 Gb by the USGS. Compared to authoritative estimates , my estimates are pretty conservative.
This is my standard World Oil shock model, chart below. I occasionally present scenarios that are indeed optimistic and use very high extraction rates for World conventional oil.
Most estimates are perfect. It’s how they compare to reality that is hard to align. ? But, I have no arguments with yours.
Yes, difficult to predict the future correctly, my guesses have very little chance of being correct, but they are likely to be closer to reality than the Exxon-Mobil Outlook, on that we might agree. My guesses may well be optimistic, we’ll know in 7 to 10 years.
Hello Dennis, as I know way less than you I chose a total simplification as an approach. In my graph there are only linear trends and I avoided absolute numbers though I put the conventional peak at 2005 (exactly as did Exxon-Mobil) and the unconventional peak somewhere around 2020 (no point of discussion, it could have been as well 2025):
Westtexasfanclub,
Seems pretty reasonable, except the “renewable oil” ( I am assuming this is biofuels). I am skeptical this can grow as quickly as shown in your model.
I ignore NGL, and biofuels and focus on crude plus condensate. I also include “Deepwater offshore” as “conventional oil” unlike Exxon, so by my definition of “conventional oil” the peak will be 2021 rather than 2005.
Hello Dennis, I’m pleased you liked my simplistic approach. “Renewable” is even further fetched than biofuels: I meant all renewable energy sources. I know that has nothing to do with oil except that earlier or later we’ll be forced to replace all fossile energy with renewable. So you might just ignore it within the context of this site.
For all renewable I would compare with all fossil fuel in exergy (roughly 36% of energy in exajoules).
I agree that with high fossil fuel prices renewable energy (mostly wind and solar) might grow pretty quickly also because it only needs to raplace about 50% of total fossil fuels it might be possible.
Doubt it will be easy, it is possible.
Hoo U gonna believe? The Exxon, or dood on the internet? /sarc
Whether global peak or not, regional supply/demand imbalances in Asia have already resulted in a militarization of the South China Sea and soon the North of the Indian Ocean, where China secures its oil trade routes.
This is because we had peak oil in China 2010-15
Peak oil in Asia Pacific
http://crudeoilpeak.info/peak-oil-in-asia-pacific-part-1
Australia, which is economically dependent on China, pays no attention to this change and its consequences
Update on Australian oil import vulnerability May 2018
http://crudeoilpeak.info/update-on-australian-oil-import-vulnerability-may-2018
Those are excellent articles Matt, and their importance cannot be over-emphasized.
North America swings to a net exporter as shale growth continues
Bad Science Fiction?
Yeah, bad. Good science fiction begins with something in science that has a legitimate argument.
Growth from *where* is the completely unstated element. The USA has exhausted finding frack plays. Eagle Ford and Bakken are currently peaked on this scale even in EIA logic. Monterey was a geologic bust. Offshore fields won’t be fracked, the logistics are crazy. So Permian and…???
Canada is already accounted for with tar sands. Also not frackable.
So is Exxon proposing fracking Mexico? Is that geologically viable? Last I saw the aggregate technically recoverable (haha) total there was believed to be 13 billion barrels. Some ways the Bakken has been counted get close to that. So what, 2 million BPD max if absolutely everything works out? Leaving the US with…10+ from tight oil?
Looking for some help here XOM.
Uinta, Paradox, Trenton Black River, Rogersville, Conasauga are only a few of the numerous formations in the US that are prospective for viable development.
The 16 and a half thousand foot TVD Eagles Ranch well from EOG in eastern LA’s Austin Chalk is part of the frenzied leasing that occurred there in recent months.
The Tuscaloosa Marine Shale being in the neighborhood bodes well for future production.
The stacked Powder River Basin will see an uptick in production now that Chesapeake is focusing more resources here.
Don’t know why in the world you didn’t even mention SCOOP/STACK – and the so called MERGE acreage – as those Sooners are absolutely kicking ass.
Cabot is drilling several wildcats in north central Ohio targeting the Trempealeau.
You are apt to be very surprised at how recent advances in both hardware and processes are encouraging smaller operators to get involved in fringier, shallower areas like the Clinton Sandstone and several Upper Devonian formations in northwest Pensylvania.
Operator in Colorado just said 5,00 foot laterals are now drilled in less than 2 days and can be drilled/frac’d for under $2 million.
Oil and gas exploration and production continues to rapidly evolve
Cowboyistan.
The time it takes to drill a lateral depends a lot on the geology and drilling practices. I suspect a two day 5000 ft lateral will have poor trajectory control and in the end saving a few days will lead to a poorer well. One key to have a really successful operation is to put a bit in a driller’s mouth, and tie the tool pusher to a bonus which depends in part on meeting well design parameters. This of course requires completion and production engineers and operating foremen who know what a pad layout and well is supposed to look like. I’m afraid many of them are still learning.
Fernando
If you check out some of the specs on the latest iterations of these rotary steerable systems, you may be impressed.
I imagine you are familiar with them in your past field work, but the improvements have greatly enhanced their effectiveness.
In the Niobrara (Colorado), many operators use so called monobore drilling with one run, spud to TD in the relatively shallow (6/7k’ depth), in a region well defined by decades of production.
Eclipse, in Ohio, has about a half dozen wells with laterals in the 18,500’to 20,000’+ range, drilled in one run in 11 to 13 day timeframe.
Total Measured Depth ranging from 27,500 to 28,500 or so.
For Appalachian Basin operators, it is now somewhat routine to drill a mile a day.
I would have to see the well results (directional survey, cuttings, sniffer, ROP, and logs) to tell you if the wells did or did not have good control. I’ve seen wells drilled so fast they went out of zone but didn’t figure it out until they had drilled 300-400 feet. In most cases it’s not worth it to sidetrack, so the well is steered back but the results just aren’t the same. Putting too much weight on bit to drill ultrafast is not sanitary. And I bet those Ohio wells are extended reach going under a water body, a city, a military base, or an airport. Otherwise they don’t make sense.
Fernando
My understanding regarding the control, at least from a couple of remarks from Bakken operators, is that a two foot deviation from optimal (both vertical and horizontal) over a 2 mile lateral is the new normal.
In regards to lengths of laterals, this will be a significant development going forward as all the operators tout the economic advantages of extended lengths.
Range just drilled 2 18,000 footers in the Marcellus.
The Haywood well from EQT is 17,400′ long, been online less than 6 months, and has already produced over 6.2 Bcf. (Energy equivalent over 1 million barrels earl).
EQT plans on a couple of dozen 17,000+ footers in 2018.
Long-term recovery would favor gas over oil at these distances.
Problem is formations arent drawn with straight edges. This means a well can go out of zone using the approved plan and they wouldnt know immediately, even if they have a gamma ray tool with surface readout very close to the bit. The problem as i see it is that drillers get paid for making hole. I worry about everything.
Regarding the extra long wells, i suggest you put oil soluble tracer pills in a couple of wells to see where the oil comes from. The data ive seen shows the toes don’t drain very well. And if the well has any kinks it will slug like crazy when its older. This is manageable but it has to be considered.
Lets just say that I would rather have a well drilled taking a few days extra than face the problems we see when they go too fast. Whats a spread costing in the US nowadays? $60 thousand a day?
There have been all sorts of tracers used for awhile now to pinpoint the sources the oil.
I recently read mention of some type of DNA analysis being considered, but I didn’t get into the article.
In regards to being out of zone, operators routinely tout the in zone percentage when boasting about drill speed.
Pretty common to see the mentioned figure being between 95 and 100 per cent in zone.
A prominent issue seems to the size and placement of natural fractures as that has big implications when fracturing takes place.
As for cost of rigs, there is scant mention of specifics, but the $17,000 to $25,000 per day figures were thrown about over recent years depending on many factors such as length of contract and type (size) of rig.
CNX is embarking on a significant venture in Central Pennsylvania with a multi year long program targeting the Deep Utica (12,000’+).
They are using a new, built for spec rig in attempts to keep overall drilling costs down.
Fracking Mexico: The Mexican pres just banned it. –
“Newly Elected President of Mexico to Ban Fracking
Mexico’s president-elect Andrés Manuel López Obrador said he will end the use of hydraulic fracturing, or fracking, once he enters office on Dec. 1.
“We will no longer use that method to extract petroleum,” the populist politician said Tuesday at a press conference, as quoted by the Associated Press.
The one thing we can be sure about leftist latinoamerican politicians is that they are either stupid, or corrupt, or would be tyrants…or all of the above.
Based on what I hear from Mexico, I would predict the Mexican oil industry and its economy are going down. This should lead to increased Mexican energy imports from the USA for several years, until it reaches the terminal stages we have seen in Venezuela and it becomes a failed nation.
The one thing we can be sure about leftist latinoamerican politicians is that they are either stupid, or corrupt, or would be tyrants…or all of the above.
Yeah Riiight!
And the one thing we can be sure about right wing authoritarian latinoamerican politicians is that they are brilliant, honest, with only the best interests of the people in mind…probably all of the above.
Same shit! Different flies!
Based on what I hear from Mexico, I would predict the Mexican oil industry and its economy are going down
The Mexican oil industry and its economy have already been going down for a long time and every oil industry and economy that still depends on oil will be doing the same, so that isn’t exactly news.
mexico has long been one of the most corrupt in the world – a total subject of US dominance… and controlled by the right.
amlo came in on ending corruption – hardly a communist idea since trump ran on the same thing. big difference is that AMLO has been in the fight for decades and has credibility. hopefully he can actually accomplish it before getting shot.
AMLO is a neoMarxist. They have all sorts of bright ideas which usually turn out to be harmful. The experience with these neoMarxist Castro allies has been grim. They are incredibly corrupt with very few exceptions. Banning fracking is a stupid decision.
AMLO also believes he’s going to spend billions of dollars to build a Pemex state owned refinery. I’ve read what his “experts” say, and they are a bunch of incompetents. They can’t even figure out that a refinery takes time to do engineering, then they have to get financing, and construction takes several years. And their cost estimates are childish.
So, no, I’m not about to give another Castro ally a break. He’s going to cause a flood of Mexicans running towards the USA in the future. So that wall is going to have to be real tall.
But folks: they declared 2005 the year of conventional peak! They can’t be wrong with the rest!!!
US Suddenly Buys More Ecuadorian Oil: Is It Also Buying Assange’s Arrest?
This chart compares the monthly and weekly EIA oil production numbers. Comparing the May monthly production value of 10,442 kb/d with the mid-May weekly number of 10,725, the weekly over production is 283 k/d. Does this imply that the monthly numbers are better reflecting the reduced capacity to ship oil out of the Permian that the press is reporting. Today’s drop in weekly production is due to a 68 kb/d drop in Alaska production to 331 kb/d. This appears to be a new low. It will be interesting to see if production can get above 500 kb/d when well maintenance is completed. The last seven weekly reports have reported production to be slightly below 500 kb/d.
That, in my opinion, would be the correct assessment. Oil is having trouble getting out of the Permian. One part of EIA is assuming that the oil will find a way out by rail or truck, taking a hit on the price just to get it produced. That would probably be a good guess if they had that capability. It’s not there now. I read that one railway is trying to gear up with 100k barrel of tanker capacity, but they are still running into competition for other rail use. It can’t get out, so they are shutting in, and delaying completions. Half of the wells being drilled are from smaller producers, who neither have established contracts with the pipelines, nor derivatives to cover themselves. As the bigger players use up their pipeline contracts, the smaller operators will be forced off the pipeline and have to shut in. Halliburton has already reduced their second half earning estimates to allow for less completions. Wells will still be drilled, and completions will still happen to overcome decline rates. Activity will not stop. My guess is that US production will average 10,600k to 10,700k barrels a day until late 2019, or early 2020. Unless prices go up substantially, then we may get another 200k from the Eagle Ford and Bakken second half of 2019. More from the Permian if the pipelines are completed. There are multiple pipelines being built, and I read one article that questioned if there would be enough building capacity to support all of them, so late 2019 is questionable to me. EIA’s most recent STEO projection of US production to the end of 2019 is over a million barrels a day over stated.
Bloomberg article the other day mentioned the immanent deployment of several micro LNG plants in the Permian to help alleviate surplus natgas situation.
Without identifying it as LNGo, article mentioned upwards of 15 micro plants from Siemens being deployed by the end of next year.
Coincident with these developments, frac’ing companies are increasing use of GE TM2500 power plants (natgas fueled) to lower costs and utilize existing field gas.
The shift to natgas may be greatly accelerated by Permian development.
Coffeguyzz,
That doesn’t help to move the oil to either export terminals or refineries.
In the Permian, it is the oil that pays for the well, the natural gas is barely profitable (or may even lose money at current wellhead prices). That’s why most producers flare as much natural gas as they are allowed to in West Texas, it is a money losing proposition.
I once read a story about a driller talking to a friend who asked him:
How did it go with that new well you just drilled? The reply was:
Well, there is good news and bad news. The bad news is we didn’t find any oil. The good news is we didn’t find any gas either.
DC/RP
The gas capture won’t help the oil transport situation, but it may assist in the gas ‘over production’ problem if regulators call for curtailment until natgas is able to be sold.
The fact that oil continues to hold such dominant sway over its neglected cousin, natgas, is in the early stages of transformation as more and more hardware is being developed to more effectively handle/process the gas.
These efforts span massive LNG train production (staring to see the implementation of .25 to 2 mtpa modulars being deployed), to truck delivered containers like those at the Jacksonville, FL LNG bunkering hub.
If this LNGo stuff is shown to work well (first Dresser, then Siemens have hit considerable headwinds these past few years), the broader use of natgas is apt to spread widely as it could solve a whole array of problems in emerging plays throughout the country.
I see several people blasting the ExxonMobil report.
One thing that shocks the crap out of me is that they estimate all oil wells producing worldwide in 2016 will only produce 18 million bopd in 2040. Unlike future demand, which may be difficult to predict, I will bet ExxonMobil has some pretty good data on existing wells, especially given the data that can now be gotten by mere individuals like me from IHS Energy, DrillingInfo, Shaleprofile and other websites.
The amount of money that will need to be spent on new wells worldwide is mind boggling, if this ExxonMobil is correct about future production from existing wells. Under any reasonable future supply/demand scenario, the CAPEX required will be enormous.
It must be that shale is not the only “high decline” high volume production worldwide. From George Kaplan’s posts, and some others, it appears to me that much of the deepwater production is also high decline?
The Exxon forecast implies about 7-8 % exponential decline per year. It’s a reasonable figure.
Thanks Fernando,
An assumption that oil investment will cease (which is the assumption underlying a 7.5% annual decline in oil output) is not a very good assumption.
Denis, we usually do that. We assume zero investment, assume what we do goes to OPEX. Then we layer in the investment wedges. These can include sidetracks to a different bottom hole location, installing waterfloods, EOR, artificial lift systems, developing marginal fields, drilling areas we know have oil but have been neglected due to low prices, drilling in Arctic (for example the Canadian Beaufort discoveries, or giant gas fields in the Kara Sea), and on and on. These efforts require thousands of manhours, and eventually they are turned into a PowerPoint slide presentation. After it’s over they go to the VIP cafeteria and eat salmon, and very little gets changed. I swear it.
Fernando,
All of those activities, EOR, artificial lift, marginal field development, Arctic development, etc require capital investment, so that does not seem the same as zero capital investment, which would be required for 7% World decline rates.
Such an assumption is not realistic before 2050 at the earliest.
Denis, as i mentioned, exxon culture is to put maintenance operations as opex, which others consider capex. The decline rate “without investment” can also include what some call “sustaining”, for example a compressor which replaces an existing compressor only to keep operating costs in line.
I didnt work for EM, but I have seen some of their work. Dont forget their strategic aim is to go for high return on capital employed (which is a very good decision).
Ok, I missed that EM has a strange definition of “capital” investment. Yes I agree high ROI is a good idea, but it is even better if you don’t fudge your numbers to accomplish it.
The amount of money that will need to be spent on new wells worldwide is mind boggling, if this ExxonMobil is correct about future production from existing wells. Under any reasonable future supply/demand scenario, the CAPEX required will be enormous.
Given that! Color me more than a tad skeptical that there is a snowball’s chance in hell of meeting a supposed demand of 97 million barrels per day of new oil…
Frankly I don’t don’t think that demand scenario is even close to realistic anyway, given the fact that, one, humanity needs to get off oil as of yesterday! And two, clean technology disruptions should start putting serious dents in demand for expensive dirty sources of energy.
Furthermore I don’t for a micro second believe that EXXON would be unaware of all of that. Whoever put that report together must have been smoking some really good shit! Either that, or they are practicing for their next gig as a writer for the Onion… Maybe it’s just good satire.
“Either that, or they are practicing for their next gig as a writer for the Onion”
or Donald Trump
NAOM
I wonder if this and the roll back of fuel standards are linked. It would need magical reserves for the prices of fuel to remain low and make high consumption vehicles viable in the long term. They can be sold at a lower cost with exaggerated claims of how little all that fuel will cost whereas the reality is that prices will rise and people will increasingly be out of pocket.
NAOM
Trump doesn’t understand this concept at all. He just sees an Obama regulation to get rid of.
We’ve seen how the vehicle market reacts to high gas prices before. Gas guzzler sales dive immediately. It’s not hard to predict that if gas prices rise and stay there that fuel efficiency is going to soar regardless of minimum MPG regulations.
I agree the future isn’t easy to predict, especially to 2040.
However, I think I have read here that 25% of worldwide oil produced is used for light passenger transport. So, we will need some huge breakthroughs to significantly decrease oil demand. Or a major financial event, which many here foresee, and which I don’t necessarily disagree with.
A lot will depend on population growth from now to 2040.
Would be interesting to know how much oil all wells worldwide that were producing in 1992, produced in 2016, to make a comparison of decline rates.
I am not going to get into a debate about future demand to 2040 to any great extent. I admit I don’t have a clue on that. I can see different scenarios being supportable.
The 97 million to 18 million decline in 24 years is one of the most important predictions I have seen on POB.
Yes, it comes from “hated” XOM, but I suspect on existing wells they have pretty good data.
Ground transport other than rail uses 38 million barrels oil per day energy equivalent. Most of that is light vehicles (about 2/3), the rest being trucks.
Considering that a barrel of oil can only make 34 gallons of ground transport fuel that makes 47 million barrels per day to make that ground transport fuel.
Marine transport uses about 12 percent of the total liquids fuel.
Conversion of transport to electric or other power can take a huge chunk out of “oil demand”. Right now the system is held captive, soon it will have much more choice of transport energy. How that plays out will be an interesting interplay of old tech versus new more efficient and cleaner tech.
The big problem is that other than being quieter,cheaper and cleaner than oil propelled vehicles, electric vehicles are just vehicles. Not like going from the horse to horseless carriage, where one got more speed, more comfort and lots more convenience. Plus, the pollution problem of horses was solved, or so they thought.
People are overly optimistic on clean energy.
The same exact thing could probably be said of dirty energy, no?!
Imagine when there are 9 billion plus people on the planet, maybe then, people will be hit upside the head by reality…
People are overly optimistic on clean energy.
People are overly optimistic on dirty energy.
Everybody happy?
I hope people are ready to like eating their lawn.
Jellyfish burgers aren’t too bad… 😉
I think if you read some of the articles originally posted to this website you’ll realize that the real argument behind peak oil is that this Earth can’t support 9 billion people. It’s going to collapse. Many will die. Starvation will be common. I didnt say that to indicate I believe fossil fuels will abound. I say it because we have put all our faith in “clean energy” and I don’t think it is going to come through for us like many think.
Clean energy will be there by 2029 at current CAGR’s of wind and solar. About 25TW.
I was reading up on the news of california wildfires and although this isn’t specifically about oil production it is about substitution of oil for renewables. Reading your statement just now, I imagined those trucks and planes as 100% EVs trying to haul around all that water, fire retardant, equipment and firefighters. seems challenging.
‘seems challenging’- Most of the industrial level things we take for granted will be challenging without cheap fossil fuel.
“People are overly optimistic on clean energy.”
And there are people who do not understand exponential functions.
Hint: There is a good chance that around 2025 30-50% of the new cars are EVs. This means that oil demand of transport will decrease afterwards.
Come back to the discussion when you realize electricity is not a source of energy.
You are right! Electricity is a very convenient form of energy but it is not a source of energy per se.
But then again hydrocarbons need to be combusted to produce heat energy, a rather inconvenient and dirty process.
It is now quickly becoming cheaper to produce electricity from sources such as the sun and the wind by means of PV technology and wind turbines than it is to jump through all the hoops and energy losses needed to produce it by extracting, refining and burning fossil fuels.
But, that in and of itself, still doesn’t solve the population problem!
“Come back to the discussion when you realize electricity is not a source of energy.”
Nonsensical argument. The combination of batteries + electrcicty can substitute for fossil fuels. When more than 40% of new cars are EVs we will see a reduction of fossil fuel demand, that can happen already around 2025.
Or do I get the feeling that you struggle with the basics, Evolv?
You try to fake intelligence with your contribution? Work harder.
Jean Laherrere just posted me a different outlook on US oil and gas. I could not get his chart to post here in the comments section so I put it in the main body of the post. It is right at the bottom of the post above.
Laherrere has a few remarkable comments that I’m sure are no surprise to anyone here:
The LTO production peaked in 2015 and its decline is assumed to be as sharp as its increase.
AEO2018 forecasts US production in 2040 for oil at 12 Mb/d, my forecast is 4 times less at 3 Mb/d, for gas at 40 Tcf, my forecast is half at 20 Tcf. It is not a small difference, but a huge one.
…based on the estimate of the ultimate of shale plays from the Hubbert linearization of past production and on the assumption that in the USL48 many cycles of past production and drilling were symmetrical [we believe] that the shale plays will also display symmetrical future production curves.
Boom, down.
Michael B,
LTO is one area where I think Jean Laherrere may not be correct. My estimate is that the US LTO peak will be about 2022 at about 7.2 Mb/d. Chart below give a high and low scenario, my best guess is between these two scenarios.
Projections on what will happen ten to thirty years out are not meaningless, but they are pretty diverse. What will happen in the next five years is much more important, and should be a lot easier to forecast more closely. However, even that is very diverse among projections. Unfortunately, most analysts concentrate on the super rosy EIA projections, with IEA and OPEC projections being close behind them, as they rely on EIA projections on what will happen in the US. As long as EIA continues their facade of high oil output, even as they are reporting in a different part that it is not coming close, prices will stagnate or go down. Hence, new increases don’t have much of a chance. Concentrating on the EIA weekly to determine oil supply is not only myopic, but stupid. The only time I get a better picture of what is really going on, is when Energy News posts the parts on world oil inventories.
Obama mileage standards in the US will be revoked upcoming, report this morning. Additionally, California will no longer have the right to set its own standards different from the rest of the US. This will eliminate the need for companies to have two sets of car production lines.
People have not embraced smaller cars or hybrids. This is reality. Not evil by the Administration. Not evil by the car companies. Not evil by Big Oil. The people buy what they buy. The standards were going to result in showrooms filled with small cars people didn’t buy because the companies had to hit average mileage standards in their production line that could only be hit by producing small cars no one would buy.
That goes away now. It’s a reasonable thing.
There’s a reasonable chance, probably more than 59% that this rollback will either be rolled back by the courts or will be tied up so long that the auto industry will force it’s end.
I might be wrong but I understand that the California exemption is law and cannot be overridden by executive order or EPA regulations. If that is true it will require Congress to change the law.
Not gonna happen.
“People have not embraced smaller cars or hybrids. This is reality. Not evil by the Administration. Not evil by the car companies. Not evil by Big Oil. The people buy what they buy. The standards were going to result in showrooms filled with small cars people didn’t buy because the companies had to hit average mileage standards in their production line that could only be hit by producing small cars no one would buy.”
You got it!
https://www.ratchetandwrench.com/articles/5840-shift-to-light-truck-sales-projected-to-continue
“Light truck industry sales increased 4.4 percent in 2017, while passenger car sales declined 11.2 percent. Light truck sales represented 65 percent of the U.S. market in 2017, up from 61 percent a year prior.”
FWIW: The best option is to improve passenger rail service so more people use trains for commuting as well as regional travel. In some instances, flying takes longer than rail if you include the time it takes to get to the airport (stuck in traffic), and spending up to an hour in security checkpoints. Not to mention the semi-strip searches and radiation exposure of security machines.
Reminder re Exxon data above.
They spent billions on XTO. The charts emphasize NGLs. XTO’s history is gas fracking, which NGLs pay for. Someone involved in the acquisition who can influence the charts would make them look just like that.
Their crude and condensate projections don’t look all that absurd.
Global consumption growth is what it is. It’s not going to change. Hard to see how Russia is not medium/long term victorious.
“Hard to see how Russia is not medium/long term victorious”
Yep. They are have huge customer bases to the east and west who are going to be very hungry for their fossils.
It has gotten very interesting since I’ve re-acquainted myself with the peak oil scene, having been out of the loop for about ten years.
No one will believe forecasts anymore, given the errors ten years ago. To be fair, non-peak oilers didn’t predict the tight oil boom, either.
The reprieve the US got from the Bakken, Permian, etc. has gone up in smoke, completely pissed away. Here’s the mileage standards death rattle Watcher alludes to above: http://www.theledger.com/news/20180802/trump-team-wants-to-roll-back-obama-era-gas-mileage-standards-revoke-states-authority-to-set-own-requirements Bye, bye USA.
What a tragedy is brewing ahead!
Today, the "predictions" of the "experts" are still completely odds with each other. Therefore, this lay observer plans to keep his big mouth shut as the symmetrical decline in the tight plays exerts itself.
Looking at the Exxon projections of N.American production changes from 2016 to 2025, they have the combo of NGL’s and Tight Oil increasing from approx 8 Mill Barrels/Day Oil Equivalent all the way up to 17 MBDOE.
That extra 9 MBDOE is equal to what, almost level Saudi output?
Thats on top of what was already being produced.
That seems pretty optimistic to me. How do you get there, other than on a magic carpet ride?
If they are indeed being genuine, there must a huge escalation in extraction rate assumed, right?
Are they sitting on top of some miraculous technological breakthrough in extraction capability?
Can you triple frack?, and micro frack? Maybe reverse backhand frack?
Seriously, how else do you arrive at these kind of numbers?
A suit from Continental, Jack Stark, just said Continental’s new Bakken wells are recovering from 15 to 20 per cent of OOIP.
That is a stunning percentage that has enormous ramifications, not the least of which is the potentially vast expansion of economically viable acreage.
60 to 80 stage completions with perf clusters as close as 15 feet apart are enabling extensive rubbilzation of the rock as diverters play a significant role in the placement and spread of the proppant.
As per Core Labs former CEO, ten times the area of the Stimulated Reservoir Volume was left unpropped prior to the introduction of micro proppants.
Now, apparently, these hydrocarbon-rich sources are being unleashed.
Coffee,
Can you link to a source on Stark’s OOIP recovery factor?
New hardware, compounding my meager computer skills prevents me from posting the little blue letters.
But, presentation from Stark at recent Williston Basin Petroleum Conference (2018), titled “The Best Play Gets Better” contains the info.
As it was presented in slide fashion, I would think it will also be included in the upcoming quarterly presentation.
The May 2018 Continental Investor Presentation suggests a 2018 new well EUR of 880 kbo, that is nonsense pure and simple.
A great example of investor presentation hype.
The average well might have an EUR of 400 kbo at most
First, RF is EUR/OOIP. OOIP is purely an estimate that cannot be verified or audited. You want 20% RF? Just reduce your OOIP estimate for a given EUR estimate. Presto, 20%.
Or project EUR forward 20 yrs and claim it flows enough to get the 20% RF number even with a larger OOIP.
This is a largely meaningless quote — and there have been other RF claims in the Bakken higher than 30%, also unsupported. The guy with the 30% number will sneer at Continental.
Recovery factor for heterogeneous rocks can be a slippery figure. I have worked with companies which preferred to zero out OOIP they felt would not be draining appreciably, this reduced OOIP they said would be tapped by a well but increased the recovery factor.
We also have to factor in the fact that very tight rocks (and very viscous oils) can’t be modeled with the standard fractional flow equations. To complicate matters some of these operators mix NGL with crude, or even report reserves as BOE, which of course confuses would be investors. I would expect recovery factor to be less than 6%. The tricky part is to define 6% of what.
Thanks Fernando,
Often times these investor presentations are not very accurate, your comment confirms other analyses I have seen that suggest 3 to 6% recovery from the best (mean) estimate of OOIP. For the Bakken/Three Forks the OOIP is 300 to 500 Gb, with best guess ay 400 Gb. If we take a 4.5% estimate for RF, that would suggest about 18 Gb of TRR, the USGS estimate is about 14 Gb for total Bakken/Three Forks TRR (11 Gb for North Dakota only). If the 400 Gb OOIP is the best estimate, this implies a 3.5% RF estimate by the USGS (or let’s say 3 to 4% as two decimal places implies a false precision).
The 2015 article from Kathy Neset “Myths of the Bakken – Bismarck Tribune – contains her comment that 7% of the OOIP was then then being recovered.
Me. Neset is arguably amongst the most knowledgeable people around in this field.
(That short article, btw, is a good historical, operational primer on Bakken development).
The use of diverters, both far field and near wellbore, was just getting underway at the time of that article’s publication, so it should be reasonable to expect recovery has increased significantly since then.
Regarding OOIP estimates, vast resources continue to be applied to this figure with differing projections put forth.
As is the case in most of these matters, people will choose to believe what they choose to believe.
Coffeeguyzz,
Perhaps in the sweet spots 7% of OOIP is being recovered, this will not be the case for the entire play.
If you believe that all parts of the LTO plays will have uniform new well EUR, you are likely to be incorrect. Perhaps experts could enlighten you, most petroleum engineers and geoscientists that I have read, have suggested recovery factor will vary quite a bit.
In an earlier comment you mentioned production being “pulled forward” in time. Petroleum engineers that I have communicated with have suggested that the increased number of frac stages and higher levels of proppant do little to increase overall EUR per foot of lateral, but trade high initial output for higher decline rates and shorter well life. So all the fancy technology might increase profitability marginally, but does little to increase recovery factor or overall technically recoverable resources.
The difference between 5 and 6% can be the tail. And the tail depends on the fluid rates and decline rate after the fifth year. I’ve seen estimates which assumed a high rate and a low decline, this of course yields a fine remaining reserve. The economic limit (OPEX and oil and gas prices also influence how this comes out. I’ve consulted for people who assume OPEX per barrel is constant, that water doesn’t exist, that wells don’t get holes in the tubing, and all sorts of issues which yield funky figures. I would have to read serious work by Kathy Neset to see if she knows what she’s talking about. Never met her.
Fernando
Ms. Neset started mud logging in North Dakota back in the ’70s.
Her consulting firm based out of the Bakken has over a hundred employees.
She is a pretty widely acknowledged expert in that area.
Regarding the tail production … Former CEO from Core Labs made an intriguing observation.
He said that microproppant stimulation would not only vastly increase the amount of the Stimulated Reservoir Volume, the complex fissures would be extremely tiny and provide a lengthy, constrained trip to the wellbore for the oil.
These conditions, according to him, would actually prolong diminished amounts of oil production from these wells.
It’s perplexing. The only way the math works is multiple large new resources. Very large. Bakken and Eagle Ford would be lucky to maintain their production levels even with very aggressive drilling. Too much decline from the existing production to offset.
Besides the Permian, the remaining big *oil* one is believed to be the Tuscaloosa Marine Shale. But extraction of that is both costly and mostly theoretical. “Speculative” is a good word.
https://www.theadvocate.com/acadiana/news/business/article_60a78ae8-fc80-11e7-af86-470d77640802.html
As I posted up thread, the big one was supposed to be Monterey but that was cut from almost 14 billion barrels to 600 million and scrapped. Maybe Exxon is assuming technology solves this?
https://www.reuters.com/article/eia-monterey-shale/update-2-u-s-eia-cuts-recoverable-monterey-shale-oil-estimate-by-96-pct-idUSL1N0O713N20140521
I cannot speak for Exxon’s basis for their conclusions, but as a long time observer of this Shale Revolution, a few items may play a role.
The cost of drilling and completing has come WAY down.
The speed and precise targeting of hydrocarbon-rich areas is vastly improved.
The “lessons learned” continues apace. This, countering the exaggerated “sweet spots being drilled up” trope, is enabling operators to more effectively develop established areas.
The completion process has greatly improved. Whether EURs increase or simply “pull production forward”, financial returns are greatly accelerated.
There continues to be efforts made in the EOR realm. To think a very high percentage of oil will simply be left behind was never a realistic stance.
Should you spend a little time checking out some of the shale formations in the US, you may be surprised at how a vast a potential/theoretical supply may exist.
The depth, heterogeneity, remoteness (infrastructure), ignorance and uncertainty regarding these formations have all played a large role in guys reluctant to spend tens of millions of bucks to ‘find out.
The basic foundation has now been laid.
External circumstances will influence the manner of future development.
If these extraction advances pan out, I assume it will become more likely that success will also come at places like Vaca Muerta and Bazhenov.
Yes, the political and social components – along with the ever present economics – are some of the “external circumstances” to which I referred.
In a few weeks, Cuadrlla is on track to frac their 2 unconventional wells in the UK.
Should the company’s bullish statements prove to be vindicated, it may provide an inflection point for British acceptance of a new, and heretofore contentious, source of natgas … all the more so as the cold of winter looms.
The Bazenhov may give the ever innovative Rooskies an opportunity to overcome high clay content shale formations via successful alternatives to current practice (aka waterless frac’ing).
Just a vast amount of global hydrocarbons have been brought into the potentially recoverable status these past few years.
Most likely providing a cushion to the inevitable embrace of non carbon sources of energy.
Coffeeguyzz,
Perhaps a lot of natural Gas, for crude oil perhaps 30 to 50 Gb of LTO, the extra heavy oil has been known about for a long time so is not new. This may seem “vast” but compared to a 3400 Gb URR for crude plus condensate (the 6000 Gb IEA estimate includes Green River Shale which is unlikely to ever be viable) this vast new oil is about 1.5% of a reasonable estimate for URR.
Dennis
Your comment may be one of the few in which we are in substantial agreement.
The increased recovery potential for natgas dwarfs that of oil.
This reality, in fact, is what spurred Mark Papa to pivot EOG away from gas-focused exploration/production in the 2008/2010 timeframe, to target oil. (Chesapeake is in this same process at the moment).
EOG leased hundreds of thousands of acreage in the then little recognized Eagle Ford prior to drilling a single production well.
Historical fact.
The physical challenges of dealing with a gas versus a liquid are rapidly being addressed by myriad manufacturers across a broad spectrum of industries.
As unconventional production becomes the new normal, extracting gas – as opposed to a viscous fluid – from 1 to 4 mile long tubes 2 miles underground will continue to greatly favor natgas production/availabilty/COST.
Vaca Muerta seems to be mostly a gas play. Purely guessing, I don’t think it will reach over 400,000 BOPD. This is in part due to government and operator policy. However, I would expect Vaca Muerta gas to displace Bolivian imports. And if they winter time storage fields they nay not need Bolivias gas at all for a couple of decades.
Coffee,
I just received an AFE to participate in 3 horizontal Wolfcamp wells in Eddy County, New Mexico. I wont mention the operator’s name. But its headquarters is on the west coast.
Each well is estimated to cost $12 million dollars!
Where do you get your information that well costs have come WAY down?
How naive can you possible be?
I readily acknowledge both my ignorance in these matters and susceptibility to trust rather than doubt information coming from others.
This trust is then usually subject to rigorous cross checking, focusing upon the presenter’s knowledge, demonstrated integrity- or lack thereof – questionable motives, current supporting/refuting data, oppositional viewpoints, etc.
The fact that your stated Eddy county Wolfcamp wells are said to cost $12 million per does not surprise me in the least.
The minimal time I spend following Permian developments provides me with some perspective at how “young” unconventional development is in that part of the country.
To compare Eddy county efforts with, say, Susquehanna county, Weld, or McKenzie counties might give an observer a view of what to expect in the coming years in New Mexico.
When the optimal landing depth has been identified, when the 50 to 80 stages have been able to be precisely placed with appropriate water and sand supplies piped in or sourced economically, when the access roads and pads are long paid for, when the produced water has been effectively addressed, when the experienced crews – both drillers and frac – are into their 5th or 8th year of area operations, it would not surprise me in the least to see future Eddy county well cost decrease … just as it has markedly done so in areas where unconventional development is entering its second decade.
Hey, John; thanks for sending me those AFE’s. They appear to be in line with other Wolfcamp AFE’s in that (very old and very mature) part of the Delaware that I’ve seen and in other basins, including the Bakken. Is your integrity being questioned up hole, I can’t tell? I sure hope not.
Well costs are NOT going down, they are going up. Well productivity is hitting the ceiling in all basins in America and ensuing decline rates are falling thru the floor. Things have gotten NO better in any of America’s shale basins; debt, interest rates and overproduction is causing severe bottlenecks and net oil and gas prices are dropping. In spite of lies about doing better for shareholders shale companies in America are not delivering the goods: https://www.msn.com/en-us/finance/markets/shale-reality-check-hits-as-oil-results-underwhelm-investors/ar-BBLndtP
Please see oilystuffblog from last week: Enno Peters drove over from Houston to my dig rig location; he is a wonderful fella. We spent several hours together; I showed him the real oilfield and he showed me his new shaleprofile.com portals that are amazing. Nobody in their right mind thinking about investing in the shale business, big or little, upstream or down, should be without Enno’s new stuff. The shale industry isn’t going to like it, but its awesome.
Take care, John. Your AFE’s and their estimated well costs are very real and perfectly legitimate. No other company in the country can do it better than those guys. And it probably still won’t work.
Mike,
The USGS estimated LTO of about a 24 Gb TRR for the midland section of the Wolfcamp shale in the Permian (my guess is that you expect the actual amount of LTO that will be produced will be less than this TRR estimate). What would you expect the Delaware basin area’s Wolfcamp LTO TRR might be?
Dennis, I believe that every barrel of unconventional oil in America not already behind pipe is now totally dependent on available, low interest capital for extraction in the future. Not price, not demand, but how willing Americans are to go deeper in debt and allow a few CEO’s, lenders and royalty owners to skim off the top, all for the sake of cheaper gasoline.
Ask Coffee, he always seems to have his hand on the “pulse” of the American shale industry and I’ll give him this: profits, or lack thereof, debt, water, market issues, public sentiment, debt (did I already mention that?), fabricated reserves…none of that makes a rats ass to him. He is, in fact, the typical American; oblivious to facts, always dependent and totally reliant on the miracle of technology, new gadgets, the internet…and politics to get us all into a better place. He can tell you exactly what you need to know.
Hi Mike,
So let’s assume a prime interest rate of 4% and an oil price of $80/b in 2017$, would you say the TRR for the Wolfcamp formation in the Delaware basin would be 1 Gb? I don’t think Coffeeguyzz knows much, but you know a lot about the oil industry.
Oil supply is likely to be short and oil prices are likely to rise, eventually this will improve profits in the shale sector.
https://www.spe.org/en/jpt/jpt-article-detail/?art=3452
Peak in the Permian could be only about a million barrels a day more than current, according to this analysis by Woods Mac. Each shale play has its quirks, and Wolcamp is pressure drops.
And as the Permian is temporally on hold, by the time it reaches its peak, world decline will march on. So, when will be peak, or is it here? Or, does it really matter, as we can’t keep up with demand, already?
Ecana’s cubes (or Christmas trees) have missed their mark as of first quarter production. Too many wells, too close, my guess.
GUYM, things sure have changed. If Clarke is right, Permian well spacing is too wide. They are better off going a bit tighter and skipping the infills. This will give them a really nice pad layout.
Guym,
Great piece thanks. The estimates range from 4 to 5.5 Mb/d at peak with the mid case about 5 Mb/d in 2025. Seems pretty reasonable.
The unwinding of QE isn’t being factored into anybody’s projections. $600B scheduled to roll off FED’s balance sheet in 2019. US Treasury must issue new debt to rollover these maturing bonds. FED isn’t buying so that means the money will have to come from somewhere else. Huge sucking sound will be heard across the shale patch and a lot of other places as money leaves. US is also running trillion dollar a year deficits that will also have to find another buyer besides the FED. Everything that should have matter in regards to shale oil profitability, debt and so on that hasn’t mattered will suddenly matter once again.
Mike. Great to see Enno came by your place for a visit!!
For what it’s worth, here are the US Weekly Supply Estimates. Things appear to have been flat for the last eight weeks. Why?
US Weekly Supply Estimates
They started estimating lower US with a 100 increment. I guess they figure they can’t go up any more, as to May, actual monthly reports are 300k under their weeklies at the time. Actual is probably pretty close to 10,500 to 10,600k bpd now (or 300k to 400k under their silly estimates), so I guess they will wait until actual catches up. May wait about a year.
They were aware of the pipeline constraints, but chose to estimate that they would continue to produce, accepting the discounts. They are STILL following this expectation according to STEO and DPR reports. Latest expectation was for over a 100k increase in August that can’t possibly happen. Someone did not take into consideration, that without pipelines, that there was insufficient rail and trucking capability. They began to shut in and defer completions, which was not what EIA expected. Halliburton has taken a deduct from expected earnings the second half, because of the expected decrease in completions. The Permian is effectively choked until new pipelines are completed.
Some are starting to notice.
https://oilprice.com/Energy/Crude-Oil/The-US-Oil-Production-Mirage.amp.html
Brazil Crude Oil & Condensates Production (without NGLs)
ANP, June: 2,590 kb/day, down -17 kb/day month/month
(ANP, 2017 average 2,622 kb/day)
Chart: https://pbs.twimg.com/media/Djn-D8dWsAEcqgE.jpg
Pretty much what George was predicting.
Now if I could just get as lucky with today’s card at Goodwood …
Goodwood is a UK horse race?
It’s a race course (considered quite posh), also used to have car racing there.
“Continued investment is needed to mitigate decline and meet growing demand”
Every time I see a report saying continued investment is needed, I wonder who they think will put up the money. Investors and companies don’t usually throw money at projects out of the goodness of their hearts.
The only entities I can see funding investments just to keep the machine going might be nations.
Really, where do we see anyone in a capitalist system investing in order to mitigate decline? If anything, that decline might be a signal that it is time to bail.
I would invest to make a profit, this will allow me to buy a Cadillac, put Longhorns on the hood, and go to Amarillo to eat lobster at a fancy restaurant where they use cloth napkins.
Amarillo is a really sophisticated town. When I was young I used to go there on weekends to pick up girls from the nuclear bomb plant.
“Amarillo is a really sophisticated town”
“where they use cloth napkins”
“put Longhorns on the hood”
Really ?
We all live in some sort of Coen Bros movie, with all kinds of characters. Including ourselves.
But I must admit, I never did go pick up girls at the nuclear bomb plant.
I suppose they were energetic. and explosive at just the right moment.
Think those horns would fit on a Nissan Versa? Fondest memory I have about Amarillo, is getting a speeding ticket for going 74 in a 70 zone. The odor of the town is a little rank for even my messed up olfactory senses.
I know. But Amarillo smells better than Fort Stockton.
Spent a night in Amarillo———
Surreal, and was gone at daybreak.
Amarillo by morning, up from San Antone. Everything that I got, is just what I got on. I ain’t got a dime, but what I got is mine. I ain’t rich, but Lord I’m free. Amarillo by morning, Amarillo’s where I’ll be.
The Canadian Pension Plan Investment Board just put up the 2 billion bucks to buy out Chesapeake’s Utica position.
This outfit formed Encino Acquisition for the express purpose of buying oil and gas assets in the US.
There is also an asston of private equity money buying up small companies and/or acreage all over the country.
These companies are big purchasers of the non core assets that the big players continue to sell off.
About the natural decline of what is online today, is it correct to say that natural decline would be 3.25% per year? (95 million bpd to 17 million bpd in 24 years = 78 : 24 = 3.25), or is there another way to calculate it? Thanks!
Use this secret formula:
17/95=0.1789
Take the natural log of .1789 = -1.72
Divide: -1.72 /24 years -> -0.072
-0.072 is the exponential decline factor. We can use a short cut and raise e to -.072 and get .931, which is a multiplier we can use to multiply a year’s production to get next year’s production (it’s not exact, but close enough for government work).
The cumulative oil production (area under the curve) is (95-17)X365 divided by 0.072. Or 395 billion barrels (check my math, I’m doing this while holding a glass of ice water).
There’s a tendency to state that decline is 7% in this case, which is close enough. A similar set of equations can be used to estimate decline versus cumulative, and for hyperbolic declines, which applies to horizontal fractured wells (as an approximation, the truth is that nobody really knows for sure what’s going on beyond say the first five years of well life).
As they are using average annual production then the yearly decline is 6.9% = 1-((17/95)^(1/24)), which is close to the exponential coefficient as they are both small: a = -LN(1-r).
thank you, Fernando and George, for the formula … I imagine that governments use 3.25% to minimize the decline and geologists use 6.9-7% because it corresponds to the mathematical reality
Geologists don’t know much about formulas. They use pencils and tons of rubber erasers to draw maps. When they finish their kids are forced to use color pencils to show where’s the oil. Engineers do the math and keep geologists from straying too far from reality.
Geophysicists know mathematics as well or better than petroleum engineers. They may know less economics.
Russian C+C increased by 148,000 barrels per day in July to 11,169,000 bpd. They were up 93,000 bpd in June. That is according to the Russian Ministry of Energy.
Saudis and Russians have opened the taps full bore and the production cuts are all but gone at this point. There were widespread worries the price would collapse when this happened, but it has barely moved, and now this cushion has been used up. Could get interesting from here. Anyone out there with any more oil to spare?!
Imagino que Libia, Nigeria y Canadá.
Here is a clip from Baytex Energy regarding drilling cost in the Eagle Ford basin.
“Eagle Ford wells only getting better, but cost inflation setting in: Average IP30 rates in the quarter were ~25% higher than in 2017. However, BTE is also seeing ~15% y/y cost inflation with well costs having increased from ~US$4.7mm in 2017 to ~US$5.4mm currently (for normalized 5,500′ laterals). Since certain units are getting renegotiated, lateral lengths are expected to vary between 5,000′ and 8,000′ looking forward.”
Ovi,
That’s a very nice investor relations press release. Eagle Ford wells only getting better? Really? I see their LTO production is down 1,000 barrels per day in the first half of the year versus last year.
Also, Baytex energy continues to report negative free cash flow for the past two quarters even though they cut CAPEX spending by a large degree compared to 2014 and 2015.
I gather the BS has to fly or the market will start smelling the SHALE PONZI RAT.
steve
Steve
I took that comment from a TD Waterhouse report. I posted it primarily for the cost info related to drilling wells and how they are increasing. Not sure what “well cost means”, i.e. is fracking over and above that.
As a sidebar, BTE is proposing to merge with Raging river. This is TD’s analyst conclusion: “We upgraded BTE on the back of the proposed strategic combination with Raging River (RRX-T). This transaction is a potential game-changer for BTE, in our view. It materially strengthens the balance sheet (a key headwind since the 2014 Aurora acquisition, while simultaneously increasing its high netback light oil exposure). The pro forma entity currently trades at 4.2x 2019E EV/DACF vs. the peer average of 5.4x. We view this as compelling given a much improved fundamental outlook—it no longer has a balance sheet issue, in our view, and it also offers a potential catalyst in the development of its East Duvernay assets.”
A weekly measure for inventories (Total: crude + products)
Chart: https://pbs.twimg.com/media/DjtJ_5lWsAAxlmj.jpg
Products: https://pbs.twimg.com/media/DjtM4ulXsAALk97.jpg
Thanks EN! This is what is really happening in the world. As of now, the EIA weekly is not really reflective of what is happening in the rest of the world. About a 15 million barrel drop in one week. The US is a net importer, even though we have the largest production gain. Hang on to your hats, we are going down!!!
June’s oil production numbers
I was just having a quick look at the official crude oil production numbers for June (released so far). The title is in the order of the release date.
The total is up +0.48 million b/day month/month. But down -0.33 million b/day from the average in 2017
Chart https://pbs.twimg.com/media/DjtWvpjW0AActAp.jpg
The US is actually stalled, disregarding EIA expectations, and we are still dropping. Guess that accounts for all. Thanks EN. Looks like over a million barrel a day shortage with a “not with any accuracy” look. Another year of this, and some of these countries will be eyeballing their emergency reserves.
You need to do a guest post on world supply/demand/inventory. Nobody puts it together better.
The rest of the “news” is just noise. Full of sound and fury, and signifying nothing. (Sorry William).
Really looks like the global non-SPR storage glut that built up during the price war is masking problems with production.
Reminder that taking the EIA at its most optimistic for the USA was still producing a global 2020 peak in Dr. Li’s work. And it’s August 4 2018 according to the clock on my computer…
I will go you one better. I see the probability that peak oil, when it occurs, will be far below the projected demand for oil. That time period expired over a year ago. So, the occurrence of actual peak oil will be anticlimatic.
Of course, I have a great flair for stating the obvious.
Propoly,
Minqi Li does not account for reserve growth and mostly uses reserve estimates (with the exception of the US) or Hubbert linearization to estimate URR, this will tend to underestimate ultimately recoverable resources, 2025 is a better estimate for the World peak in C+C 0utput. Potentially there could be a plateau out to 2030, if output stops increasing in 2020, the higher output goes, the shorter the plateau and the steeper the decline rate will be.
Some of May’s official oil production numbers
The total is down -0.13 million b/day month/month. But up +0.27 million b/day from the average in 2017. Both Norway and UK were down for maintenance in May
Chart https://pbs.twimg.com/media/DjtlbwTX0AAczeL.jpg
Looking at weekly inventories, demand is still strong. But I think that current World supply/demand/inventories is too difficult to guess at. Especially without subscription data for floating inventories. And any production increase takes 2 to 6 weeks to arrive by tanker.
Various data providers are saying that OPEC’s production increased again in July. And Russia is back up to their prior highs.
Platts version: https://www.spglobal.com/platts/en/market-insights/latest-news/oil/080318-opec-july-crude-oil-output-surges-340000-bd-from-june-to-3266-mil-bd-platts-survey
That will slow down the drop, temporarily, until the sanctions kick in.
https://www.zerohedge.com/news/2018-08-03/china-rejects-us-request-halt-iran-crude-imports-more-tariff-pain-ahead
The Obama sanctions were poorly designed, allowing condensate to flow, and even then China could moderate its Iranian crude influx because . . . they didn’t need as much. And condensate is why Iran didn’t particularly have any funding issue with their nuclear development.
Times have changed. China needs a LOT more oil than during the Obama years. They can’t cooperate now. India will hide behind the Chinese precedent and continue their imports from Iran, too.
It really doesn’t have anything to do with policy. It’s just that India and China need a lot more oil now than they did 5 years ago. They don’t care who is president. Doesn’t matter. They have to have the oil.
Pressures are going to rise.
But agreeing to not increase, or slightly decrease will reduce. India’s larger refineries are already planning on cutting Iran imports.
https://oilprice.com/Energy/Energy-General/RBC-Oil-Market-Will-Tighten-Amid-Significant-Loss-Of-Iran-Crude.html
Although it is not a decrease in oil, everyone has about one million barrels a day in oil expected to be produced in the US to Dec 2019 that will probably not happen. Add to that one million from Iran from sanctions, and OPEC could not possibly keep up with it all. This will take months to become apparent. Iran will take the spotlight first.
oilprice.com is all about advertising revenue and that comes from higher oil price for US producers. They can largely be ignored.
Most particularly in the 1 mbpd estimate. Obama’s sanctions did NOT include condensate and Iran ships a lot. The 900ishK bpd reduction for them during the Obama sanctions was that small a number because of condensate. Word is the President’s new sanctions won’t leave that loophole.
The market doesn’t tighten. It is unserved. Someone doesn’t get orders filled.
China probably won’t cut Iran imports, but India may since the US is selling India a lot of US weapon systems. I suspect the US made a deal to provide India with a lot of discounted Military hardware in exchange to cut Iranian Oil imports.
If the Iranian currency continues to tank at the current rate, Iran is going have to act (either by negotiating with the US) or going to war.
“Iran’s Elite Guard Urges “Revolutionary Actions” To Halt Rial’s Death Spiral”
https://www.zerohedge.com/news/2018-07-31/irans-revolutionary-guard-urges-rouhani-take-revolutionary-actions-halt-rials-death
“Over the weekend the rial took a stunning 12.5% dive, falling from 98,000 IRR/USD on Saturday to 116,000 IRR/USD by the close of Sunday.”
Can always remove the currency from the Foreign Exchange. Pretty sure they are self sufficient in food and oil.
Baker Hughes rig count – USA oil -2, gas -3, GoM +1, Canada level (about like last year, but maybe also influenced by lack of pipeline capacity). It’s noticeable that horizontal and directional rigs have declined a lot more than total numbers the last two weeks and been replaced by vertical rigs, so actually drilling capacity is declining faster than the numbers suggest. Also noticeable is Marcellus numbers – the long term decline seems to have caught up with the trough from the price collapse.
Marcellus
Yeah, they are still running some verticals in the Permian. Less cost, less oil.
The great oil fields of the world were all discovered over 40 years ago.
https://oilprice.com/Energy/Energy-General/Here-Are-The-Worlds-Five-Most-Important-Oil-Fields.html
Ghawar was discovered in 1948 and held over 100 billion barrels of oil and was able to produce 5.7 million barrels a day with only 2,000 wells.
https://csegrecorder.com/articles/view/what-you-know-about-the-ghawar-oil-field-saudi-arabia
Obviously at some point Ghawar will be fully depleted, it has produced about 60 billion barrels so far.
Just think, in 2016, globally only 2.4 billion barrels were discovered.
https://www.iea.org/newsroom/news/2017/april/global-oil-discoveries-and-new-projects-fell-to-historic-lows-in-2016.html
These figures should be the writing on the wall to even the most optimistic oil business people.
Can’t produce what doesn’t exist *cough*Exxon C&C production replacement *cough.*
Output from E&Ps can be discounted as to reality, as can output from EIAs, IEAs, OPEC, and other NOCs.
$WTI Midland is at a $17 discount to $WTI Cushing which must mean excess crude oil production is being transported by truck
WTI Midland (Argus) vs. WTI Financial Futures Settlements
CME –> https://www.cmegroup.com/trading/energy/crude-oil/wts-argus-vs-wti-calendar-spread-swap-futures_quotes_settlements_futures.html
Chart: https://pbs.twimg.com/media/Djwf9gvWwAgtcJF.jpg
WTI MEH was just a couple of bucks under Brent over a month ago. So, Midland to MEH must be over $20 now. There was a huge discount between WTI Cushing and MEH, but it may have gone down substantially with Cushing inventory drops.
Shale Companies Sink On Investor Disappointment, Hedging Losses
https://www.rigzone.com/news/wire/shale_companies_sink_on_investor_disappointment_hedging_losses-01-aug-2018-156479-article/
The same idiots who predicted lower for longer, are now beating up E&Ps for hedging those lower for longer prices. They should have known better and not hedged? Now, they are showing deducts from earnings for hedging? Well, they are anal ysts.
I saw what you did there. Anal ysts 🙂
Gee, my typing is terrible?
so many are quick to point out when peaker predictions miss the mark, but this is definitely in the bullseye area for the clear-eyed.
on the cheerleader side you had two basic predictions – 1) shale is profitable at $55 so there’s simply no reason to not lock in the price and you are guaranteed to profit. 2) oil is going up so oil companies are guaranteed to be profitable – and I’m patting myself on the back for owning lots of energy stock – and all your “negative” outlooks are just jealousy over my… whatever… longhorns or HB-tesla.
not quite working out that way. good thing there are plenty of pension companies out there to buy out these failing companies – that will never go awry.
https://oilprice.com/Latest-Energy-News/World-News/Canadas-Biggest-Producer-Cuts-Drilling-As-Heavy-Oil-Price-Tumbles.html
Look for Canada to be slightly lower than projected. Constraints are a real pain.
GoM Crude Oil Production – Seasonal – EIA
For the average year (2011 to 2016) June is the low (not shown on chart)
https://pbs.twimg.com/media/DjxpCjYW4AAjsFW.jpg
The IEA should report that there was a new high in world oil production in July. Mostly due to the increase in OPEC+ production. The Oil Market Report for July is released on Friday 10th August.
It’s almost there now, chart for June: https://pbs.twimg.com/media/DjxyfWWW4AA16KY.jpg
Maduro assassination attempt.
US was far too fast denying involvement, and the denial came from NSA, not State. Odd.
China’s choice to buy Iranian oil is aligned with this event. With Iran 2 mbpd (incl condensate) removed from the global supply, China can’t find replacement, so they have to buy Iranian oil — unless flow can be created somewhere else, like in Venezuela after regime change. Smart cookies in the US may have figured this out.
But . . . this event may — probably will — drag Russia in deeper. Maybe China, too. Russian ethnicity in Venezuela is pretty strong. They have lots of reason to be even more supportive.
The fire brigade reported it was a gas tank explosion inside a building. The photos that are circulating tend to support this. Of course, Maduro will stick to drone attack as that will ‘justify’ further crack downs.
NAOM
Nah, the videos are on ZH. It’s credible. ZH is petty cynical about stuff like this, but they are not signing on to any gas cylinder explosion story, nor are they signing on to the Drone story. My read is the expressions on the people on that stage did not be speak expectation. To me, Maduro looked puzzled and then angry.
As for needing cover to crackdown, the guy just won his election and the majority of people in the world accepted it (in the context of China + Russia plus some indication of India as well). With that victory, he has no need for cover.
But it is useful to note that the alleged chemical weapons attacks in Syria certainly point at dragging the United States in deeper and so a party desiring that has incentive to stage such attacks. Similarly, parties in Venezuela desiring deeper involvement by Russia and China, might stage such an attack and bring them in to prevent American-funded regime change.
Not sure what real good news oil remains for bears. OPEC can’t keep up with their own drops, and US production will be insufficient to keep up with this year’s demand, much less next year. At this rate, is is barely keeping up with non-OPEC declines. What else is there? What are the traders seeing?
Oils futures as quoted on CNBC are all about what the next delivery date is because it’s an industrial commodity market. There is a fair amount of betting in the long-dated market that oil prices will rise significantly.
Well, Total is bringing 230,000 bpd online in Angola.
I’d say those projects will show some bad news for oil production. They are one year late; the first is now coming on line, the second due next year, but Total are already looking at approving tie-back options for them. ACCE at 20 kbpd was approved a couple of months ago and they are now looking at Chissonga as another. That sort of thing usually only happens before start-up if some of the appraisal wells didn’t look too good. Chissonga was a Maersk project, originally possibly a 200 kbpd FPSO, but quickly cancelled when the price dropped. To consider a tie back it must be considerably reduced in side.
For Angola as a whole, if you look at Sonangol site, the only future projects they have now are labelled “research” projects. That may mean under appraisal or maybe something more exotic like EOR, but even with those production declines quickly to 300 to 400 kbpd by 2037 (recent history suggests even that might be optimistic).
Interesting that that is ~ pre-cuts peak when Russia and Saudi were also going flat out but the USA is now producing dramatically more oil than then.
The difference is people who are down since then despite no particular cuts. Venezuela being the obvious one.
And demand is up several millions of more barrels since pre OPEC cuts. US production is up, but global inventories are dropping, because demand exceeds supply. And, at least for the next year, US production is stalled. By the time it picks back up, again, supply will never meet demand. What everyone forgets, except Ron and a few, is that non-OPEC (non US, Canada) decline marches on.
Will it take another month of US monthly official numbers to come in around 10.5 million for people to get the point? I guess we will see. Is the EIA sticking to 10.8 for the year 2018? Or will they drop it 0.1 every month for 3 months
Lol, the tough part is how they will try to get 11.8 average next year down.
The month of May is often a low for Canadian crude oil production – due to maintenance, outages and wild fires. And production is usually back up by August.
Chart https://pbs.twimg.com/media/Dj3dwIoX0AAkV7i.jpg
2018-08-6 Rosneft says that they have already increased production by 120 kb/day since the last OPEC+ meeting, and could increase this to 200 kb/day in Q3.
.
The first domestically-based corporate software RN-GRID for hydrofracturing design and analysis was put into commercial operation.
https://www.rosneft.com/press/releases/item/191853/
If WTI stays cheap compared to Brent & others then I dare say someone will buy it (fungibility)
2018-08-01 (Clipper Data) US oil exports rise to India, drop to China
Based on our projections, India is going to import nearly as much US crude as China in August, as its appetite for light sweet US crude increases…just as China loses theirs.
http://blog.clipperdata.com/us-oil-exports-rise-to-india-drop-to-china
Earlier estimates of OPEC have now changed, and there is no increase from June. Probably, a slight decrease from SA. From OPEC sources, not Platts. I think they would start increasing if Iran drops, but not much otherwise. I think Sauds and Kuwait joint venture is set up for that potential.
Changing the way I gage things, into a much simpler format. Now, I look at world inventory drops, and look at current increases from OPEC and US. Neither will change much, so inventory drops should continue. Opec needs to come up with a lot more, or it will look damn scary in 2019. With pipeline constraints, Canada is pretty much out of the picture for further increases this year, and not much, elsewhere.
Yes, there have been some reports from outlets tracking satelitte data (e.g. Tankertrackers and Clipperdata) that oil exports from major countries are way down in July compared to June. KSA almost 0.5 mill barrels a day down in July according to some sources. And in addition some indications on inventory build rather than withdrawal for some main Middle East countries (aiming especially at the KSA, Kuwait, UAE “group”). That would most likely indicate an upwards bearing on oilprices this autumn, and I think these news are already affecting oilprices a bit. That is exactly the same pattern as in 2017. If that is the case it is a very political move by OPEC; flood market to show strength and please Trump in June, full reversal in July because they need to do so anyway. I am still very sceptical of KSAs ability to increase production in a sustainable way. Fighting decline to keep steady is more where they should be given all their mature fields.
A freebie from tankerstrackers regarding exports from Kuwait in July. (They are trying to attract subscribers as a cheaper alternative to Clipperdata)
https://tankertrackers.com/news/crude-oil-exports-report/kuwait-july-2018-along-with-storage-satellite-imagery
If exports from Iran fall as the official numbers already start to show, I think in some way or another the barrels makes it to the market anyway. But some minor losses along the way would most likely have occurred (sanctions on the myriad of companies helping the the Iranian oil industry and losses due to extra transportation, other exchange costs and some minor loss of volume altogether maybe).
Iran sales will drop in Europe, the India big refineries, South Korea, and Japan. That’s a lot, and well over a million barrels. I question whether China will absorb all of that. They are supposedly saying that they will not decrease, nor increase. It’s a wait and see thing, at this point. Iran is in bad shape, now. Maintaining production will, no doubt, be an effort, too.
Yes the outlook for OPEC’s July production is looking more flat now. This is a strange situation because Platts is one of OPEC secondary sources and so I assume that they see all the numbers
Argus – Surprise Saudi decline depresses Opec output
https://www.argusmedia.com/en/news/1729615-surprise-saudi-decline-depresses-opec-output
Yes all the tanker trackers are saying that OPEC exports fell in July, this is Reuters version
Reuters on Twitter: https://pbs.twimg.com/media/Dj541N2WwAAy55o.png
The Platts vs Argus divergence is for sure strange. It is easier to track exports than production numbers.
Thank you. This news confirms that world production is stagnating. Possibly very close to the decline. We will have to be attentive to the inventories. It will be the first place that the nations get hold of in order to supply themselves with oil.
It sounds like a secondary sources vs direct communications issue?
2018-08-07 (Plastts) Analysis: Saudi crude oil production data catches market by surprise, but not all are convinced
While exports can readily be tracked, the country’s internal consumption and changes in storage levels are less easily quantified in real time, noted Michael Cohen, head of energy markets research for Barclays, which does not participate in Platts’ OPEC survey.
https://www.spglobal.com/platts/en/market-insights/latest-news/oil/080718-analysis-saudi-crude-oil-production-data-catches-market-by-surprise-but-not-all-are-convinced
Platts chart https://pbs.twimg.com/media/Dj_k5_lW0AAE7hf.jpg
Iran has to be dumping as much oil as they can before sanctions set in. That has to compete with KSA’s sales, temporarily.
Within two months, things will come to a head. By then, it will become more apparent, as to the eventual decrease in Iran sales. Also, by then, we will have two more months of EIA monthly oil production amounts. Inventory drops will continue.
It seems that Venezuela is exporting all of it’s crude oil production rather than refining it. And so exports are holding up.
2018-08-07 (Clipper Data) Crude oil exports from Venezuela
Chart: https://pbs.twimg.com/media/Dj_NVe_W0AEcfvN.jpg
2018-08-06 (Bloomberg) Venezuela: PDVSA Isla refinery in Curacao remains shut since July 27th, no estimate for restart. 330 b/day refinery in process of cleaning out asphalt from lines.
The Isla refinery is the one with a Conoco lien on it. Current income goes into an escrow account. They are trying to find a new operator other than PDVSA. Not Venezuelan, anymore.
Baker Hughes – International Rig Count – July
Total +38 to 997
oil +27 to 780
Oil chart: https://pbs.twimg.com/media/Dj_5MkqXcAAcm4v.jpg
gas +11 to 185
Misc 0 at 32
Offshore +22 to 217
Offshore chart https://pbs.twimg.com/media/Dj_j7iBXgAAKCKw.jpg
Land +16 to 780
Saudi Arabia +9 to 117 (+9 gas rigs returning)
Offshore China +9 to 35 (+9 oil)
Venezuela +2 to 28 (+1 oil +1 gas)
Egypt +5 to 32 (+4 oil +1 gas)
Libya +4 to 5
http://phx.corporate-ir.net/phoenix.zhtml?c=79687&p=irol-rigcountsintl
Rig count in some countries start to react to higher oil prices. South America, Africa and Asia see higher overall rig counts. The long time depressed market for offshore rigs seems to improve.
There are oil rigs working in Libya again for the first time since the civil war. Offshore rigs in Brazil (+3) and China (+9) are picking up activity. Egypt is on a quest to increase oil production.
The International rig count is without the USA or Canada and so I had a look at world oil production without the USA or Canada
Chart https://pbs.twimg.com/media/DkAjnFJXcAAEwdL.jpg
https://oilprice.com/Energy/Crude-Oil/Pakistan-Exxon-Is-Close-To-Making-A-Mega-Oil-Discovery.html
How is it that you get “close” to a mega find? Doesn’t News like this normally come from a little higher, along with mega fanfare from the big oil companies? Move over, big oil companies, reporters will find your oil for you.
“and those reserves could even be larger than the oil reserves of Kuwait”. They better hurry up to find the oil if it is this promising.
Pretty fast, so far. They just signed an agreement for 25% in May. Has to be some kind of a record.?
If Saudi Gehwar is done…last 10% of creming curve, then does it really matter as money markets upset and can’t afford non conventional?
Ghawar is not one field, it has 5 main fields, Ain Dar, Shedgum, Uthmaniyah, Hawyiah, and Haradh, and several other smaller fields. They were all drilled at different times and have different grades of oil. The lighter oil is in the north and gradually gets heavier as you move south.
I have heard that Ain Dar and Shedgum are starting to water out but have not heard much about the other three fields. Haradh only started production a few decades ago and likely has several more decades before it starts to decline. Ain Dar and Shedgum however, are, or rather were, by far, the most productive of all the Ghawar fields.
Gehwar…amount of drilling would tend to indicate the measure of need? No CO2 injection..no real need?
Okay, it’s “Ghawar”, not Gehwar. Production numbers from Ghawar are a deep dark secret. But there are every indication that it is dropping. Saudi began CO2 injection in Central Ghawar, Uthmaniyah, about three years ago.
Saudi Aramco testing C02 to get more oil from giant Ghawar field
July 2015 KUWAIT (Bloomberg) — Saudi Arabian Oil Co. started injecting carbon dioxide to try and boost extraction rates from the world’s biggest oil field as the company steps up plans to recover more crude from its deposits.
Saudi Aramco, as the company is known, already started injection and will put 40 million cubic ft of CO2 into the Uthmaniyah area south of the Ghawar field, it said Thursday in an Arabic statement on its website. About 40% of what’s injected will be stored in the field.
“The project aims to enhance oil recovery beyond the more common method of water flooding, and is the largest of its kind in the Middle East,” it said. The project is part of the company’s efforts to reducing domestic carbon emissions and meeting environmental goals, it said.
Oil-rich nations across the Persian Gulf are seeking ways to continue output from fields that are at least half a century old. While the industry average is for producers to recover about 35% of fields’ total deposits, Saudi Aramco is developing technology that could double that rate, Ahmad al-Khowaiter, chief technology officer, said in March.
Injecting CO2 into Uthmaniyah will boost oil-recovery rates by 10 to 15 percentage points, Khowaiter said in March. The CO2 for the project will be captured at Hawiyah gas recovery plant and then piped 85 km to the site. The project will be tested for three to five years before Aramco applies the technology to other fields, it said in Thursday’s statement.
I doubt seriously that they can ever achieve a 70% recovery rate, twice the industry average. But they say they can and people believe that. They say they have 265 billion barrels of recoverable reserves and some people believe that also. I guess they are counting on a 70% recovery rate when they say they have 265 billion barrels of reserves.
Gracia…forgot spell check. Thanks. Have a great day.
FYI: Co2 field use in western US does produce more oil, but only over a longer period of time, so total actual level of production declines. For Saudi other fields may offset production for ensuring total country output is the same. For creaming curves there seems to be three phases…easy phase…linear, Saudi 40 years, the horizontal phase…somewhat steep, about 10 years..duration; and the final CO2 type phase..very steep decline with minimal output.
sonoluminescence is next generation effort…acoustics..and physics tricks.