Most of the data below is taken from from the EIA’s Short-Term Energy Outlook. The data through February, 2019 is the EIA’s best estimate of past production and all data from March 2019 through December 2020 is the EIA’s best estimate of future production. However in most cases February production is highly speculative so I drew the “projection” line between January and February.
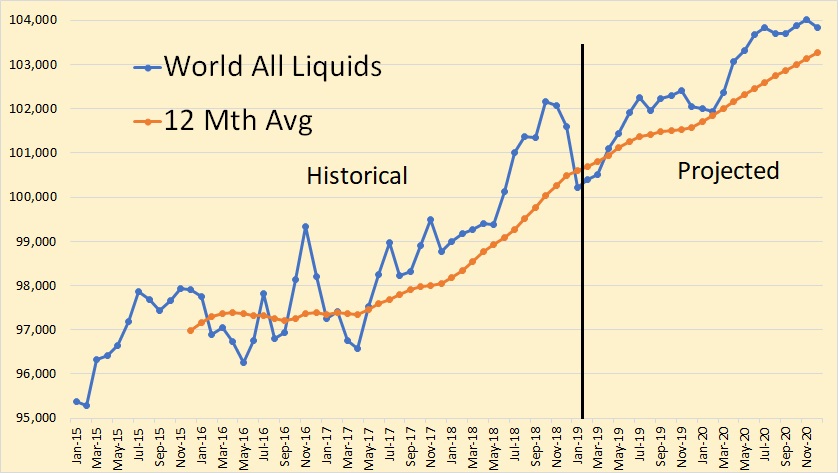
Understand the above chart is Total Liquids, not C+C as I usually post. As you can see the EIA expects world petroleum liquids to keep climbing ever upwards.
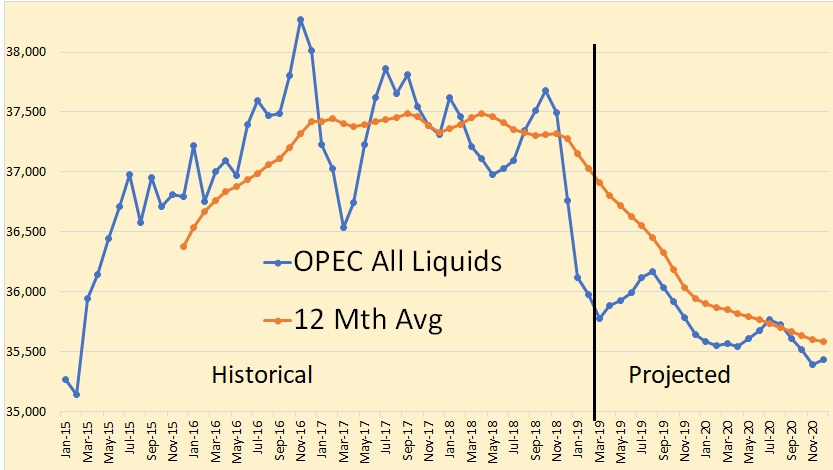
This is the EIA’s data for OPEC all liquids with Production data from April 2019 through December 2020.
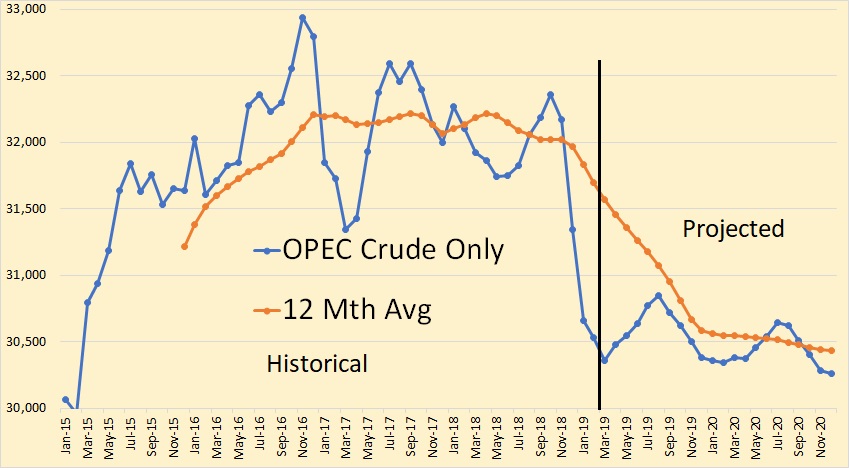
Notice the EIA expects OPEC production to keep declining through December 2020. Also they expect total liquids to decline slightly faster than crude only. This is interesting since neither condensate nor other liquids are subject to OPEC quotas.
About two years ago I made note that the EIA expected Non-OPEC to plateau but they expected OPEC to keep increasing into the future. Now they have completely reversed themselves as they expect all future growth, at least for the next two years, to come from Non-OPEC countries.
The below chart is from the EIA’a Monthly Energy review and is C+C through November 2018.
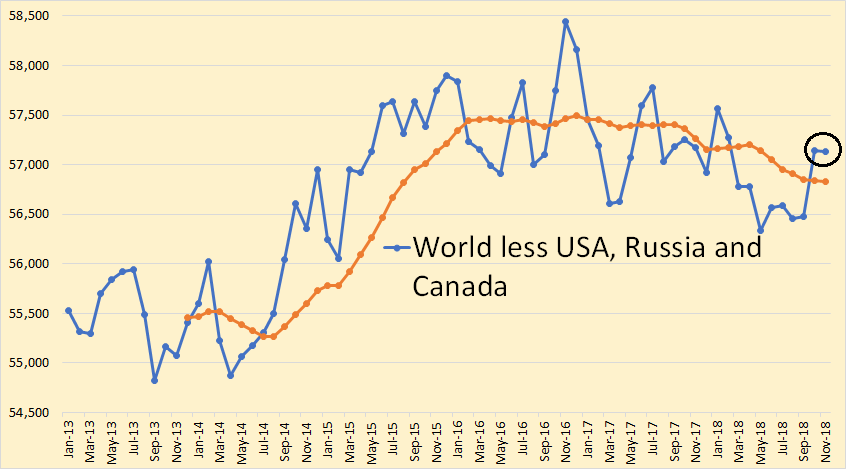
Virtually all crude oil increase since 2016 has come from three countries, USA, Russia and Canada. The spike upward (circled) in October and November 2018 was partially due to OPEC prepping for cuts. Every OPEC country made heroic efforts to increase productio during those two months in order to increase their quota. Quotas were set in December.
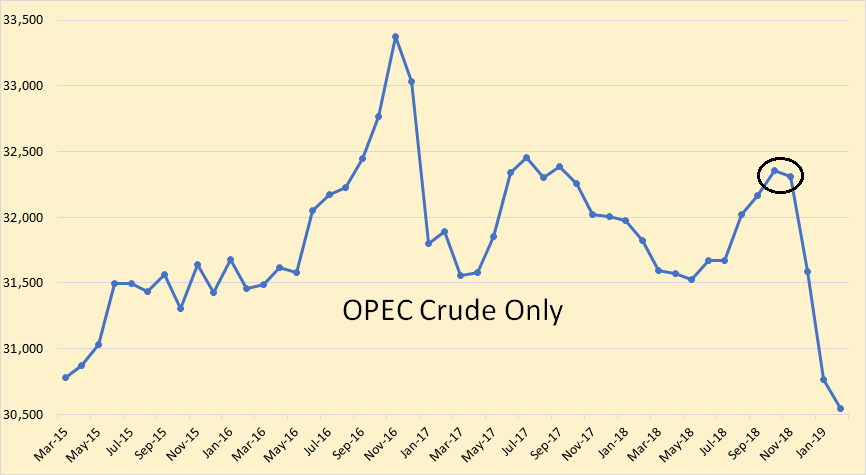
Nevertheless OPEC production during these two months was still over one million barrels per day below their record set in November of 2016.
Okay, back to the EIA’s Short-Term Energy Outlook of total liquids.
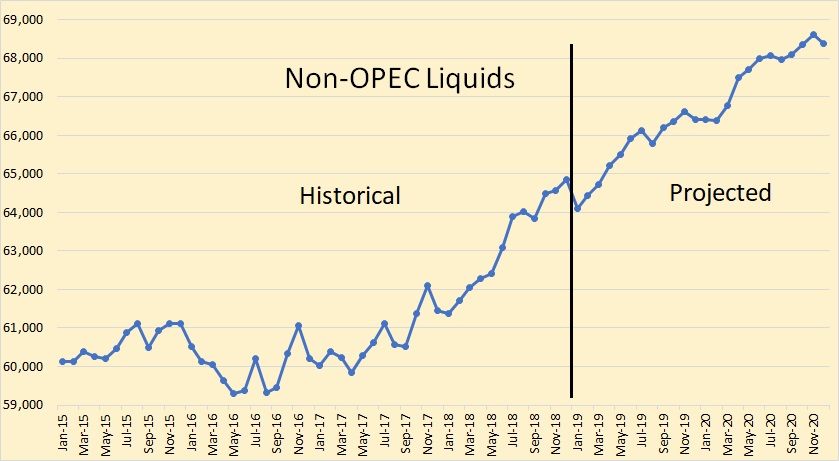
Here is what the EIA expects Non-OPEC liquids to do.
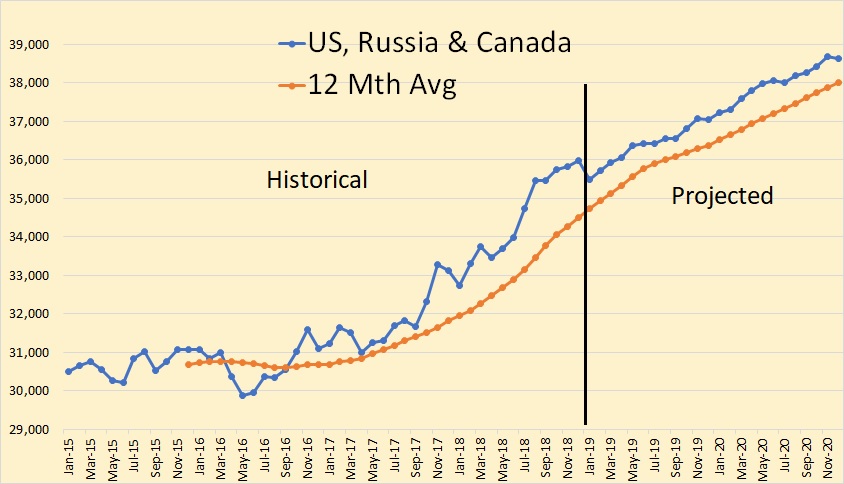
And most, but not all, they expect the growth in total liquids to come from just these three countries.
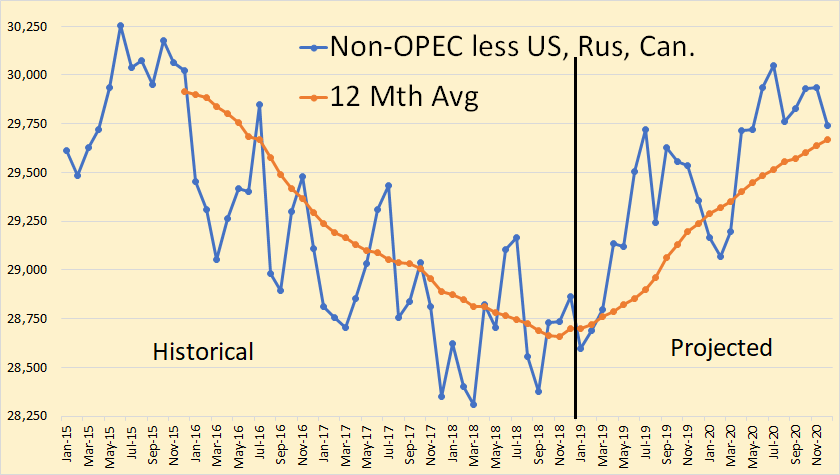
Even though Non-OPEC less US, Russia and Canada has been trending down, the EIA expcets a complete turnaround in that trend.
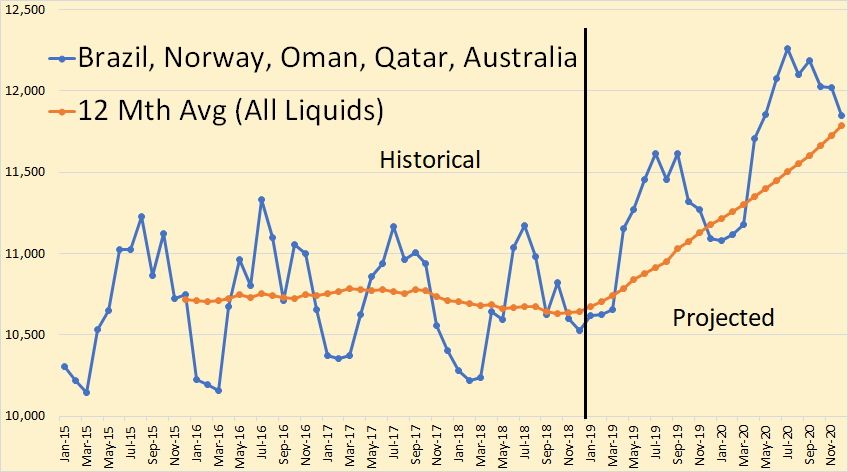
They expect about 1.2 million barrels per day of that future increase to come from five other countries, Brazil, Norway, Oman, Qatar, and Australia.The annual gyrations seen in this chart is due to Brazil’s ethanol production. It peaks in mid summer and bottoms out in mid winter.
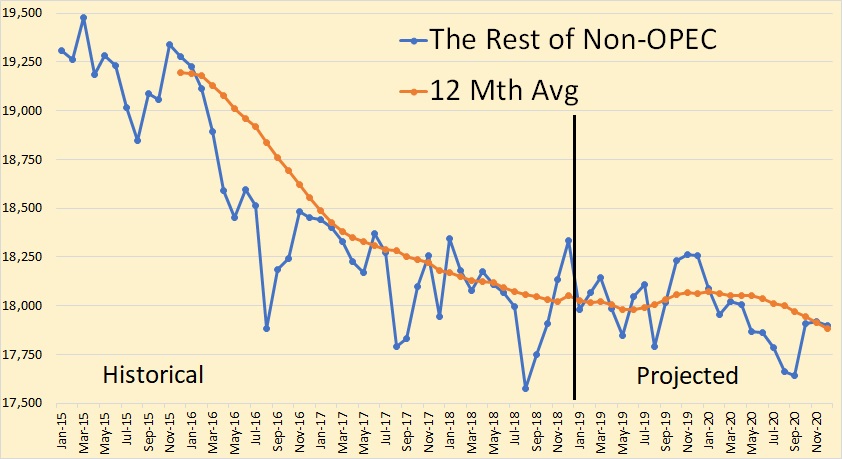
But finally we have reached the limits of the EIA’s optimism. After the USA, Russia, Canada and the five nations listed above, they only expect the rest on Non-OPEC to slightly slow their decline rate.
The bottom line: In the next decade or so, there will be countries that increase their oil production and there will be countries that will have a decrease in oil production. Peak oil will occur, or did occur, when the amount of oil from increasing countries cannot overcome the decrease in oil production from declining countries.
329 responses to “The EIA’s Optimistic Outlook”
https://www.zerohedge.com/news/2019-03-19/bloodbath-us-shale-stocks-continues-worst-yet-come
AEO 2019
What is this? It doesn’t make any sense.
Ron,
Working from phone so messed up chart includes stuff besides crude on first chart second is a bit better.
Doesn’t look all that realistic to me. Looks like someone just drew a straight line.
agree not realistic, part of the problem for lower lines I the scale of that first chart.
AEO 2019
Better chart c+c I agree this is far too optimistic.
So if tight oil and bitumen are level and everyone besides the eight countries mentioned is declining, with USA and Canada being wholly unconventional in gains…where’s the crude coming from?
tight oil and bitumen for aeo 2019, tight oil output increases from 6.9 to 12.7 from 2018 to 2050, about a 6 Mb/d increase. OPEC production increases from 35 to 49 Mb/d or roughly 14 Mb/d from 2018 to 2050.
The cumulative World C+C output is 2440 Gb from 1870 to 2050 for the AEO 2019 reference scenario. If we assume the EIA believes 2050 will be the peak in World C+C output and also that this occurs at 50% of URR, this implies a World URR of about 4800 Gb for C+C. Optimistic does not quite cover it, ridiculous would be more apt. 🙂
Were these parts of the report written by completely different people? OPEC is declining in their near-term and its supposed to add 14 million barrels per day *escalating net* over the following three decades. Wut?
Polypro,
The short term outlook covers now to Dec 2020. The AEO is a long term forecast 2019 to 2050
I understand that but production curves simply don’t do that. Not without a major externality that’s left URR in place. See Venezuela (economic collapse, failure to exploit), Iraq (war, sanctions, civil war) and Russia (disorderly breakup).
You don’t go down while pumping flat out and then rise to better and better new highs in the same resource. Just doesn’t happen. As you say the implied URR on that curve, particularly OPEC, is absolutely ridiculous.
Polypro,
Pumping flat out simply means producing developed resources at maximum. The rate that new wells are drilled can change with the price of oil just as it did with US tight oil output from 2014 to 2018.
Have you looked at the stats? It went down then up, also world output 1979 to 1986, though that was the Iran/Iraq war mostly. An oil market glut causes changes in OPEC behavior.
The EIA has World tight oil output of 140 Gb from 2000-2050(AEO 2019 has US tight oil cumulative output of roughly 120 Gb from 2000-2050). For “rest of the World” (excluding US) this implies only 20 Gb of tight oil output which seems reasonable, note that my estimate for US tight oil output is considerably lower than the EIA estimate at about 87 Gb and would imply about 110 Gb for World cumulative tight oil output from 2000-2050.
Note also that a brief analysis I did for World demand for oil under an optimistic scenario where plugin vehicles continue to ramp up at the 2014-2018 rate. Annual sales increased at an average rate of 58% per year and we assume commercial plugin vehicle sales follow the 2014-2025 personal vehicle growth trend from 2025 to 2035. This scenario has demand peaking in 2025 and falling faster than supply under an alternative scenario where plugin sales grow more slowly. That in turn implies lower oil prices after 2025 than the AEO reference scenario where oil prices peak in 2045. A lower oil price scenario than the AEO reference scenario would reduce my estimate of tight oil URR, probably to 65 Gb or less and would imply steeper decline rates for tight oil output after 2025 than my “standard” scenario which assumes the EIA’s AEO reference oil price scenario is correct.
Where does the electricity come for all those plug in vehicles? I saw a study done for a small area in Spain, and the infrastructure investment is prohibitive. They identified bottlenecks down to the individual building parking area. The authors recommended condominium owners install the chargers and buy the KW capacity soon, to get locked without having to pay for extra infrastructure. Those who come later would have to pay over 10K euros each for the grid expansion. And that doesn’t account for the extra generation capacity, which is going to be extremely expensive if the socialists win the election, because they want to close nuclear power plants.
In conclusion I believe you should use two or three countries to understand if your figures make sense, because I just don’t see it happening.
Fernando,
Much of the charging occurs overnight when there is plenty of excess capacity. Also much less energy is required for electric transport as there are fewer thermal losses. When more solar is available charging will switch to daytime as there will be excess capacity during the day. The process will occur over decades and will be figured out.
Dennis
Demand growth is being mainly driven by aviation and chemical industry.
https://www.iata.org/pressroom/pr/Pages/2016-10-18-02.aspx
https://www.iea.org/geco/oil/
https://www.meti.go.jp/english/press/2018/1019_003.html
For oil demand to fall, electric car sales must reach 60 million per year. Electric motorbike sales must reach 50% at least.
Hugo,
Plug-in vehicle sales have been growing at 58% per year from 2014-2018, if that rate continues until 2026, plugin sales reach 78 million in 2026, I also assume commercial vehicle sales start growing at 58% per year from 2025 to 2040.
Note that I consider this an upper limit to the rate of plug-in vehicle sales growth. Chemicals use primarily natural gas and NGLs, I focus on C+C output rather than total liquids.
Also note that the airline industry is becoming more efficient over time so fuel per passenger mile is decreasing. Jet fuel growth has been about 20% of the total petroleum demand growth. As fuel costs go up this may change. I have assumed after 2025 airline and marine transport demand remain fixed in the “low demand” scenario, I expect reality will fall between the “high supply” scenario and the “low demand” scenario, where exactly actual supply and demand will balance is difficult to predict with precision.
Dennis
A great deal of oil is used in the petrochemical industry to make plastics, tyres and a hundred other things.
Consumption in the sector has doubled since 2000AD
https://www.ft.com/content/5ae88252-cb9b-11e8-b276-b9069bde0956
https://www.iea.org/newsroom/news/2018/october/petrochemicals-set-to-be-the-largest-driver-of-world-oil-demand-latest-iea-analy.html
If you think the aviation industry will be fixed after 2025 then you obviously think global GDP will stagnate also.
Globally the middle class is expanding, it has grown by a billion since the turn of the century and will grow by another billion to 2030.
These people are buying their first fridges, washing machines, computers, petrol cars and flying.
At some point probably around 2025 there will not be enough oil to meet demand. Prices will rise to constrain demand. The IEA in 2012 predicted $125 per barrel by 2030, I think we will see $125 sooner than that.
Hugo,
Most plastic uses NGL as an input, I don’t consider NGL as oil most of it (80% of the “barrels” produced) is a gas at standard temperature and pressure, more like natural gas than crude oil. Airline passenger miles can increase while efficiency also increase with total jet fuel use changing very little.
Hugo,
Keep in mind that the IEA uses a very broad definition of oil, essentially grouping together all liquid fuel and calling it “oil”. NGL output will grow to some degree as natural gas output will probably not peak until 2035 (NGL output will peak at about the same time). Also IEA has a very inflated view of the output growth that is likely from shale gas and tight oil. Their forecast for NGL output (which matches their demand forecast) is likely too high. Demand will depend on prices and as supply becomes short, prices will rise and demand will fall.
Where do you get the 60m figure? The simplest model is that demand for oil for cars will start to fall when the number of ICE cars on the road starts to fall. There are about 80m new cars a year, and a billion on the road. About 70m are scrapped each year, so the fleet grows by about 1% a year. If 10m EVs are sold, then the number of ICE vehicles on the road should be flat.
The main advantage of EVs is lower operation costs, so vehicles like taxis that are used intensively may make the switch sooner, meaning they will have an even stronger influence on demand. So I would expect demand from cars to fall when annual sales are 10m or so.
There are other considerations. For example, countries with lots of cars are aging quickly, and old people drive less. There is a serious concern in the car industry that total demand for new vehicles will soon start to fall as car sharing continues to spread. If autonomous vehicles work out, which seems likely, this trend could accelerate quickly, because driverless taxis would be very cheap.
The car industry is very nervous right now, and that does not bode well for the oil industry, although the effects won’t be felt for years.
The scenario for World output under the optimistic plugin vehicle scenario for 2025 to 2040. The “supply” line can be thought of as maximum output in a World where plugin vehicle sales grow only fast enough to keep demand at the level of World oil supply. If plugin vehicles sold meet my optimistic scenario (which can be though of as an upper bound of what might occur with maybe a 10% probability) then supply would fall to the level of the “demand line” and oil prices would drop below the level of the AEO 2019 reference case to keep expensive oil off the market (expensive producers will stop producing due to lack of profits). Note that reality is likely to be somewhere between the supply and demand lines shown and is impossible to predict.
Scale on chart above is World C+C supply or demand in millions of barrels per day (Mb/d).
Some international inventories week/week changes (million barrels)
Total Distillates: -7.14 (shown on chart)
https://pbs.twimg.com/media/D2NDNZ_WoAEFes9.png
Light Distillates: -3.16
Middle Distillates: -5.27
Heavy Distillates: +1.29
Light & Middle https://pbs.twimg.com/media/D2ND8VoWsAA6Aoq.png
Total (Crude + Products): -10.75
Crude Oil (Japan+USA): -3.61
https://pbs.twimg.com/media/D2NDhPZXcAEEtKm.png
Fujairah weekly inventory change.
Total Products: +2.29 million barrels
https://pbs.twimg.com/media/D2FxExIWwAAoKH0.png
Japanese weekly Inventory change. Total (Crude + Products) +5.86 million barrels
https://pbs.twimg.com/media/D2FzPq2WoAY9LfW.png
US inventories week/week change (million barrels)
Crude Oil: -9.6
Total Distillates: -6.6
Propane & NGPLs: +0.9 (not on chart)
SPR: flat
https://pbs.twimg.com/media/D2NEkAEWkAAxld1.png
Article out. Iran is shipping petroleum products. They seem to have some new refineries and they are shipping product rather than crude. The products apparently are not included in sanctions.
So charts showing Iranian exports of crude to have declined once again won’t mean much.
The charts are crude plus products. So not really relevant.
had nothing to do with the charts that aren’t showing Iranian exports — which do appear here sometimes. It’s new info.
“Reuters reports, quoting industry sources from Asia, that since the sanction waivers do not extend to oil products, even countries granted waivers may be buying products such as fuel oil from Iran.”
There is talk of fuel oil transfers ship to ship in territorial waters of countries not participating in the sanctions. The talk didn’t delineate the fuel oil definition, which usually includes diesel. If Iran is shipping diesel, and they should be, there will be no scarcity of customers.
And exactly how much oil products do they export? I don´t think it´s a meningsfull volume compared to lost oil export.
Iran’s oil consumption is 1.8 mbpd.
Data is available but spread out. It appears as if Iran has about 4 mbpd of refinery capacity and some of that processes NGLs from the big offshore gas field shared with Qatar. So anything beyond 1.8 is available for export.
This is good: https://www.petroleum-economist.com/articles/politics-economics/middle-east/2019/iran-hobbles-through-the-sanctions
It’s good but rather a lot of opinion. Dood says as of May crude exports will be about 1.5 mbpd. That’s crude, vectored out via Russia and China auspices. Products, as above.
Venezuela exports to the US dropped to zero. The oil is being purchased by Indians and Chinese, and some Russian traders. Production dropped a lot during the mega black out. And Maduro keeps trying to incite Trump to intervene without international backing, but this is known to be Castro’s plan to interfere in US elections by getting Trump into an occupation where Cuban agents can use terrorism to cause US casualties. Castro’s idea is to get a radical Democrat like Sanders elected, this in turn would lead to US withdrawal, and of course all sorts of concessions or even economic aid to the Castro dictatorship.
Unfortunately the Venezuelan people are caught in this struggle between US marxists aided by Castro and US Republicans. Thus Trump has to use diplomacy to get Maduro isolated even more, first at the OAS, then at the UN. And meanwhile the level of savagery by the Maduro regime climbs as it seeks to goad the US into an attack.
Unfortunately I’m not getting much traction with my suggestion to create a 20 thousand strong Venezuelan police force recruited from the 4 million in the Diaspora, who can take a small port and airport with other nations’ naval and air support, and create the conditions for massive defections from the military, who would eliminate the Cubans embedded in their units, move to the liberated area, reorganize, and gradually expand the territory controlled by Guaidó. This is the best option for the Venezuelan people to free themselves, and cut off the Cuban tentacle.
https://en.wikipedia.org/wiki/Walter_Mitty
Fernando,
I really enjoy your posts on oil production and engineering.
The idea that you are influencing the Venezuelan, Cuban or American government is absurd.
“Unfortunately I’m not getting much traction with my suggestion to create a 20 thousand strong Venezuelan police force”
Gee I wonder why you aren’t getting “much traction”…..
Ferdi’s problem is that he is not a Flat Earthist. Flat Earthism is obviously true, and only morons doubt it. Anyone who fails to promote Flat Earthism will fail to get traction, because it is the fundamental truth that all right thinking men are converging on.
Survivalist, when I lived in Venezuela I met people, but best of all I hired very smart college graduates. My budget allowed me to cherry pick the top of each class, and I made sure they received very good training, way above what multinationals do. I could justify it because these bright Venezuelans were replacing expatriates who made an incredible amount of money, had company paid apartments and other perks. Most of these Venezuelans are now living abroad, some who had engineering degrees went on to get MBAs. And as it turns out some of them are tapped to prepare the “What comes next” plans, and I serve as their informal advisor.
This gives me the idea to discuss options, they run up the line what they think makes sense, and then I get feedback. Most of what we discuss is technical or involves the type of contracts to use in the short term, as well as practical issues such as how to lure an engineer making $20K a month to return to Venezuela to work for PDVSA, or how to contract security services.
The idea to create a police force with exiles originated when I was sketching how to defend an oil field contracted by a multinational (I assume you know I worked in those settings for decades), when company policy is to use two security rings, the outer being a national guard or national police force. From a legal and public relations standpoint its preferable to have the inner ring be contract employees who are NOT armed. And an outer ring of armed national guard. This way if shooting starts, the shooting is done by the government. The problem of course is that today, the Venezuelan police force abuse human rights, have really happy fingers, and are prone to execute unruly youngsters with a shot behind the ear. And no decent company would want to be involved with people like that.
So it occurred to me there are thousands of military and police who fled, and are probably interested in a job, working in a National Police Force trained not to abuse people. So I started sketching what it would look like, and suddenly it seemed to me 20 thousand well armed police would do to take Maduro down. I suggested this to my contacts, they liked it, and passed it up the line explaining that in any case we need something reliable to protect power plants, water supply, ports and non oil field assets. But the idea seems to be on the shelf (I say this because there’s no noise about military or police being recruited in Colombia, Chile, Peru, etc).
We also know Cuban intelligence has spies in the system, therefore anything that’s discussed will get to them. And this is why I discuss it here. And of course there are other issues I don’t discuss, nor am I about to disclose detailed action plans, because there’s a chance the US thinks along the same lines I am, and I hope their system doesn’t leak as much as the one that’s full of Venezuelans.
Get it?
Well—-
It is almost April—-
And Maduro is still there with popular support.
“Random Guiado, the President who wasn’t There. The longer this goes on, the stronger the Bay of Pigs smell grows.”
Wasn’t the coup to happen months ago?
This is going to take a while—
Yeah a long while, Maduro will probably last longer than Trump.
Maduro has zero popular support. He does have paid paramilitary called colectivos, who ride motorcycles and are armed with 9 mm automatics, shotguns, and rifles. Over the last three days most of the repression is by colectivos called into action by Maduro. They shoot at protesters and that’s that. We also see a few national guard and police firing tear gas.
The regime is still decaying. For example, Jorge Rodriguez, one of the top regime brains, is hiding in a hotel in Ciudad Guayana. Power cuts are so serious I’ve lost contact with my friends in Maracaibo, who last reported heavy looting, no electricity and little water.
The water supply to Caracas us nearly zero, so we see people trying to catch sewage running down the river guaire, and huge lines at small springs located at Avila national park. So I anticipate epidemics will surge within a few days.
I’m starting to get a bit of positive feedback, and I noticed one individual with connections (can’t name the source) is working actively to have Trump endorse the police force concept.
It’s hard to predict what’s going to happen, but I’m going to continue to advocate the idea that 20 thousand Venezuelans can do the job with US naval and air support.
A guy with military experience tells me he thinks it’s better to go heavy, with two assault ships, one carrier, and miscellaneous assets. These will help escort the first entries until we take control of a port and airport. And I don’t see how Maduro’s skimpy support will withstand a force which can easily recruit and arm 100,000 highly motivated men and women to continue on towards Caracas.
Thanks again for these updates and insights Fernando.
A Deacon at our church who escaped Venezuela a couple years back is confirming everything you are saying. The blackouts, along with lack of food and water are becoming unbearable for his family members back home.
This is truly a tragedy and I pray we see swift action to help those suffering under this terrible socialist/communist regime.
Thanks for sharing your story FL, I’d guess you and I are probably on the opposite end of a lot of spectrums in this world, so perhaps talking military affairs might be interesting. No? Maduro seems to be getting economic support primarily from China (IMHO an attempt at debt-trap diplomacy that will backfire), and gestures of military support solely from Russia. I think I saw a headline recently about S-300’s, but I haven’t had a chance to read up on it. And Lavrov was making some strong statements. Anyway, you and I, and perhaps we, should follow up on this topic in the Non-P thread. I’m particularly interested in Hezbollah (likely the best light infantry in the Middle East) and IRGC operatives in Latin America, and their use of Venezuelan passports and false identity documents to enter North America. Def lots brewing in Ven. Buckle your chinstrap!
Maduro isn’t getting economic support from anybody. He also continues to ship free oil to Cuba. To make up the short fall he has allowed illegal mining in the jungle, and they are cutting down trees, stripping the soil and finding gold they ship to Turkey to be refined.
If you want to discuss this in the non oil thread I’ll try there.
Explains oil price moves of late. If inventories continue to decrease oil prices will continue to increase.
IT’s playing on the Future market. In short term they can move the market everywhere they want. As long as the storage is not completely empty.
Yes, there is plenty of play in the market, by which I mean that production costs are much lower than the value of the product in a pinch. You can see this is true because only government mandates (like CAFE in the US or the heavy taxes in Europe) are at all effective at reducing consumption. Inventories only matter in the minds of the traders, and their sentiments determine prices.
Slowing economic concerns in the market today. Short term correction riding a 3 month bull.
WTI just printed a bearish shooting star on the weekly chart at close today. NOT the daily chart the weekly chart. Which has huge implications. Price is going down from here. It’s not going to make it back to the former trendline it broke that originates off the 2016 lows.
After the initial knee jerk reaction to FED’s policy that was lower for the dollar and higher for WTI. Dollar got bought and WTI got sold.
Direction couldn’t be more clearer if your paying attention.
The 3m10y inverted today. Which isn’t good at all if you desire higher oil price. Recession is near. Seems to me FED should have known backing out of QT would flip the yield curve by sinking the long end of the curve. Doesn’t really matter why it flips. Banks can’t make money borrowing short and lending long equals recession.
Short term interest rate cuts will be back on the table in short order. To try to correct this inverted yield curve. FED doesn’t really have a choice in the matter. But the damage is already done. Recession should be here 3-4 months after the FED starts cutting interest rates again.
Baker Hughes U.S. Rig Count
Oil: -9 at 824
Nat Gas: -1 at 192
Louisiana -3
Permian -5
http://phx.corporate-ir.net/phoenix.zhtml?c=79687&p=irol-reportsother
Table https://pbs.twimg.com/media/D2R2poxWoAAI1Dj.png
I failed organic chemistry in college…so bear with me….
If you can convert Coal and Natural Gas to Oil ( hydrocarbon chains?? ).
Do those count when calculating when peak oil has arrived?
I must go now….I am getting my vasectomy in the morning.
Luke 12:33 ( Ivanka Trump 1:10)
“Sell your possessions, and give to the needy. Provide yourselves with moneybags that do not grow old, with a treasure in the heavens that does not fail, where no thief approaches and no moth destroys.”
I assume those are not likely to be enough to replace falling oil output so I focus on c+c output. Coal and natural gas will also peak, coal in 2030, and natural gas in 2035, with 2 year window around each guess.
Both coal and natural gas have lower energy densities than oil, so you would lose a bunch of energy making the conversion. Wouldn’t it make more sense to directly burn the coal and natural gas?
Do they count when calculating peak oil?
Hyrdro carbon chains are the same aren’t they?
They only count if they are actually converted from coal or natural gas to gasoline, diesel, or jet fuel. At current prices and technology that is unlikely to occur at a greater scale than today. Impossible to predict with precision future developments, but with wind, solar and evs having rapidly falling costs this makes it more likely that oil price peaks around 2025 and makes the substitution of coal or natural gas for liquid fuel highly unlikely, probability 10% or less.
DC,
(OT: What have you done with DougL? Set him free immediately.)
Doug had one of his hissy fits he has every few months, threatened to leave, and quit posting. He’s always ultimately come back, though, so the odds are in your favor if you enjoy his posts.
Dave Hillemann,
Thanks. I shall study patience.
On the other hand, coal and NG can substitute for oil: China is using coal for petrochemicals, and of course NG is used for that as well. And then there’s NG for transportation, especially heavy fleets.
As the price of oil (and the recognized cost of externalities) rises, oil demand will be a leaky barrel, suffering from a thousand cuts.
Rystad Energy claims in a newsarticle that US shale oil and shale gas will grow and become a quarter of the world’s total petroleum production in the 2030’s. The company also claims that debt is a misunderstood aspect of the shale oil production, because investing in shale oil is so attractive that the shale oil companies reinvest all their profit to grow faster. Any comments?
They’re lying. US LTO doesn’t make positive free cash flow, ergo no profits to “reinvest.” It is true that they plow whatever they make back into production but they kind of have to operating at a loss.
>investing in shale oil is so attractive that the shale oil companies reinvest all their profit to grow faster
The claim doesn’t even make sense. If all their investments come from their own profits, then they aren’t accruing debt. But they are accruing debt. What they do with their profits is irrelevant to that fact.
Has Rystad ever addressed the net operating losses that almost all shale companies have accumulated since 2014?
The GAAP profits for shale are heavily dependent upon company estimates of well productivity, and also spread much of the well cost over as much as a 50 year period.
For income tax purposes, shale companies expense all intangible drilling costs (non-equipment) and in 2018 were also able to expense almost all equipment costs too. Therefore, shale companies have been accumulating large income tax losses and have been paying little to no income taxes.
In theory, shale will someday pay income taxes, but that is dependent on well productivity plus an eventual slowdown in CAPEX. Of course, higher oil and natural gas prices would also make a tremendous difference.
I have also argued that tax law changes could really hurt shale (and our conventional company too – to a lesser extent).
Democratic Party majorities and a Democratic President could end IDC expensing. Requiring intangible drilling to be taken over the life of the well would greatly increase shale taxable income. We still haven’t drilled a new well since 2014. However, assuming prices do increase enough, we will again someday. Losing IDC expensing would affect our decision.
Of course, we are much more worried about losing the percentage depletion deduction, which is the “tax break” which helps small producers. It is limited to the first 1,000 BOEPD and limited to independent producers.
Finally, the rate at which NOL’s may be carried forward and offset future profits could greatly affect shale. Currently net operating losses may be carried forward indefinitely but can only offset up to 80% of net income, which is another change. These apply to post 2017 NOL only. 2017 and prior can only be carried forward twenty years and can offset 100% of income.
2018 was a decent year for most stripper producers (unless they have a lot of debt). However stripper producers likely didn’t grow much, more than likely saw production decline at a low rate as vertical well drilling is at multi-decade lows.
Shale companies registered very high net operating losses as they spent greatly over cash flow to grow US production by around 2 million BOPD.
NOL’s are reported on company 1120 Federal Income Tax Returns. I say look at tax return figures whenever possible when analyzing any company, especially US E & P’s.
SS you may or may not have ever encountered this, but for personal income taxes capital loss carryforwards have no time limit.
Some smart folks harvested capital losses during the financial crisis in 2008 and these still exist. They can be used to offset $3,000 of income where that income is of the ordinary sort, meaning not capital gains, each year until the loss is used up. Or if capital gains are achieved in a given year, the past carried forward capital loss can reduce that capital gain until the loss is used up.
A bit similar to operating loss carryforwards. Thus there is precedent.
Watcher.
I am aware of capital losses being offset against ordinary income as you have described.
What I am pointing out is nothing new, although the NOL carryforward rules were recently modified by the new tax law which was most noteworthy for lowering corporate rates and also for greatly limiting the SALT deduction on Schedule A for individuals.
I went back and looked at some older 10K for US E & P pre shale boom. There were NOL sometimes, but nothing even close to the magnitude of what has been incurred the past four years.
US E & P corporate taxes are complex. When you compare the tax accounting to GAAP accounting, there are major differences.
Incurring NOLs in E & P doesn’t necessarily mean the business is not making money if it is growing quickly. It will be interesting to see how this shakes out in future years.
Net operating losses aren’t just being incurred by shale. They are present in coal, wind and solar. Tesla has something like $7 billion of NOL carryforwards as of 12/31/2018.
For a variety of reasons, energy producers are incurring net operating losses.
Good for consumers, but they cannot go on forever.
Was wondering if anyone had seen this development… apparently a sizable quantity of oil was reportedly discovered in the Golan Heights region. This fellow Martin Armstrong alleges that there is more oil in the Golan Heights than all of Saudi Arabia…(?)
https://www.armstrongeconomics.com/international-news/middle_east/is-there-really-more-oil-in-the-golan-heights-than-is-saudi-arabia/
I find this very hard to believe…
Sometimes it’s hard to believe charlatans…
Or, probably, the reference is to olive oil.
http://www.zimmer.co.il/c/en/default.asp?siteID=2797
Mike-
“I find this very hard to believe…”
Thats good, trust your instinct.
Its just high ground. Good place for artillery aimed towards the farms below. Drops 300o ft in 7 miles.
Thanks! Rystad Energy also claims that the “2016 wells” gave super profit. Is it possible they have an agenda if their comments are all wrong?
It’s called “talking your book.” As an industry service company collecting fees, they benefit directly from more capital sloshing around in the industry. So talk it up to make it look like a better investment.
Wall Street at large is seeing this quite differently. See terrible stock price & performance vs. the supermajor oil companies and the recent crackdown on lending/placement. Market says “this is a bad industry with no hope of profitablity.”
Thanks! I always get good answers in here!
Baker Hughes rig count still shows Kansas with zero rigs running. December oil production in Kansas was down to 91K BOPD per EIA, a low not seen since the aftermath of the 1998 price crash.
Interesting view related the EIA short term production forcast. They predict Norway will increase production, well the truth is some new fields will come in production , but the decline from exsisting fields is also significant becausea long period with limited investment think production will much be the same. The exsploration rate is increasing and that is good as last year only 15% of resourses pumped up was added with new resourses. The shale oil production acc. to Rystad will continue to increase as it have done for years , and they predict oil majours like Shevron , Exoon will make that happen. Well first off all there is a majour change, so far this increase have been done by depth. All loss carried forward have been borrowed money and thoose investors have lost confidence in shale. In such environment and with climat focus interest of capital will increase that in addition will reduce free capital for exspansion. I believe what we see.now WTI 50-60 usd / bbl is what wil be the situation in 2019 , 2020 as the world economy is weak caused by trade war , lack of growth in emerging economies. A good sign is Baker Huges rig count , this shows active oil riggs in shale is continue to go down, soon the best DUC are taken, compleated than there will be decline in US shale oil, if it recover will be related to oil price that CEO Mark Papa told need to be 75 USD WTI or above.
Thanks for the analysis Freddy, I find it quite interesting.
On another point, this post has been up over two days and you are the first to comment on it. There has to be a message somewhere in that, I am just not sure what it is.
Ron,
Good post. My comments on longer term EIA forecast in AEO were intended to simply add to your analysis which was excellent. Often when others agree with what you have said there is not much that needs to be said.
Or that’s how I interpret it.
Ron and Dennis,
Thanks very much for keeping up the website. For what it is worth I appreciate seeing the charts. It might end up being more interesting to keep this EIA forecast (March 2019) and evaluate how close the actual production they report ends up being over the next year? Regards,
Regarding Norway and short time increase, its as simple as johan sverdrup coming online this year and as it looks a bit ahead of original plan. First phase will ramp up to 440.000 boepd and second to 660.000 boepd witch for sure will be faster than underlaying decline in old and current producing assets.
In other Norwegian news looks like Equinor have struck hydrocarbons in an exploration well close to russian border. This is a mayor structure and a major find needs to happen if it should be viable for developing imo.
They have not really announced it yet, operation has been prolonged from original schedule with an extra month while already at TD.
EIA projections are profoundly flawed, being the only question if they are aware of it or if they actually believe their own shit.
Increased production is driven by relatively high or increasing oil prices that signal increased demand, OR by the need of producers to maintain income at the expense of other producers when prices fall as it happened between mid-2014 to late 2015.
The second case is difficult to take place when oil prices are relatively low, as now, and when there are agreements between producers to limit production to sustain prices, as now. Therefore EIA is projecting an oil price increase amid general economic weakness, a trade war, Chinese ongoing slowdown, and so on. The economy is not signaling any urgency about oil supply after the Iran sanctions have taken place without much effect. Prices are not going to sustain an increase in oil production unless something unforeseen takes place, and such event cannot be included in EIA forecast.
According to Art Berman presentation about the 2018 price collapse the markets are signalling $60/b oil for 2019-2020 with $10 price excursions. If he is correct we will not see an increase in oil production, and might even see a slight decrease as Venezuela continues its fast descent to near zero oil production. Everybody knows that a country that came to depend almost exclusively on oil will implode when its oil production collapses, the only question being how the implosion will look and what will be the final death toll.
Not sure which markets Art is referring to when he said markets are signalling $60/B oil for 2019-2020 with $10 price ecrusions. But nothing trades in a complete vacuum. If you really want to know where prices are headed you have to look at a bunch of different markets and price charts to determine which way markets are headed.
https://tradingeconomics.com/ndx:ind
Useful little tool for anybody that doesn’t trade and have up to date access on price on anything and everything but would like to.
Check out the NASDAQ-100. Which is Banks, insurances firms,brokerage houses and mortgage companies. Pull up the weekly candlestick chart and you’ll find are very large bearish shooting star at the close of last week. This is very,very i could say very a thousand times, bearish for US stock markets.
Check out WTI oil and everything else while you are there. Bearish shooting star there as well.
US treasuries, the Dollar and Japanese Yen will be the so called safe havens. Yen will gain on everything including the dollar as this plays out. Dollar will gain on everything besides the Yen.
MR. market is pointing towards a not so bright immediate future. This isn’t months away it’s now.
I could make the case a extended period of sub $20 oil is coming.
But will leave it as i believe $20 oil will be visited. So i don’t upset the crowd who believes otherwise. 🙂
One more thing i’d be more than ecstatic if things were going the other direction. They just aren’t.
Good spot. Definite a shooting star on the NAS100 weekly chart. But i think you need to get the confirmation next week maybe ?
It’s a shooting star sitting right on top of one of the greatest run ups your ever going to see over a 3 month period. 3m-10year just inverted. I’ve been doing this a long time 20+ years. Chances of it not confirming are next to zero.
Are you shorting the market? If you are right, lots of money to be made.
Iron Mike,
This isn’t a trading website so i’m not going to discuss what i may or may not be doing trading wise.
I just wanted to give a different point of view of price from a traders point of view. Just share what i’m seeing. Because assumptions on price are everything when your projecting Peak Oil
I think my internet must be broken, but I thought I saw oil with a slight gain today. The chances of this were next to zero! When you say “next to” do you mean, like within the same galaxy?
So with sub $20 oil you are assuming demand decreases like it did in 2008-09 time frame, only more significantly?
So we are headed for a worldwide economic depression?
For producers sub $20 is extreme, especially for an extended period, as you are predicting. There were will a tremendous shock in the US high yield market as well as the US stock market.
Shallow,
We could very well find ourselves over supplied even at $20.
HHH,
Yes this is not a trading site. Using charts to predict the future simply doesn’t work, if it did the market would quickly eliminate any gains.
$20/b might occur in 2050, not before for any 12 month period unless there is a Worldwide depression similar in magnitude to the Great Depression.
If governments worldwide follow the nonsensical policies followed by the European Union in response to the GFC (where fiscal austerity ruled the day), then we could indeed see a catastrophic economic result similar to the US economic response when Herbert Hoover followed similar policies. Those who believe a market economy is self correcting are correct in the long run, but as Keynes famously said, “In the long run, we are all dead…”
Government intervention in the economy is not a socialist plot, on the contrary, Keynes believed it was necessary for capitalism to survive and would prevent a socialist revolution.
Dennis,
Do you care to wager that charts can’t tell you where price is going? I know for a fact they can and people who know how to do it do it all the time.
How about your Tesla? Against a couple of hundred grand?
Or maybe something friendlier like maybe you just admitting that your were wrong and got schooled.
You’d have to come up with some new charts though to fit what low price will mean for oil production.
I’m actually trying to help you get the story right about peak oil. By helping you get price right.
Guess we will see what happens over next couple of years.
In my opinion 20$ oil is a trigger for 200$ oil – at least if it’s longer than a few weeks before rocketing up again.
20$ oil will take out shale (there are less class A++ fields left than last down turn), and during changing the owner of the companies no one will invest.
20$ oil will “regime change” some other producing oil countries, in Venezuela style. Perhaps Iraq -5mb/day in short time.
And 20$ oil will let consumption high, even in a strong economic down turn. Simply by being too cheap.
And it will kill off any investing in offshore oil, and questioning existing fields.
Do you care to wager that charts can’t tell you where price is going? I know for a fact they can and people who know how to do it do it all the time.
Really now? If they can do it all the time then they can, very quickly, become multimillionaires playing the oil futures market. Trying to guess which way oil prices are going are what traders do. And they use charts and every other tool at their disposal. Some of them make a little money and some of them lose money. But none of them are becoming multimillionaires by playing the oil futures market.
Ron,
It’s not a guess when you wait on the market to tell you what it’s going to do. And it always does if your patient enough to wait on it to tell you and also know where to look and why. Day traders tend to lose more often than not. Because they have the need to make money right away.
NASDAQ-100 is going to lead the way this go around. It’s not as obvious elsewhere yet. In order to be successful trading oil futures. You got to know how to trade every other asset class out there. Trading doesn’t happen in a vacuum. You can’t just be an oil futures trader and be successful. Not successful long term at least.
Go look at WTI, gasoline, heating oil, charts. They are all somewhat similar. Yet different. How do i know all three are headed south. If you looked just at gasoline and the run up it’s been on. You probably think that will continue if you look a certain data sets that pertain just to the price of gasoline. But you’d be wrong because you’re basically looking through a microscope when you should be looking through a telescope.
Your not seeing the asteroid that is coming that is going to screw up what you believed to be true if inventories and production are the only things an oil trader is looking at.
Day traders tend to lose more often than not. Because they have the need to make money right away.
HHH, Who brought up day traders? Obviously, charts can never tell you what is going to happen today, or in the next few hours. Charts can only indicate the long-term trend, if anything.
But they cannot even do that. Most oil traders trade longer term, they are not day traders. They look at the charts and try to guess where oil will be next week, next month, the next few months or next year. And if they could do that, they would all be multimillionaires. Traders who use charts are right about half the time. The other half they are dead wrong.
Charts cannot tell you the future of oil prices. End of story.
Ron,
they don’t simply trade only against other traders – they are the counterpart for oil hedging, too. They hold the other side when shale companies try to hedge.
And most traders trade for big banks. They are making billions, as you said. For example Goldman Sachs alone 10 billions last year. Most is earned trading the stock / bonds / commodities markets. Futures are one tool to trade these markets.
Eulenspiegel, I know all that. I was a stock and commodities broker for all of about six months. But the word “stockbroker” is just another word for “salesman”. I was not much of a salesman so I left the business and got back into computer hardware.
If you think banks are making millions trading oil futures, you are dead wrong. Banks hedge their bets just like oil producers or oil consumers do.
Yes, banks earn big bucks. But they do not earn billion trading oil futures. If you believe that then you are dead wrong. Banks try never to be gamblers. Though the real estate loans they make are always somewhat of a gamble. But trading naked futures is always a gamble. Hedging is a different story.
Banks earn their money by lending money at a higher interest rate than they pay depositors. They loan other people’s money and pocket the difference.
Some banks do computer trading. I have explained how that works but I will go over it once again. Computer programs watch for a difference between stock futures and the physical stocks. When the gap gets great enough, that triggers a buy of the one that is high and a selling program of the one that is low. That is, they either buy or sell a basket of stocks representing the futures programs they buy or sell. Then as soon as the gap closes, they unload both positions. It sometimes happens in a matter of seconds or minutes.
But banks only do this with equities because the exchanges trade both the physical equinity and futures of that equinity. Physical commodities are not traded on any exchange, only the futures are traded.
Banks do not make very much money betting on which way the market will move, whether that be stocks or commodity futures.
Ron,
Sorry but you have no idea what trading is if you believe people can’t use a chart to tell you where price is going. I’ve been doing it for 20+ years and making a really good living doing it. I only trade major turns in markets.
I can also tell you every principle that make ‘s trading what it is works today just like i did 20 years ago or so. CB’s didn’t change a damn thing when it comes to reading a chart. And neither did HFT machines.
Charts are saying US stock markets including the dow, s@p500 and NASDAQ-100 and multiple other stock index’s are at very least going to put in a 35%-40% correction starting next week when the NASDAQ-100 technically runs out of room to run any higher than it is. PERIOD!
Which implies a 35% to 40% correction for the Dow and S&P 500.
Go long on CL futures be all means if you believe oil can rally. While the most important stock index in the world is having a 35%-40% correction.
One more thing you need to consider. Dow is project a move back to 18,500-18,000 currently. Could be lower depending on where the neckline of the head and shoulders is broken. My best guess is it will technically break the neckline in NOV or DEC of this year as we are at the peak of the right shoulder at the moment. It could be next year. If i’m shorting the DOW that is exactly where i’m taking profit. Based on a measured move lower from the current head and shoulders it’s trading in.
How on earth does that happen when CB’s are all in with monetary policy? Charts aren’t wrong and neither are my technical breakdowns of them.
HHH,
You can simply bet against all the other chart readers, let me know when you get to a billion. 🙂
Should be easy money. I will keep mine, I am not a gambler.
HHH,
You can tell me I have been schooled if Brent trades at a 12 month trailing average price of $20.00/b or less in 2018 US$ before December 31, 2030. Is that the bet you are willing to make? Might be some easy money in it for me. 🙂
$20 oil will CRUSH any exploration and development and NOBODY will spend a dollar on CAPEX.
No Questions Asked.
A short-term high for consumers but a worse cataclysm than 2015…
I am in Central TX, (Bryan/College Station) and remember well the 1980’s crash and of course 2015-18.
The offshore oil exploration company I work for here was saved by a TGS contract during that sh+t show.
We are now so swamped with jobs it is stupid.
Not enough boats or people worldwide- (NEW , unused fleets were cut up for scrap) and honestly a dozen people I personally know ( some family members) either retired or went to other technical fields.
They have all refused offers to come back….
Please remember, we are already 3 years behind on Explorati0n and Development and we are just starting to see the ramifications of that 3 year worldwide “vacation”.
Oh, and IMO 2020 is rolling in. Not a problem for us as we have to use .5ppm diesel anyway….
Plus all the other Producer Countries with their own personal problems….
Yessir, gonna be a wild show.
I was /am no fan of Jimmy Carter but the world should have listened to him back in 1977.
That old grasshopper/ant fable comes to mind…
A lot of lost years since then, would have been nice to develop alternates before it got scary.
But that is what Humans do…
Silly creatures….
Interesting how the service firms are all swamped yet are mostly on the brink of BK, based on how the shares are trading.
I started to pay attention to oil during the Carter years. We could have had a very manageable transition to alternative options to oil if we had used those decades to plan for it.
Instead, we’re going to have significantly more disruption when we can’t keep our petroleum consumption at current levels.
Re shale financing . . . Folks should go and read financial articles from Wednesday afternoon of this week.
The Fed basically took a sledgehammer to their dot charts. In the ongoing desire on their part to be transparent they have, until Wed., projected their expectations for increases to short-term rates over the next two years to be 4 increases this year and 4 next year.
As of Wednesday, that’s all gone. The new dot chart says zero increases this year and at most 1 next year. The 10-year treasury immediately cratered its yield to 2.5something percent. Still falling. Overseas we see Germany tracking, and Japan, and more and more maturities on their yield curves return to negative. Not just real negative. Outright nominal negative. This is something that Financial media does not talk about. Negative nominal interest rates from major country government bonds. How could they talk about it? It is utterly obvious that this specific reality demonstrates that the entirety of all analyses has no meaning. Their only defense is silence. Shale would prefer that it stay that way.
The Fed also announced an end to balance sheet normalization, which is euphemism for trying to get rid of all of those bonds and MBS that were purchased as part of QE. They are ending their purchases late this year. They dare not continue the move towards normal. I believe that leaves their balance sheet still holding in excess of 3 trillion. That’s not normalization, sports fans. And it has been TEN YEARS.They havent been able to get to “normal” in ten years, and as of Wed, they will stop trying.
The Treasury notes are the underlying basis for what shale companies have to pay to borrow money. Thoughts by folks here that the monetary gravy train will shut off shale drilling need rethinking. Bernanke changed everything. Forever. These Fed actions are indistinguishable from whimsy. Imagining that Powell is Peak Oil cognizant and is focused on shale is a tad extreme, but only a tad. I recall a Bernanke quote during the crisis that made clear he knew what Peak would mean — at any price.
When US Equities are well on their way south US treasury yields will also join the negative club. But oil will also be $20. Not saying that oil can’t keep coming out of shale but there will new owners. Entirely new owners. As all the debt gets wiped out.
EEK!
Probably true.
My suspicion is if oil keeps pumping at $20 the owners will be the US Gov….
I would sure hate to lose our Royalties if the Feds nationalize oil at the “Request and Convenience of the Government”.
Had that personally happen to one of my enlistments back in the day…
I sure like our monthly minerals’ check…..
“When US Equities are well on their way south US treasury yields will also join the negative club. But oil will also be $20”
I don’t believe Oil will fall much anymore. Oil prices were kept in check by the rising dollar. Now that the Fed is no longer hiking, and probably will be cutting rates soon, its likely Oil prices will start rising again. I think we probably will see some short dips in energy and Stocks, but once the Fed cuts or does more QE, prices will climb back.
I’ve also noticed that prices for everything are going up. We are back in stagflation with falling labor demand, but rising costs: materials, Food, imports, etc. My wild ass guess is that WTI will be higher in Dec 2019 than it is today.
Its possible that the Fed is now trapped: Rising inflation, but failing labor demand. Prices will likely increase as unemployment increases. My guess is Fed will let Inflation go unchecked in order to avoid another major recession. If this assessment turns out to be correct, Holding cash in USD is going to losing strategy.
FWIW: I don’t believe the number of job offerings reflect the real labor market. I think companies are keeping a lot of filled jobs posted due to extreme employee turn over rates. For instance retail job turnover rates are as high as 81% per year. Often worker quit after a few months or weeks. Thus it just makes sense for employers to keep the same jobs permanently listed, even if they have the position currently filled.
Nobody will be willing to drill new wells in tight oil plays at $20/b and all the investors who have lost money due to bankruptcies will scare away other investors. Supply decreases more than any demand increase and oil prices increase. If oil prices reach $20/b which is doubtful it will be very short lived.
In June 2015 China was, according to EIA charts a few articles back ( http://peakoilbarrel.com/eias-data-for-world-and-non-opec-oil-production/ ), producing about 4.4 million barrels a day. By October 2016 they had dropped to about 3.8 million and have been holding fairly steady ever since. I’m curious if those here might think that China is a good case study, so to speak, and that a relatively sudden drop is possible in other oil producing regions. To put it mildly, I’m not a petroleum geologist. I’m curious if OPEC Middle East, for example, might experience a decline of similar proportions over a similar time frame, that is a decline of 13% or so, over a year and a bit? Do any post peak production profiles give insight into the potential post peak production profiles for OPEC Middle East?
FWIW I really liked these stacked graphs.
http://crudeoilpeak.info/latest-graphs
Perhaps a new one will be out soon. In the first graph the top six in the stack are USA Iraq Canada Russia Brazil & KSA. To Ron’s point, it seems to me that once increases from that group of 6 can no longer offset declines from everyone else in the world, then the oil peaks.
Interesting observation Survivalist.
Dittmar https://link.springer.com/article/10.1007/s41247-016-0007-7
noticed a 3% per year decline for 5 years followed by a 6% per year decline
in Indonesia, Mexico, and the North Sea. The decline in North Sea production
ceased around 2013.
I think that oil production is an economic phenomenon, so I do not think
this is a question for petroleum engineers, it is a question for investors.
I think that the reason we have not seen peak oil yet is because so much
money has been created to invest in oil production (when we speak of
investment, we are speaking about money
creation) https://truthout.org/articles/global-banks-invested-1-9-trillion-in-fossil-fuels-since-paris-climate-pact/.
Investors are under the false impression that a shortage of a commodity
which is vital to the economy leads to higher prices. Empirically this is
not true. I have been reading Graeber’s book on the history of debt. Each
time there is a famine, farmers cease making money.
I will tell you what the end looks like: either investors pull their money
because they lose confidence, or we continue money creation to produce oil
until inflation causes the workers to quit. That is the end of any resource
extraction industry, that’s why there are 60,000 abandoned mines in
Australia. Both phenomena can be observed in Venezuela. Oil production
crashing because investors have pulled out and workers quitting because their
salaries can no longer feed the family.
Thanks for the Reply and the insight, I appreciate it.
Schinzy,
Inflation is caused by excess aggregate demand with properly managed money supply.
So far there is very little evidence of inflation in the OECD (and most other nations).
Most of the expansion of debt at the World level has been in emerging and other non-OECD nations as there has been better access to credit markets.
Colombia is going to try fracking
2019-03-08 (Reuters) Fracking could nearly triple Colombia oil and gas reserves: minister
Exxon Mobil, Conoco Phillips, Parex and state-run oil company Ecopetrol are among those seeking to operate in the six blocs, Mines and Energy Minister Maria Fernanda Suarez said in an interview late on Thursday, without identifying the fifth company.
“We have 5.7 years of crude reserves and 11 years of gas reserves. Our estimates say that with unconventional deposits we could have 30 years of gas and 15 years of crude.”
https://www.reuters.com/article/us-colombia-energy/fracking-could-nearly-triple-colombia-oil-and-gas-reserves-minister-idUSKCN1QP1OO
MinEnergy Bogotá DC March 19, 2019. The average crude production during the month of February was 892,530 barrels average day
Buying or selling oil futures, or can you predict the future price.
I am putting this here because it deals with the future of oil prices, though it could be applied to any commodity. Some folks seem to think that “the experts” by looking at charts, can predict the future of oil prices. They cannot.
As I have posted before I was once a commodities broker. I bought and sold commodity futures for other people. I never made them very much money however. No one ever makes much money trading naked futures. I have listed below 11 professional futures trading advisors. Eleven of the very best. Only one of them has averaged over 1% per year before commissions. One could do far better buying CDs.
Trading naked futures, that is unhedged futures positions, is a pure gamble, nothing more. Those who are very good at this can make millions. However, I have never heard of any such person or organization that was successful in doing this.
Commodity Trading Advisors
Jack Bogle was not just right, he was broadly right. This is the first time I’ve seen active management trashed outside equities. Good data.
Watcher, I am not sure what you are driving at. John Bogle was an investment manager, not a gambler. He founded Vanguard, a mutual funds management company. He was also the first to champion index investment. That is buy funds that reflect the stock market index. He was the furthest thing from a naked futures gambler.
Missed the point. Bogle’s index approach was far more powerful than the marketing brochures.
If an active manager tries to pick stocks and outperform an index, he has to pick stocks not just better than the index, but better than the index PLUS his salary.
And Bogle wanted the world to invest via index funds, absent active (paid) management.
Per your comment, active picking of commodities didn’t work, either.
But what most people do not dig into is the concept of variance capture. The larger the active manager’s portfolio, the more variance of the underlying index he will capture. This is further drag on his attempt to outperform. He faces not just his costs, but also variance capture. The sigma of the index will be tapped into by whatever he chooses. It will constantly be a mathematical drag on his pursuit of alpha.
2019-03-25 (Schlumberger) Kibsgaard Speaks at Scotia Howard Weil 2019 Energy Conference
… in North America land, higher cost of capital, lower borrowing capacity, and investors looking for capital discipline and increased returns suggest that future E&P investments will likely be at levels dictated by free cash flow. Based on this, we expect E&P investment levels in North America land to be down more than 10% in 2019 versus 2018.
In addition to the impact of lower investments, US shale production is also facing increasing technical challenges; as infill drilling creates interference between parent and child wells, as drilling steadily steps out from the core Tier 1 acreage, as the growth in lateral length and proppant per stage is starting to plateau, and as increased light oil production impacts domestic refining capacity.
All these factors point to a more a moderate production growth from US shale in the coming years.
https://www.slb.com/news/presentations/2019/2019-03-25-kibsgaard-howard-weil.aspx
US LTO production growth forecast by Goldman Sachs
GS chart: https://pbs.twimg.com/media/D2a_dE1UYAA1Iqe.jpg
Oil Majors US LTO production forecast (XOM, CVX, RDS, BP)
HSBC chart: https://pbs.twimg.com/media/D2gt9yJXcAAU1k3.jpg
The Goldman Sachs estimate is a bit too optimistic, they predict about a 5.8 Mb/d increase in US tight oil output from 2019 to 2025 with a maximum annual output of 12.3 Mb/d in 2025, in 2018 average annual US tight oil output was 6465 kb/d, I expect the peak will be about 10.9 Mb/d in 2025, an increase of about 4.4 Mb/d from 2019 to 2025.
It is possible the majors will increase output, but they will mostly just take market share from the weaker independent tight oil producers.
2019-03-19 (S&P Platts Global) Libya’s crude oil production has recovered to 1.2 million b/d but the OPEC producer has the ability to increase output to 1.4 million b/d this year “if the security situation remains stable” the chairman of state-owned National Oil Corporation told S&P Global Platts Tuesday.
NOC’s focus will also be on recommissioning all essential oil service companies, drilling and workover contractors in order to restore all existing shut-in wells and rehabilitate surface facilities. NOC has over 400 shut-in wells that require minor and major works.
“Bringing these wells back online and enhancing existing production through infill drilling will significantly add to our production outlook,” Sanalla added.
https://www.spglobal.com/platts/en/market-insights/latest-news/oil/031919-interview-libyan-oil-output-could-reach-14-million-b-d-if-security-holds-sanalla
Libya’s crude oil production was 0.9 million b/d in February
Chart https://pbs.twimg.com/media/D2g1bPlWkAAlxt4.png
March 15, 2019 (Rystad Energy) Offshore decline rates started to increase in 2016, and have continued to increase over the last two years. And reached almost 10% last year. A key reason for the increased decline rates, is the lower infill activity. Since 2015 the infill activity has dropped ~33%.
Bar chart https://pbs.twimg.com/media/D1r7v2HWsAAd6rj.jpg
Rystad Energy on Twitter: https://twitter.com/RystadEnergy
The STEO production forecast – this does make me think that it’s easy to forecast production additions, just by reading the press releases. But it must be much more difficult to forecast declines, all oil fields will come off plateau sometime but when? So knowing the net change in a year or two is difficult?
EIA STEO Table 3b. Non-OPEC Petroleum and Other Liquids Supply
Forecast for production change over two years from Dec2018 to Dec2020
United States +2.48
Brazil +0.6 (new FPSOs?)
Norway +0.3 (Johan Sverdrup?)
Australia +0.13 (probably NGLs?)
Qatar +0.13 (probably NGLs?)
Indonesia -0.11
The big shocker here is Russia. Up 70,000 barrels per day over two years. That’s six tenths of one percent over December 2018 production. It could just as easily be down that much. They are basically saying that Russia has peaked.
And they have the US up two and a half million barrels per day. That has to be a best case scenario. Anyway I have very serious doubts about that one. Ditto for Brazil. Everything must go just perfect for brazil to be up 600,000 barrels per day in two years. OPEC expects Brazilian production to grow by 360,000 bpd.
I think they probably have Canada pretty close.
Re above, oil and the Golan Heights
http://cdn.intechopen.com/pdfs/24550/InTech-Late_proterozoic_paleozoic_geology_of_the_golan_heights_and_its_relation_to_the_surrounding_arabian_platform.pdf
This is dated long before any recent attempts at hype or rumor. It doesn’t suggest any oil, and it’s pretty thorough.
Watcher,
It’s a good descriptive piece. It will tell an E&P company what’s down there in general terms with ages and thicknesses of the units and the kinds of deformation they’ve undergone. The maps and cross sections would go on the lab wall for reference along with similar work for the surrounding region, to give context.
What the company will need next is detailed lithologies. Drilling and seismic is in order, more of it and in detail.
My humble opinion.
I think the focus of the paper is the degree to which the geology is similar to northern Jordan and Israel. Where presumably exploratories were already drilled.
Watcher,
Yes, the paper draws on data from drilling in Jordan and I think Israel. You try to extrapolate from surrounding areas when you can, to help you know where to aim, but the oil that counts is what you find with the drill bit.
It isn’t an oil-oriented paper, just a straight report on the regional geology.
2019-03-26 The IEA’s Global Energy and CO2 Status report
Global energy consumption in 2018 increased at nearly twice the average rate of growth since 2010, driven by a robust global economy and higher heating and cooling needs in some parts of the world. Demand for all fuels increased, led by natural gas, even as solar and wind posted double digit growth. Higher electricity demand was responsible for over half of the growth in energy needs.
The full report is online: https://www.iea.org/k3k0/
This is a clip from an article at Bloomberg
A Flood of U.S. Oil Exports Is Coming
Javier BlasMarch 26, 2019, 12:01 AM EDT
Oil trader Paul Vega is at the vanguard of shale’s next revolution.
Driving his pick-up truck through the heartland of the Permian basin — the vast tract of west Texas scrub where one of history’s greatest oil booms means miles-long traffic jams — Vega says there’s more crude being pumped than America’s refineries can absorb. Today, the primary task of trading houses like his is getting the stuff overseas.
“We buy it, we truck it, we put it on a pipeline, and there it goes to the port — and from there to the world,” said Vega, who heads the office of global commodities trader Trafigura Group in Midland, the region’s oil industry hub.
What started as an American phenomenon is now being felt around the world as U.S. oil exports surge to levels unthinkable only a few years ago. The flow of crude will keep growing over the next few years with huge consequences for the oil industry, global politics and even whole economies. OPEC, for example, will face challenges keeping oil prices high, while Washington has a new, and potent, diplomatic weapon.
American oil exports stepped up a gear last year, jumping more than 70 percent to just over 2 million barrels a day, according to government data. Over the past four weeks, U.S. oil exports have averaged more than 3 million barrels a day — more than what Middle East petro-state Kuwait sells.
Ovi
That referenced article could be a sobering, highly informative read for anyone following the hydrocarbon world.
The amount of oil yet to be unleashed via fracturing/horizontal drilling is simply vast.
A few years on, the even larger amounts of natgas to be extracted, consumed, exported by way of ‘unconventional’ methods will transform the world as we now know it.
Coffeeguyzz,
The amount of oil will depend on the price of oil, if the EIA’s AEO 2018 reference oil price scenario proves correct and the USGS mean TRR estimate for US tight oil also proves correct, then US tight oil output will be about 90 Gb, this is a drop in the bucket of World resources of about 1800 Gb (about 5% of the total resource). Perhaps the NGLs from shale gas will be “vast”, but that doesn’t really help much with transportation and will be expensive to implement widely for the vehicle fleet.
Eventually natural gas will stop growing very quickly and prices may increase. As natural gas prices rise and wind and solar costs continue to fall natural gas may no longer be able to compete in the electric power business.
Do any of the shale gas focused companies actually have positive GAAP earnings?
Cabot net income -431 million for past 3 years
Chesapeake net income -3327 million for past 3 years
Range Resources -1940 million for past 3 years
These were the top 3 producers in the Marcellus in 2018
EQT net income was -1525 million for past 3 years
Southwestern Energy net income was -1401 million for past 3 years
These were producers 4 and 5 in the Marcellus.
Combined net income for the top 5 Marcellus producers for the past 3 years was
-8624 million so not a lot of profit at least for the largest producers.
Eventually these companies will need to turn a profit or they will find nobody is willing to lend them more money, higher natural gas prices would help.
EIA Monthly Energy Review statistics updated to December
https://www.eia.gov/totalenergy/data/monthly/index.php
World crude oil production
Chart https://pbs.twimg.com/media/D2mLcheXcAAWNcJ.png
The change in crude oil production over the last 10 years
(from the 2010 full year average to December 2018
Bar chart: https://pbs.twimg.com/media/D2mML1FX4AEaTBz.png
10 year change for OPEC countries, these statistics include gas condensate which is not included in the OPEC MOMR reports (without LPG)
Bar chart: https://pbs.twimg.com/media/D2mOIGoWwAIP7RK.png
Non-OPEC +7,42 kb/day
OPEC +1,714 kb/day
World +9,056 kb/day
EIA MER Table 11.2 Petroleum Consumption in OECD Countries
Average 2018: +307 kb/day increase from average 2017
December 2018: -1196 kb/day decrease from December 2017
Chart https://pbs.twimg.com/media/D2majLzXcAAqCAq.png
EIA MER Table 11.3 Petroleum Ending Stocks in OECD Countries
Chart: https://pbs.twimg.com/media/D2mbVp3XQAEzLRD.png
EIA MER annual data, 1982-2018. Average annual output increase of 810 kb/d each year.
What might help in not brokers but a graph of giants going offline due to lack of 150/barrel investment opportunities to keep pumping…aka CO2 injection?
https://www.rigzone.com/news/wire/shales_growing_pains_could_curb_us_oil_production-26-mar-2019-158457-article/
Seems now big Shale Companies is implemented decline rates of child wells and other cost related to well spacing in their budgets. WTI seems to have stabilaced at 50 usd range. Could it be a peak in 2019…?
Freddy,
From that article you linked:
Too close, and the child wells can turn out to be less prolific than their parent. But too far apart, and drillers can end up leaving oil in the ground.
Over time companies will figure out the optimal spacing so that it is “just right” and will maximize output per dollar spent on the well’s D+C. I assume this optimum has been determined for most plays and that maximum average EUR per well has been reached in most plays by 2018. I expect sweet spots will run out of room and EUR will gradually decrease in 2019 for the Bakken and Eagle Ford and in 2023-2024 in most other US shale plays with new well EUR averages remaining constant in the “newer” plays from 2018-2023. Clearly this is only a guess, but if it is correct US tight oil will continue to increase from 2019 to 2025 and may enough to keep World C+C output from peaking until that time, much depends on oil prices which I expect will gradually rise to $87/b in 2018 $ by 2025, beyond that it will depend on the speed that the transition to EVs and other plugin vehicles occurs which could potentially limit demand by 2025 to 2030 if it occurs rapidly and might keep oil prices from rising beyond $87/b in 2018$ over the 2025-2035 period. After that we might see oil prices fall as oil demand might fall more quickly than oil supply, difficult to predict.
Dennis, what seems quite clear is so far shale revolution have been driven by increased depth , acc. to a studdy that was done among 40 Companies they had average 30.billion dollars in depth. Some of this is losses carried forward that mostely is borrowed. Now it seems reality have changed, Investors , banks dont want any more to borrow out capital or invest in exspansion. It means as the pioneer Mark Papa have told there is a growing consern. The other issue is related to geological constraints, they might get some more knowledge but at least todsy tjis is not solved. I agree 85 or 75 USD might give increase production and again more active riggs as huge number off wells need to be drilled to offset decline. Guess they are compleated lots of Ducs now since oilproduction seems stabile with some increase?. Hopefully banks and investors will fund new wells when the Ducs are used as acc. to Mark Papa a 50 usd WTI world gives no profit for exspansion. Offcourse it could be different but at the moment it seems riigs are shut down, Companies sending home staf, workers and wall street is not happy…
Freddy,
I agree $50/b at the refinery gate does not work, about $65/b is needed for breakeven, typically refinery gate prices track LLS or Brent in the US and exported oil can probably fetch the Brent price. So Brent is the proper benchmark rather than WTI. Given petroleum stock levels we are likely to see higher prices from May to Sept 2019. If we consider days of forward consumption for the OECD, in 4Q2018 it was about 92 days, similar to 2011 to 2014 levels when oil prices averaged about $114/b in 2017$ ($102/b to $121/b in 2017$ was the annual average price range over those 4 years.) Eventually the oil market will come to this realization, though it may take days of forward consumption reaching 90 days (perhaps in 2Q2019) before traders wake up.
Council on Foreign Relations (CFR)
The New Oil Darwinism
https://www.cfr.org/blog/new-oil-darwinism
Now they are producing permian oil for 15 $ / barrel – let’s see when the first company claims it can be done for 10 or 5.
Exxon, who claims this, wants to finance this operation with an global asset sale of 15 billion$. Why do they need this when they make 200% profit, and the heavy frontloaded shale oil would be able to grow from cash flow alone at this numbers? (well paying out during the first year).
Or, are this still only numbers in a power point investor presentation to keep hedge fonds calm?
Exxon as a supermajor can certainly get a lower cost of production for fracking than most operators. Way better financing options, better relationships with suppliers and service, etc.
They also have much more potential to massage accounting to say what they want it to say, legally. A quarter-trillion annual balance sheet with over $350 billion in assets can do things a small pure shale company can’t
Propoly,
Don’t believe the hype. When anyone says they can produce tight oil for $15/b a bunch of costs have been left out, essentially it is a lie pure and simple. It is possible their LOE is $15/b, but there are taxes, royalties, infrastructure and other overhead, land costs, well costs, etc.
The average 2017 Permian well needs a wellhead price of $65/b to break even, doesn’t matter if its Exxon/Mobil or Chevron, their average wells pretty match the basin wide average.
Mike Shellman and Shallow Sands have been telling us this for years, it is still true today.
Oh I don’t think the cost is anywhere near $15. That’s nonsense. But can they say it is in accounting such that that’s not an outright lie to investors? Probably.
It’s easy to see where it comes from.
An average Permian well produces 400k + somewhat barrels during it lifetime at the moment.
So they have drilling costs of somewhat more than 6 million $ per well and claim 15$.
All other costs are 0….
In other words, they are lying. Investor presentations always have fine print that says in essence, everything except the fine print is a lie.
My interpretation is this.
“We are selling assets so we can buy back stock, so we can get out of the oil business as best we can. But in order not to panic investors, we’re going to tell them that we’re going to make tons of money in the Permian, even though we probably won’t.”
https://www.reuters.com/article/us-chevron-outlook/chevron-exxon-take-turns-wooing-investors-with-shale-boasts-idUSKCN1QM1GD
Correction,
I redid my analysis for the average 2017 Permian basin well with new information from an oil pro at another blog. In the Midland Basin average well cost is about $8 million and at that well cost using a nominal annual discount rate of 10% we get a breakeven oil price of $50/b for the average Midland basin well (I have assumed the Midland Basin and Delaware basin wells in the Permian Basin have similar well profiles.)
For Chevron they have very low royalty payments and a relatively high net revenue interest of 95% (most other producers pay out about 25% of their revenue to royalties), this lower cost structure reduces Chevron’s breakeven cost to $46/b even in the Delaware basin where well cost is higher at $10 million per well.
In short, for the majors breakeven costs may be much less than $65/b at the wellhead, note that the refinery gate prices would be $5/b higher in both cases so $51/b for Chevron at the refinery gate and $55/b for XOM at the refinery gate, typically those prices track the LLS (Lousiana Light Sweet) oil price for most Gulf coast refineries (where the bulk of US crude is refined), any exported oil might follow the Brent price.
Venezuela blew out their power grid again, another multi-day nationwide blackout.
https://mobile.twitter.com/netblocks/status/1110839904165154817
Anyone have a link to the leaked IA document on the simplest path to regiem change?
Don’t hold your breath.
You will probably not survive—
Dennis,
There is inflation if you look for it in financial assets. For example my sister and brother in law bought a house in 1987 in Los Angeles for less than $100,000. They sold it last year for $1.5 million. The same is true of real estate prices in all financial centers: New York, London, Paris, etc. In fact, it is not the value of the house that increased, it is the value of the land.
I have my own conjecture as to why there is no concurrent inflation in other goods. But I would need a couple of pages to describe it.
A few years past peak oil I expect that either we have rampant inflation like in Venezuela, or money starts disappearing like in the former Soviet Union. When the Soviet Union collapsed, 90% of peoples savings suddenly disappeared.
Schinzy,
That is a supply and demand issue, there are desirable places to live such as Silicon Valley, Manhattan, or London where they are not making any more land. 🙂 In Omaha, Nebraska the inflation in housing values has been far lower.
Inflation typically is not based on land values, it is based on an average basket of consumer goods as you know. If we pick an unusual measure, I suppose we could find inflation or deflation, but I prefer standard measures.
https://fred.stlouisfed.org/series/FPCPITOTLZGUSA
https://fred.stlouisfed.org/series/FPCPITOTLZGEMU
https://fred.stlouisfed.org/series/FPCPITOTLZGCHN
https://fred.stlouisfed.org/series/FPCPITOTLZGJPN
Since 2000 the average annual rate of inflation for the OECD has been about 1.84% per year.
https://fred.stlouisfed.org/series/OECDCPGRLE01IXOBM
Dennis,
I would say that there are places where people with lots of money want to live. In my view money creation pumped into financial centers in specific geographic locations distorts pricing.
One can arbitrarily define one price rise as “inflation” and another price rise as “market forces”, but by doing so one loses understanding of the economy.
The fact that a higher portion of a worker’s salary is consecrated to housing in places where money concentrates leads me to believe that this worker will look for ways of decreasing energy expenses, and thus will tend to decrease oil prices.
Did rents rise in Venezuela before the economy began to collapse with oil production? In the Soviet Union? I don’t know. I wish I did. Neoclassic economic theory is my example of a beautiful but useless theory. You can’t use it to predict financial crises and you can’t use it to predict oil prices. What can you use it for? Economists are catching on to this. That’s why increasingly Prizes in honor of Alfred Nobel in economics are going to empirical economists. So I collect empirical evidence and try to make sense of it. To me, money creation and destruction are key to understanding how money flows in the economy and thus to understanding how it might stop flowing.
How about the price of farmland?
It has dropped some, and there are regional differences in the US. However, farmland prices are still very high despite grain prices being very weak.
Where I live farmland prices have dropped about 10% from the peak.
Oil lease prices, however, are down by over 1/2. A quality oil lease was selling for over $100K per flowing BOPD in 2013. Now under $50K per flowing BOPD. However, still much higher than in 2005, when $20-30K per flowing BOPD was the norm.
Again, many differences based on quality regarding quality for both. However, one has dropped much more than the other, and both are probably still too high in relation to commodity prices.
I think there is some idea that since commodity prices are cyclical and $90 oil and $6 corn are both very possible, buyers are willing to pay up.
There have been times with both farmland and oil where prices were so low that one could borrow 100% and easily be able to cash flow including debt service. Farmland was that way from the late 1980s to the early 2000s and oil leases saw the same in the early 2000s. Not on everything, of course, but seemed to work very well for us during those times.
Good point Shallow,
I think high farmland prices are also a symptom of money creation by central banks to support asset prices. In her book “Collusion¨ Nomi Prins says that central banks own $20 trillion of financial assets, about 10% of all financial assets, which they have bought with money created ex nihilo. Obviously this supports the price of all financial assets, because central banks are creating a huge market for financial assets. Investors are spreading their risk by buying farmland (even though farm bankruptcies are relatively high). I know people in charge of investment portfolios who have no idea what to buy. All asset classes are high by historical standards. So asset managers depend on central banks to make any money. In fact Nomi Prins was selling a stock picking program which detects what assets the central banks are buying so that essentially an investor can buy whatever the central banks are buying at the same time in the hopes that it will go up.
Schinzy,
The money creation mostly just resulted in a lower velocity of money and lower interest rates, financial assets have grown because there has been higher output (as in real GDP in constant dollars). Inflation has not really been an issue and it has always been defined in terms of a basket of consumer goods.
Neoclassical economics is not perfect, social science in general is a problem, no lab experiments are possible and knowledge of how society works changes how society works, a moving target is difficult to accurately portray. Marxian economics is no better with an arbitrary decision to use labor as a measure of value, capital could also be used, or apples, any good could be taken as an objective measure of value (see the work of P. Sraffa).
There are no perfect economic theories. Since 1974 money has been created from nothing, this is nothing new.
The very wealthy (those with net worth over 20 million for example), just keep sequestering most of the world wealth created over the past 5 decades. A bit has overflowed their buckets. That bit is what the rest of the world prosperity has been working off of.
Dennis Wrote:
“The money creation mostly just resulted in a lower velocity of money and lower interest rates”
Lower interests, or some process of lowering the burden of purchase increases the cost of an asset. If you can borrow twice the amount for a mortgage most people will buy a more costly property. It also drives up demand for assets and sellers react by increasing prices.
Ditto for student loans, Auto loans, and even furniture (financed by loans). Students buried themselves in student loan debt after the gov’t made it easier for students to borrow.
Tech guy,
Yes that is the point of increasing the money supply, to reduce interest rates and increase aggregate demand. The point is that inflation remained reasonable.
The student loan debt has been a problem because economic growth was not very good and salaries were not very high, despite attempts to increase economic output with aggressive monetary policy and relatively weak fiscal policy.
Dennis Wrote:
“The student loan debt has been a problem because economic growth was not very good and salaries were not very high, despite attempts to increase economic output with aggressive monetary policy and relatively weak fiscal policy.”
Nope. The economy has been always shifting, and so have salaries. When I when to college, the cost was low but the buildings were showing age & wear and there was little in convences & luxuries. When I visited in 2012 it was completely changes. Latte shops is most of the classroom buildings, elevators in all the door rooms, lots of new fancy exotic architecture buildings. Universities up the spending as money from students poured in.
Most kids didn’t bother researching which jobs & skill sets they needed. They went to school to party. They got barebones degrees in History\Psychology & liberal arts. None of those skills were in demand.
I work with some very large companies. in the US. There are staff shortages & there are almost no millennials, do to lack of skills or willing to do the jobs.
“Yes that is the point of increasing the money supply, to reduce interest rates and increase aggregate demand. The point is that inflation remained reasonable.”
Nope, all it did I drive up assets prices further & got people buried deep in debt. We are nearly back to square one, since the majority of consumers & business have reached their borrowing limits, and are having difficulting servicing their debt again. Fed & other Central banks are heading back to rate cuts and more QE to prop up failing economies.
Absurdly low interests is just line heroin. It does not cure a debt addiction it fuels it. You don’t cure an addict by making heroin easier to get, and you don’t solve debt with adding more debt. All it does is kick the can down the road. We are back where we started in 2008, until everyone is much deeper in debt. No doubt will see another round of QE and lower interest rates. but you cannot drop interest rates to zero and sooner or later the global economy will reach the end of the barrel.
Education is not a capital investment–
At least it wasn’t in the 1960’s.
If it is a capital investment, it is training.
We now have a “trained” proletariat.
Tech guy,
I disagree completely. Asset prices went up because the economy grew at about 5% per year (nominal terms) and the assets became more valuable. All of the things you said lower interest rates cause (buying more homes, cars, investing in factories, etc) results in an increase in income for the people employed building the homes, cars, and factories. If it does not happen (such as during a Depression) then the low interest rates have little positive effect on economic output.
You cannot have it both ways, either the borrowing occurs and aggregate demand increases or there is no borrowing and aggregate demand is unchanged.
Eventually any further reduction of interest rates (from 2% to 1%) might have little effect as credit worthy borrowers may not be able to borrow any more. Typically that limit would be reached at Debt to GDP of about 300% (total debt to non-financial sector from both the private and public sector). Most of the World has not reached that level according to BIS.
Dennis Wrote:
” disagree completely. Asset prices went up because the economy grew at about 5% per year (nominal terms) and the assets became more valuable. ”
Asset prices more than doubled since 2009. Far, Far greater than 5% per year, and no the US economy didn’t grow anywhere near 5% since 2009. At best its been bouncing around 3%, but that does reflect real inflation rates.
Dennis Wrote:
“Eventually any further reduction of interest rates (from 2% to 1%) might have little effect as credit worthy borrowers may not be able to borrow any more. Typically that limit would be reached at Debt to GDP of about 300% ”
World Debt to GDP is going to exceed 250% this year. Perhaps as high as 260% if a recession begins (or if we are already in a recession).
Bottom line: You don’t cure a debt problem with more debt!
U.S. Petroleum Balance Sheet
http://ir.eia.gov/wpsr/overview.pdf
Saxo Bank chart summary
https://pbs.twimg.com/media/D2rB1lJX4AAV6ON.png
Imports https://pbs.twimg.com/media/D2rCxoRWkAEig6d.png
This comes from “blog.pricegroup.com”
A new wrinkle on US LTO
Lights Out
Phil Flynn
“The supply side issues may look a bit cloudy in coming weeks, as the shutting down and reopening of the Houston Shipping Channel will cause delays and may in effect slow what had been record-breaking U.S. crude oil exports.
Yet some of that oil that the U.S. exported may be coming back. It appears that some Asian crude buyers have been rejecting some U.S. barrels of shale oil because they have been tainted. Bloomberg News reported that two refiners in South Korea — the top buyer of U.S. seaborne supply — have rejected cargoes from the Eagle Ford shale basin in recent months due to contamination that makes processing the oil difficult. Because of the way the shale is produced and transported and because it is so light, it picks up impurities rather easily.
Throughout its transit from pipes to tanks and onto vessels, foreign compounds from other fuel or chemicals for cleaning tanks or stabilizing material can leach into the supply and foul up refining equipment. While crude passes through a similar chain in the Middle East too, the risk of impurities is lower because each oil variety typically has its own designated infrastructure. In the case of American condensate, a type of ultra-light oil pumped in shale fields, cargoes can get pollutants such as “oxygenates, metals and cleaning agents,” said Sebastien Bailer, senior vice president at South Korea’s Hanwha Total Petrochemical Co. “That’s causing uncertainty around U.S. oil quality, unlike purchases from the Middle East, where quality is stable,” he said.
That was very interested news, as I remember Russian Gaz have same problems that will give lower price. Could be interested to see how this content have been during time as normaly it might increase, same problem might been seen in Permian but still lower content. But seems very strange as the exsporting Company use to take samples and buyer have a Spec.
Freddy,
Russia’s Ural crude too, in shipments to Europe.
This is funny:
Saudi oil giant Saudi Aramco is acquiring a 70% stake in the country’s petrochemical firm Saudi Arabian Basic Industries Corporation – or SABIC – from the country’s sovereign wealth fund, Aramco reported on its Twitter account shortly after Bloomberg leaked the news on Wednesday morning. The remaining 30% publicly traded shares in SABIC will not be part of the transaction.
Bernanke exposed the meaningless nature of the stuff. Too many people understand now. These guys bought it from themselves.
Ku-Maloob-Zaap – I had a quick look at Ku-Maloob-Zaap’s data, the percentage of nitrogen produced with the gas has been increasing at a faster rate through 2018. Nitrogen has been injected for years to increase oil recovery.
Ku-Maloob-Zaap https://pbs.twimg.com/media/D2sTOb0WkAIwEGu.png
Cantarell https://pbs.twimg.com/media/D2sSAIAX4AU4N81.png
Ku-Maloob-Zaap & Cantarell are both heavy oil and they make up most of the heavy oil in this chart
https://pbs.twimg.com/media/D2sVMasXgAIY5rP.png
The recent dip in crude oil production is probably due to maintenance or something? I guess it is too early to see a connection with increasing nitrogen?
negative price for natural gas in the Permian yesterday…
2019-03-28 (Bloomberg) natural gas at the Waha hub (near El Paso) fell to a fresh all time low of -$1.15 per mBtu
..Or in terms of BOE that the shale men like to use: 5.55*-1.15=-6.4 $/BOE.
What they lose on every BOE they make up for in volume, I guess.
Maybe someone should convert a crude export pipeline to carry gas, Oh wait..
EIA predictions of 2012 were very conservative.
https://www.eia.gov/todayinenergy/detail.php?id=4671
The IEA predictions were actually pretty good.
https://oilprice.com/Energy/Energy-General/Ten-Predictions-Made-by-the-IEAs-2012-World-Energy-Outlook.html
https://energy.economictimes.indiatimes.com/news/coal/indias-thermal-coal-consumption-to-reach-1076-mt-by-2022-23-crisil/65475033
Then we had people who did not have a clue of what they were talking about. There are those who find problems and no solutions and those who find solutions to problems.
http://theoildrum.com/node/7285
Yes the IEA got it right, this sounds like a recent headline rather than a forecast from 2012 = US oil production higher than Saudi Arabia …
Ten Predictions Made by the IEA’s 2012 World Energy Outlook
By Matt Smith – Nov 17, 2012
2) US oil production is set to surpass that of Saudi Arabia by 2020 to become the largest global oil producer (caveat: this will only likely be until the mid-2020s, when Saudi takes back this accolade)
https://oilprice.com/Energy/Energy-General/Ten-Predictions-Made-by-the-IEAs-2012-World-Energy-Outlook.html
(January 23, 2012) EIA AEO2012 domestic crude oil production to increase to 6.7 million barrels per day in 2020
https://www.eia.gov/todayinenergy/detail.php?id=4671
NO
The article was written in 2012 and based on the newly released WEO 2012.
I have just been looking at the full report and so much of it is very close to what is actually happening today. Including United States natural gas production, oil production.
Global CO2 production is unfortunately as high as was predicted.
Global coal consumption is between their 450 policy scenario and their New Policy scenario.
https://www.iea.org/media/weowebsite/energymodel/Methodology_450_Scenario.pdf
I think credit should be given where it is due.
MARCH 28, 2019 (Today In Energy) EIA’s Annual Energy Outlook 2019
https://www.eia.gov/todayinenergy/detail.php?id=38852
2019-03-28 (Twitter) Donald J. Trump@realDonaldTrump
Very important that OPEC increase the flow of Oil. World Markets are fragile, price of Oil getting too high. Thank you!
At least every of this twitter messages manages to lower oil price by about 2%. It’s like a speech of Yellen for the bond and stock market.
I’m not saying this will happen, but if US crude oil production were to decrease, would he stop tweeting about prices, even at higher prices?
(S&P Global Platts) The tweet comes as US Secretary of State Michael Pompeo is scheduled to meet Thursday morning in Washington with officials from OPEC’s top two oil producers: Saudi Prince Khalid Bin Salman and Iraqi Speaker of Parliament Mohammad Halbousi.
https://www.spglobal.com/platts/en/market-insights/latest-news/oil/032819-trump-urges-opec-to-boost-oil-supply-says-prices-getting-too-high
It means lots of things, but perhaps the primary one is this prez may be more oil / price focused than any since the embargo 70s. And maybe more so than even then.
This guy understands things. The more diplomatic and oblique types would never have confronted Europe with its flow of money to GAZPROM while spending on anti Russian military costs. Such a glaring, abrasive point made. Ya, that’s a push towards non competitive LNG, but it’s also another thing.
It’s correct.
Some international inventories week/week changes (million barrels)
Light Distillates: -4.51
Middle Distillates: -0.92
Heavy Distillates: -0.22
Total Distillates: -5.64 (shown on chart)
Chart: https://pbs.twimg.com/media/D2xFjOmW0AAdnRM.png
Light & Middle https://pbs.twimg.com/media/D2xF2OBWsAAV7CR.png
Crude Oil: -5.19
Total (Crude + Products): -10.83 (shown on chart)
Chart: https://pbs.twimg.com/media/D2xGNPdWkAA0X7u.png
Japanese (PAJ) weekly inventory change (million barrels)
Crude Oil -7.99
Total Distillates -0.84
Unfinished Oil and Feed Stocks -1.79
Total (Crude + Products + Unfinished) -10.62
https://pbs.twimg.com/media/D2qKbcNX0AA2LUO.png
US inventories week/week change (million barrels)
Crude Oil: +2.8
7 oil products: -3.8
Total (crude oil + 7 products) -1
Propane & NGPLs: +1 (not on chart)
SPR: flat
Chart (units 1000 barrels) https://pbs.twimg.com/media/D2xICnzWwAAGlOe.jpg
Looks like a deficit of round about 1.5 mb/day. As long as prices don’t react, consumption can grow at these relative low oil prices.
And as long as there is enough in the tanks and the shale narrative works, prices don’t need to react since every demand can be fullfilled.
The only hint there’s something happening is that either chart playing things as these shooting stars and trump twitter messeges only work for a day / several hours. And then prices come back.
I sure hope HHH sees more “shooting stars” in the future. It seems like a good indicator of a near term price rise to me. Of course, I am not working on 20 years of kicking ass with precision and near certainty in the oil price predicting realm.
@Eulenspiegel You nailed it.
Perhaps I should post this link only on the other thread……. but Jay Leno is a man VERY well known to automobile enthusiasts, and he probably knows more about the history of the automobile than anybody else, excepting actual historians of the motor car.
If he thinks that a kid born today will quite possibly have never ridden in an ice car by the time he is eighteen…….. people in the oil biz probably ought to pay attention, if they are focused on the long run, in terms of staying in or getting out of the oil biz.
https://www.teslarati.com/tesla-jay-leno-end-of-gasoline-cars-video/
Dennis, feel free to delete this if you think you should, it won’t hurt my feelings!
“a kid born today will quite possibly have never ridden in an ice car by the time he is eighteen”
That is what doomers say for years. Food will be the biggest issue after the collapse, not to mention driving a car.
Hey, name,
Ya remember Kodak, and film, or land line phones, or typewriters?
THIS ain’t about DOOM, it’s about a simple change, but it’s a BIG change.
There’s a very real possibility that electrified cars and trucks will soon start selling fast enough that within ten years or so there will be enough of them on the road to have a very significant impact on the price of oil, helping hold the price of it down.
From my personal pov, this is very good, because I’m going to be running my existing vehicles and equipment until the worms get me, more than likely.
Personally I’m hoping like hell that we don’t get into a situation where an oil shortage pushes the price so high it puts us into major recession or Great Depression economic territory.
Some interesting news related to budgetted investment in Shale compared to offshore drilling 2019. I believe Guyana was a big luck that not will happen often and mostely even with improved tecnology the cheapest barrels are mostely already found offshore. But still this trend shows a new direction .
https://www.rigzone.com/news/wire/offshore_drilling_moving_out_of_shales_shadow-28-mar-2019-158477-article/
3.2 billion BOE is the latest estimate. Some ppl are quoting that as 200K bpd for 40 yrs. More likely cubic feet per day.
Shallow
Do you still have that link to some of the leases offered for sale?
There are different websites.
Energynet.com is the largest continuous online auction.
There are several other brokers who don’t conduct auctions, but just have listings with bid deadline dates. Those are usually focused on larger deals.
If you are referring to my post above, those are just local sales I have heard of by word of mouth, including two we were a part of.
We did a 1031 last year. Which was tricky because Trump eliminated 1031 regarding tangible lease equipment, but we got the numbers to work because his tax deal also allowed 100% expensing of tangible lease equipment in 2018.
A lot of sales in stripper areas are word of mouth, because with operated properties you need a permit to operate and need to either pump the leases yourself or have a pumper who can take them over, unless the current pumper is ok to continue and you are ok w him or her.
Yes, most pumpers are men, but there are a couple of women pumpers here and they both do a really good job from what I see.
Thanks for the reply shallow.
2019-03-29 (EIA) US crude oil production in January at 11,871 kb/day vs 11,961 in December and Nov 11,926 (Dec revised up from 11,849)
Texas 4,832 (Dec 4,896 and Nov 4,856)
Gulf of Mexico 1,904 (unchanged)(Dec was revised up from 1800)
https://www.eia.gov/petroleum/production/#oil-tab
January prior production estimates
Average of the weeklies: 11,874 kb/day
March STEO: 11,919 kb/day
February IEA OMR: 11,889 kb/day
International Energy Agency – Oil Market Report: 15th March 2019 #OOTT
Now available to non-subscribers – download from here
IEA –> https://www.iea.org/oilmarketreport/omrpublic/currentreport/
Charts for OECD inventories updated to January
Crude oil & distillates: https://pbs.twimg.com/media/D21uccBX4AMFC4i.png
Gasoline and middle distillates: https://pbs.twimg.com/media/D21u2esWwAYZU7U.png
Baker Hughes US Rig Count Summary
Oil: -8 at 816
NatGas: -2 at 190
Texas -6, Colorado -4, Alaska -3
GoM +3, North Dakota +3
Table https://pbs.twimg.com/media/D216x_nXgAMCiaP.png
BH -> http://phx.corporate-ir.net/phoenix.zhtml?c=79687&p=irol-reportsother
Vaca Muerta Argentina fracking numbers
2017 wells fracked –104
with govt decree of the price of oil and gas in Feb of that year
2018 wells fracked 143
because the decreed price makes it work
2019 projected 207 250 in 2020
Chevron has committed $2 Billion over 2018-2020, there are 4 fracking rigs operating there now and 1-2 will be added this year. Oil flow is about 50K bpd as of now and if the fracked well number targets are hit that will double this year. The gas is X cubic feet per whatever and is being pipelined west to Chile.
What I see is a lot of US companies selling their leases/acreage to YPF, who is delighted to buy them. MaClendon guy from Chesapeake had a company that bought up some VM acreage and he’s dead now but the company sold it to YPF.
Here’s what’s what. Argentina has found the combination to the safe. They decree the price of oil and it becomes domestically profitable. Oil company economists phrase it “subsidize”. The govt phrases it “decree”. The govt doesn’t care about the rest of the world, and in all reality should not. They want oil to flow so the royalties fed to the government . . . are fed. Chevron has a local subsidiary and all of their accounting is done locally at the decreed price of oil and gas. Translating that outside Argentina is FAR less important to them than being able to quote rising corporate oil production — which we all know has been a crushing trend for CVX and XOM both.
Indeed, all shale companies, with CEO production based bonuses, probably don’t have to care much about profit. Just production.
Anyway, that’s how Vaca Muerta will make Argentina boom. Not “rich” (though what is rich when the measurement is a substance created by central banks). “Boom”.
The world’s 4th FLNG, actually a barge – the Tango – is setting up in Argentina right this moment to liquefy Vaca Muerta’s gas for export.
Several things are coming into play here.
This ‘real world example’ of the stunning speed with which LNG can now be produced is a game changer.
The capacity, .5 mtpa, is somewhat small, but it will provide a continued market for VM development.
This steady, incremental advance may well prove to be a working model for other countries around the globe as they decide to participate in this Shale Revolution.
So they will all declare their own domestic price for oil too?
Watcher
It seems the Argentine government was barely able to continue guaranteeing $7.50/mmbtu for the gas production.
This drama is an excellent demonstration of the many components that have enabled the USA and Canada to accomplish record setting production while other regions struggle.
The December 2018 piece from JPT is an informative, detailed description of just how great the rock/wells from the Dead Cow truly are.
Very impressive.
A lot of topside issues need to be resolved to successfully capture that bounty.
Total proven is about 900 million barrels.
EIA is calling total to be phrased as a maximum of 16 billion barrels resource (not proven reserves) of “oil and condensate” and given their thermal window talk it looks like mostly condensate.
The gas is more voluminous and should pretty much erase South America as a US LNG customer.
For the first time in more than 50 years, Mexico has become a net importer of oil.
Does Mexico refine significant LTO? Easier to buy than explore and produce? ELM kicking in?
https://srsroccoreport.com/next-oil-domino-to-fall-mexico-becomes-a-net-oil-importer/
and how do you stop the violence from Mexico spreading to the United States.
https://www.reuters.com/article/us-mexico-violence/murders-in-mexico-rise-by-a-third-in-2018-to-new-record-idUSKCN1PF27J
Building a wall is the best idea
Too little too late. A wall will be insufficient.Though it might prove to be cathartic for those who view the world through a small enough lense.
https://www.huffingtonpost.ca/entry/border-wall-stolen-tijuana-home-security_n_5c9291bbe4b08c4fec33b5f4
Seems according to Baker Huges rig count the active oil rigs in shale plays continue to decrease and are now 816. 12 months ago it was 797 and with a decline of 8-10 riggs weekly it might take 2 week to reach same number as beginning of April 2018. Than oil production in US was 10.5 Mbpd. Now it is 12.1 Mbpd. I guess this is related to Ducs that are compleated as decline could be offset. DUCs seems a interesting issue and some info I get from this site… https://www.spe.org/en/jpt/jpt-article-detail/?art=4641
In April 2018 there where 3630 DUCs and there is a list of reason why number of DUCs only continue to grow like flaring restriction, completation crew shortages, capital contraints i.e , but there is one reason that might be the main reason. To start with it is well known the spacing was to tight , this lead to frack hits and reduced production. Shlumberger notice that thoose DUCS are already drilled and they might be to close related to child well interference because of this it is reasonable to believe lots of thoose DUCS will have less production, increased costs related to frack hits i.e than DUCS drilled after this issue was implemented in plans. Lots of thoose wells might actualy be not profittable tocompleate as Schlumberger tells.
That is rather large news. Can we have a link to the Schlumberger quotes?
Hi Watcher, this related to DUC,s is stated in the article link I posted that is based on the below research Shlumberger have done. I believe this is related to the DUCS that was drilled before correct spacing became a issue. I than guess the cost need to be covered by new wells , production as I am sure the funds invested in thoose DUCS was borrowed from Investors, Banks…
https://onepetro.org/journal-paper/SPE-185753-PA?sort=&start=0&q=SPE+185753&from_year=&peer_reviewed=&published_between=&fromSearchResults=true&to_year=&rows=25&_ga=2.196579500.1278602707.1554064894-1140095425.1551384224
The barrier to completion for many of the idle wellbores in the infill drilling scenario is likely to be defined by reservoir pressure depletion through production, which has changed the shale sector’s views on optimal well spacing. The simplest explanation here is that some wellbores are drilled too close together in certain areas, or have been on production for too long, to make a DUC an economic success.
several posts down, another link about Argentina, at the end of that article was links to articles about this subject — those are free as best I know, that one doesn’t appear to be.
Definitely a good find. Utterly critical in reducing how much oil can come from shale in total.
The main drivers of oil consumption will be petrochemicals, aviation and shipping.
Crude to Chemicals
https://gpca.org.ae/2018/08/01/how-will-crude-oil-to-chemicals-reshape-the-global-petrochemical-industry/
The number of people flying nowadays is staggering,
https://www.icao.int/sustainability/pages/facts-figures_worldeconomydata.aspx
Back in the late 1960s perhaps 300 million people took a flight in a year, last year 4,200 million passengers flew.
http://www.chinadaily.com.cn/a/201801/23/WS5a66d671a3106e7dcc1360c4.html
There will be another 1 billion people in 2030 and they will all need food grown and transported, clothing, water, and many will want to fly just like we do. To supply the middle class that grows at 100 million each year. The number of trucks will double by 2040.
https://www.weforum.org/agenda/2016/04/the-number-of-cars-worldwide-is-set-to-double-by-2040
I’m sure that so long as the world wide economy remains on its feet that there will be huge increases in demand for oil for transportation.
But nobody seems to give any thought here to things that will reduce demand. Cars will be driving themselves soon. Think about trains. Before too much longer, railroaders will be able to move stuff on trains almost as nimbly as truckers do today, at least on city to city basis when the cities are at least a couple of hundred miles apart. Long distance trucking may be a thing of the past within, like camera film and typewriters, within a couple of decades. These possibilities are worthy of thought if you are in the oil biz for the long haul.
Every country that imports oil is going to have a powerful incentive to reduce demand for it to the extent it can as depletion sooner or later pushes one exporting country after another into the importer category. Countries in the Middle East with oil and gas to export are going to find it so profitable to build wind and solar farms that they will be building them like mushrooms popping up after a spring rain, because they can sell some or maybe even most of the oil and gas they are burning now to generate electricity, thereby earning a big profit on their solar and wind farm investment.
My thinking is that these changes will actually PROLONG our dependence on oil, taken all around, by helping hold the price down so we can afford to run existing legacy equipment, and have affordable petrol based chemicals, etc. I don’t think anybody currently in the biz needs to worry about selling out anytime soon, lol. But considerations such as these may have a huge impact on exploration and development starting within a decade or so.
Times change. Doom doesn’t necessarily have anything to do with it.
You’re couple levels below true understanding. If you want to educate, read some of Gail Tverberg blog.
In short – 150 years of improving efficiency, and we’re using and needing more oil than ever before, because using oil IS the economy, and efficiency is a byproduct, allowing us to use MORE oil.
OFM
Rail is very good at transporting bulk from one city to another, but there is not a rail network in the world that delivers food or clothing to the shops that sell them.
Self driving cars are 20 years away. I have read many reviews of drivers who say even lane assist constantly messes up.
The fact is oil demand has gone up by around 1.5 million barrels per day each year for the last 50 years.
Pure electric cars are very expensive and only 1 million out of 100 million will be sold this year.
Hugo,
The average annual increase in crude plus condensate output has been about 800 kb/d from 1982 to 2017. See
https://www.eia.gov/totalenergy/data/monthly/
Over the past 46 years the average annual increase has been about 644 kb/d.
Dennis
You are correct regarding oil production.
In terms of demand I think about what is used, which includes processing gains and NGLs.
NGLs are used in combination with crude oil and condensate to make a whole variety of things and really should be combined.
https://www.eia.gov/todayinenergy/detail.php?id=5930
Many vehicles use them for transportation.
https://www.uklpg.org/about
http://www.earth-policy.org/datacenter/pdf/book_wote_energy_oil.pdf
Production was 10 million barrels per day in 1950 and is 100 million today.
So I should have said an increase of 1.3 million barrels per day over the last 70 years.
Hugo,
I think of oil primarily as an energy source for transportation, processing gains provide no energy, there is just a change in volume and no change in mass, NGLs are mostly used for heating and petrochemicals, very little is used for transport. Demand for crude plus condensate over the long run will be equal to the supply of crude plus condensate, in my view that number is far more interesting than the total liquids number n barrels that the IEA focuses on. That number is also problematic because the energy content of NGL, and biofuels is less than that of the average crude barrel and for processing gain we have no idea how to measure that in terms of energy.
The oil produced in 1950 was C+C and very little NGL, to compare apples to apples we would need to compare the 10 Mb/d in 1950 to the 83 Mb/d of C+C produced 68 years later, which would be 1.1 Mb/d on average over the entire period, but the rate of growth in output was roughly exponential from 1950 to 1972 with an increase from 10 to 51 Mb/d over those 22 years, an increase of 1.86 Mb/d per year on average. From 1972 to 2018 (46 years) we saw World C+C output increase from 51 to 83 Mb/d, so a much slower rate of 696 kb/d per year on average.
If one wants to count the NGLs, biofuels, and other stuff included in the IEA estimates, you should at least discount the non-oil barrels to account for their lower energy content, this reduces the “total liquids” to 95 Mboe/d in 2018, that would be an average increase of 957 kboe/d. A lot of this extra 250 kboe/d is from NGL for petrochemicals which has little to do with energy and from biofuels which provide very little net energy for society. I leave it out because it has little relevance for a discussion of energy.
C+C is where the rubber meets the road.
Dennis
The focus on oil production alone would be justified if there were no alternatives. However this is not the case.
LPG and LNG are already used for transportation and new ships and trucks are being built.
https://www.lr.org/en-gb/latest-news/lpg-as-fuel-for-new-vlgcs/
https://www.volvotrucks.com/en-en/trucks/volvo-fh-series/volvo-fh-lng.html
https://www.nextgreencar.com/lpg-cng.php
If your bananas get delivered on an LPG powered ship then oil peak is not so important. Because there is an alternative.
If Natural gas production does peak in 2035, by then batteries and wind power could easily make up the difference.
Very large gas carriers can use LPG fuel because their tanks are built to hold pressurized gas. So, it just makes sense to bleed off the LPG to power the ship. Banana boats are a totally different story. They do not have tanks built to hold large amounts of LPG.
LNG carriers have always used LNG for power. LNG naturally “boils off” continually. They just feed the boil off directly to the ship’s boiler.
Anyway, as it says in the Bible: Thou shalt not live by bananas alone. Well, I heard that was in the Bible. 😉
I don’t know when natural gas will peak. There are several estimates. However, if there a huge increase in natural gas powered vehicles, and/or an increase in natural gas liquids powered vehicles, the peak would be dramatically accelerated.
ha ha ha
very good Ron.
True, more demand will bring forward peak gas. But even in the worst case, battery cars will match petrol cars in terms of mileage and cost by 2030.
Hugo,
I suppose LPG might be used for land transport or air transport at some point, but it would take some time to ramp that up, in the mean time electric transport using trains and EVs can certainly take up some of the transport demand with perhaps a bit of propane transport in Buses and trucks added to the mix. At some point natural gas will also peak, my guess is 2030 to 2040 with a best guess of 2035. Obviously I could be wrong, I rely in part on estimates by Jean Laherrere and Steve Mohr.
https://www.researchgate.net/publication/267870440_Projection_of_world_fossil_fuels_by_country
And if things get tough with fuel, or money, not a single airplane flight is necessary. Not even one.
People waiting for a transplanted organ may argue.
Trump can walk to Florida for all I care.
Kerosene is a middle distillate. If there is too little of it, there will also be too little diesel, also a middle distillate.
Alberta’s producers could increase production by +280 kb/day and still be within the curtailment level
Alberta (AER) February crude oil and bitumen production (without condensate or LPG) is 3,350 kb/day up +30 from January
February 2018: 3,370
Average 2018: 3,401
Curtailment levels (which are without condensate or LPG)
February 2019: 3,630
March 2019: 3,630
Chart https://pbs.twimg.com/media/D26ZqA5WoAAh79q.png
Alberta (AER) February closing inventory +3.9 millon barrels from January (+140 kb/day)
Chart https://pbs.twimg.com/media/D26aGTzXcAI4EX4.png
Production Change month/month (1000 barrels per day)
Light & Medium -8
Heavy & Ultra Heavy -2
Condensate -3
Non-Upgraded Total +82
Upgraded Production -42
Total Production +28
Chart https://pbs.twimg.com/media/D26a-6DW0Aw5VgD.png
EIA US inventories of crude oil plus total oil products (without SPR)(without LPG) increased +30.8 million barrels in January month/month.
Chart https://pbs.twimg.com/media/D268eIgWsAAYSF0.png
EIA US inventories of LPG decreased -22.7 barrels in January month/month.
Chart https://pbs.twimg.com/media/D2683hZXcAcFPM6.png
Comparing January & December OECD inventory changes since 2010
The build in December 2018 (m/m from Nov) is the largest of recent years
The build in January 2019 (m/m from Dec) is less than average
Bar chart https://pbs.twimg.com/media/D27GB-qWsAAiDPA.png
OECD Crude Oil Inventories, split Americas vs (Europe + Asia)
Chart https://pbs.twimg.com/media/D27HmiuX4AEYqCV.png
Have to remember that OECD is less than half of World consumption rate.
name,
We don’t have very good petroleum stock level information for non-OECD.
US crude stocks are becoming less important as it’s oil production increases. Obviously as production increases the reserves will last longer if imports were cut for some reason.
The stocks held in China are probably more important as China is now the biggest importer of oil in the world.
https://oilprice.com/Energy/Energy-General/The-5-Biggest-Strategic-Petroleum-Reserves-In-The-World.html
Stuff from the Journal of Petroleum Technology re Vaca Muerta.
Unlike US shale they claim shallower decline rates. They say 70% by 2021. I think that is for 2018 wells. What is a 3 yr decline rate in ND?
EUR 550K. BOE. For normalized 10K ft laterals. 30 yrs. They really haven’t drilled enough wells to be saying stuff like this but that’s the quote in the article I’ll put the link below.
It’s a technical article and they don’t spend much time at all looking too very closely at Argentina’s declared price of oil and gas. What is going on is exactly what you would expect. Just make the oil flow and worry about the imaginary substance that funds it later.
The play is described as similar to eagleford in that there are three regions, oil, condensate, and dry gas.
There is proppant scarcity. The sand mines in Argentina are hundreds of miles away. The nearest rail node is tens of miles away and trucks have to carry sand the remaining distance. I see no talk in the article of water.
There wasn’t much talk about take away either.
After the bottom of the article is a reference to conversations that apparently have become prominent referred to up the thread a bit concerning parent and child wells for fracking. I didn’t read it carefully but there were some phrases about a hard limit to well density having already been discovered and a great many wells are going to see their drilling expense wasted. They will never be fracked. This is probably the biggest news that I can recall for quite a number of years in the world of shale. Some heads should roll but they probably retired by now.
https://www.spe.org/en/jpt/jpt-article-detail/?art=4918
Adding . . . the reason I stumbled onto that article was looking for a Vaca Muerta assay. Still havent found one.
There is a sense of somewhat bizarre optimism from some of the people quoted. One guy at one point said some of the best wells could expect 1 billion BOE of 30 yr EUR. Somewhat absurd. Or a misprint of million.
But Chevron has written checks. It **IS** happening. There was listed something like 8 or so companies with fracking pumps already on site, including the big guys of Halliburton and Schlumberger. There was also talk of depth and excessive pressure in the field that was a challenge to those pumps and was wearing out those pumps faster than Permian or Bakken.
The price is high enough to get the VM going, because the government makes it high enough. No reason you can’t do that. Most of the output will be domestically consumed. Excess exported for essentially extra “money”. Dabbling for a moment in conspiracy, one would expect the IMF to consult with central banks and rage about this and maybe . . . surely not regime change.
Additional heads up re: the talk above. This thing about parent well child well “communication” and slamming well output is a big deal. The gazillion Bakken/Permian/Eagleford DUCs may never be fracked because it is counterproductive. Drilling money flushed down the drain.
Yes I thought that this was worth reading, I’m surprised it’s free and not subscribers only
Argentina: https://www.spe.org/en/jpt/jpt-article-detail/?art=4918
Keep your eyes open for a VM assay. It really looks like more of a gas play than proper API 39 oil, which will likely anger someone writing checks. Very much Eagleford-like.
Looks like US exports have quality issues.
https://www.worldoil.com/news/2019/3/27/infected-us-shale-oil-is-being-turned-away-by-asian-buyers
Saudi Aramco was the world’s most profitable company in 2018
https://www.smh.com.au/business/companies/saudi-aramco-was-the-world-s-most-profitable-company-in-2018-20190401-p519nx.html
Saudi Aramco (from it’s debut bond prospectus) was the world’s most profitable company in 2018.
EBITDA in 2018 of $224 billion
Net income $111 billion
Income tax $102 billion
Capex $35 billion
Dividends to Saudi Gov. $52 billion
Bloomberg chart https://pbs.twimg.com/media/D3C2-oPX4AEpPvO.jpg
Bloomberg chart https://pbs.twimg.com/media/D3DtFCnXQAAIENg.png
In 2018, the Company produced 13.6 million barrels per day of oil equivalent, including 10.3 million barrels per day of crude oil (including blended condensate), an additional 0.2 million barrels per day of unblended condensate, 1.1 million barrels per day of NGLs, 8.9 billion standard cubic feet per day of natural gas and 1.0 billion standard cubic feet per day of ethane.
Saudi Aramco Bond prospectus (LSE 469 pages pdf file) https://www.rns-pdf.londonstockexchange.com/rns/6727U_1-2019-4-1.pdf
Justification to ridicule the ppl saying KSA was teetering on collapse because they could not fund domestic spending.
GIIGNL Annual Report – LNG trade in 2018
In 2018, global LNG imports reached 313.8 million tons (MT), an increase of 23.9 MT or 8.3% compared with the previous year. One new country (Cameroon) started exporting LNG in 2018, the number of exporting countries is now 20. Two new countries imported LNG for the first time (Bangladesh and Panama), bringing the total number of importing countries to 42. Japan remained the leading importing country, with 82.5 MT, followed by China (54 MT).
Total cargo capacity at the end of 2018 stood at 83.1 million cubic meters. Total operational capacity (vessels known to be in service) amounted to 79.6 million cubic meters.
Free PDF file https://giignl.org/sites/default/files/PUBLIC_AREA/Publications/giignl_annual_report_2019-compressed.pdf
Twitter https://twitter.com/GIIGNL
EN
Price in Asia (Japan-Korea market) for LNG this week is $4.37/mmbtu. Expected to stay in this range – or drop – till the coming autumn.
This stunningly low price has major ramifications across a wide swath of the global economy.
As the CEO of Tellurian (developer of a 27 mtpa plant in Louisiana) just said, market forces will adapt to these new economics, especially residential and transportation.
Just so.
Worldwide, there will be a shift towards natgas for energy purposes.
The accompanying hardware that is geared for natgas (think engines, generators, storage and fuel containers, micro liquefaction, modular buildout of ships and huge plants) is exploding in both innovation and adoption.
One need only look at the burgeoning world of fast fleet ferries (Global production is currently 70 with US share being 28) to see how the follow on impacts of ultra cheap energy plays out in the real world.
Apr. 1, 2019 (BUSINESS WIRE) Energy Transfer LP announced today it is expanding its presence in China to meet growing demand for ethane and liquid natural gas products by opening an office in Beijing, the first office for Energy Transfer outside the United States.
http://ir.energytransfer.com/phoenix.zhtml?c=106094&p=irol-newsArticle&ID=2393044
EN
Energy Transfer is one of the biggest pipeline owners in the US.
They recently announced a partnership with Shell to develop the 15 mtpa LNG plant at Lake Charles.
In similar fashion, Kinder Morgan – another pipeline giant – is now running the Elba Island LNG operation.
Although much smaller, New Fortress Energy is spearheading the ‘downsizing’ of both liquefaction processes and transporting of LNG with their LNG plant in Bradford county, PA, being just one example.
Amongst the customers for this product are Jamaica and Puerto Rico.
With Excelerate having just regasified- from 2 floaters – a rate over 800 million cubic feet into the New England system this past February, observers from all over are starting to ramp up the applied potentialities of this fuel.
Reuters survey of OPEC March is out. Quota producers were at 135% of cuts. Venezuela, exempt from quota, was down 150,000 bpd. Overall output is -280k bpd and the lowest since February 2015.
https://www.reuters.com/article/us-oil-opec-survey/opec-march-oil-output-sinks-on-saudi-cuts-venezuela-blackouts-idUSKCN1RD26N
Venezuela’s power grid is showing signs of major loss of capacity.
https://twitter.com/netblocks/status/1112364847587643394
Venezuela is proposing “planned” rationing of electricity for the next 30 days.
https://abcnews.go.com/International/wireStory/nationwide-blackouts-norm-venezuela-62074231
Lago de Maracaibo, Venezuela – I had missed this, I guess that everyone has seen the gas leak into the water, 54 seconds in, there’s no mention of anyone fixing it?
Mar 26, 2019 (Sky News) https://www.youtube.com/watch?v=W9I1DnGPRvA
Oil field map, Maracaibo is on the LHS https://pbs.twimg.com/media/DGEHgm8XkAAJOc2.jpg
Stunning Sky News piece. But isn’t Maracaibo depleted? One gets the impression from this that the basin has “fallen into neglect” because of politics, not abandoned because it’s just over.
Looking at the video I would say it has fallen into neglect and it does not matter if it is depleted or not. Abandoning wells is kind of an important thing to do once the production runs out at least in my opinion.
Yeah the video doesn’t say enough to tell us what the big picture is. I had a quick search on google and the Maracaibo basin is said to be a mature field that has been in decline for years. But since the 2014 fall in oil prices things have been getting worse for Lake Maracaibo. The government has not ordered any oil removal and clean up since the big spill in May 2015.
And in 2014 the Maracaibo basin was still producing slightly less than half of Venezuela’s oil (Total Venezuela C+C was 2.5 million b/d)
EIA International 2015 (Exploration and production) Venezuela’s conventional crude oil is heavy and sour by international standards. As a result, much of Venezuela’s oil production must go to specialized domestic and international refineries. The country’s most prolific production area is the Maracaibo basin, which contains slightly less than half of Venezuela’s oil production. Many of Venezuela’s fields are mature, requiring large investments to maintain current capacity.
EIA pdf file https://www.eia.gov/beta/international/analysis_includes/countries_long/Venezuela/archive/pdf/venezuela_2015.pdf
In 2017 international oil companies (Repsol, Eni & Chevron) still had over 1 billion barrels (boe) of reserves in the Maracaibo basin. (Source: Upstream Analytics)
Brazil’s oil production at 2,489 kb/day during February, which is down -142 from January
2018 average 2,587 kb/day
No press release yet, waiting to see if they mention the new FPSOs ANP -> http://www.anp.gov.br/
Chart: https://pbs.twimg.com/media/D3FsLyMW0AANPL4.png
Brazil – these 6 new FPSO have all started since April 2018
Graphic: https://pbs.twimg.com/media/D3FyNmyUgAEfWzp.jpg
plus this one: Buzios4 FPSO P-77 – started March 19 2019
Berbigão field FPSO P-68 is delayed but is still scheduled to start operating 2019
Atapu FPSO P-70 said to be starting in 2019
Seems US oil production from shale now are declining, seems the growth based on lended money now will stop. https://oilprice.com/Energy/Crude-Oil/US-Oil-Production-Dips-For-First-Time-In-Nearly-Six-Months.html
From the Rig Count we know this decrease will be strenghtening the comming months until the oil price increase to a level profit will be possible that can pay dividend and growth. This might take time as soon Trumph will tweet again as oil is to exspensive and Opec will be forced to take action.
The 10 yr bond is down at 2.5% today, and with the Fed’s overt announcement 6 weeks ago, clearly the Fed isn’t pushing its upward bias.
Low rate money is the stuff of shale oil. Not profits.
Freddy,
Through February 2019, US tight oil output has continued to increase. US tight oil output increased by about 100 kb/d on average for the first 2 months of 2019. For the past 26 months the average annual increase in US tight oil output has been 1530 kb/d or an average monthly increase of 127 kb/d so there has been a bit of a slow down in the rate of increase for the past few months, but rising oil prices might reverse this trend.
Dennis, USA C+C was down 90,000 barrels per day in January. It is what it is.
USA -90,000 bpd
Texas -64,000 bpd
N. Dakota +9,000 bpd
Petroleum Supply Monthly”
Hi Ron,
My point was simply correcting the comment that tight oil output was down, it was not according to EIA. A drop of 90 kb/d is really not very significant 0.76%, essentially a rounding error.
Tight oil output in Texas, New Mexico, and Louisiana was 87 kb/d higher in Jan 2019 than in Dec 2018 (includes Eagle Ford, Permian Basin, and Austin Chalk tight oil output) according to EIA monthly tight oil production estimate data. So the C+C output in the US from non-tight oil production (4511 kb/d) in Jan 2019 must have decreased by 177 kb/d or about 4%. Higher oil prices might slow down this rate of decrease, we will see.
Wow! So, most of the decline was from conventional wells. This is astounding news. Now, new shale wells must not only overcome a 6% decline per month from legacy shale wells, but now must overcome an increasing decline from conventional wells as well.
Yes, the total decline, in percentage, was not all that great. But neither was the percent increase in December, even though there was a huge increase in shale production.
Thanks for the info Dennis.
This might take time as soon Trumph will tweet again as oil is to exspensive and Opec will be forced to take action.
Trump can force OPEC to take action? What planet are you living on?
Ron , as we say here from the past you can predict the future. What we know is when oil orice Brent reach 70 usd / barrel Trump tweets and call the Saudi King . If they not agree he will put sanctions against Opec. Seems like Trump stand by his words , look at the wall… guess that now will be built… I am now waiting for his next oil tweet Nd call to Saudi King as he use to do as the Brent is now exseed soon 70 usd /bbl.
A huge increase from the Opec will be great for shale. When they already are in decline, that will give them even more troubles.
In the end, production will be the same only Opec pumping +2mb/day at full capacities no reserve, and Shale will be at -2mb/day after a year or 2.
To name it with his own words: not good.
If they not agree he will put sanctions against Opec.
Okay here is the picture. OPEC exports oil and almost nothing else. Trump wants OPEC to increase oil production. They refuse. So Trump puts sanctions on all 14 OPEC nations cutting their oil exports because they won’t export more oil?
Yes, I know Trump is dumb as a rock, but is he that dumb?
One more thing. The whole world just laughs at Trump’s tweets. He is an international joke, an embarrassment to the our country.
Ships that do not use oil
https://www.ship-technology.com/features/carnivals-lng-fleet-ushering-new-generation-cruise-ships/
Trucks that do no use oil
https://www.volvotrucks.com/en-en/trucks/volvo-fh-series/volvo-fh-lng.html
Cars that do not use oil
https://www.volkswagen.co.uk/new/golf/explore/e-golf
Once, oil was essential for transportation, today it is not. The consequences of peak oil are obviously much reduced with the fact that alternatives exist.
An electric car that could drive 100 miles between charges 5 years ago was fantastic. Today there are cars that can travel 300 miles on one charge. The question is how quickly the world can electrify.
Your first link for the ships states:
“powered by liquefied natural gas, known as the world’s cleanest burning fossil fuel, with nearly zero emissions”
How the hell does it have nearly zero emissions?
Iron Mike,
They are ignoring carbon dioxide emissions and looking at other types of pollution similar to tailpipe emissions related to smog.
People who are fortunate to be able to cook on gas burners in their homes have somewhat similar ’emissions’ right in their kitchens.
Brilliant! If the ship stops the LNG Boils off and has to go somewhere.
LT
The smaller LNG tanks/containers that are rapidly proliferating to provide onsite/onboard fuel storage generally have a ‘shelf life’ of between 2 and 3 months before boil off occurs.
Operators plan on either using the gas or swapping the tanks out before this time frame.
The latest iterations of LNG carriers actually have on board micro re-liquefaction plants – powered by BOG – that reliquefy any excess and return this to the main tanks.
This is the last big project Angola has coming online until they start a new one, and so it could be years before anything new starts? There are some smaller things but I don’t know the sum total?
Paris, April 2, 2019 – Total has started up production on Kaombo Sul, the second Floating Production Storage and Offloading (FPSO) unit of the Kaombo project, located on Block 32, 260 kilometers off the coast of Luanda, in water depths ranging from 1,400 to 2,000 meters.
Eight months after its sister ship, Kaombo Norte, came on stream, Kaombo Sul will add 115,000 barrels of oil per day (bopd) and bring the overall production capacity to 230,000 bopd, equivalent to 15% of the country’s production. The associated gas from Kaombo Sul will be exported to the Angola LNG plant, as part of the Group’s commitment to stop routine flaring.
The project comprises a large subsea system including 59 wells (with over 60% of them already drilled)
Total -> https://www.total.com/en/media/news/press-releases/angola-total-launches-full-field-production-kaombo-start-second-fpso
2019-03-15 South Korea’s Daewoo Shipbuilding Delivers First of Two Drillships to Angola Oil Firm Sonangol & JV partner SeaDrill
Chart showing the change in world oil production since 2014
I was wondering what has changed since the $100 oil prices in 2014
From the average production level in 2014 to the month of December 2018
Bar chart https://pbs.twimg.com/media/D3I0jvEWsAASX6v.png
Energy News,
Nice chart thanks. Price probably only has a minor effect, but it is doubtful tight oil would have taken off as fast without the high oil price environment of 2011-2014 (average oil price was about $115/b in 2017 $ over that period.) As prices dropped I expected tight oil output would fall much more steeply than proved to be the case. My expectation in 2015 was a drop of at least 1 Mb/d per year, in fact tight oil output only fell by 585 kb/d over an 18 month period after March 2015. Expanding tight oil production in the Permian basin turned things around much more quickly than I had anticipated. I expect Permian basin output to continue growing to about 7.5 Mb/d by 2028, but by 2025 decreasing output in the Eagle Ford and Bakken will offset the slow increases in Permian output over the 2025-2028 period so that the peak for US tight oil will occur in 2025 at about 11 to 11.5 Mb/d (in Feb 2019 US tight oil production was about 7.47 Mb/d). My expectation is the peak in World C+C output will be fairly close to the peak in US tight oil output (+/- 1 year).
Ghawar is able to pump a maximum of 3.8 MMbpd
2019-04-02 (Bloomberg) Now the market finally knows: Ghawar in Saudi Arabia, the world’s largest conventional oil field, can produce a lot less than almost anyone believed.
When Saudi Aramco on Monday published its first ever profit figures since its nationalization nearly 40 years ago, it also lifted the veil of secrecy around its mega oil fields. The company’s bond prospectus revealed that Ghawar is able to pump a maximum of 3.8 MMbpd―well below the more than 5 MMbpd that had become conventional wisdom in the market.
“As Saudi’s largest field, a surprisingly low production capacity figure from Ghawar is the stand-out of the report,” said Virendra Chauhan, head of upstream at consultant Energy Aspects in Singapore.
The Energy Information Administration, a U.S. government body that provides statistical information and often is used as a benchmark by the oil market, listed Ghawar’s production capacity at 5.8 MMbpd in 2017. Aramco, in a presentation in Washington in 2004 when it tried to debunk the “peak oil” supply theories of the late U.S. oil banker Matt Simmons, also said the field was pumping more than 5 MMbpd and had been doing so since at least the previous decade.
Graphic: https://pbs.twimg.com/media/D3JlNRTU4AEdARS.png
https://www.worldoil.com/news/2019/4/2/saudi-aramco-reveals-sharp-output-drop-at-its-major-fields
February 24, 2004 Saudi Aramco’s Perspective on Crude Oil Supply Scenarios
PDF file https://csis-prod.s3.amazonaws.com/s3fs-public/legacy_files/files/attachments/040224_baqiandsaleri.pdf
Chart of Ghawar in 2004 with water cut https://pbs.twimg.com/media/D3JzrT2WAAAuJ7v.jpg
Great charts Energy News, very informative. I will use them in my next post. Hope you don’t mind.
You should consider creating a guest post at least once a month. I am sure Dennis would be delighted.
Yes feel free to use anything that you like, it’s all free data from the internet 🙂
Energy news,
Your stuff is great, thanks.
I agree monthly or every other monthly posts would be great, or just keep doing what you are doing. Sometimes putting together a story based on the data can be nice, if you like to write, not everyone does.
I did think about it a while ago but I came to the conclusion that I don’t really have much more to say than I already do.
There is a slide in that presentation About the reserves in the Ain Dar/Shedgum area:
Produced: 26.9 Bbbls
Remaining proved: 13.9Bbbls
“Proved reserves”: 40.8 Bbbls
Does that mean that Saudi Aramco includes reserves that have already been produced in what they call “proved reserves”?
KSA reports some 268 Bbbls of proved reserves. Cumulative production is something like 150 Bbbls, right?
Looking at the Ghawar chart in the above 2004 report, it looks like they are showing approximately 5.2 Mb/d of production in 2003. For Ghawar to drop to 3.8 Mb/d in 16 yrs, it implies a decline rate of close to 2.0% per annum.
Note I had to cut the size of the original chart to show the one attached. The 20 on the right correspondents to 5 Mb/d and each line I have added to guesstimate the shown production is 0.5 Mb/d
For Ghawar to drop to 3.8 Mb/d in 16 yrs, it implies a decline rate of close to 2.0% per annum.
Not really, Haradh only came on line in 2003 though it was discovered decades eralier. But southern Ghawar was only ramping up in 2004. Northern Ghawar, Ain Dar, Shedgum and Uthmaniyah has been in steep decline while southern Ghawar, Haradh and Hawiyah was either ramping up or holding steady.
The info provide was for Ghawar and as such, 2% is correct for Ghawar. When data is published for Ain Dar, etc, more detailed analysis will follow.
No, no, no, you do not understand. Ghawar is not one oil field but five very different fields. The porisity and peremability changes as you go from north to south. That’s why the north was developed first and the more difficult south was developed last.
Ghawar’s Magnificent Five
Ain Dar
Shedgum
Uthmaniyah
Hawiyah
Haradh
Or for details of each field:
The Ghawar Oil Field, Saudi Arabia
I’m not quite sure what gives you the impression that I do not understand Ghawar, but will leave that discussion for another day.
Attached is a picture from a presentation made by Nawaf Obaid in Washington in 2006. He was the managing director of the Saudi National Security Assessment project.
In the presentation he explains Saudi Arabia’s Strategic Energy Initiative.
Note his comment:
“Without “maintain potential” drilling to make up for production, Saudi oil fields would have a natural decline rate of a hypothetical 8%. As Saudi Aramco has an extensive drilling program with a budget running in the billions of dollars, this decline is mitigated to a number close to 2%.”
So in essence the 2018 MSC of Ghawar of 3.8 Mb/d means that Saudi Arabia has stuck to their plan of letting Ghawar decline at an annual rate of 2%.
I will send you and Dennis the original file taken from my Ghawar file.
I’m not quite sure what gives you the impression that I do not understand Ghawar,
Sorry for the misunderstanding but it was because you wrote:
The info provide was for Ghawar and as such, 2% is correct for Ghawar. When data is published for Ain Dar, etc, more detailed analysis will follow.
That gave me the impression that you thought Ain Dar, Shedgum, etc, were different oil fields. Okay, I was mistaken, sorry. But northern Ghawar could have a very high decline rate but when new production from southern Ghawar is put into the mix, the steep decline from northern Ghawar is hidden. That was my point. Also “Ghawar” must be understood as five fields, not one, just as Saudi must be considered as many fields, not just Saudi.
Thanks for the Saudi 2006 report. I had seen a similar report before, perhaps the same one. But the link stopped working. I suppose they took it down. At any rate I will use it in my April 10 OPEC report.
Thanks again for the info.
Ghawar – oil analysts might have been thinking that the stepped development of Ghawar (from North to South) had been increasing its production capacity over time? I have been wondering why the EIA had listed Ghawar’s production capacity at 5.8 MMbpd in 2017. While production was lower in 2003 at 5.2 MMbpd. We don’t know what the max capacity was in 2003? And Saudi Aramco now say that it’s max cap is 3.8 MMbpd (December 2018).
Someone on Twitter (so it must be true – joke) was saying that the reserve estimate includes all viable technological means of recovery which includes enhanced oil recovery, even steam injection. But there was no mention as to how much steam EOR and multi-stage fracturing could have added to reserves??
There’s no mention of steam in the prospectus -> Oil Recovery (Saudi Aramco Bond prospectus pdf file page 87) The Company’s main recovery mechanism for its oil reservoirs is peripheral water injection, which maintains reservoir pressure, maximises reservoir sweep and minimises water produced over time. In a few fields, the Company employs other methods, such as re-injection of produced gas in gas caps.
Natural Gas Recovery – multi-stage fracturing is listed -> (Saudi Aramco Bond prospectus pdf file page 94) The gas fields also make extensive use of advanced technologies (for example, horizontal, multilateral, extreme reach wells, multi-stage fracturing and underbalanced coiled tubing drilling), with compression projects being planned to extend field plateaus.
The pdf file -> The reserve estimates per field and max sustained production capacity (MSC) per field are on page 88 (pdf software says page 99?) in the Business section
Saudi Aramco Bond prospectus (LSE 469 pages pdf file) -> https://www.rns-pdf.londonstockexchange.com/rns/6727U_1-2019-4-1.pdf
The EIA used their own internal estimate for Ghawar. IHS Markit’s number for Safaniyah is the same as Saudi Aramco’s…
(October 20, 2017) EIA International 2017 Saudi Arabia
The Ghawar field has an estimated remaining proved oil reserves of 75 billion barrels,[8] more than the reserves of all but seven other countries. Safaniyah, the world’s largest offshore field, holds an estimated 35 billion barrels of remaining reserves.[9]
8. Internal estimate from U.S. Energy Information Administration.
9. IHS Markit, Upstream Companies and Transactions, Safaniyah, July 19, 2017 (accessed August 2017).
https://www.eia.gov/beta/international/analysis.php?iso=SAU
Saudi Aramco Bond prospectus pdf file page 88
Ghawar 48 billion liquids, 58 billion boe
Safaniyah 33.6 billion liquids, 34 billion boe
From your link, the EIA estimates Ghawar has, or in 2017 had, a production capacity of 5.8 million barrels per day. Saudi says they are producing 3.8 million barrels per day and declining.
So much for the EIA’s estimates.
EIA International 2017 Saudi Arabia
The Ghawar field has an estimated remaining proved oil reserves of 75 billion barrels,…
So the EIA says Ghawar has remaining proven oil reserves of 75 billion barrels.
Saudi Aramco Bond prospectus pdf file page 88
Ghawar 48 billion liquids,…
But Saudi in their bond prospectus says they only have 48 billion barrels. Imagine that.
When Saudi Aramco on Monday published its first ever profit figures since its nationalization nearly 40 years ago, it also lifted the veil of secrecy around its mega oil fields.
O RLY?
Energy News has posted a link above to a WorldOil Magazine report on this Saudi report. I will post this WorldOil report and comment one it, in depth, in my next OPEC post, April 10th. Yes, Saudi has admitted a lot in this report. But they are still lying about, the one thing that really counts, actual remaining recoverable reserves. Check back here in eight days.
Looking forward to it!
Edit: Have you or anyone else ever responded here to Robert Rapier’s take on the “inflated reserves” scandal?
I think it’s reasonable to assume that Saudi Arabia also found additional barrels since 1982. They also have access to the same kinds of technology that improved recovery in U.S. fields. Therefore, I do not believe it’s a legitimate exercise to consider depletion from a historical reserves number to estimate current reserves. Such an exercise would have suggested that U.S. oil production would have fallen to zero by 1991.
Thus, I don’t find a reasonable basis for concluding that Saudi Arabia’s reserves are much lower than their official numbers. Their published reserves are consistent with the independent audit, and they are consistent with the experience in the U.S. of reserves growth despite significant oil production.
How much oil does Saudi Arabia have?
Yes, I responded to it at the time. I don’t recall in which post it was. But nedeless to say, I have a much lower opinion of Robert Rapier’s opinions after that report.
On this I disagree with Ron.
Saudi Arabia has access to the best oil field technology in the World. The US has seen reserve growth from 1980 to 2005 at about 2% per year on average. We have Saudi Reserve data from 1979 (see Twilight in the Desert), if we assume Saudi reserves grew at the US reserve growth rate of 1980-2005 (2%/year) from 1979 to 2017, Saudi 2P reserves would have grown from 177.5 Gb in 1979 to 215 Gb at the end of 2017.
If we assume all reserve growth stops after 2017, this would imply a URR of about 365 Gb, a Hubbert Linearization on 1998-2017 data gives a URR estimate of 342 Gb and historically HL estimates for Saudi Arabia have tended to be too low.
If we assume reserve growth continues at gradually lower rates a scenario with Saudi URR of current “proved reserves” which are likely to be proved plus probable reserves plus the 150 Gb of oil produced though the end of 2017.
In short, I agree for the most, part with Mr. Rapier’s analysis.
Dennis, reserve growth does not stop because it never begins. Reserve growth is simply refining and correcting earlier estimates of recoverabele reserves.
Because of SEC regulations, publicly traded oil reserves were always conservative, especially in the early stages. But as time passed, these estimates were gradually corrected, almost always in the upward direction. Almost always but not always. Shell had to dramatically reduce their estimates of Oman reserves. I guess you could call that “reserve shrinkage”. 😉
But after many years of production, publically traded reserves cease to grow. They finally get their estimates correct. But this goes doubly for NOCs. They have absolutely no reason to underestimate their reserves. ARAMCO has been owned exclusively by the Saudi government for 40 years now.
Dennis, I am going to cover this in depth in my April 10 post. I don’t mean I will talk more about reserve growth, I won’t. But I will have more to say concerning Saudi Reserves.
Hi Ron,
In the US where much of the oil is produced by publicly traded companies the estimates of reserves increased from 1980-2005 by about 2% per year on average over that period, after that the growth in tight oil reserves muddies the waters for US reserves, but prior to 2005 tight oil reserves were a very small portion of the total.
In 1979, the Saudi reserve estimates were by publicly traded US corporations, I am simply suggesting that Saudi reserves might have grown just as much as US reserves have grown, especially considering that the Saudi reserves are relatively recently discovered relative to US oil reserves so one might expect if anything that reserve growth (aka increase in estimates of reserves) might be higher in Saudi Arabia than in the US.
Is there some reason why Saudi Reserves would not grow, but US reserves would? The 1979 reserve estimate for KSA would be based on the same standards. Growth of 2% per year in reserves would lead to about 218 Gb of 2P reserves at the end of 2018 based on 1979 to 2017 C+C output and imply a URR of 370 Gb, HL gives a slightly lower estimate of 340 Gb, though that is not a great method in my opinion as it tends to underestimate URR in many cases.
Dennis, you are simply hung up on reserve growth. Reserve growth depends entirely on estimates of reserves posted by the company, or nation, that owns the oil. Oil companies are far more likely to produce optimistic estimates reserves in foreign nations, where the SEC has little access to the true data.
Example, bold mine:
Shell Scandal Points To Exaggerated Estimates Of Oil Reserves
The oil industry has been gripped by scandal since Royal Dutch/Shell, one of the giants, twice this year downgraded its proven oil reserves by 20 percent, or nearly 4 billion barrels. There is considerable concern that Shell may not be alone and that other companies and even governments have hyped up their estimates of how much oil they have, a vital factor in gauging their economic health. If that proves to be the case, it would have an immense impact on the Middle East, whose economic weight is almost totally dependent on oil and natural gas.
The four original American ARAMCO oil companies may not have overestimated Saudi reserves, but it is extremely unlikely that they underestimated them.
I have no faith in earlier estimates of Saudi Reserves, (prior to 1980), and I sure as hell have no faith in them now. So called reserve growth is nonsense in this case.
I will cover all this in my April 10 OPEC report.
Ron,
I don’t buy that, American public companies are subject to SEC rules whether their operations are in the US or in other nations. Note that I am using proved plus probable reserves as Jean Laherrere suggests as this is the engineering best estimate see Twilight in the desert page 378 (all of Appendix C is very interesting) proved reserves=110 Gb, proved plus probable (2P) reserves=177.5 Gb and proved+probable+possible (3P) reserves=248 Gb as of the end of 1978.
I agree Saudi Arabia overstates “proved reserves” since 1981 as this is just a game played by OPEC for higher quotas. Based on North Sea data from the UK, it is likely that 2P reserves are about 60% more than proved reserves on average and this fits pretty closely with the Saudi estimates from 1979. I am just using the best estimates we have.
Globally, BP [13] estimates 1263 Gb of conventional proved reserves in 2011 (slightly more than cumulative production to date) and 389 Gb of non-conventional proved reserves. The latter comprise 169 Gb of Canadian oil sands and 220 Gb of Venezuelan extra-heavy oil, but both estimates are disputed and only a fraction of this volume is likely to be recovered over the next 25 years. In principle, global 2P reserves should be larger than 1P reserves, but according to an authoritative industry source (IHS Energy) global 2P reserves are approximately the same as national declared 1P.
see section 3b from link below:
https://royalsocietypublishing.org/doi/full/10.1098/rsta.2013.0179
Thanks for shearing this News related to Saudi oil capacity. Interesting the info related Gwar, the decline rate is bigger than exspected and adding 2% decline in general with 12 Mbpd capacity they need to add new production at about 240000 bpd to have same production , it is also exspected the world demand increase with 1,5-2% off 100 Mbpd. With decrease in US Shale output , limited spare output in Russia this seems bad. To compensate with new discoveries offshore will take decades.
Russia is maintaining production/ staving off decline through heavy infill investment in existing fields. It’s not plausible they could increase a significant amount and I don’t know of anyone forecasting that. The only greenfields that are discussed there are speculative, technically difficult recovery either from shale or Arctic offshore.
The most plausible short term fix would be sanctions coming off Iran, which is pure political.
Propoly
The greatest threat to oil production is US shale company debt. They are the living dead of the oil industry, like vampires sucking up blood in order to stay alive.
http://priceofoil.org/2018/11/05/us-shale-companies-facing-catastrophic-failure-over-ballooning-debt/
I would not worry about Russia oil companies, they are selling their oil at a profit and they have shed loads of money to invest.
https://www.mioge.ru/en-GB/press/news/5-Russian-oil-gas-projects-2018.aspx
https://www.themoscowtimes.com/2019/04/02/cash-pile-of-russian-surgut-oil-dinosaur-grows-to-sovereign-proportions-a65055
https://uk.reuters.com/article/us-russia-gazpromneft-results/russias-gazprom-neft-says-2018-net-profit-up-49-percent-idUKKCN1QA0YC
Remains to be seen how big a hit US LTO takes from tighter capital availability. The industry simply hasn’t made money even with the best quality resources. Drilling ever more wells outside sweet spots when investors/lenders are already fed up doesn’t seem like it’ll work.
The EIA “estimates” of how much this can expand/what the URR is are almost surely way too high. “Sink X wells, get Y production.” It’s not that simple, especially when those wells have to raise market capital.
Russia is making money. Problem for Russia is that they don’t have anything new to open and so if they stop working what they’ve got so hard (or it finally collapses ala Mexico or China), they will decline. Most analysts including Russians thought it would have already happened. There’s no material growth there, not unless they want to do it by faster depletion in already mature assets.
Besides Iran if everyone makes nice I don’t see where net growth comes from in the next few years. Venezuela will take more than that to fix even if it gets a real government in the next few months.
It is true that we are not finding much oil now, between 7-15 billion barrels per year in the last decade. However a great deal of oil was found prior to 1980. Some years 20 times more oil was found than was used.
http://sweetcrudereports.com/2017/12/global-conventional-discoveries-hit-record-low/
With enough investment in advance oil recovery production could still increase for perhaps another 10 year max. The low oil price means a peak will happen sooner, around 2022-2025, would be my guess.
From an article regarding the recently released KSA info.
“However, I found the most significant item in the prospectus to be that Saudi Aramco struggled to break even in 2016 when Brent crude averaged about $45 per barrel. Net income in 2016 was only $13 billion, and free cash flow a mere $2 billion. Contrast that with the $111 billion in income and $86 billion in free cash flow the company made in 2018 (when Brent crude averaged $71.34/bbl), and it looks like Aramco’s breakeven price is just about $40/bbl.”
https://www.forbes.com/sites/rrapier/2019/04/01/saudi-aramcos-breakeven-oil-price-is-higher-than-expected/#5701d15f1c02
Tax and royalty policy changed 1 Jan 2017. Rendered comparisons invalid.
Sorta. Aramco is a NOC in an absolute monarchy and also the primary money maker for said. Moving money around to ease off Aramco means the Saudi state and family budgets get less.
Either way, Saudi’s tolerance for rock bottom prices is far less than they had liked to act it was,. Pared with the disclosures on Ghwar being well past peak, it paints a picture of them working as hard as everyone else. Mortal rather than magical, if one likes.
Hydrogen
The ideal zero emissions fuel.
https://worldmaritimenews.com/archives/262106/interview-hydrogen-is-the-ideal-zero-emissions-fuel/
https://www.windpowermonthly.com/article/1454127/largest-hydrogen-from-wind-project-proposed
Hydrogen is the ideal storage medium for fluctuating wind and solar power. Hydrogen can be produced during periods of excess wind and solar generation. It can then be used to power vehicles or burned to heat homes and for cooking.
The only problem is we need to spend 10 times as much as we are doing now on the technologies to move away from oil and coal.
We should be spending $2.5 trillion on wind, solar, hydrogen and heat pumps. At the moment the figure is around $300 billion.
https://www.narcity.com/news/canada-heating-up-2x-faster-than-rest-of-the-world-due-to-climate-change
https://www.ncbi.nlm.nih.gov/pmc/articles/PMC5409636/
https://www.worldbank.org/en/news/press-release/2018/01/09/road-deaths-and-injuries-hold-back-economic-growth-in-developing-countries
In 10 years time we will look back and say we could have saved the world but spent the money on arms $1.7 trillion, clothing $2.7 trillion, cost of obesity $2 trillion. Total failure to install road safety features is costing 1.2 million lives and 10 million sever injuries and costing $1-$3 trillion a year in lost productivity and care costs.
Hydrogen has too high a conversion lost. Water to Hydrogen is only 85% efficient & probably about 5% to 10% loss on compression. If you burn it to spin turbines you get at best 25% recovery. If you go with Fuel cells (presuming Solid Oxide type since Membrane FC need to be frequently rebuilt) you get about 50%.
Even Compress Air Storage beats Hydrogen for energy recovery which is about 65% efficient. Hydrogen is dead. Please stop beating this dead horse.
This guy’s Battery tech is the only thing I seen that is on the right track:
https://www.forbes.com/sites/aalsin/2018/08/24/qa-mit-professor-donald-sadoway-on-the-future-of-battery-storage-and-renewable-energies/#7bf7f9a72c62
This battery tech. does not suffer from any on the issues with solid electrode batteries and do not degrade over time. This is probably the only Guy in the battery R&D that “gets it”. That said while there are considerable cheaper than any utility scale Battery tech, they are sill pretty expensive compared pumped hydro and NatGas Turbines.
For big scale solar storage, redox flow batteries will be the solution.
Power is defined how many expensive converters you install, storage capacity by the size of a conventional tank (or a cavern) filled with electrolyt.
There are a lot of organic electrolyts in testing, most are very cheap.
For example
https://www.cmblu.com/
Schaeffler has invested there now, they are at small scale testing with 150 kwh.
Or a similar electrolyt – the nice thing about this is: The raw material (lignin) is a waste product from paper production. And it grows in billions of tons every year, so no shortage scaling this technic.
Addional, with an organic electrolyte leakage damage won’t be that high, so no need for as expensive security than with a poisonous electrolyte.
“For big scale solar storage, redox flow batteries will be the solution.”
Redox batteries degrade over time and are very expensive. Its not the electrolyte that is the problem its the degradation of the electrodes. Liquid metal electrodes solve the degradation problem since they reform into a pool of liquid instead of eroding and forming dendrites. They can also use abundant elements instead of rare and expensive elements.
Vanadium redox flow are rated with over 10.000 cycles – enough for > 20 years as solar battery (which cylcles once per day).
The electrodes in redox flow batteries don’t change – the electrolyt changes. So no dendrites on the electrodes, since there happens nothing to the material.
And thats why you can have with the same electrodes different storage – just take a bigger tank. In conventional batteries (lead, Lithium ion, solid state) you need bigger electrodes if you want more storage.
You need more electrodes when you want more power at redox flow – so you calculate how many converter and how many volume. It’s even like oil downstream business – tanks, pipes and pumps and a few aggregates.
Vanadium redox flow already works big, but is expensive. Cheap organic electrolytes are in the prototype phase.
Do we have any cost estimates for the electrolyte, and the storage tanks it would need?
Both WTI and the NASDAQ-100 are currently this morning touching the underneath side of major trendlines that originate off 2016. They are both back testing major previously broken trendlines. This pretty much the perfect set up to go short. If your a trader. We shall see and we shall see today or no later than the end of the week on a weekly chart if prices can push higher through these trendlines. If they can’t get above these trendlines. This will be the highs for 2019. Not enough time for price to go lower then sideways for awhile in order to create room to go higher. Not by the end of the year at least.
And If NASDAQ-100 plays out like it should if it indeeds gets rejected at this trendline it sets up the right shoulder of an massive head shoulders top. Points to a 35%-40% correct in all US stock markets. That should be good for at least a visit to $20 WTI.
That is my take at reading the tea leaves. 🙂
HHH,
The last severe market crash from Oct 2007 to March 2009 the S&P lost about 56% and oil prices fell about 53% (WTI 12 month trailing average from high to low), currently the 12 month trailing WTI spot price is about $63.30/b (implies a WTI oil price of $33/b for a 56% market crash), not sure if you are expecting a crash worse than 2007-2009 or a more significant reaction of oil prices, but $20/b is not very likely to last long. In fact, since 2007 WTI oil prices have only fallen below $30/b for a brief period in Jan and Feb 2016, with an average price over that two month period of $31/b, the lowest weekly (5 day average) price over that two month period was $28/b, claims of an impending $20/b episode seem to presume an impending GFC2. I remain skeptical. Oil markets look tight, a stock market crash may stop oil prices from rising further, but oil price decreases will be modest, perhaps falling to $45/b over a weekly period, if a severe (40% or more) market correction occurs.
2007-09 was nightmarish for oil because both that and the stock market were symptoms of a credit market/ real economy panic. Oil price plunged because there was a global recession from said panic, it was bad juju all around.
People can bet on that happening again if they want but it doesn’t compare well to normal stock market.
if any of that were true, statistical analysis would have already shown it to be true. And if statistical analysis had shown it to be true this would be known by all. If it were known then everyone would act upon the knowledge. The price would move via trader urgency before the indicators mentioned occurred, and the indicators could no longer indicate anything.
So none of that works, because it can’t.
Watcher,
I agree, which is unusual. Good explanation, imo.
The FED is now injecting the new money before the crash, not after as in all crashs before.
More fuel for stock buybacks and the PPT – stock buybacks are now more important than many other customers. And they are the ideal brainless buyers not looking for performance numbers and benchmarks.
I don’t buy a big crash – the small earthquake from December has woken up everybody and now they are buying the thing back up.
60 points to go for a new all time high in the S&P. Oil will be taken up with the market when they get above that mark.
So no crash. I prefer the crystal ball sitting on my table. I need it anyway to guess the wishes of our customers they are not able to express exactly.
Eulenspiegel Wrote: “So no crash. ”
But perhaps enough of a recession to guarantee Trump is booted. I don’t think anyone in the Fed wants to see Trump re-elected.
If the data is right, We’re likely already in a recession or will be soon. Home Sales, Auto Sales, Auto loan delinquencies, retail store closures, and increasing layoffs, point to significant stall in the economy. I have to imagine after 8+ years of debt growth that consumers, business, and State & local gov’t debt burdens must be close to a point that taking on more debt is going to be a problem. The entire global economy depends 100% on Debt growth to avoid recessions.
U.S. Petroleum Balance Sheet http://ir.eia.gov/wpsr/overview.pdf
EIA report a +7.2 million barrel inventory build. There was a big crude oil draw reported Mar 15th and yet API didn’t report a similar draw and so there has been a gap between EIA & API since then. This EIA build closes that gap. API were right ???
Saxo Bank – partial the shutdown of the Houston shipping channel is distorting the numbers.
Saxo chart summary https://pbs.twimg.com/media/D3PFSxeWwAIh2Fs.png
Saxo chart for imports https://pbs.twimg.com/media/D3PEvcuWAAEYH2P.png
Oilytics charts
https://pbs.twimg.com/media/D3PG-cbXoAECjdA.jpg
https://pbs.twimg.com/media/D3PJ-5gXsAEL56m.jpg
from -> https://twitter.com/OilyticsData
My crystal ball says: Oil prices will rise the next time:
https://oilprice.com/Latest-Energy-News/World-News/Three-major-Iran-oil-importers-have-stopped-buying-from-the-sanctioned-country-a.html
Eulenspiegel: “Oil prices will rise the next time”
I think so too:
1. More Money printing\lower interest rates causing the dollar to decline in value.
2. Non-Shale Oil production in decline. You cannot afford to drill for $100/bbl Oil when market prices for Oil are below development costs.
3. Shale Driller Debt is starting to come do at the end of this year. They need to either pay off or roll over those debt coupons. Shale drillers may be forced to cut or stop production growth if they cannot take on more debt.
A long article suggesting there isn’t much oil in the ANWR.
https://www.nytimes.com/2019/04/02/us/arctic-oil-drilling-well-data.html?smid=fb-nytimes&smtyp=cur
It took something like 29 wells to find any oil in the North Sea.
But yes, the results of that single well would be politically important information.
https://oilprice.com/Energy/Gas-Prices/Texas-Natural-Gas-Prices-Plunge-To-All-Time-Low.html
5.55*-$3.38=-$18.8/BOE
This facts that the shale oil producers in Permian need to pay to getbrid of the gaz because of pipeline constraints, Compressors that stops , need maintenance & overhaul means increase break even cost , and less funds to pay loan compleate DUC’s. This will strenghtening decline in oil production as it reduce free cash that could be spent in exspansion to offset decline. WTI seems to trend down in 50 USD world WTI again as surplus again starts build up….
Love how there is not even a thought to returning cash to shareholders. Not criticising you Freddy but this reality shows how broken the upstream oil and gas sector is in the US
2019-04-02 (lloydslist) Venezuela relies on Greek fleet to move crude
Venezuelan exports in March reached 860,000 bpd, the lowest monthly pace since March 2002, according to preliminary Lloyd’s List Intelligence data. Exports slumped to just over 1m bpd in February, and are just half the levels seen two years ago. Widespread rolling power blackouts that shut the port of Jose in the final week of March drastically reduced exports as the backlog of tankers waiting to load grew.
free to read https://lloydslist.maritimeintelligence.informa.com/LL1126902/Venezuela-relies-on-Greek-fleet-to-move-crude
The Greek government has aligned with China, India and Russia in rejecting the attempt to overthrow the Venezuelan government.
The EU apparently cannot force Greece to undo that alignment. Greece imports all of its oil so they probably have a substantial tanker fleet. Checking . . .
Whoa. Wiki says as of 2011 Greek tankers were 32% of the GLOBAL total. Sanctions will have to forbid consumption purchases. This Greek choice eliminates shipping scarcity as a pressure mechanism.
Last I checked, Maduro was still the elected leader of Venezuela.
Could MSM media possibly be wrong (again and again)?
Inquiring minds want to know—–
04 / 04 / 2019 (ShaleProfile) Eagle Ford – update through December 2018
December oil production, close to 1.3 million bo/d, barely changed y-o-y. Just over 1,800 new horizontal wells were able to counter the ~45% decline in legacy production in 2018.
https://shaleprofile.com/blog/
EN.
Might be helpful to readers here to show how much of the total for Bakken, EFS and PB as of 12/18 came from 2018 wells, or maybe 2017 + 2018 wells.
Heck, real world. Last new well we put in was Q3, 2014. Our 2018 annual gross was 89.4% of 2014 annual gross.
Compare shale to that! What percentage of the total do wells Q3, 2014 and prior make up of 2018 total shale production from the three largest basins?
Yes sounds like a good idea 🙂
Shallow sand,
For all US tight oil covered by shaleprofile in US summary, the wells that started producing from Jan 2007 to Dec 2014 produced 28% of all November 2018 US tight oil output (946 of 3347 kb/d). About 58% of total wells completed (about 95,000 total wells) through Nov 2018 were completed before Jan 1, 2015.
Some international inventories week/week changes (million barrels)
Light Distillates: -2.40
Middle Distillates: -6.73
Heavy Distillates: +1.13
Total Distillates: -8.00 (shown on chart)
https://pbs.twimg.com/media/D3VRDWQW4AEypzR.png
Light & Middle
https://pbs.twimg.com/media/D3VRZ93X4AAcYNg.png
Crude Oil: +11.99
Total (Crude + Products): +3.99 (shown on chart)
https://pbs.twimg.com/media/D3VRn23WAAEdoy5.png
US monthly and latest weekly inventories
https://pbs.twimg.com/media/D3VSS5YW0AAiSr2.png
There are a lot of World debt statistics with graphics in this Bloomberg article, it’s a good collection of updated data all in one place, even if you don’t agree with it.
April 3, 2019 (Bloomberg) The Decade of Deleveraging Didn’t Quite Turn Out That Way
By John Authers and Lauren Leatherby
https://www.bloomberg.com/graphics/2019-decade-of-debt/
Texas RRC completion statistics, they are never revised and I don’t know if they are complete. But at least these statistics are real data and not just a mathematical model like the EIA’s DPR?
A problem with the RRC statistics is they do not distinguish between vertical and horizontal wells, the horizontal wells especially in the Permian basin are for more productive than the vertical wells, by a factor of 5 or more on average, they are also more expensive but cost per barrel of EUR is lower.
New EPM post is up.
http://peakoilbarrel.com/eias-electric-power-monthly-march-2019-edition-with-data-for-january-2019/
also Open Thread Petroleum
http://peakoilbarrel.com/open-thread-petroleum-april-4-2019/