Edit 12/2/2016, 8:30 AM EST. A corrected chart for correction factors below and a new chart added.
The railroad commission of Texas released September output data a few weeks ago and Dean Fantazzini made an estimate of the “corrected” data for crude plus condensate (C+C) and natural gas. Last month he found there had been a structural change in the data in March and provided a new estimate using only the most recent 3 months of data, I chose to use the most recent 6 months of data instead.
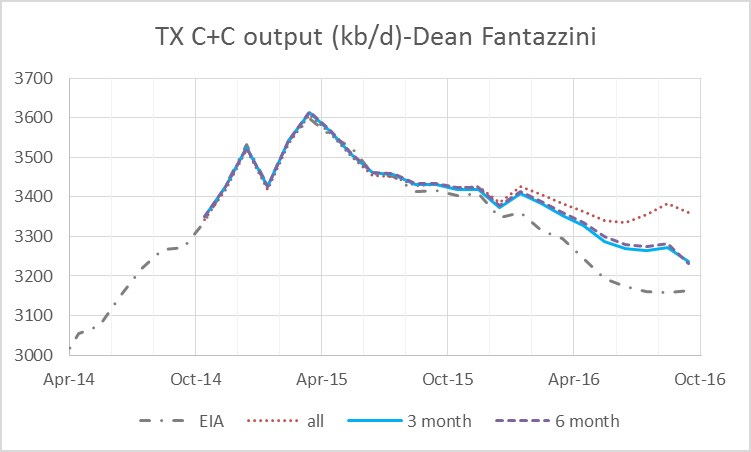
This month I will present the old estimate (labelled “all”) using all vintage data (dating back to April 2014) as well as the 6 month and 3 month estimate, which use the most recent 6 months and 3 months of data respectively.
To clarify, the data reported in November, October, and September for the most recent 48 months in each case (144 data points in all) are used to determine the correction factors for the most recent 24 months for the “3 month” estimate. Likewise 6 sets of data are used for the “6 month” estimate, and 30 sets of data are used for the “all” estimate. In each case the correction factor is the average of the 3, 6, or 30 sets of correction factors for each of the most recent 24 months (Oct 2014 to Sept 2016).
Dr. Fantazzini prefers the 3 month estimate, so in the future I will use this rather than the 6 month estimate, last month the 3 and 6 month estimates were very similar and that remains the case this month.
In September 2016 Texas C+C output fell by 38 kb/d to 3236 kb/d, based on the 3 month estimate, the EIA estimates that output rose by 6 kb/d to 3163 kb/d.
The chart below looks at the natural log of TX C+C output to estimate the annual decline rate since the peak in March 2015,the average annual % decline rate is the slope of the trend line times 100.
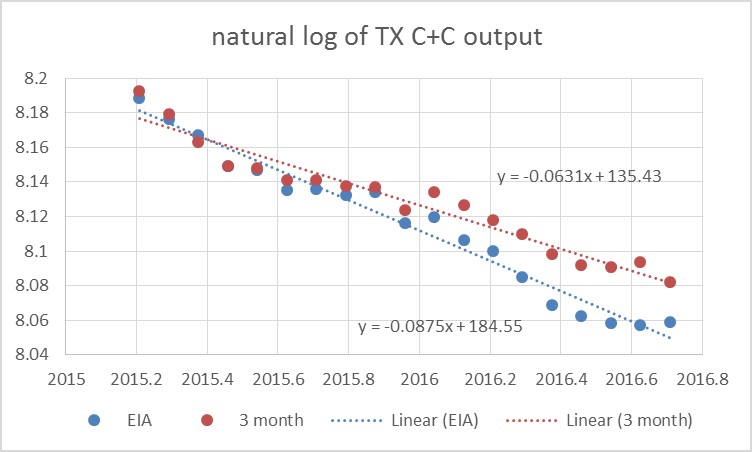
For the “3 month” estimate the annual decline rate is 6.31%/year and for the EIA estimate it is 8.75%/year since March 2015.
The chart above shows how the correction factors have changed from April 2014 to Sept 2016, I only show the correction factors for the most recent 9 months, the correction factors get progressively smaller and less variable for earlier months (10 through 23). The vertical axis is in barrels per day, divide by 1000 for kb/d, so the highest correction factor in April 2015 is about 1000 kb/d for the most recent month (1 on the chart).
The correction factors for the most recent 5 months has seen a marked drop since Feb 2016, though a similar drop was seen in April and May of 2014, maybe the RRC data has improved, we will see in the future. The estimates for C+C output are very similar from 10 months and earlier (before Jan 2016) whether the “all”, “3 month”, or “6 month” estimate is used.
The chart above compares 4 different estimates from June 2015 to Sept 2016, all, 3 month, 6 month, and 12 month average correction factors where the most recent 3, 6 and 12 months of correction factors are averaged, and “all” uses 30 months of correction factors based on RRC data from April 2014 to Sept 2016 (1440 individual data points).
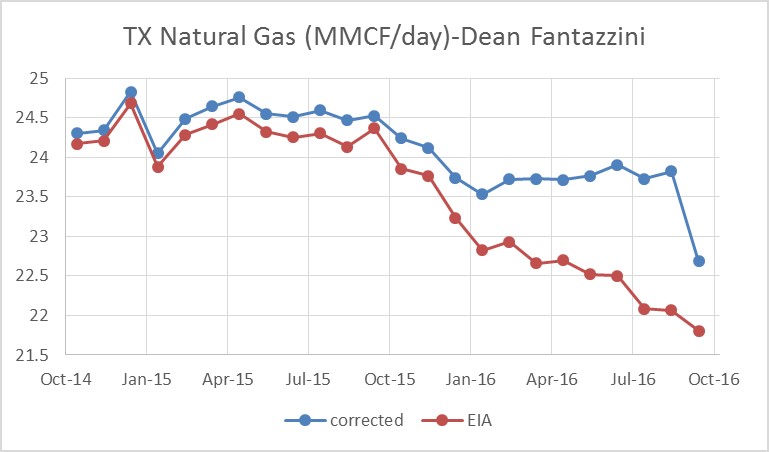
The corrected Texas Natural Gas estimate is shown in the chart above, based on Dr. Fantazzini’s estimate there was a 1.14 million CF per day drop in Texas Natural Gas output in Sept 2016 to 22.7 MMCF/d. The EIA estimate for Sept 2016 is 21.8 MMCF/d. Note that in the past there have been problems with the natural gas data from the RRC, so the big drop from August to September might be a data anomaly.
The chart that follows shows the natural log of Texas Natural Gas Output. The slope of the trend line times 100 is the annual decline rate in per cent. Since May 2015, the corrected estimate has an average annual decline rate of 4.1%/year and the EIA estimate declines at 8.9%/year.
122 responses to “Texas Update- November 2016”
Thanks Dennis,
Does that mean that:
1) The correction factor is lesser than in the past due to improved reporting by oil companies to TRRC (in electronic form rather than paper)?
2) The EIA estimate for the most recent month is some 75-80 kb/d lower than Dean’s estimate using the new correction factor. With the previous corrrection factor the discrepancy would be around 200 kb/d ?
Hi AlexS,
It is not known why the correction factors are lower, it might be the digital transition, we will need to see of the correction factors remain low.
Remember that the previous correction factor is usually applied to the previous data.
If we use last month’s 3 month correction factor for Sept 2016, the estimate would be 36 kb/d higher.
“If we use last month’s 3 month correction factor for Sept 2016, the estimate would be 36 kb/d higher.”
Higher than the EIA’s number for September?
Hi Alex S,
The estimate for Sept, 2016 would be 3274 kb/d for the “3 month” estimate using the correction factors from last month vs 3236 kb/d using this month’s 3 month estimate. The EIA estimate is 3163 kb/d for Sept 2016.
Dennis,
As you said as recently as 11/19/16
“The Texas data is incomplete. Dean Fantazzini’s estimates are much better than EIA or RRC estimates for the most recent 24 months.”
Its good to see you now acknowledge Dean’s estimates have been way off. Eyeballing the new chart, it seems the new estimates are closer to the EIA numbers than the old estimates.
However, since the methods haven’t actually changed, I imagine the new estimates will also be junk.
Perhaps, the estimate could be adapted to predict whether the next spin of a roulette wheel will be red, black, or 32.
Hi dclonghorn,
If you look at the chart the estimates only deviate about 6 months back, when there was a change in the data. We will see over time which estimates are better. The RRC data for the most recent 12 months is much worse.
Though Dean’s method is based on RRC data which varies like dice.
Numbers from the Texas RRC, indicate there was a decline from THEIR reported production from August of 56,364 bbls per day. EIA is showing an increase.
Numbers from TRRC for the recent months are incomplete as not all operators report their production data in time. You can get actual production data from TRRC statistics only with about 18 months delay.
The EIA report “collects crude oil and lease condensate (combined), and natural gas production
volume data on a monthly basis by state from a sample of well operators (oil and gas companies) “, which account for about 90% of total production in each state. To get the final data the EIA is using correction factors.
Dean Fantazzini uses his own correction factors to estimate Texas oil and gas production for recent months based on historical revisions of TRRC data for the past periods.
Yes. I realize that. The incomplete numbers for September were compared against the incomplete numbers for August. The result was a significant decline. My opinion, is that Texas production is falling, and will continue to fall at the current level of activity.
The numbers for September are more incomplete than the numbers for August;
the numbers for August are more incomplete than the numbers for July, etc.
Hi Guy,
I agree TX C+C fell by 38 kb/d.
What is the main reason they are playing with their adjustment calculations?
TRRC is revising its statistics each month as they get more complete data from companies.
They are not using correction factors and do not make estimates. They just add missing data.
The EIA is not often revising its data for Texas. The latest more or less serious revisions were made in August 2016 (when they released the numbers for June 2016). In that report they revised the data for January-April 2015.
The EIA C+C production data for Texas
I always get a big kick out of this silly debate.
Operators in Texas must make a full and precise accounting to the TRRC each and every month for every barrel of oil taken out the ground the previous 30 days. The EIA gets its data from the TRRC, or makes bad guesses just like others here feel the need to. It, the EIA, does NOT solicit production data from operators. Not from me, not any other operator I know. Operators do not have the option, or the luxury of delaying reporting, nor can it report under that “confidential” BS they have in N. Dakota. The problem has ALWAYS been TRRC processing. Texas, after all, has been overwhelmed the past 7 years with new shale oil wells. The digital reporting system is in place and working very well now. There is no more 8 month delays associated with scanning paper P-1s by outside contractors or waiting 10 months for the TRRC to convert production reported under a drilling permit number to a lease ID number, its all been fixed and the little bit of data that does not match up, that gets everybody’s panties in a bunch, is no big deal in the great scheme of life anyway. There are leaves to rake, or snow to shovel that is far more important.
Eagle Ford production is going down, Permian production is going up. Next question…
Hi Mike,
Yep we can wait 12 to 18 months, that’s a lot of leaves and snow. 🙂
The RRC has this thing called the pending file, which is not put in the RRC database available to the public for free. This data is available through other vendors and the EIA has access to that data.
So despite your belief that the data from the EIA is not good, as you said it is mostly a fuller set of RRC data, with a little bit of guessing.
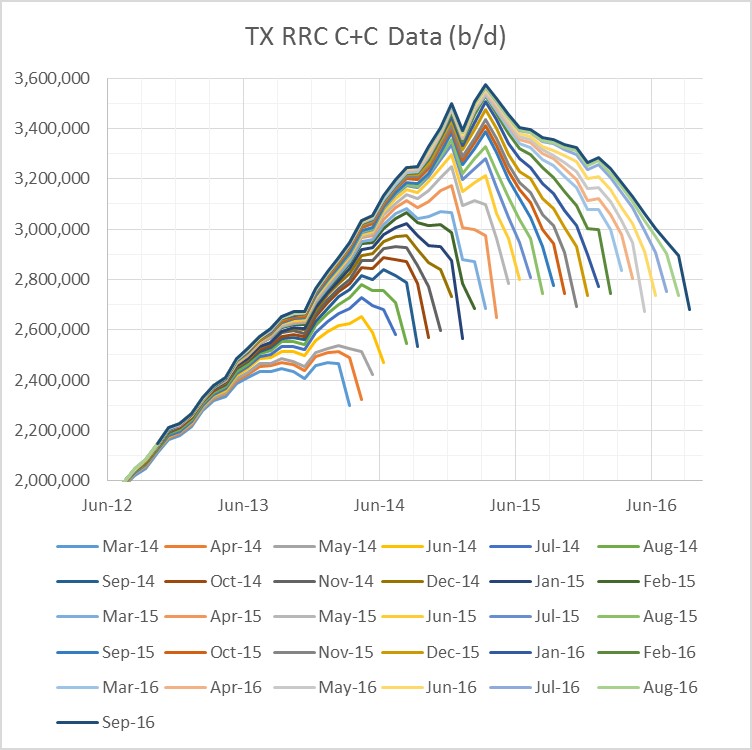
Dean’s estimate is just based on past statistics, how far off has the RRC data (as reported on the free website) been in the past is used as a guide to the future.
Eventually the RRC data is accurate, but in the past it has been about 18 months before it is within 1% of the final data (which doesn’t change much). Look at the last chart in the post, to see how far off the initial reported data is. North Dakota does a much better job, no question.
Dennis, I have no doubt this is important to some folks, I am not quite sure exactly why SO important. Operators in Texas report production each month for the previous month, without delay. Not all of that oil is sold the month it is produced and I suspect there could be as much as 2M BO on hand, or far more, on thousands and thousands of leases at any given time. When that oil is sold, months later, it must balance to the barrel with oil reported produced months prior. In other words, its a “fluid” situation, the accounting, and that may be a lot of the angst for the internet crowd. The TRRC data is ALWAYS accurate, Dennis; it does not make mistakes. The “pending” file is as I discussed, production reported by drilling permit number awaiting lease ID numbers; that’s probably the biggest source of your problems.
Less than a year ago the EIA stopped reporting lease storage across the US; I assume it gets its production data from the TRRC, makes it guesses, but then does not adjust over ensuing months as the TRRC does.
North Dakota does not do anything better than Texas except get freezing ass colder and make Bobcats in Fargo. It has 1/3rd the production on 1/10th leases, I’d guess, and the majority of that is less than 10 years old. Its director of oil and gas regulations is all over the map on everything, in fact just made the ludicrous, untrue statement that some ND oil is profitable at less than 25 dollar oil. If you think ND’s system is so much better why do guys like yourself struggle, constantly, with all that dumb confidential list stuff all the time? Shale oil is shale oil, those laterals up there look like a game of pixie stix; what’s the big secret?
The TRRC set the standard for regulatory guidance across America. Everyone gets paid properly in Texas, not too many people get strung up anymore for stealing oil; this entire TRRC vs. the EIA vs. the NDIC its only a problem for those that cannot wait a few months for the accounting to balance. Past performance is not indicative of future results; we stopped using outhouses and started using digital reporting in Texas about a year ago; the reporting system is better (it has always been good enough for Texas); accept that or not.
Hi Mike,
When I say the NDIC does a better job, I simply mean the data that they release each month reflects actual output closely.
If every oil company in Texas gives a full and precise accounting to the TRRC each and every month for every barrel of oil taken out the ground the previous 30 days as you claim, why not report those numbers?
All of the “pending file” data could just be added up and provided online, then I could take the statewide data reported, look up the output in the pending file and add it together.
It is not rocket science. If you believe a good job is getting it right after 18 months, you are a very patient man.
Texas does a great job regulating its industry, no question.
Yes Texas has a big industry with lots of leases, usually this means they have figured out how to do things well, not so much the case on reporting accurate output data in a timely fashion in my view.
So. US production is falling.
No real need then for OPEC to freeze or cut.
“US production is falling. No real need then for OPEC to freeze or cut.”
Except that the freezing/or cut was not the about market share at all. Market share story is just to write “something” in the papers for the public to explain 70% drop of oil price. OPEC (read Saudis) production cut happened as a side effect of Trump election as president and improvement in Saudi/Iran ties. There is no point for Saudis to further lose money with a change of US foreign policy that is coming with new administration. Previous one was hopeless to begin with and failed and Trump will not waste time continuing it.
Related to the previous thread: James W. Murray, 2016. Limitations of Oil Production to the IPCC Scenarios: The New Realities of US and Global Oil Production. Biophys Econ Resour Qual. http://link.springer.com/article/10.1007/s41247-016-0013-9
Abstract:
“Many of the Intergovernmental Panel on Climate Change’s Special Report for Emission Scenarios and Representative Concentration Pathways (RCP) projections (especially RCP 8.5 and 6) project CO2 emissions due to oil consumption from now to 2100 to be in the range of 32–57 Gb/yr (87–156 mb/d) or (195–349 EJ/yr). World oil production (crude plus condensate) was almost constant from 2002 to 2011 at about 74 ± 1 million barrels per day (mb/d) (US Energy Institute Agency, US EIA). There was an increase in world oil production after January 2011 that was mostly due to a surge of about 6 mb/d in light tight oil (LTO) production in the USA. This increased global oil production to just above 80 mb/d. Meanwhile, production in the rest of the world remained constant. The surge in the USA resulted in a sustained situation where supply was greater than demand globally, and this initiated a crash in the price of oil. The price of oil decreased from about $100 per barrel in mid-2014 to less than $30 per barrel in early 2016. Once the oil price declined, it was further enhanced and sustained by a decrease in demand due to a slowdown in the global economy. Because LTO is expensive to produce and was unprofitable after the price crash for the exploration and production companies, the surge in US production ended in about April 2015. Now, production of LTO in the USA is declining and global oil production is as well. New oil discoveries have reached a 70-year low, which does not bode well for future production. If the present patterns persist, it is unlikely that world oil production will exceed present US EIA oil production values of about 27–29 Gb/yr (equivalent to 75–80 mb/d) or (171–182 EJ/yr). It is unlikely that the demand for oil production required for CO2 emissions in RCP8.5 and RCP6 will be met.”
Maybe I’ve got this wrong but isn’t RCP 8.5 supposed to be an upper limit – i.e. the point that first has zero probability of happening. A very slightly lower amount of emission would have a non zero probability (but still small). Therefore the argument that RCP 8.5 has a low probability, which is one of the paper’s main conclusions, doesn’t add much. Maybe more interesting for RCP 6.0, but then coal use swamps oil emissions in all the RCPs, and possibly the changing understanding of land use and carbon cycle seems to indicate those may have a lot bigger impact than originally put in the RCP estimates.
No, RCP 8.5 is (or used to be) the “business as usual” scenario. It’s basically an extrapolation of the historic trend for economic growth (+x% y-o-y) and growth in fossil fuel consumption (+y% y-o-y). An econometric method is used to derive the relationships between different variables. This method assumes that there is no trend brake (i.e. no scarcity, lower growth, paradigm shift, etc.).
The paper basically concludes that the BAU-assumption is not valid. A handful of studies have reached similar conclusion.
Every freshman biology student since the fifties at least, and probably fifty years previous to that, lol, has run the exercise computing the number of bacteria or yeast cells, etc, if reproduction takes thirty minutes and continues uninterrupted at that rate. The answer is that the entire planet is converted to such cells in a few hours, I forget how many.
The lesson is that ” business as usual” in terms of the growth of any living organism cannot long continue.
Economists and politicians are prone to producing the sort of foolishness that is RCP 8.5. That sort of growth rate in consumption of finite resources cannot continue very long.
And unfortunately, real scientists, as opposed to economists, who are not quite there yet, in scientific terms, apparently find it necessary for unspoken but obvious reasons to keep their pie holes shut about fossil fuel depletion.
In a nutshell, the economists on the one hand, are taking us all for fools in telling us we can do the impossible, and continue to burn more and more fossil fuels, even as the remaining ff one time gift of nature endowment grows less year by year.
And on the other, the climate and environmental science establishment is, with good intentions, treating us like kids, using the RCP8.5 scenario to scare us into behaving.
White lies are still lies, and I am not so sure in this case that allowing this one to pass by default is a good idea. The average citizen at large, the man on the street, might be better approached by explaining to him that we are up against depletion just as much as we are against climate change.
I personally have found that the depletion argument is a head shot, pun intended, that can convert a hard core anti renewables conservative into a believer in wind and solar power and electrified automobiles quite often, if you are careful not to step on his cultural and economic toes in making the argument, and of course avoid insulting his intelligence above all.
It’s not that such people cannot think, but rather that they think like computers fed bad data, they produce junk results. And they don’t trust the true and accurate data, because it is delivered mostly by messengers they perceive to be agents of the cultural enemy.
I am not a good researcher, and can’t afford an assistant, but someday I hope to run across a list of the towns where there were once coal mines, worked out and abandoned, and oil wells, depleted and abandoned, here in the Land o’ the Free and home of the utterly complacent – due to ignorance of depletion.
Also iron ore deposits, phosphate rock deposits, etc.
It’s going to be a damned long list, and if I can put it in front of people who have never given depletion much thought, it will knock them back on their ass, forcing them to think a little about physical realities.
Taters grow back, oil and gas don’t.
Ordinary people, the kind who voted for Trump, and yes, most of the kind who voted for Clinton, are in my estimation more easily swayed by the sort of facts that are OBVIOUS TO THEM, once encountered, than by arguments about climate, which to a person without some fairly serious technical education, is more an abstraction than anything else.
You can take this to the bank. The average young woman ( or man) who is majoring in English or business administration believes in forced climate change not because she understands the science, but rather because her TRIBE tells her it is real.
She doesn’t HAVE any credits in biology or physics or chemistry or geology on her transcripts, other than maybe one survey course, which involves no math, no labs, no study in depth of anything at all. In such a course, you simply repeat back to the instructor what he lectured, and that instructor was expected to cover the field in general terms, meaning there was no time to discuss ANYTHING in detail.
That sort of class makes no deep or lasting impression on the mind, and is soon forgotten.
Hi Oldfarmermac
Keep in mind RCP 8.5 is about 2 times more than any reasonable scenario. RCP 6.0 is about the same as Mohr’s high scenario with methane hydrate and kerogen resources. RCP 4.5 is close to the medium best guess scenario.
Back atcha, Dennis
Your point about RCP 8.5 being WAY out of line, and RCP 4.5 being reasonable and the best guess is half of what I was trying to get across.
The environmental establishment and the climate science establishment as a general rule use the RCP 8.5 scenario the same way a half smart, half stupid adult uses the worst possible case examples to prove to his kids they should never drink and drive, or smoke pot.
The kids are pretty quick to figure out the real deal, that the odds are VERY HIGH that you will NOT have an accident any one time you have a couple of beers and drive, etc.
There are plenty of anally retentive control freaks like the ones Trump is appointing to office who either believe or pretend for some reason to believe that pot is a very dangerous drug, but all such a person accomplishes, in terms of convincing people who know better, is the complete destruction of his own credibility.
Talking about the sky falling, day in, day out, for decades, when it just doesn’t fall, is virtually guaranteed to cause the audience to get totally bored with the topic, and tune it out.
Some honest talk about the depletion of fossil fuels coming from the environmental and climate establishment, IN CONJUNCTION with the endless talk about climate change, MIGHT convince quite a lot of people to take both the climate issue and the renewable issue more seriously.
Depletion is a concept that is much easier to get across to most people,and especially to those lacking technical expertise, in my experience. The national security aspect of freeing ourselves of the need for imported oil is easy to get across to hawkish people.
But there seems to be an unspoken consensus that it’s better to keep talking about runaway consumption of fossil fuels leading to runaway climate troubles, apparently because mentioning depletion will result in the audience concluding that depletion will solve the climate problem for us, thus eliminating the need for regulating ff consumption.
My argument is that it might be better to let the audience have it with both barrels, and talk about both climate and depletion as a regular thing.
I am not sure it’s a good argument, in terms of dealing with the public as a whole, but it works like a charm one on one in my experience.
And as bad as runaway warming is going to be, the extended consequences of depletion might actually turn out to be worse.
Any well informed person understands that we have had troops on the ground in Sand Country in large numbers for the past few decades for ONE overriding reason- that’s where the oil is, or was perceived to be.
Wars have a way of getting out of hand. The next hot resource war might be right around the corner, and with bad luck it could morph into WWIII with hundreds, maybe more, of nuclear weapons used.
Quite a lot of people are willing to take such arguments as seriously as a heart attack.
They can be converted into supporters of renewable energy, conservation, efficiency, and tough environmental laws if you approach them the right way.
Great post.
Hi Old farmer mac
I was agreeing.
Will refrain if you prefer.
OFM,
I think you misjudge the ability of an ordinary non-scientist to understand the basic concept of greenhouse gases causing climate change. A gas like CO2 goes into the atmosphere. It keeps heat from leaving the earth as fast as before, so the atmosphere warms up.
This is no more complicated than depletion of a finite resource, but the devil is in the details of both issues. How much gas, how soon, how much warming? How much depletion, how soon, how long will it last? Both issues can be studied all the way up to the level of Phd detail, but the basics are obvious.
The only problem is that neither issue is causing enough of a dramatic change in anyone’s life that they are willing to adjust what they do every day. Anyone will pee their pants and run when staring down the barrel of a gun, but it takes a really brave person to take action on a danger that they think might only affect their descendants way down the road, especially if even their suggestion of taking action makes their friends and family roll their eyes.
Most people, regardless of tribe, understand the dangers of global warming and resource depletion; they just aren’t brave enough to do anything about it.
The CO2 absorption spectrum is well known, obvious and fairly easy to explain. However, the feedbacks at different concentrations, and the interactions or coupling between the atmosphere and the ocean are difficult to figure out. And this is one reason why there’s such a wide range of predicted outcomes. Also, there’s a significant difference between what some of us think are likely emissions and the bizarre establishment business as usual pathway (the infamous RCP8.5).
The paper basically concludes that the BAU-assumption is not valid. A handful of studies have reached similar conclusion.
The problem with that statement is that BAU emissions scenario is not the major factor once feedbacks and tipping points have been passed. The problem then becomes all the carbon and methane that is released from soils which then causes even more tipping points to be reached and passed compounding the problem with an accelerating series of events. The climate is a dynamic chaotic system and it is connected to multiple other dynamic chaotic systems such as marine and land ecosystems. How all those systems will behave is very difficult to predict but things don’t look very promising for a happy outcome!
http://peakoil.com/enviroment/scientists-have-long-feared-this-feedback-to-the-climate-system-now-they-say-its-happening
In a massive new study published Wednesday in the influential journal Nature, no less than 50 authors from around the world document a so-called climate system “feedback” that, they say, could make global warming considerably worse over the coming decades.
That feedback involves the planet’s soils, which are a massive repository of carbon due to the plants and roots that have grown and died in them, in many cases over vast time periods (plants pull in carbon from the air through photosynthesis and use it to fuel their growth). It has long been feared that as warming increases, the microorganisms living in these soils would respond by very naturally upping their rate of respiration, a process that in turn releases carbon dioxide or methane, leading greenhouse gases.
It’s this concern that the new study validates. “Our analysis provides empirical support for the long-held concern that rising temperatures stimulate the loss of soil C to the atmosphere, driving a positive land C–climate feedback that could accelerate planetary warming over the twenty-first century,” the paper reports.
This, in turn, may mean that even humans’ best efforts to cut their emissions could fall short, simply because there’s another source of emissions all around us. The very Earth itself.
Bold mine.
Hi Fred,
“The climate is a dynamic chaotic system and it is connected to multiple other dynamic chaotic systems such as marine and land ecosystems. How all those systems will behave is very difficult to predict but things don’t look very promising for a happy outcome!”
Excellent Fred: I’d even suggest, as a long retired geoscientist, that in the grand scheme, runaway climate change(s) are the norm rather than the exception. It’s likely we’re simply adding fuel to the fires-of-change (like one of those nasty mammoth meteorites) by tossing a trillion or so tons of CO2 into the heap — an undoubted foolish prank that will leave an interesting layer to earth’s stratigraphy for a new future species to mull over.
…a foolish prank that will leave an interesting layer to earth’s stratigraphy for a new future species to mull over.
Welcome to The AnTrumpocene, The Greatest Geologic Epoch ever!
Fred: I’m fairly familiar with climate research. I haven’t argued against AGW. It’s the emission trajectory from combustion of fossil fuels that many (I included) find to be way of. If climate sensitivity is much higher than assumed then there are two errors: i) the emission scenarios for fossil fuels, and ii) the structure of the model that is used (feedbacks, parametrization, etc.). Two wrongs don’t (necessarily) make a right.
Hi Fred
The study uses a business as usual scenario aka RCP8.5.
The paper concluded that this reinforces the need for lower emissions.
It does not conclude the tipping point has been reached.
It does not conclude the tipping point has been reached.
And I never said it did! What I am saying is that there are plenty of tipping points that look like they are in danger of being reached in the very near future. The vast majority are in areas related to biodiversity, ecology and the ability for organisms to adapt at fast enough rates to survive extinction.
Here’s one link to start with:
http://science.sciencemag.org/content/318/5857/1737
Plug it into iris.ai and hit explore for plenty more where that came from.
IRIS.AI
Coral Reefs Under Rapid Climate Change and Ocean Acidification
I’ve identified 281 related papers and grouped them by concept.
Hi Fred,
I agree with your argument.
My argument is that if one wants to be taken seriously, one should use reasonable scenarios. Almost every study chooses RCP8.5 for their baseline scenario. It is a little like saying lets assume population growth stops and renewable energy output doubles every year, in other words, not realistic.
If the climate scientists want the researcg to be taken seriously, they should use RCP4.5, and nothing higher than a scenario with cumulative emissions similar to RCP6.
Note that emissions equal to RCP6 are possible, but not likely, and RCP4.5 is pretty realistic, at least through 2070 or so, a problem with all these scenarios is that they assume emissions stabilize so that RF is flat from 2100 into the future, a decline in emissions is more realistic in my view after 2060, probably falling close to zero by 2100.
So now we have a new panic button: no matter what the emissions level, we MAY reach a “tipping point” based on our new model. Don’t you realize you are losing credibility taking refuge in an endless set of hyperbaric panic mongering studies based on…RCP8.5?
Hi Fernando,
The studies would likely show the same effect with RCP4.5,though probably less pronounced. I wish more studies used RCP6 or RCP4.5 as 5000 to 6000 Pg of Carbon emissions is highly unlikely (which is the level of RCP8.5).
Many will claim that emissions are not very important because of natural feedbacks. If that is the case, the studies should show that by using the RCP4.5 scenario to show that even with a medium (likely) level of emissions there will be significant problems, more people would be convinced by such studies in my view.
EIA GoM data for September is also out and there was a big fall – down to 1507 kbpd from 1646 in August (8.4%) and 1661 last September (9.3%). I guess it is mostly Hurricane Hermine but I think the rigs were shutting in in late August as well. Overall this year has been pretty flat for production so far rather than the expected upward trend, there may be a late surge though. Next year is likely to decline as there aren’t many new projects, and a couple that were planned got advanced to this year. Three or four new start-ups are still ramping up but that will probably mostly finish in the first half.
https://www.eia.gov/dnav/pet/hist/LeafHandler.ashx?n=PET&s=MCRFP3FM2&f=M
GOM production through 9 months of 2016 is averaging about 1.57 mmbopd. The EIA predicts 2017 GOM production to average about 1.8 mmbopd.
The 3 major projects that were announced to come on line in 2016 – Heidelberg, Stones and Julia – have already done so, and, as of September, were all still fairly early in their ramp ups with total production from all three fields about 30 kbopd. I would expect them to average between 80-100 kbopd in 2017 (total from all three fields). The next big GOM projects aren’t scheduled to come on line til 2018 – Big Foot and Stampede.
Even though drilling activity is down, activity levels remain fairly high in the biggest fields, and I expect production levels from these fields, as a whole to remain at least flat, or even increase slighty through 2017. These fields include Mars-Ursa, Atlantis, Mad Dog Spar A (separate from the newly announced Mad Dog 2 project recently sanctioned by BP), Great White, Tahiti, Jack-St.Malo, Thunderhorse/Thunderhorse North, and Lucius.
I predict that 2017 GOM production will average around 1.6 mmbopd +/- 50 kbopd.
Thanks SouthLaGeo.
Was the hurricane the reason for the drop in Sept?
The EIA projects GoM C+C production to average 1.63 mb/d in 2016 (STEO November 2016).
Average output in January-September was 1.59.
Actual production in September was 90 kb/d below STEO projections (1,507 and 1,597 kb/d, respectively).
The EIA projects further growth to 1.78 mb/d in December 2016 and 1.98 mb/d in December 2017.
The EIA is always projecting significant declines in GoM oil production during the hurricanes season in September. This year, they have underestimated the effects of the hurricanes (probably due to incorrect weather forecasts). But they are projecting a huge drop in September 2017.
In a separate news:
“Russia’s largest oil producer Rosneft and ExxonMobil have decided not to proceed with joint development of oil blocks in the Gulf of Mexico due to “lack of prospects”, Interfax news agency quoted Rosneft as saying on Friday.
In 2011, both companies signed a broad cooperation agreement, which included offering Rosneft equity interests in Exxon exploration projects in North America, including deepwater Gulf of Mexico and fields in Texas.”
http://www.reuters.com/article/us-russia-rosneft-exxon-mobil-idUSKBN13R1NT
C+C production in the GoM (mb/d)
sources: EIA STEO, November 2016; EIA production statistics to September 2016
Dennis,
I think both Alex and George are right in that the September decline was Hurricane related.
I noticed that Alex’s Jan-Sept production was slightly different from what I stated, and I think that is due to there always being a slight difference between EIA and BSEE data (1.59 vs. 1.57 mmbopd). Not sure which is more correct, but I usually use BSEE data.
Assuming approximately 10% natural decline rate (as seen when drilling stopped in 2011) then the STEO is anticipating 570 kbpd production to come on line before December 2017 – that would require a nameplate of over 700 I’d guess, given ramp up times and lower production system availabilities usually seen in the first year. I really can’t see that happening. I can see a big jump in October and then possibly a gradual increase to summer. But after that I think there’ll be a clear decline set in. There is a reasonably large tie back for Thunder Horse planned, but I think some other expected subsea work may have been delayed because of the issues surrounding Anadarko taking over Freeport Mcmoran (though that deal will simplify a few such projects over time).
The price fell because…
“…oil prices will need to rise above $70/b as the new well EUR will decrease over time and wells will not be profitable to drill even at $80/b (in 2016$) after 2018… In 2015 it takes at least $80/b for the average new well to be profitable… The 38% lower output of the 2028 well will require higher oil prices in order to earn a reasonable rate of return…
In fact the $90/b (in 2016$) estimate for the oil price needed in 2030 is likely to be too low rather than too high.” ~ Dennis Coyne
Hi Caelan,
The price of a good is not determined by how much net energy it delivers to society.
How much net energy is delivered to society by the computer you are using?
I am not sure about your computer, but my computer cost more than zero, and the implication is that since it delivered no net energy to society its price should be zero.
Oil is no different, the price is determined by the price people are willing to pay for the products produced from crude oil. Nobody knows how much net energy is provided to society by the gallon of gasoline they put in their car, and most people don’t care.
The assumption that oil cannot be an energy carrier at some point is false, just as people pay for electricity because it is useful, they will do the same for gasoline or diesel fuel regardless of the net energy provided to society by the fuel as long as the price is competitive with any potential substitutes. At some point in the future substitutes such as BEVs and PHEVs might reduce demand for oil below the level of supply and at that point oil prices will fall, a recession could also reduce demand for oil and reduce prices. The timing of a recession is difficult to predict, but I expect battery powered vehicles to start impacting demand for oil between 2025 and 2035 (2030 is my best WAG).
Hi Dennis,
Your response, along with Rune’s in the same thread, was carried over here.
Thanks for the elaboration.
Back later.
Caelan,
”Falling production is likely to produce a cascading effect as 57% of the demand for petroleum now comes from the petroleum production system itself.
The above has repeatedly been demonstrated to be a FALSE claim.
Whoever produced that claim should be ready to back it up with documentation from the real world.
That 57% translates to an EROEI of 1.75 for petroleum.
Hi Rune,
Nice to catch you and thanks for the clarification. I was going to post a comment on your blog for you to refer to something, but your comments are closed. (Could you keep them normally open longer?)
The claim was apparently by ‘shortonoil’, (AKA Bedford W Hill?).
Their claim with your response is also here.
Have to head out, back later.
Caelan,
Comments are automatically closed after 2 weeks on my blog and I will not change that.
It is also possible to reach me by e-mail.
From BP;
http://www.bp.com/en/global/corporate/sustainability/environment/energy-use.html
Upstream
“We measure the energy performance of our upstream operations by calculating the energy used by, or lost from, our operations as a percentage of the energy produced by our operations.
In 2015 the overall production/consumption and loss was 6.6% (2014 7.6%, 2013 7.5%). Approximately 5.3% of our production/consumption and loss was from energy consumption within our facilities, with the remaining 1.3% from flaring and venting.
In our operations, the production/consumption and loss measure over the past few years shows an overall increase, although the percentage is generally lower in our newer assets than in our maturing assets. This is because the amount of energy required to produce hydrocarbons from mature reservoirs, which become depleted of hydrocarbons and reservoir energy, does not decline at the same rate as the production declines. Also, more energy-intensive secondary and enhanced oil recovery techniques can contribute to increased energy consumption when used to maximize recovery and limit decline in certain assets. The decrease in production/consumption and loss in 2015 is primarily due to divestments in Alaska and a reduction in flaring.”
At the bottom of the page
”The information on this page forms part of the information reviewed and reported on by Ernst & Young as part of BP’s 2015 sustainability reporting.”
BP’s numbers have been audited by a third party. That should count for something.
Deriving EROEI from BP loss data with the oil price in the table below.
Note how EROEI comes up with a significant drop in the oil price. This should be expected as a high oil price allows for lower EROEI sources to be profitable.
Hi Rune,
Thanks. I think Bedford Hill also includes energy used to refine, transport (to and from the refinery) and distribute (at the retail level) the products produced from crude oil.
Using the data from the page you linked the EROEI for the entire BP system (upstream, downstream, and other business and corporate) would be about 8.8.
He might go further and claim that exergy is what matters, so if we assume most of the fuel gets converted to work at about 33% efficiency, then we are left with about 3 units of work for each unit of energy invested.
Note that I do not agree with his analysis, but this is the way he frames things.
In my view a major shortcoming of Hill’s analysis is the assumption that oil price is related to net energy (or net exergy). People buy the fuel because of the energy content of the fuel itself, the energy used to produce it will affect the cost of production and influence the price in the long run, if people are not willing to pay the cost of production the oil will not be produced and supply will decrease.
Clearly you know this, but there are some who do not agree with my assessment.
Hi Dennis,
BP is specific about their boundaries and I agree that refining and distribution should be included.
How the EROEI, from exploration to consumers, is affected there are some data on, and I suspect if these were included it would bring the EROEI (full cycle for oil) in the range of 10-15 (this also based on actual data from Norway and published works by others, ref link below).
http://journals.plos.org/plosone/article?id=10.1371/journal.pone.0144141
Exergy (available work), applies along the whole value chain all the time. This is not a new discovery and has been known for centuries.
When a consumer buys a gallon of gasoline (or diesel) he gets (for all practical purposes) the same gross energy content as he did 30 years ago. Efficiencies in its usage have improved.
Anyway, how you cut it there is a huge difference (as a factor greater than 10) in how much energy (from oil) is now made available for societies between the Hill method and all others (estimates from oil companies, peer reviewed publications, EIA, IEA etc.) and so far Hill has not produced convincing documentation that describe the causes for these differences.
What would be helpful was if Hill described the results from his model in Sankey diagrams, showing the evolution over some time (like each decade). With Sankey diagrams it becomes possible to follow gross inputs, energy used for developments, operations, transport, refining and distribution to what becomes available for societies (consumers) and also usable work.
Such an analysis would also have to incorporate the energy inputs from other energy sources.
The oil price has been and is primarily driven by supply and demand.
Thanks Rune.
I agree. I am not suggesting that exergy is the way to go, but it might be how the Hill Group gets to 1.75 for net exergy. If we consider a company focused on LTO or oil sands, their EROEI might be lower than BP and including refining, distribution, extraction and corporate energy use and then reducing by a factor of 3 for thermal losses in an ICE, perhaps the worst companies might be at 1.75. A problem with this is many companies produce a fair amount of NG with less refining and better thermal efficiency, so the 1.75 is likely an overstatement as you suggest.
”….but it might be how the Hill Group gets to 1.75 for net exergy.”
Dennis, what you suggest is that they are using different methods for energy accounting along the value chain.
You have read their report, can you confirm that this is so?
Irrespective (as I said above) of gross or net the EROEI should come out close to the same.
(The laws of thermodynamics and thermal efficiencies applies to everyone.)
Now with oil prices at $50/bo I would expect the threshold for EROEI (full cycle) to be above 5, ref tight oil.
Hi Rune,
I didn’t read the paper carefully enough to answer.
Link to paper below
https://www.dropbox.com/s/5bnyippeggas1w7/Hill%20group.pdf?dl=0
In the paper they define EROEI as follows:
The Gross Exergy divided by the Production Energy (at the well head).
Production energy is also defined in exergy terms, in other words it is the work needed to produce the oil (rather than simply the energy).
Dont seem likely Ernst & Young know anything about EREOI.
But then neither does anyone else.
http://www.rrc.state.tx.us/oil-gas/research-and-statistics/production-data/texas-monthly-oil-gas-production/
All Texas has to do is reduce production to 2010 levels and the ship will come in.
426,737,094 barrels of oil, all of 2010 production, crude and condensate.
1,243,528,024 barrels of oil, crude and condensate, boe, all of 2015 production.
An increase of 800 million barrels of oil and barrels of oil equivalent for one year’s total production.
Probably all sold with not one penny of profit for all of the hard work. Giving the stuff away by the hundreds of millions of dollars. Getting taken to the cleaners, as it were.
The numbers tell the story, Texas has to run faster to remain further behind.
Ain’t no money in it, it will lead you to an early grave, all deference to Tom T. Hall and Clayton Delaney.
According to preliminary estimate by CDU TEK, statistical unit of Russia’s Energy Ministry, the country’s C+C production in November was 11.21 mb/d, 0.17% lower than post-Soviet record 11.23 mb/d in October.
Average daily output in November was 426 kb/d (3.95%) up year-over-year.
Average production for January-November was 10.91 mb/d, 231 kb/d (2.17%) above the same period of 2015.
Comments from Bloomberg on Russia’s decision to cut output in 1H2017:
“Russia promised to support a push by the Organization of Petroleum Exporting Countries to reduce a global oil oversupply after the group agreed to cut production by 1.2 million barrels a day on Wednesday. Energy Minister Alexander Novak pledged Russia would cut its own output by as much as 300,000 barrels a day, a stronger move than the previously preferred position of a freeze.
Russia will make a gradual reduction over the first half of the year starting in January, Novak said Thursday. The reduction, supported by Russian oil producers, would be spread proportionally among companies, he said without providing further detail.”
https://www.bloomberg.com/news/articles/2016-12-02/russian-oil-output-near-post-soviet-record-as-it-prepares-to-cut
“Cuts are more likely to be achieved by dialing back drilling on older fields, allowing the natural decline rates to grow, as opposed to stopping new projects”
https://www.bloomberg.com/news/articles/2016-12-01/russia-s-pledge-to-opec-will-mean-herding-cats-to-deliver-cuts
Russia’ C+C producion (kb/d)
source: Energy Ministry
Hi Alex S,
Do you think the production bump from August to November was in anticipation of a cut back in Jan 2017? In other words, increase production by 300 kb/d so you can later claim you have cut by 300 kb/d, when all along the industry really wanted to maintain a plateau at about the 10.8 Mb/d level.
Smart move by the Russians, as usual.
Dennis,
As I had explained in one of my posts last month, the increase in production was due to start-up of several fields: East Messoyakha, Suzunskoe, Fylanovsky and others; as well as ramp-up of output at several other recent start-ups: Novy Port, Prirazlomnoye , Trebs & Titov and others.
Companies had been developing those fields for years, and start-ups were certainly not related with OPEC – non-OPEC production cuts.
Until recently Russia was pledging only to freeze output at end-2016 levels.
That would represent a cut of 200-300 kb/d vs planned average production level in 2017, as new start-ups are scheduled for next year. Therefore, a cut of 300 kb/d from current levels actually represents a cut of 500-600 kb/d vs. planned production volumes for 2017.
I don’t know why the Russian government ultimately decided to agree on output cut.
According to Bloomberg, the consensus was achieved during a night phone call between the Russian and Saudi energy ministers.
https://www.bloomberg.com/news/articles/2016-12-02/opec-deal-hinged-on-2-a-m-phone-call-and-it-very-nearly-failed
Russian analysts say that the OPEC-NoPEC deal could add some $10 to the average oil price in 2017, and that’s more than enough to offset the effects of lower production/export volumes on Russia’s state budget and oil companies’ revenues.
I also think that there were some behind-the -scene political negotiations on the situation in Syria and the Middle East in general. In that sense, I would point to Saudi Arabia’s agreement to allow Iran to increase output to pre-sanction level (rather than cut production), which was completely unexpected.
That said, I note that Russia’s agreement to cut output was preliminary and informal. Official negotiations between OPEC and Russia are planned for December 10 in Moscow.
There is a serious chance that OPEC members will not comply with their newly established quota, and it that case Russia will feel free to increase output.
Furthermore, as the article in Bloomberg says, “Russia will make a gradual reduction over the first half of the year starting in January”. That doesn’t mean an immediate cut from January 1st, and average volumes in 1H2017 will not be 300 kb/d lower than in 4Q16.
Finally, I think that the agreement will not be prolonged for the second half of next year, as higher prices should stimulate a rebound in the US LTO sector.
Hi AlexS,
Thanks. I don’t think $10/b more will change things very much for most of the US LTO sector. They need $25/b higher prices at least for most of the major plays to be profitable. The higher prices might be enough to arrest the decline, but I don’t see higher output without higher prices ($75/b WTI or more).
Russia’s cut is likely to be from 2017’s planned production increase. Just like Congressional budgeting and what a cut means in Washington.
Saudi and Russia really needed the higher prices, didn’t they? Is this for budgetary reasons (Export Land Model stuff) or because their recurring operating costs are higher than everyone assumes?
Saudi Arabia, Russia and other oil exporters need higher prices because of fiscal deficits.
Oil price needed to balance 2016 state budget:
Algeria: $90.60
Angola: $66.06
Ecuador: $104.69
Iran: $55.30
Iraq: $58.30
Kuwait: $47.80
Libya: $216.50
Nigeria: $85.40
Qatar: $62.10
Saudi Arabia: $79.70
United Arab Emirates: $58.60
Venezuela: $117.50
Russia: $69
https://www.bloomberg.com/news/articles/2016-11-28/saudis-temper-call-for-cuts-russia-digs-in-opec-reality-check
Costs in Saudi Arabia and Russia are among the lowest in the world.
All Russian oil companies remained profitable and generated free cash in 2015-16.
AlexS. Those numbers have fallen quite a bit since the oil price collapse.
No one needs any price for fiscal breakeven.
You achieve it by spending less. Or by having your central bank buy your deficit’s borrowings (that’s what the US does).
Factbox: U.S. oil companies cut 2016 capex by $54 billion, or 40 percent
Thu Dec 1, 2016 | 2:16pm EST
http://www.reuters.com/article/us-oilprice-capex-usa-factbox-idUSKBN13Q5KE
Major U.S. oil and gas producers made steeper cuts to their annual capital expenditure targets in 2016, their second straight year of reduced spending.
The top 25 U.S. oil companies by output have reduced their 2016 budgets by a combined $54 billion, or 40 percent, according to a Reuters analysis, much steeper than a 29 percent cut last year.
Devon Energy Corp has slashed its 2016 capital budget by about $4 billion, or 72 percent, the biggest cut among global independents, while Whiting Petroleum Corp axed its budget by $1.93 billion, or 78 percent, the biggest among U.S. shale-focused companies.
Global exploration and production spending is expected to fall by 26 percent in 2016 to below $400 billion for the first time since 2009, with the most severe cuts being made by North American producers, according to Evercore ISI data.
https://aleklett.wordpress.com/2016/12/02/world-energy-outlook-2016-fatih-birol-in-brussels-2/
World Energy Outlook 2016 – Fatih Birol in Brussels
On 16 November 2016 the International Energy Agency (IEA) presented its annual ”World Energy Outlook” report (WEO-2016). Two days later on 18 November, Fatih Birol presented WEO-2016 at the Centre for Strategic and International Studies in Washington. On 21 November it was the turn of the Friends of Europe in Brussels to host Dr Birol’s presentation. Birol’s journal continued then to Japan and many other nations. WEO-2016 is a weighty tome and there are few such books that receive this degree of attention…
Sounds like the new Alekett book will be worth a read when available in English. I hope it covers the export issue in detail, which he didn’t touch on in the linked article. At the moment exports are about half production. It is hard to see many scenarios where this wouldn’t decrease fairly quickly if overall supplies start to fall. Saudi is replacing some oil with gas for power use but overall their internal use still seems to be on the increase – some of this is for home grown petrochemical industries. Venezuela’s internal use has declined as it has collapsed, but that has also had the effect of hitting overall production even harder. EROI is also relevant – as it falls the extra recycled energy is seen as internal use by the producing country and not available for export (there is a question here of whether increasing EROI rate would balance the reduction in internal E&P use as production falls).
If exports are half and production falls x percent, but internal producer country use stays constant or even increases then exports fall by 2x or more. There was Swedish study that, from memory as I couldn’t find it on a quick search) indicated sudden loss of oil imports at 3% led to depression, 25% to societal breakdown and 50% to famine and failed states. By the chart presented (which is still very optimistic based on actual discoveries and current rate of project approval) then the 50% loss in availability might be less than 15 years away. Is that slow enough to adapt? I’d say no way to give a good solution. The most obvious adaption is going to be an accelerated rise in populist demagogues with extreme policies and overall isolationism.
Hi George,
From the linked article but IMO worth repeating: “In Figure 3.16 the IEA shows for the first time what will happen if its unrealistic wishful thinking does not become reality during the next 10 years. Peak Oil will occur even if oil from fracked tight sources, oil sands and other sources are included. It is this figure that led me to congratulate Fatih Birol on a good report. My comment was the IEA was rapidly approaching the same viewpoint as that held by the Global Energy Systems (GES) research group of Uppsala University. I cannot cite a reply from Fatih Birol, but I can say that a twinkle in his eye and a smile were there to be interpreted and I have chosen to interpret them in my own way. Our calculations of oil production volumes of 2004 have been supplemented since then with oil and natural gas liquids production from fracking but there have been no other major changes. The IEA has gone from predicting in 2004 a future rate of oil production of 121 Mb/d down to, now, maybe 80 Mb/d including from fracking.”
Note KSA will become the #4 oil consumer in the world (US, China, India) this year at about 4.1 million bpd, surpassing Japan who likely will drop under 4 mbpd (population shrinkage).
KSA’s population : 31.5 million.
KSA’s oil consumption growth last year: 5%
“Saudi Arabia still has production potential, according to al-Naimi. During a panel discussion with Hess Corp. CEO John Hess and former Schlumberger Ltd. CEO Andrew Gould, al-Naimi said his country has untapped shale-oil and gas reserves, and advancing technologies would only bring shale production costs lower.”
Translation: Saudi doesn’t have any more undeveloped oil fields. Only gas which they can use to displace local oil use for local power generation.
KSA has constructed chemical plants and refineries. I am reasonably sure that a lot of the chemicals and refined products are exported. Not “consumed” by KSA.
statistics account exported refined products as exported, not consumed
KSA Electricity 65% oil, 27% nagas, 8% steam(?no idea what that means).
generation capacity 55 GW. Consumption peaks 60 GW by 2023. This don’t look like any is exported.
Okay, have it your way. But does it pass the smell test? 31.5 million people are consuming 4.1 million bpd? If the US used as much per capita, we would be pushing 42 million bpd.
So, how exactly is every man, woman and child in KSA consuming 5.47 gallons of oil every single day? Seriously, I have no clue.
According to the IEA, KSA oil consumption in 2015 was 3.3mb/d; projections for this year are 3.25 mb/d.
In the U.S., petroleum products are not used for power generation.
And in KSA fuel oil, diesel, some other products and even crude are the main fuel in power plants.
In KSA a lot of electricity is used for air conditioning and water desalination.
Consumption sharply rises during the summer season.
Therefore, KSA has to increase oil production as it tries to keep more or less stable export volumes.
Saudi Arabia oil consumption (kb/d)
source: JODI
Saudi Arabia crude and refined product exports (mb/d)
source: JODI
the number is right from the BP bible. It *is* all liquids.
Look at the KSA consumption graph below, or sashay over to BP to get their spreadsheet. I did. It’s there. 3.895 mbpd 2015, 5% growth y/y. 1.05X3.895 = 4.09
http://mazamascience.com/OilExport/
hang on I’ll get the bp link
http://www.bp.com/en/global/corporate/energy-economics/statistical-review-of-world-energy/downloads.html
I am using BP Statistical Review for more than 30 years.
In this case, IEA and JODI data is more correct, in my view.
P.S. Consumption data from all sources is for total liquids. not just crude.
Interesting. How would whoever get it wrong? That’s a big diff.
Emailing an inquiry to [email protected]
Extreme populism notwithstanding, several hundred million Chinese need to be killed quite soon or billions are going to die globally, not much later.
The alpha populist may be setting that table with Twitter. It’s pretty clear he has no interest in cozying up to they whose low labor expenses have drained jobs.
No telling if Hamm has explained what their oil consumption growth is doing. Maybe.
Extreme populism notwithstanding, several hundred million Chinese need to be killed quite soon or billions are going to die globally, not much later.
Oh, that’s nice and I suppose you will be sitting on the nose of the first nuke, eh? On the other hand the Chines may be thinking that 300 million USians are hogging more than their fair share of the planet’s resources and they are the ones that need to be killed asap.
May I suggest you watch this to rein in your hubris a bit: Carl Sagan – Pale Blue Dot
https://www.youtube.com/watch?v=p86BPM1GV8M
Carl Sagan was a proven liar.
And the Chinese SHOULD be looking at US per capita consumption and planning a way to destroy it.
War is the most probable scenario — for all the graph makers. But they don’t like those graphs..
Carl Sagan was a proven liar.
Really?! Can you back that up with some specific information that proves your allegation?
Ya go look up nuclear winter and official censure for claiming results of a planetary nuclear exchange model said it would exist. It said nothing of the sort.
Another issue not discussed was natural gas. There is an assumption in the IEA numbers of ever rising NGLs, and presumably an equal rate of increase for the total amount condensate in the C&C mix (but here hidden in the decline rate). I don’t now if that is supportable given current undeveloped resources and rate of discoveries. I don’t follow this like oil but I get the impression that nat. gas discoveries have fallen fast this year. A couple of reasonably sized ones early on (800 and 400 mmboe) but fairly small ones since, mostly onshore (pakistan and Australia) or shallow inshore. The rising interest in FLNG suggests the number of big fields offshore that can be economically developed with base load LNG onshore plants might be running down.
Much appreciated Dean and Dennis, please keep it up.
I came across this by Jean Laherrere regarding the Rystad 2016 world reserves report. Not sure if it’s been discussed here, but here it is anyway….
https://aspofrance.files.wordpress.com/2016/10/jl_reservesus_sa_-ru_uk_2016.pdf
One very silly Question. So OPEC will cut to 32.5 mb/d. At the same time Indonesia leaves OPEC. That means OPEC will produce 32.5 – XXX from Indonesia (say about 0,7 mb/d), right?
It is a little confusing, but as I understand it Indonesia has been suspended, not kicked out of OPEC. It seems the 32.5 million includes Indonesia’s production, but they will not be participating in the 4.6 % cut most members agreed to.
The following link is an oilprice article which explains;
http://oilprice.com/Energy/Energy-General/The-OPEC-Deal-Here-Are-The-Details.html
8/12/2016
OPEC’s 2017 production cuts: a confusing numbers game (part 1)
http://crudeoilpeak.info/opecs-2017-production-cuts-a-confusing-numbers-game-part-1
Brent is $3 more than WTI?? It was supposed to be relatively even since US exports were approved earlier this year. Early cold weather in Europe & Asia draining heating oil?
US shale producers rushing to hedge production into 2018 has leveled the pricing curve. If these guys prove to be as smart (dumb) as they have been in the past, a spike up in WTI prices will cause them to have to put up margin money to cover the increase (until their oil is produced and sold). So, borrow money or pledge more assets.
“Brent is $3 more than WTI” because of the OPEC – non-OPEC deal.
It is supposed that it will eliminate existing oil glut, especially in the Eastern Hemisphere.
Before the deal was announced last week, WTI and Brent traded almost on par
“US shale producers rushing to hedge production into 2018 has leveled the pricing curve. If these guys prove to be as smart (dumb) as they have been in the past, a spike up in WTI prices will cause them to have to put up margin money to cover the increase (until their oil is produced and sold).”
Exactly, if oil prices stay above their hedging price. At that now largely depends on OPEC
clueless.
But when they are locked in at $55 strip they can plug that number into their presentations and show investors that $55 x 1.1 million EUR = $55 million dollars.
As a well just costs $7 million dollars, that means they have locked in a $48 million dollar profit per well.
I am unfortunately not missing the mark too much with my sarcasm regarding investor presentations.
I know nothing about manufacturing wire harnesses for automobiles, so I suppose a company investor presentation with regard to a potential investment in a wire harness factory could leave out a bunch of details and hoodwink me.
Well, I would argue that since they don’t pay much of any of their principle indebtedness back, ever, and drill “free” wells, its pretty much ALL profit.
Erik Townsend and Aaron Chan welcome Art Berman to MacroVoices. Erik and Art discuss:
OPEC’s latest production cut agreement and what it means
Production cut being more akin to a floor than a ceiling
False conception of cutting production to bring balance to an already-balanced market
How excess oil in storage will suppress prices for some time to come
Weak demand growth similar to late-2014 won’t support higher prices
Resumption of U.S. production in response to higher prices
OPEC not being as desperate as portrayed by the media
Weakening global economy as the main driver for low oil prices
https://www.macrovoices.com/
http://www.macrovoices.com/podcasts/MacroVoices-2016-11-30-Art-Berman.mp3
Enjoy
I have a new update on the Eagle Ford, here.
It makes no sense to me that when gas and oil prices are so low, the Trump administration and its advisors want to open up federal land for more drilling.
Trump advisors aim to privatize oil-rich Indian reservations | Reuters: “Now, a group of advisors to President-elect Donald Trump on Native American issues wants to free those resources from what they call a suffocating federal bureaucracy that holds title to 56 million acres of tribal lands, two chairmen of the coalition told Reuters in exclusive interviews.
The group proposes to put those lands into private ownership – a politically explosive idea that could upend more than century of policy designed to preserve Indian tribes on U.S.-owned reservations, which are governed by tribal leaders as sovereign nations.”
Unrest in the Argentinian oil and gas sector
http://www.reuters.com/article/us-argentina-oil-labor-idUSKBN13R233
Bloomberg always come out with OPEC production numbers a bit before the MOMR report, I don’t know how close they get but based on this we probably had a new peak global production last month:
“Crude production from the Organization of Petroleum Exporting Countries rose to a record 34.16 MMbpd in November with gains led by Angola, according to a Bloomberg News survey of analysts, oil companies and ship-tracking data. That’s up from a revised 33.96 MMbopd in October.”
http://www.worldoil.com/news/2016/12/5/opec-target-gets-harder-as-african-members-boost-november-output
Angola brought back one filed that was off for maintenance but they have also started ramp up on Chevrons Mafumeira Sul which has 150 kbpd nameplate and due to plateau in 2018.
There was also this:
“Iran’s output stayed relatively steady at 3.67 MMbopd while Saudi Arabia’s, OPEC’s de-facto leader, lowered its daily production by 50,000 bbl to 10.53 MMbopd.”
As I’ve said before, I think Saudi has hit a production limit, probably from water (either injection or production handling) on topsides equipment and don’t have suitable options left to drill any more wells to control the water cut. As the cut goes up they have to choke back. They drop at about 5.6% yearly rate. This happened last year from around April. The production cut they’ve agreed is almost exactly what they would decline by until next July anyway. The decline is likely to continue until Khurais expansion in 2018, although they may be able to lessen it if some new offshore wellheads come online (I think ESPs are being added in most cases).
Iran might be seeing similar issues now and, if so, will need new developments just to remain on plateau.
Saudi Arabia crude oil capacity and production (kb/d)
Sources:
Capacity: IEA estimates from Oil Market Reports (disputed by many independent experts)
Production: KSA official data (from OPEC MOMR and JODI)
Note that official production number for October (10,625 kb/d) is higher than data from “secondary sources”, as stated in MOMR (10,532 kb/d) and IEA estimate (10,550 kb/d).
The reference production level (also for October) used by OPEC for Saudi quota calculation is 10,544 kb/d
Production quota effective from January 2017 was set at 10,058 kb/d.
According to official data, production has exceeded this number since March 2015.
Hi AlexS,
I only believe Saudi capacity numbers when they produce at that level for 3 months or more. My guess is that they are at maximum capacity for the most recent reported month and their sustainable capacity is probably 10.2 Mb/d.
When we see 12 Mb/d output, then I will believe that capacity is there.
Dennis, I agree.
The all-time peak in Saudi production was this summer at 10.6-10.67 mb/d, according to different sources. This was slightly above previous summer’s peak.
I don’t know what is physical capacity; probably, they can temporarily ramp-up output to 11 mb/d. But 12.2 mb/d is too high, in my view.
Aramco is having layoffs. It’s possible they are running out of new developments?
They are cutting costs, both in oil and non-oil sectors, as they are facing a huge fiscal deficit
Mexico deepwater round did quite well – eight out of ten blocks bid with $4 billion committed. That would be about 35 to 40 exploration wells. At recent frontier success rates that should be about 4 to 5 decent projects. However the earliest oil will be in 2023 and Mexico will be an oil importer by then. I don’t know anything about the type of geology being looked at but a lot of the recent USA GoM finds have been high pressure and high temperature and occasionally with sand issues, so they are very expensive to develop )other posters here will know better).
http://www.oedigital.com/component/k2/item/14100-mexico-s-deepwater-round-begins
US demand at seasonal high
US production fell 0.8 Bcf on Tuesday, spread out among many regions with 0.2 Bcf drops in the Northeast and Midcon Producing, while the Rockies, Southeast, and Texas all experienced 0.1 Bcf falls. The Arkoma Woodford accounted for 215 MMcf of the fall, including 173 MMcf lower production receipts on Enable. The loss of production was not augmented by LNG or Canadian inflows, which were flat and down 0.1 Bcf from Monday, respectively. Increased residential/commercial demand across almost all of the country drove demand higher by 2.6 Bcf, contributing most of the 2.9 Bcf demand increase, bringing total demand to its highest of the heating season at 93.9 Bcf. US demand is expected to grow further as a cold front moves across the country, with the seven- and 14-day forecasts expecting demand to average 102 Bcf/d and 117 Bcf/d, respectively.
nat gas trading at levels not seen in almost two years…….and yes was an easy call for those of us who do not get erections looking at wind turbines ? before the winter is over the folks in big cites USA are going to be damn glad the oil and gas industry had the supplies to heat their houses. now back to doing my part to make america great again ??
TT
The productivity of the newer wells coming online in the Appalachian Basin will be a significant aspect as this whole unconventional development continues to evolve.
Two years back, if wells had 24 hour IPs of 15/20 MMcfd, operators were ecstatic. Currently, there are three dozen PA wells, online at least two months, FLOWING over 15 MMcfd average.
Seven of those above 20 MMcfd.
One well from Cabot, flowing 34 MMcfd in September, produced over one billion cubic feet in one month.
This amount of hydrocarbons coming to market is going to have widespread ramifications.
Hi Coffeeguyz,
Aren’t they still limited by pipeline capacity? I imagine they will only drill enough wells to keep the pipelines at capacity, or a smart company would plan things that way.
I am assuming these guys are smart, though their companies are not making a lot of profit, so maybe not.
Dennis
The northeast Pennsylvania area is severely restricted by limited pipeline capacity.
Southwest PA, Ohio, and West Virginia are continuing to benefit from incremental expansions, reversals, and regional new builds.
The number of new wells is not especially high, but the output of new wells – especially these last few months – is way above previous years’.
A five well pad from Range, the Eakin, Sandra, produced 9 Bcf in less than 4 months.
Cabot has several three/five well pads doing almost as much.
From a rough, flawed financial perspective, that Cabot well doing one billion cubic feet for the month, the King D 4, at $3/mmbtu, grossed $3 million first month revenues.
On this site, and others, there has been discussion concerning the daunting physical and economic challenges in getting a viscuous fluid to flow two mile sideways and then two miles up to the surface through tubing the size of a man’s fist.
Difficult.
The gas boys can sidestep much of those challenges due, in part, to the physical properties of gas versus oil.
For context, the highest grossing pad in Pennsylvania is the ten well Bishop pad from Cabot.
It has produced over 77 Bcf in under two years total online.
Depicting the energy in oil terms, this one pad has produced over 13 million boe, or 600,000+ boe per well per year.
This is barely the start of this area’s production and the ramifications will be both profound and far reaching.
Hi Texas Tea,
Storage levels are at record levels, so unless we have an unusually cold winter or the wells stop flowing, there may not be much of a price bump. Not a lot of wind or solar in the Northeast and a lot of heat is provided by natural gas with some oil in New England and Northern New York.
Rural areas have less access to natural gas and heat is wood, oil, and propane.
Dennis, why would you assume shale gas operators are any smarter than shale oil operators? There are over 2,000 shut-in gas wells in the Marcellus, etc. in the App basin, costing 12-15 billion dollars, with no take away capacity.
Its winter. In the winter it gets cold and more people use natural gas. Demand goes up. That’s hardly CNBC material. The ramifications of more hydrocarbons coming on the market are to lower product prices. Cabot, by the way, lost 10.3 million dollars 3Q16. Compared to Continental Resources, who lost 109 million in the same quarter, 10.3 mil is chicken feed, however.
Hi Mike,
Generally I think oil and gas companies are run by smart people, but hey you know what they say the crap floats to the top. 🙂
From the EIA Short-Term Energy Outlook, December 2016:
The U.S. “natural gas marketed production is forecast to average 77.5 billion cubic feet per day (Bcf/d) in 2016, a 1.3 Bcf/d decline from the 2015 level, which would be the first annual production decline since 2005. In 2017, forecast natural gas production increases by an average of 2.5 Bcf/d from the 2016 level.
Growing domestic natural gas consumption, along with higher pipeline exports to
Mexico and liquefied natural gas exports, contribute to the Henry Hub natural gas spot price rising from an average of $2.49 per million British thermal units (MMBtu) in 2016 to $3.27/MMBtu in 2017.”
Dennis. It is almost certain that storage levels will be below 5 year average by january and significnatly so by april. Unless the us has an extrenly mild winter a spike in natural gas prices is extrwmly likely
Hi Daniel,
That is the case every year, the important point is the peak storage levels and the draw each month. There is plenty of gas being produced in the Marcellus, only limited by pipeline capacity. There are probably a lot of wells being choked back, if natural gas prices spike the chokes will be opened up to keep the pipelines full and refill storage facilities. Maybe people will need to turn their thermostats a little lower and wear extra layers indoors. A lot less fuel is used if the thermostat is set at 60 F rather than 70 F. At some point this may be a problem, but as natural gas prices rise, there will be more drilling and more switching to heat pumps with natural gas as a backup.
This article is about something new to the natural gas industry- a spot market.
It seems to me that this is a good thing, now that the industry has grown up enough to the point that the infrastructure is available to actually HAVE a spot market, meaning you can at least theoretically buy a ship load without contracting for it years in advance.
What it means for homeowners and other small consumers and industrial customers is not clear to me, but it might mean gas will be more economical and more readily available in places near seaports .
New pipelines are economical to build if they are fairly short and there are plenty of customers, and this will be the case anywhere gas can be offloaded at a port city with a large local population.
http://www.wsj.com/articles/SB10001424052702303618904579169102800875842
Any discussion of this link, except as it applies to the production of oil and gas, should probably go in the open thread.
But as the open source people say, information and data want to be free, and while most of the MSM in this country is beholden to advertisers, and or owned by conglomerates, and thus perhaps not TOO EAGER to investigate SOME news, there are enough alternative media now that keeping such things as secret email servers and unexpected numbers of dead babies and old folks quiet long term is almost out of the question.
It could be that the cost of fracking for oil and gas will go up very sharply within a few years. Trump won’t be president forever. When the truth emerges, and it will, if the truth is that a hell of a lot of people are getting very sick or dying due to fracking associated pollution, the industry WILL BE tightly regulated after that.
This is old news, but I don’t think anybody is taking additional regulation of the industry seriously in predicting future domestic oil and gas production. Maybe they ought to, in making medium and long term predictions.
http://www.rollingstone.com/culture/features/fracking-whats-killing-the-babies-of-vernal-utah-20150622
Twenty , thirty or forty years ago, I would never have thought I would be depending on publications such as the Rolling Stone for news of this nature.
I just published a new post on the Permian.