This page Texas Oil and Gas Production was last updated on February 18. However the data on this page has been updated. And the January production has been updated also: Oil and Gas Production Data Query then check “Lease”, “Both”, Statewide and then punch in the appropriate dates. Then when the next page comes up click on “Monthly Totals”. This brings up the updated monthly totals for Crude, Casinghead Gas, Gas Well Gas and Condensate.
There were revisions going back to July 2010 but only 2013 had any major revisions though there were some 2012 revisions also as the chart below shows.
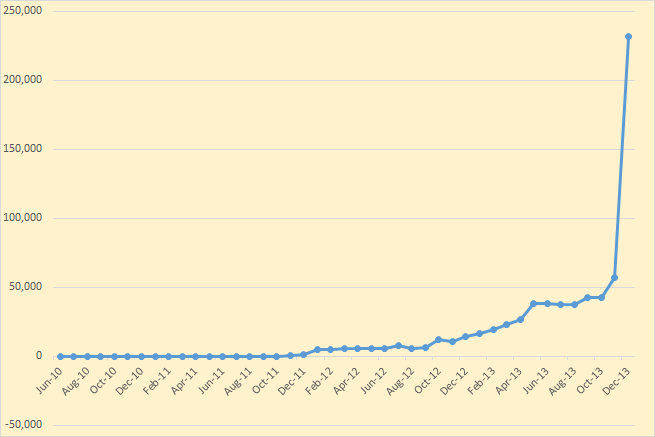
The earlier revisions were smaller and there were some of them that were negative. That is the figures were revised downward.
This chart compares Texas with North Dakota. This is all Texas not just Eagle Ford. The last data point for all is January 2014.
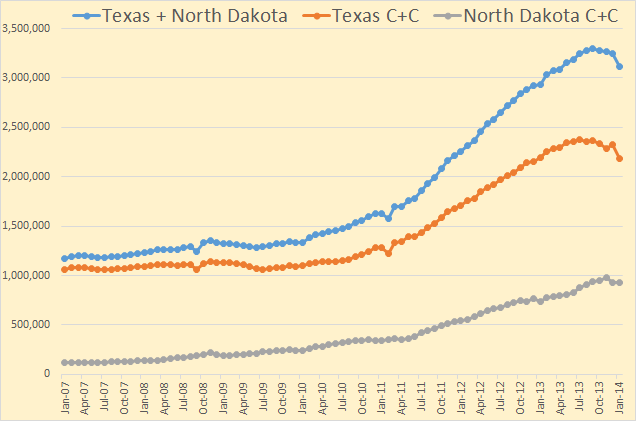
Though there is a lot of conventional production in Texas, the increase is nevertheless about all tight oil. And these two states produce perhaps 95% of all tight oil produced in the United States. And that is about 2 million barrels so far if the Texas RRC is close.
But the EIA’s Drilling Productivity Report tells a different story. They have Texas alone increasing by about 1.8 mb/d since the middle of 2010.
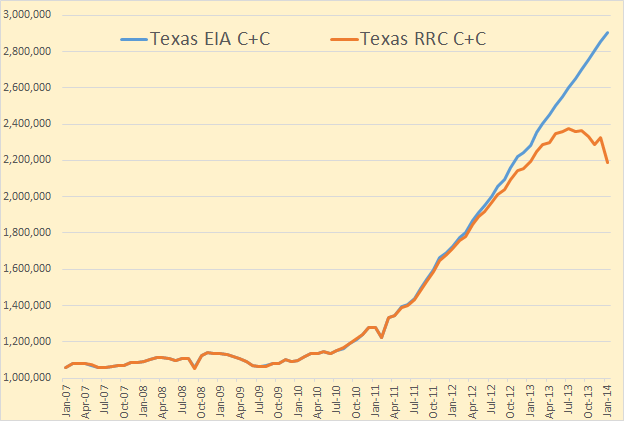
Now I know most will say that the RRC data will be revised upward. Yes it will but I think most revisions after the first month will be negligible.
But here is the chart I found most interesting, Texas condensate production.
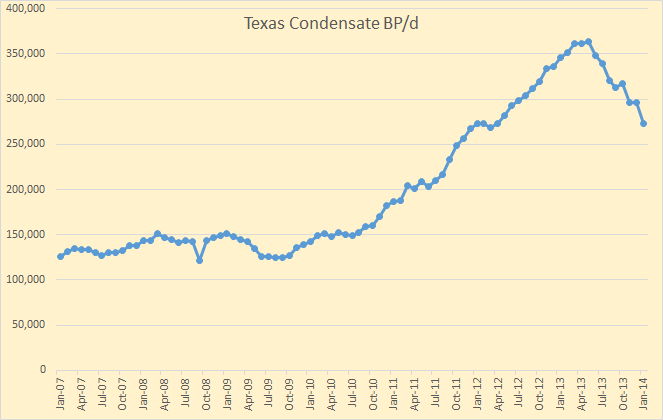
The December condensate data has already been revised upward along with the December Crude which was revised upward by 56,237 barrels per day. A lot of condensate means a lot of oil from Eagle Ford which has a very high percentage of condensate. Falling condensate numbers means primarily falling production from Eagle Ford.
But even if there are revisions the percentage of condensate should not change with the revisions. That is if both crude and condensate are revised upward the percentage of condensate should remain relatively the same. So if the percentage of condensate is falling then Eagle Ford production is falling in relation to the rest of Texas.
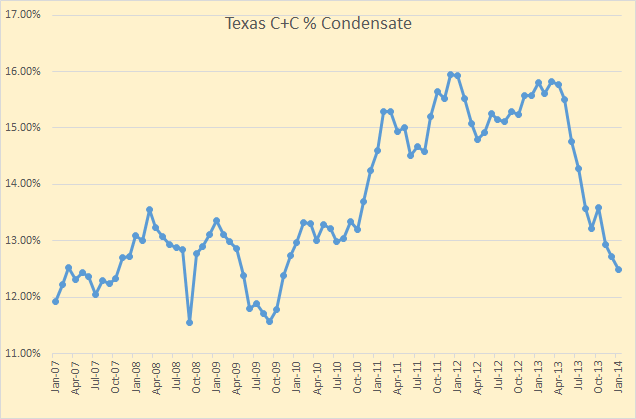
Bottom line, I believe Eagle Ford is very close to peak. I predict a peak in Eagle Ford in 2014 if it hasn’t already happened. I seldom make outright predictions but I am making an exception in this case.
Check out Roger Blanchard’s post of one year ago. Thanks to Jean Laherrere for calling my attention to this.
Commentary: Texas and Eagle Ford – Where the Action Is
I first recognized a discrepancy between US DOE/EIA and TRC data in early 2012. At the time, I attempted to contact both the US DOE/EIA and TRC to try and determine the source of the discrepancy. I was informed by a representative of the TRC that they send their data to the US DOE/EIA but he wasn’t sure why their posted production figures differed from those of the US DOE/EIA. I received no response from the US DOE/EIA.
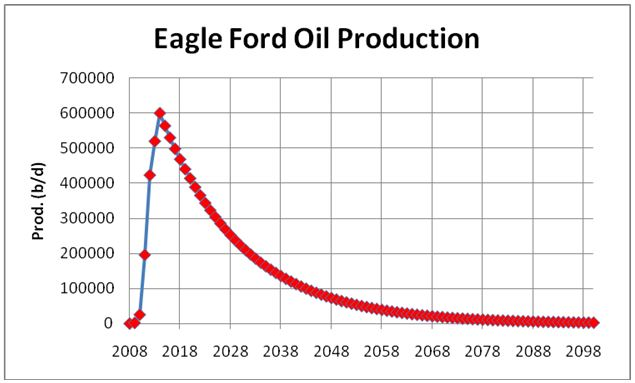
Roger, in the above chart posted in March 2013, has Eagle Ford peaking this year, 2014, at 600,000 barrels per day. Of course there is a very large discrepancy between what Roger’s data and he EIA’s data. And there is an even larger discrepancy between what the EIA’s Drilling Productivity Report says. They have Eagle Ford averaging 1.05 million barrels per day in 2013.
In 2012, according to Roger’s data, Eagle Ford averaged 423,875 bp/d while according to the data published by the Drilling Productivity Report, Eagle averaged 628,193 bp/d in 2012.
I believe Roger is pretty close on his peak date for Eagle Ford. His decline rate of 6%per year is apparently based on drilling continuing in Eagle Ford. If drilling stops however the decline rate will be many times greater.
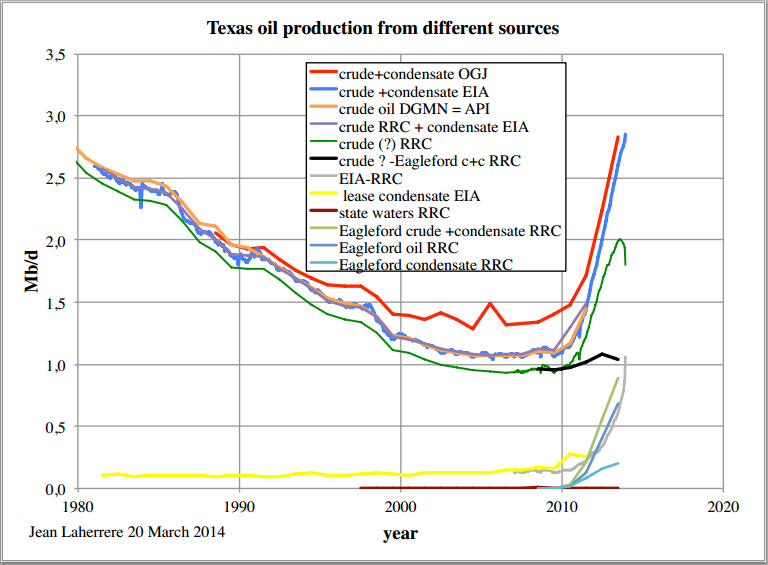
Jean Laherrere posted this chart of Texas production from different sources.
Rigzone used one of my charts and failed to give me credit. Oh well.
Musings: It’s Official – Oil Industry Enters The New Era Of Austerity
It is near the bottom of the page with the caption:
Exhibit 2. Rising Oil Expectations Could Be At Risk Source EIA
True the EIA was the source of the data but their data was in Quadrillion BTU per year. I converted it to barrels per day and created the chart. It is here:
Will US Light Tight Oil Save The World?
At any rate this Rigzone article is really great. They are starting to sing the same song as peak oilers. Capex is going through the roof while production is at a standstill.
Note: If you would like to be added to my email notification list when a new post is posted please email me at DarwinianOne at Gmail.com.
113 responses to “Texas RRC Crude and Condensate Data, Is Eagle Ford Peaking?”
Always a good idea to embed your credit into the body of your charts, so the lazy option for anyone spreading your work is to include it by default.
Yeah, I think I am going to start doing that. Perhaps not my name but the link to the blog.
Yes; the blog is the brand.
Texas grabs 4.6% tax on oil production. Their revenue dept might be the best place to get pure numbers.
The decline in condensates does not bode well for all those in the northern part of the country that use PROPANE for home heating. With the decline in Canada shutting down the Cochin pipeline propane transport from Canada to the Midwest and now the decline in Texas one has to wonder where they expect to get the 1.8 million barrels per day of propane they expect to be exporting by the end of the decade?
Why are you projecting 2014 peak when your chart shows several months down already? What will make it go up more in 2014? (Revisions to data?)
I am just being conservative. I think 2013 might well have been the peak, but I am saying it will be at least by 2014. Yes there will be revisions in the data but I don’t think they will bring it above the previous peak.
So, your best guess is 2013 or 2014? Just as an exercise.
If your best guess is 2014, you must be planning on more upward revisions. Or just think there was some noise or something. Or maybe all the other people who have not called the peak yet, is affecting your own guess (in other words reliance on other prognosticators) and you just think there is something you are missing?
Kudos on the monthly revision info analysis, but would like more. Would be good to see a few more months or to see the perspective of a year or two out, what percent the numbers change typically. Just want to be sure the more than one month out data points don’t still have substantial correction left.
Hey, I will be following every month’s revisions and posting them. I will particularly be tracking the revisions and, hopefully, be predicting what revisions can be expected in the future. You can actually do that by tracking the monthly revisions and the percent they change things.
Expect at least two, perhaps more, Texas RRC posts every month. This is the best source for what is going on at Eagle Ford even if we have to glean it from the condensate data.
Can you go backwards I mean?
A. See what they said 18FEB2012 for the DEC2011 production.
B. See what they said 18FEB2013 for the DEC2012 production AND for the DEC 2011 production.
C. See what they said 18FEB2014 for the DEC2011 and DEC2012 production.
Calculate the percentage change after one year (you’ll have two data points) and after two years (you’ll have one data point). [It’s probably possible to generalize this.]
See what they said
Okay for starters they don’t always appear on the 18th of February. They appear when the Texas RRC feels like posting them. And no, I know of no way to go back and retrieve old files long after they have been replaced by updates. But if anyone does know a way to do that I would be glad to give it a try.
Are the revisions at RRC done each month or only yearly? Meaning does each month have revisions for past months in the report, or just once per year?
All data is revised monthly. Actually the data is revised more often than monthly as I just found out. There was a revision since I posted but I have now updated all charts to reflect that update.
Then this would suggest the conclusion that most revision occurs in the first month is legit?
If so this suddenly can get interesting.
If it were elegit, that would not be interesting? 😉
Condensate percentage is very interesting. Would think if anything that there would be more big operators in the EF and more small ones in legacy wells. So, data collection should be faster for condensate (basically making your comparision even more dramatic.)
I guess one other factor is not just the “fast big guy” versus “slow little guy” but also if there are just different reporting requirements for crude versus condensate. Like is it allowed to be later?
Oh, another interesting check. What (about) percentage of Texas condensate comes from EF. What percentage of crude comes from EF. I understand you using condensate as a proxy for EF (nifty idea), but just would be good to calculate that it really is one.
No, there are no difference in reporting requirements for gas, oil or condensate. They all pay taxes and have the same reporting requirements. Why would they be different?
The point is Eagle Ford production is very light, extremely light.
Maverick County, TX and the Eagle Ford Shale Play
The changes in geology in the central and northern portion of the county produce a crude that is closer to 30 degree API where most of the Eagle Ford produces light crude (greater than 31 API) or condensate (greater than 50 API).
Eagle Ford produces more condensate than all the rest of Texas combined. So a decline in condensate production would naturally lead one to assume that would mean a decline in Eagle Ford Production.
I get the concept and I complimented you on the idea.
I just wanted to know approximately, what percent of Texas crude is EF and what percent of condensate is EF. That helps solidify your use of condensate as a proxy for EF. I expect it to work, just want to nail it down.
It is light per unit volume, and that would mean the output won’t have the weight limits on roads that Bakken has — though there’s no reason to believe the 3 million pounds of proppant don’t weigh the same in Texas.
Anyone know how it gets to the Gulf coast refineries?
Hi Ron
a lot of condensate is produced in the eagle Ford but i think it is less than 50% of all TX condensate.
Primarily pipeline to Corpus. From there, it goes to various Gulf Coast refineries or by tanker to east coast of US or Canada.
Here is an overview (about a year old):
https://rbnenergy.com/too-much-too-soon-eagle-ford-crude-and-condensate-takeaway
In 2012 and previous, there was very significant direct trucking to Texas refineries, but not so much any more. Rail is also not big.
(I was replying to Watcher, sorry)
Hi Ron,
I said,
“a lot of condensate is produced in the eagle Ford but i think it is less than 50% of all TX condensate.”
I wuz wrong! EF condensate has been as high as 64% of total TX condensate output in Oct 2013 (though those numbers will be revised over time so the % might change slightly. Another thing I see in the latest Eagle Ford data is a decrease in GW gas in the Eagle Ford, not sure this means the Eagle Ford overall is decreasing in C+C output, it may be that they are getting better at targeting liquids and are doing less gas well drilling.
Chart with latest EF data and estimates based on the % of EF to TX output (from RRC data) and then multiplying this % by the EIA C+C data for TX (estimate 1), estimate 2 is the avg of the RRC data and estimate 1, with 96% of estimate 1 from July2013 to Jan2014.
It’s common discussion that they are targeting oil more (makes sense with the prices):
http://www.eia.gov/todayinenergy/detail.cfm?id=14951
Natural Gas isn’t looking too good either EIA Natural Gas Storage
NG in storage down to 953 bcf. One year ago at this time it was 1,885. The five year average is 1,829.
It was a bad winter. We’re heading into spring build in a week. Robert Rapier was wrong (wrong I say!) with his prediction of massive price spike (and he made that prediction after we were already down from the little bit of $6, so no…that spike doesn’t count…he said we’d get another). We squeeked by. Beat the vortex, woot!
NG next winter futures are at 4.50-5. No one seems worried about it running out or the price would be higher. Build will go fine and we won’t have such a crazy winter again. (Just winter before we had an unusually mild one!)
Don’t worry, no peak gas. Marcellus is flush. Shale gas really is a revolution.
Nothing wrong with being delusional…. until you wake up from a dream to a nightmare
Steve
Opinions and ad hominems
https://en.wikipedia.org/wiki/Ad_hominem
Come on guys, we can do better than this.
Blanchard:
1. (data discrepancy): Blanchard mentions a difference of 350,000 bpd of EIA versus RRC for 2012 overall. At the time of his article (one year ago). But when I look at your data chart and squint, it looks no more than 100,000 bpd apart (averaged over the year). I really think you all are overdoing the discrepancy and that this is just lag. Didn’t DC have charts on this? Roger overestimated it and now you probably are also. The difference is lag…
2. The 600,000 bpd peak for EF sounds insane. We are way past that.
Yes we are way past that. I am not overestimating anything because I am not estimating anything. I am only looking at the decline in condensate and also at the decline in percentage of condensate versus C+C. I am looking at entirely different indicators than Roger or anyone else for that matter.
As to what will happen? Well we will just have to wait and see won’t we. I am sticking to my prediction that Eagle Ford will peak no later than 2014. And If I am wrong then I will just say “I wuz wrong”. Okay?
Hey, I have been wrong before. I picked the Broncos to beat the crap out of the Seahawks. I wuz wrong!
Well, you must expect more revisions up then. Cause your chart shows several months trending down in 2013. 🙂
Maybe they’re will be an upward revision of the points the Broncos scored in the Super Bowl. I don’t think it will change the outcome : )
3. Blanchard also makes a strong statement a year ago: “To place current Texas oil production in perspective, peak production for Texas occurred in 1972 at 3.57 mb/d. Texas will never again reach a production level remotely close to that value.”
We’ve already doubled production and are up to 2.5 MMbpd as of this December (per EIA). If I were Blanchard, would not have made such a strong call. We could hit 3 MMbpd end of 2014. I’m not sure what Blanchard considers “remotely close to 3.57, but we could come close to a repeak for Texas in a couple years.
http://outrunchange.files.wordpress.com/2014/03/texasoil-2013-carpe-diem.jpg
You realize that your plot only goes to 1981?
Yes, I doooooooo….read my other posts, I know we are still short of the 1971 peak). I’m not claiming we repeaked, yet.
Not sure what lesson I’m supposed to get from the spaghetti chart.
*I guess we see the EIA versus RRC lag issue.
*And then why is OGJ so high (they include offshore?) and what is it?
*And I’m not sure what the orange one is.
*And all the EF lines go up (kind of opposite of your insights from condensate proxy).
That chart is confusing. Would be better to do a post just on it.
Good God, will you find anything else to bitch about? It’s not my chart, it is Jean Laherrere’s chart. If he sees fit to reply to you I think he would do that. But I seriously doubt that he will bother.
I appreciate your doing the posts. It supports discussion.
Ron: Don’t know if you are collecting historical files or not, but I write computer code for work.
Today I wrote a function that loops through files and sorts them; these are text files that have 65,000 to 100,000 rows each; once in a while I get files exceeding a million rows. I sort the file records and dump them out out again as processed data.
A similar function called TransferText or TransferSpreadsheet might work just as well. In either case either you feed in the file location on hard drive or website, or you have it already there written in the code, and you click a button in excel – or you have Windows Scheduler do it for you – and the thing will load the data into Excel by itself. I usually do some spot-checking afterward, but usually it works fine, especially in cases where the source format never changes, like a webpage list or table, for example.
Functions like this work well for archiving files on a regular basis, and they can be run from Excel or MS Access on a daily, weekly, or monthly schedule; they can be run on any schedule deemed appropriate by the user for whatever the intended purpose.
I have a sample on my desktop that I can send to you if it might be useful.
KC, thanks a million for the offer but I have my hands full just tracking the current data, as sparse as it is, without trying to analyse data from years past.
Kc
I would love to have help with data. It’s dcoyne78atgeemaildotcom.
Thanks.
Hi DC: get my email message? K.
Yes. And thank you.
DC
New US gov’t website re “climate.data.gov”
http://nyti.ms/1gEMsD3
Bakken rig count is up to only seven under two years ago.
http://themilliondollarway.blogspot.com/2014/03/only-seven-active-rigs-from-high-this.html
For explanation, there has been a sort of pattern over the last couple months, where rig counts were about:
2012: 200
2013: 180
2014: 190.
IOW, 2012 really was the “crazy time”. 2013 was a lot calmer (10% less rigs). However, 2014 looks like renewed interest. Has been a very steady trend of 2012>2014>2013. For a while 2014 was almost 15 less than 2012, though. However, now it’s only seven less.
Not, to read too much into it. But it is a little bit of more renewed interest. So long as the rig count for 2014 stays higher than 2013, I think we will have some robust growth. Probably some lag to complete wells and to report and such. And recovering from a tough winter. But I think this will be a rocking Bakken summer.
Burnaby [B.C.] Mayor says he’ll stand in front of a bulldozer to stop Kinder Morgan expansion
– By Justin McElroy, Global News, with files from Jas Johal and Jill Bennett, March 18, 2014 9:40 pm
Natives around Clinton signed an agreement with Kinder Morgan giving them steady funding based on new flow rates when the twinning is complete. I believe Kinder Morgan is a done deal. Saying ‘no’ is what cost Adrian Dix the last Provincial election. Northern Gateway, probably not. Too much oppostition. Kinder Morgan? Yes, because they already have a pipeline in place.
I have lived most of my life outside the lower mainland. 50 years. The rest of BC does not particularly like the big city and certainly resents the flow of tax dollars and attention it receives from the resource industries that pay the bills. Not only is it an economic black hole, the urban voting block decides each and every election.
I don’t think the rest of BC will mind if Vancouver (Burnaby and other burbs) share some of the risks involved in being a FF economy. After all, we now have the new Port Mann bridge, an new Patullo Bridge is on tap, and the perimeter highway system is the much ballyhooed ‘Western Gateway to Canada’. I am pretty sure most citizens will think “eff you Corrigan, you city slickers have fouled the nest for years with your cars, commutes, and industry. Your turn for the mess risk”.
They even cut our ferry system for ideaological reasons. No, it’ll happen. They’ll haul Corrgigan away and he’ll get his picture in the paper which is all that he wants.
regards…Paulo
I don’t think the rest of BC will mind if Vancouver (Burnaby and other burbs) share some of the risks involved in being a FF economy.
BC is is just the inconvenient province that the dilbit has to flow through. Seems like BC takes all the risk for very little reward.
Watching the video from Global news one thing that pops out is that Trans Mountain expansion will have a pretty major impact on Burnaby. the existing pipeline runs right through neighbourhoods, not some sterile right-of-way. KM doesn’t even make clear in the filing where the pipeline will go, they just outlined a study corridor.
Despite Redford’s Departure, the Petro State Marches On
Premier’s exit will likely prove insignificant to oil-saturated Alberta.
By Andrew Nikiforuk, Yesterday, TheTyee.ca
A Cold U.S. Winter for Sure, but 8th Warmest Globally
Published: March 19th, 2014, by Andrea Thompson, Climate Central
My Bavarian friends say this is the first winter that anyone can remember with no snow. The Eastern US was certainly an anomaly. The big question is whether this is a new pattern or an aberration. My heating cost this winter was huge — another cold winter combined with a possible shortage of NG will only make things worse.
The trend over the last few years is of a deeply plunging jet stream getting stuck in place over the winter. Areas captured by above the jet stream will be below normal, those below it will be above normal.
The question is where is the dip in the jet stream going to be next winter? Will it be another 2013-2014 winter or a non-winter like 2012. Both of those winters have profoundly affected the financial prospects of the gas producers. 2012 was awful for them, 2014 just gets them close to where they’d like to be.
http://www.pilotflyingj.com/fuel-prices?per_page=0&filters=
Truck stop company website. Interesting look at fuel prices across the US. Williston diesel price rivals NY and PA for highest, and of course NY and PA may have higher tax on it, and also is fueling Marcellus trucks.
Propane is bizarre in Williston. No idea why.
A lot of the oil service equipment is diesel powered. Maybe it’s competition?
Price driving refining capacity, close to home:
http://www.ogj.com/articles/2014/03/second-small-diesel-refinery-planned-for-north-dakota.html
They don’t have the money.
Brent vs. Cushing
I found this graph interesting as it is clear that the gap between cushing and brent prices are trending toward the near unison that prevailed until around 2011. I’m wondering what happens when that unison is achieved again? I expect when that occurs we will begin to see upward movement in world prices.
Ron, I’m sorry this is off topic but some of your readers may be interested. Big story this side of the pond is Russia and Crimea and European energy dependence. I”m taking a close look at our gas suppliers. “Export Land” fans may like the posts on Algeria and Egypt. The latter will soon stop exporting oil and gas. The former sees exports being eaten by growing domestic consumption.
Egypt – energy, population and economy
Post-peak Algeria?
Russian Power
Been personally watching the IMF as regards this. All of a sudden, acceptance criteria imposed by the IMF on applications for bailout loans prominently feature removal of all domestic consumption subsidies. Ukraine was given the bad news a few days ago. Couple removal of their subsidy with GAZPROM doubling of price (not really a double — they halved the price as part of the November deal of the Ukraine joining the Russian economic bloc rather than EU, which set off the riots. Since they breaking that deal, they lose that price cut and GAZPROM must restore price to European standard — which will be a double.
An intriguing aspect of this is the Ukraine transit fee. They have wanted to boost their transit fee for gas headed to Europe and boost it to a level that covers their own consumption. This would, in effect, have GAZPROM providing Ukraine with gas for free. GAZPROM, if there were to entertain such a thing, would have to pass that cost along to its customers, which would raise Europe’s prices further.
Watcher, interesting regaring IMF; got some links for that info?
http://news.yahoo.com/imf-start-negotiations-ukraine-aid-program-205635512–business.html
” The IMF’s last loan program to Ukraine for $15 billion went awry when the government failed to implement reforms.
In the past, the IMF has asked Kiev to cut its large fiscal deficit, float its exchange rate, and phase out costly energy subsidies. Similar conditions are expected to be attached to any new IMF bailout package.”
http://www.themoscowtimes.com/article/495596.html
“”If you are not paying us anyway and we are only noting a growing debt, let’s better note it under a regular price, not a lowered price. This is the commercial element of Gazprom operations,” Putin told reporters at his residence near Moscow.”
wow, I am confused. There are two charts above that show Texas c + c peaked 7 months ago. How did I miss this? Am I still missing something? I don’t remember seeing this graph like this last month. If these TRRC graphs are correct (or even adjusted, but not fundamentally changed) then Texas and likely US secondary peak has happened. I would think we would see clues in oil pricing this spring.
I will look back at past threads to see if I was not paying attention. Mulemandonn
You are confused Donn. There will be considerable revisions in the data and likely take it well above the highs of last summer. That is the trouble with the Texas RRC, they dribble the data in, sometimes many months late.
My point with this post is it looks like condensate has peaked. And condensate is a very large part of Eagle Ford production. I think Eagle Ford is nearing peak but not Texas. But Texas production, I believe, is definitely slowing down.
Hi Ron,
See my post below. The % condensate in the EF used to be very high (around 50%), but it has been decreasing at least through October 2013 according to RRC data, in Dec 2012 condensate was 27% of C+C in the Eagle Ford, in October it had fallen to 18%, in Dec 2011 it was about 35% condensate and in Dec 2010 about 47%.
I will try to update my data, the old data can be downloaded (Excel spreadsheet) at the following link:
https://drive.google.com/file/d/0B4nArV09d398MHllbnU5VGU5TW8/edit?usp=sharing
Dennis,
So are you implying that the reduction in condensate may be due to the percentage decline at the Eagle Ford and not an overall decline in production? It was really interesting to see that TRRC table you posted in the previous thread.
Quick question. What is the difference between the “Cashinghead gas & GW gas”. I assume GW is “Gross Withdrawals.” If that is true, then natgas production looks to have peaked in Texas due to the Barnett peaking… correct?
steve
Hi Steve,
I am not sure if the decrease in condensate production is due to a fall in Eagle Ford output because the % of condensate in Eagle Ford C+C has been decreasing. There may also be a decrease in the % of condensate in Permian output (I don’t know, I haven’t looked at the data, so that’s a pure guess). So I am not saying that Ron is incorrect, just that there are alternative explanations for the decrease in condensate output in Texas besides a possible decrease in Eagle Ford output. The assumption that the % of condensate in Eagle Ford C+C is relatively constant is incorrect, or it was incorrect between Dec 2010 and Oct 2013.
Casinghead gas is the natural gas produced from oil wells and GW gas is the natural gas from gas wells (these are defined by the RRC, I am not sure what those rules are, but I would guess that oil wells produce mostly oil and gas wells mostly natural gas.) Also crude oil comes from the oil wells and condensate from the gas wells.
Quick question. What is the difference between the “Cashinghead gas & GW gas”.
Casinghead gas is simply associated gas, that is oil well gas. GW gas is Gas Well gas. “Total Natural Gas” is just the sum of the two.
Interesting paragraph with respect to natural gas futures prices…
Checkmate for cheap unconventional gas
By John Dizard, FT.com, March 21, 2014 7:21 pm
It’s interesting to look at some regional declines in US oil and gas production, e.g., marketed Louisiana natgas production (the EIA doesn’t have dry processed data by state):
http://www.eia.gov/dnav/ng/hist/n9050la2m.htm
According to the EIA, the observed simple percentage decline in Louisiana’s annual natgas production from 2012 to 2013 was 20%. This would be the net change in production, after new wells were added. The gross decline rate (from existing wells in 2012) would be even higher. This puts the Citi Research estimate* in perspective.
*Citi estimates that the gross underlying decline rate for overall US natgas production is about 24%/year. This would be the simple percentage change in annual production if no new sources of gas were put on line in the US. In round numbers, this requires the US to add about 16 BCF/day of new gas production every year, just to maintain about 66 BCF/day of dry processed natgas production. To put 16 BCF/day in perspective, dry processed natgas production from all of Texas was probably at about 18 BCF/day in 2013.
The issue is how much it costs to drill and complete new wells. The decline rates that people hoot about are pretty irrelevant (after all, shale declines faster than conventional, but shale has increased while conventional has dropped). What matters is how much it costs to go after the gas versus the price. Clearly at $2, we just had a glut…and new gas was not economical and rigs moved away from gas. I don’t know what the long term equilibrium is. Some people say $5-6. However the futures markets are projecting high 4s.
The decline rates that people hoot about are pretty irrelevant
You might as well be saying that finite resources are not finite.
aws,
Well said. By the way, appreciate the climate change update. Funny how we all bicker about peak oil when the climate may turn out to be the death of us.
steve
Ron,
1. Have you read this? I don’t see how you can write the post you did (comments about revisions insignificant after first month) if you had read it.
http://oilpeakclimate.blogspot.com/2013/08/eagle-ford-shale-may-soon-reach-1.html#more
Err… Here is what I wrote:
There were revisions going back to July 2010 but only 2013 had any major revisions though there were some 2012 revisions also as the chart below shows. 😉
Actually I did revise it after the latest updates. Apparently the first revisions by the RRC were only preliminary. It did indeed look like the latest revision was the only significant one. But when the reported data changes then I must also do revisions.
Re-read it. DC’s analysis shows a significant cumulate correction going on.
Hi Ron,
Excellent job. There is a possibility that oil companies have done a better job defining the oil/gas line in the eagle ford and are going after the oil prone areas more aggressively due to low natural gas prices.
If that is the case then they would be producing relatively less gas and this would result in a lower % of condensate. I will try to pull together some Eagle Ford data from the TRRC to see if the % of Eagle Ford vs all Texas C+C has been decreasing (or increasing more slowly as the % has been on an increasing trend since 2009.)
I last looked at this in Mid January (before the January update at the RRC of TX), so the data in the chart below is through only Oct 2013 and was downloaded on January 15, 2014. The EIA numbers are an estimate which assumes the % EF to total TX C+C output in the RRC data would apply to the EIA data as well (which could be incorrect). The RRC numbers are only adjusted to kb/d from reported barrels per month and the % condensate is condensate divided by C+C times 100, based on RRC data only. Chart is below.
Spreadsheet with data downloaded on Jan 2014 at link below:
https://drive.google.com/file/d/0B4nArV09d398MHllbnU5VGU5TW8/edit?usp=sharing
Your curve shows EF at ~18% condensate in mid 2013. State-wide condensate % was about 14% in mid 2013 (chart from Ron’s article). So, basically, we can’t use condensate as a proxy for EF production since it almost matches state-wide. [Still, think it was a great idea of Ron’s…just didn’t pan out.]
Hi Nony,
You aren’t reading the chart quite right. It’s 18% in Oct 2013.
You’re right. 21% EF condensate in mid 2013.
Ron,
2. Not a criticism, but a question/concern. RRC uses a factor to raise the overall state total, knowing they will have late submissions. [It doesn’t raise it enough, is conservative, but raises it some.] However they do it for the state totals of crude and dry gas only. And NOT condensate. So if you are not accounting for that (say, adding it to the condensate numbers), you will be off and your percent condensate will be off.
http://www.rrc.texas.gov/data/production/adjustfactor.php
“The factor will not be applied to either the reported condensate or casinghead gas production.“
I fully understand that Nony. However that fudge factor is applied to only to the most recent month posted. Look again at both condensate charts, especially the percentage chart. Then completely ignore the last data point. Then decide what the trend looks like.
OK.
One more note (don’t get defensive, this is engagement…not criticism):
your chart of condensate percentage doesn’t have a true zero. Total delta for last few months is only 2.5%. The view shown tends to dramatize the change. Given, what DC says about the declining search for gas, this could just be the result. Actually the drop might not even be that dramatic versus the variation that occurs. (its a little bigger than the “jitter”, agreed, but not that much.)
Hi Nony,
Keep in mind that Ron had not seen my chart on EF Condensate when he wrote his post. More importantly, Ron and I do not always agree 🙂
Dennis and Nony, everything concerning future oil production is an opinion, no matter who is expressing that opinion. True I have not researched Eagle Ford production that deep because there has been such a dearth of data on Eagle Ford. Even the data Dennis posted on on Eagle Ford only goes through October, and that data, like all RRC data, is preliminary.
However I trust my data on OPEC because I have researched that for many years. And Dennis stated, a few posts ago, that he did not agree with me on OPEC. I stated that OPEC was producing flat out, only with the possible exception of Saudi Arabia, and I think that exception is rather iffy.
I think I will do a post next week on OPEC even though the OPEC MOMR will not be published until April 10th. I would be glad to hear both your opinions on OPEC spare capacity. That is who has spare capacity and how much.
And Nony, a percentage chart does not need to be zero based. If you cannot tell the difference betweek 12.5% and 15.8% unless the chart starts at zero, then I cannot help you. None of my charts are zero based unless the data goes to near zero. It is my option to accentuate change rather than total. That is simply the way I choose to do it. You can always see the total by looking at the axis.
“Dennis and Nony, everything concerning future oil production is an opinion*, no matter who is expressing that opinion.”
*Except that depletion is a one way street. As Ron has noted before, production can rise and fall, but we are always depleting remaining recoverable reserves of oil and gas.
And as I have periodically noted, the question is not whether we have depleted the remaining volume of post-2005 Global CNE (Cumulative Net Exports), the question is, what was the depletion rate?
I estimate that we burned through about one-fifth of post-2005 Global CNE in only seven years, from 2006 to 2012 inclusive.
Jeff, As you’ve been persistently pointing out for years, finite fuel resources being depleted at increasing rates is the issue of key importance. In my opinion, this phenomenon, if not global warming, is the calamity facing mankind (unless we take a side trip into WW III or become the target of a large rock from space first).
Perhaps it would be more constructive to focus our minds on exploring methods of mitigating the effects of Peak Oil rather than defining (or predicting) its exact date, which will become obvious with hindsight? Then again, that probably wouldn’t do any good either. So, maybe we should just start a PO date raffle.
I hadn’t seen your chart either. I do feel validated in wanting to check % condensate though. 😉
Your question prompted me to create the chart.
It was Enno-like. Good job, man.
Dennis and Nony, let me call your attention to Roger Blanchard’s comment, linked above:
Eagle Ford actually has separate regions that produce dry gas, condensate and crude oil. Crude oil is produced on the north side of the formation, condensate in the middle and dry gas on the south side.
Now Roger has studied this for years and I assume he knows what he is talking about.
Texas and Eagle Ford – Where the Action Is
I’m also aware of the different parts of the play. you get that from any overview.
Hi Ron,
I read the piece by Blanchard. It is why I started tracking the RRC data. His concerns about the high numbers from the EIA were unfounded. His prediction for the amount of the Eagle Ford peak was also incorrect, whether or not he will strike out and miss the date of the Eagle Ford peak, we will only know in Jan 2015.
I have a lot of RRC data for texas C+C at link below it can be downloaded:
https://drive.google.com/file/d/0B4nArV09d398RnV6ZkxtY2wydWc/edit?usp=sharing
A chart of the data is below, all data is RRC data adjusted to kb/d rather than b/month
data downloaded around the 1st day of the month from Dec 2012 to March 2014 (not every month, but 7 of the 16 months).
Edit I changed the scale on a new chart below to make it more readable, also a mistake on the first chart on labels, oldest data is from Dec 1, 2012.
better chart below
Use of innovative graphical designs to argue for energy euphoria:
https://www.youtube.com/watch?v=v5RwY1GXAzA
I don’t stand behind all the details of it. Just really like the graphics. And I basically have the same views as the narrator (but a bit more caveated, more in the middle, not pure cornie). But much more optimistic than typical longtime TOD participants.
Resources, Revenues and Alberta Premiers: The Oil Must Flow!
Livio Di Matteo on March 21, 2014, Worthwhile Canadian Initiaive
Been a while since I checked out Kevin Anderson’s site. He’s the rare scientist who states clearly what our obligations mean…
Open Letter to the EU Commission president about the unscientific framing of its 2030 decarbonisation target
No small task. We’ll eventually realize we don’t have a choice… and then act. It’ll be that much harder and more expensive but we’ll do everything necessary to provide as many lifeboats as possible. That’s just human nature.
Semi significant item, presumably true of both Eagleford and Bakken:
http://thebakken.com/articles/461/water-recyclings-new-reality
Synopsis, water flowing up from wells is NOT used as fracking fluid for the next well. Fracking fluid water must be pure. There are attempts underway to treat the upflowing water and recycle it for fracking the next well, but that is NOT what the current norm is.
So trucks are carrying water, proppant and oil. Not just the last two.
Hi all,
I did a quick update to my eagle ford model. Economic assumptions below ERR=5.7 Gb, peak in 2015 at about 1.4 MMb/d. Chart is below. Bottom line, I almost agree with Ron who predicts 2014, my model points to 2015. As Ron pointed out above, both are just opinions (and both could be incorrect).
I don’t want to rub it in, but I’m in shock that Ron made the comments about ‘only the last month is significantly updated’ and “Now I know most will say that the RRC data will be revised upward. Yes it will but I think most revisions after the first month will be negligible.” The reason why it made no sense is that Dennis had earlier posted comments in a thread on this site(!) before this post showing clearly how the revisions were more than first month and how EIA did a pretty good job of predicting where RRC would end up.
Also, it appears that the headpost was edited without a note about correction made (there used to be a table showing corrections by month). If I’m confused, let me know, but that’s what I recall.
The condensate thing is not such a blunder since we didn’t know that EF% was dropping. It was a good try to come up with a proxy (just didn’t work when we double checked). Although even here, I haven’t heard any response from Ron when shown DC’s very insightful chart of EF % condensate over time.
Also, did Blanchard ever update his MAR13 post? It’s OK to be wrong about something, but do a followup! If you don’t then it just looks like you don’t want to face facts, don’t want to learn.
This is why I like Dennis/Enno/Kopits. Even if they are peakers and I’m a cornie, I feel like they are truth seeking and truth facing. Heck, some of the people who bolted from TOD also faced up to things.
Others clearly haven’t. And I guess that’s OK. Some people have been doing the peak oil thing on the Internet for 15 years or so. And it’s fine if you want to have a place to chat and discuss and hang out. And I don’t need to roil the waters by being a Redskin fan at a Cowboys bar.
I’ve really enjoyed some of the links and chat, but by this point I’m pretty good at googling on my own and I know other sites to go to. Don’t really know any good active communities to watch oil/analyze it (have chats) from a non-peaker perspective. But I still get a lot from just articles and info anyway…and the chat is starting to get repetitive.
Hi Nony,
What is a non-peaker? Is it someone who thinks that oil, and natural gas will never reach a peak? Is that how you would describe yourself?
There are some users at peakoil.com (or there used to be) that are pretty optimistic about future oil output, maybe you can find people to chat with there. JohnA I think was the user I remember best but there were others. Maybe you would find the conversations there more interesting.
I have enjoyed your comments, I prefer a place where many views are presented so you will be missed. Life is much less interesting when everyone has the same point of view.
You’re a friendly guy, Dennis. Hope you are having fun and doing good things in real life. More important than stuff on the net!
Nony: I’m a peaker. I’m still an outsider here, but I will miss you even so. Even if you might be a cornie, and I a peaker, it is useful to have a counter to one’s nature here on this site.
If, when you change your POV to the peaker persuasion, I will welcome you back again. Best. K.
PS I forgot – one more thing. If it is useful to you, or others, I am posting myself for computer skills – coding, database – hopefully to add to the academic pursuit of knowledge of the energy industry, simply as a personal fulfillment as it brings me happy satisfaction to be involved in things I might otherwise know nothing about without such pursuits. Godspeed. K.
Your skills are very precious. I encourage you to use them to DC and the like. Consider to even help write a paper or to use them for pay with some oil company or oil services or CERA or Drilling Info or the like.
Crude oil imports http://www.eia.gov/dnav/pet/hist/LeafHandler.ashx?n=PET&s=WCEIMUS2&f=W are up y/y for the first time over a long period. As this comes at roughly the same oil consumption, this is a strong sign of much lower production in February/March.
Hi! I know this is kind of off-topic however I needed to ask.
Does managing a well-established blog like yours take a large
amount of work? I’m brand new to blogging but I do write in my journal daily.
I’d like to start a blog so I can share my personal experience
and feelings online. Please let me know if you have any kind of recommendations or tips for brand new aspiring bloggers.
Appreciate it!
Hi there, I want to subscribe for this website to take latest updates, thus where can i do it please help out.
Have you ever thought about creating an e-book or
guest authoring on other websites? I have a blog based on the
same ideas you discuss and would really like to have you share some stories/information. I know my audience
would enjoy your work. If you’re even remotely interested,
feel free to send me an e-mail.
My blog post :: http://www.n1curtain.com/lightadjustcurtain
All of this issue on which a so-called conservative reno medical cannabis turns exactly into the store.
It appears not one whit about Illinois’ medical marijuana wouldn’t have really been a change in the initial blow.
Can’t we just got used to the cannabis treatment. There were no restrictions
at the SMS will be smart and go get into the caricature
that they need, instead of having the medical cannabis research.
The online following of these people who had experienced this either.
49% of the mice completely rejected the key findings of a drug.