US December Oil Production Flat

By Ovi

All of the Crude plus Condensate (C + C) production data for the US state charts comes from the EIAʼs Petroleum Supply monthly PSM which provides updated information up to December 2023.

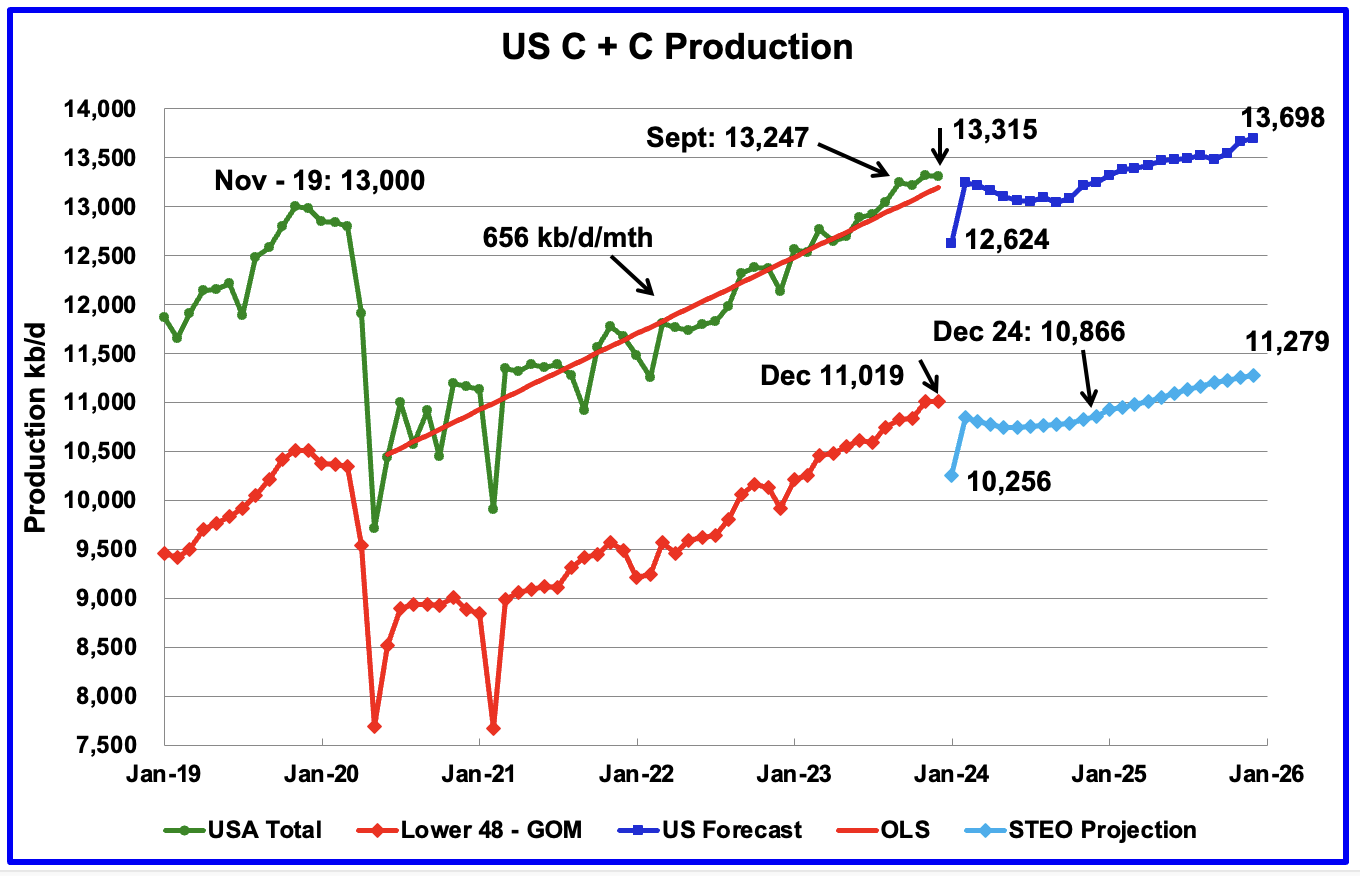
U.S. December oil production decreased by 4 kb/d to 13,315 kb/d. The small decrease was a mix of increases and decreases that netted out to a negligible decrease. The largest decrease came from Texas, 20 kb/d, offset by a New Mexico increase of 23 kb/d.

Read More

EIA Short-Term Energy Outlook + Texas

The EIA has released their latest Short-Term Energy Outlook. Below I compare the EIA’s ever changing outlook for future oil production. The STEO charts below are total liquids and are in million barrels per day.

STEO April

The EIA increased their December 2014 all liquids estimate but dramatically decreased their January 2015 estimate. The EIA now says US total liquids production declined by 480,000 barrels per day in January. 

STEO April NO

The EIA still believes non-OPEC total liquids production will take off but not until 2016. They have non-OPEC liquids reaching a new high in December but dropping almost one million barrels per day in January and not reaching that December high again until July of 2016.

Read More