World Oil Production, February 2019 Data.

The data for the charts below are from the EIA’s Monthly Energy Review. I will update this post Friday, May 31st with March data for the USA and charts for several states when the EIA’s Petroleum Supply Monthly is published. All data is through February 2019 and is thousand barrels per day.

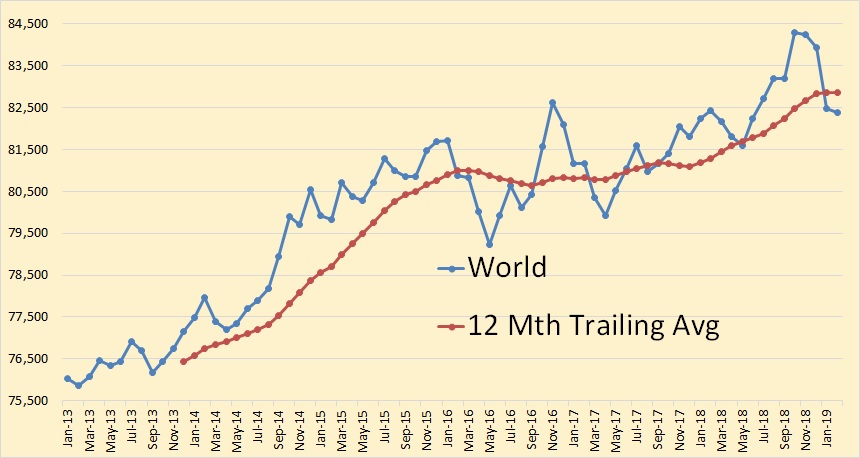
World C+C production was down only slightly in February, dropping only 87,000 barrels per day to 82,389,000 bpd.

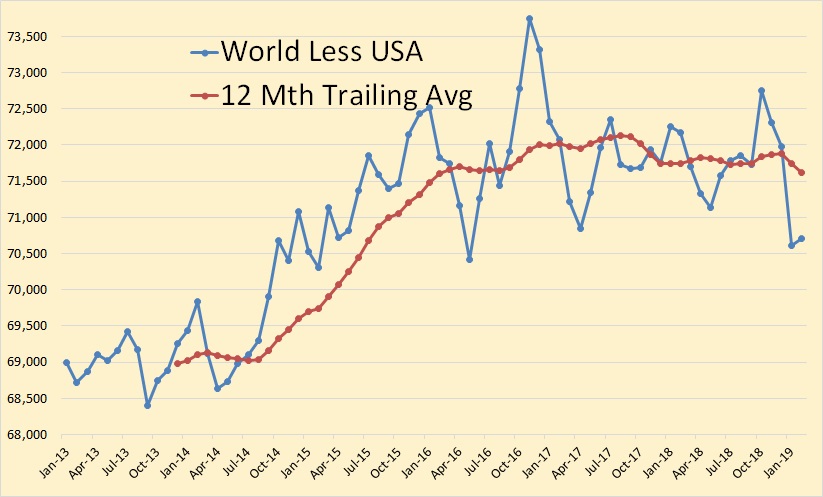
It is my contention that World, less USA peaked in November 2016 with the 12 month average peaking in 2017.

Read More

World Oil 2018-2050: World Energy Annual Report (Part 2)


A guest post by Dr. Minqi Li, Professor

Department of Economics, University of Utah
E-mail: minqi.li@economics.utah.edu

July 2018

This is Part 2 of the World Energy Annual Report in 2018. This part of the Annual Report provides updated analysis of world oil production and consumption, evaluates the future prospect of world oil supply and considers the implications of peak oil production for global economic growth.

chart/

(See Figure 18 near end of paper) Read More