World Oil Production

A guest post by David Archibald

The views expressed in this post do not necessarily reflect the views of Dennis Coyne or Ron Patterson.

The BP Statistical Review of World Energy has oil production data by country up to the end of 2015. This is what that looks like from 1988:
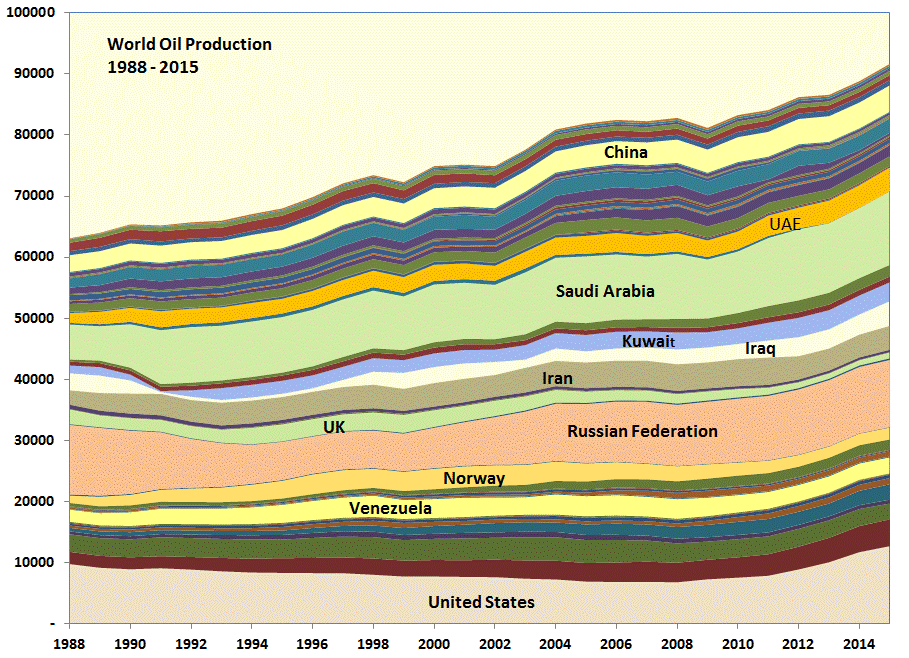
chart/

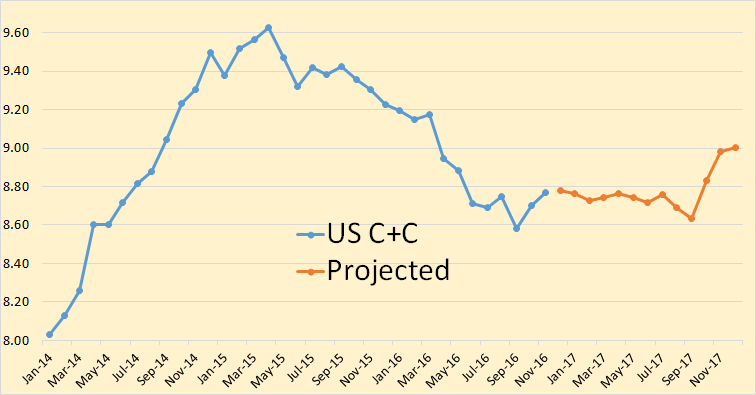
The United States increased production by 5.1 million barrels per day from 2010 to 2015. The increase in production from countries around the Persian Gulf over the same period was slightly less at 5.0 million barrels per day. The increase in total world production was 8.4 million barrels per day so the rest of the world declined by some 1.7 million barrels per day. This was despite Canadian production rising 1.0 million barrels per day from oil sands developments plus some other increases from Russia, Brazil, Colombia etc. Most oil producing countries are in well-established long term decline or plateau at best. How these trends will interact can approached from a bottom-up basis. To that end, the following graphs show likely production profiles by region for the next five years. Read More
Mexico, China and Beyond

This is a guest post by David Archibald. The opinions expressed in this post do not necessarily represent those of Dennis Coyne or Ron Patterson

Mexico, China and Beyond

Ron Patterson’s post asking if China’s oil production has peaked reminded me of Mexico
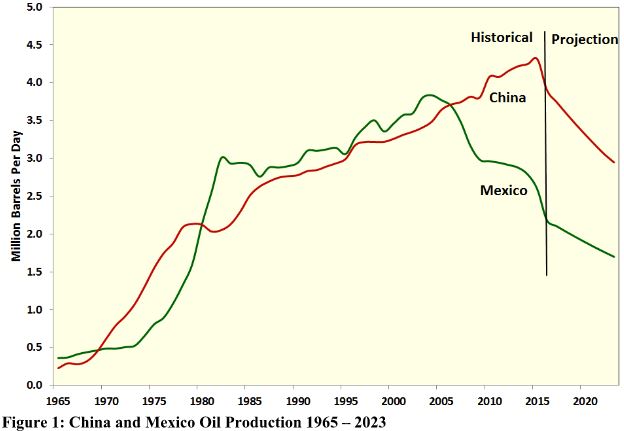
which also produces mainly from supergiant fields. Mexico’s oil production peaked in 2004 and has averaged a 3.5 percent per annum decline rate since, with a peak yearly decline rate of 9 percent in 2008. China’s oil production has fallen 10% from its peak in 2015. Part of that is oil price-related as the Daqing oil field has an operating cost of $46 per barrel and could reverse as the oil price rises. The comparison of China and Mexico with a projection to 2023 is shown in the following figure:

da-1

Read More

OPEC January Production

The latest OPEC Monthly Oil Market Report is just out. The the data is “Crude Only” production and do not reflect condensate production.

Also the charts, except for Libya, are not zero based. I chose to amplify the change rather than the total. The chats do not include Indonesia. That will be added within the next few months when I am able to get better historical data for Indonesian crude only production. 

All Data is in thousand barrels per day.

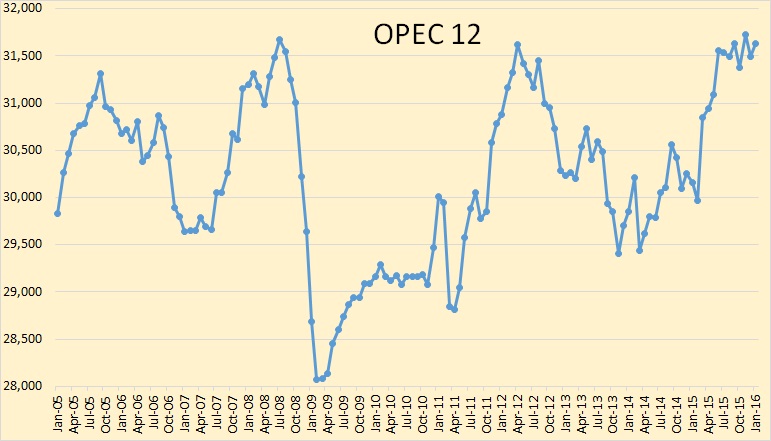
OPEC 12

OPEC production, not including Indonesia, was up 130,700 barrels per day in December.

Read More