The EIA has just released their Short-Term Energy Outlook for January. They have now included their predictions for 2016. Here is what they expect for US C+C. I have made the first projected production for December 2014 though the EIA says they have production data for December. All date is in million barrels per day through December 2016.
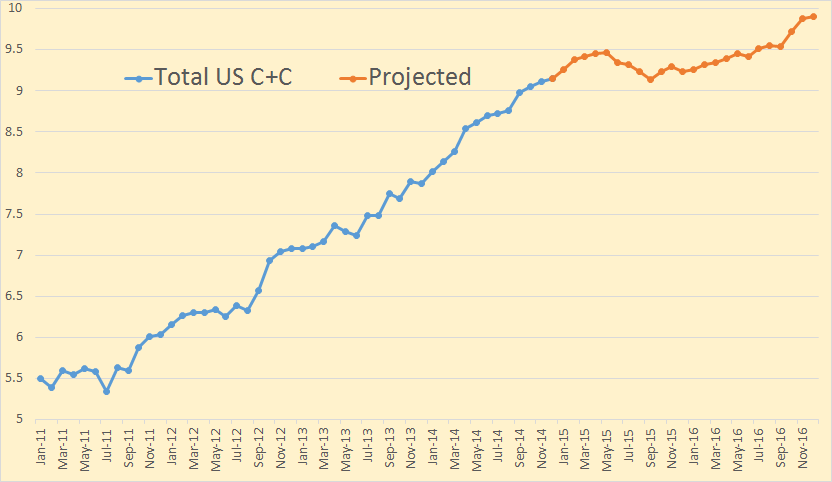
The EIA is saying that US C+C will peak at 9.47 mb/d in May 2015, drop 330,000 barrels per day by September 2015 then recovers, apparently because the price of oil goes back. Or perhaps they have another reason. They do not have US production surpassing May 2015 until July of 2016.
The EIA only gives C+C outlook numbers for domestic production. However they do project total liquids for all Non-OPEC nations. But first here is what they are predicting for US total liquids:
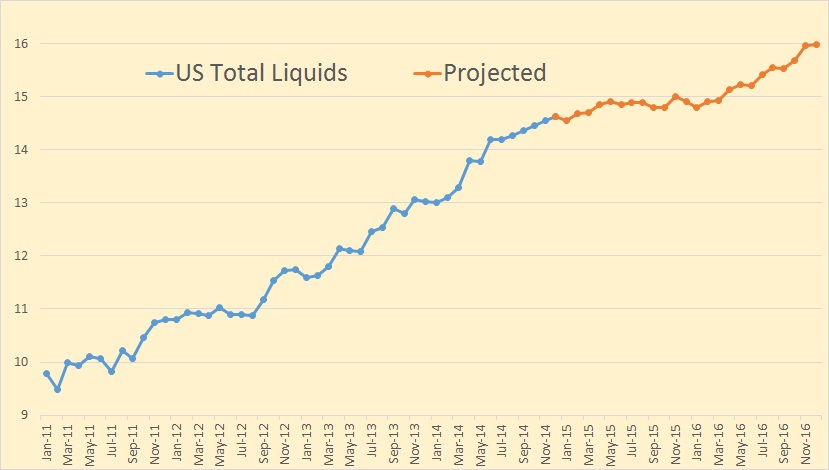
The EIA has US total liquids hitting a plateau in July 2015 then heading up again in April 2016 and increasing by 1 million barrels per day during the remainder of the year.
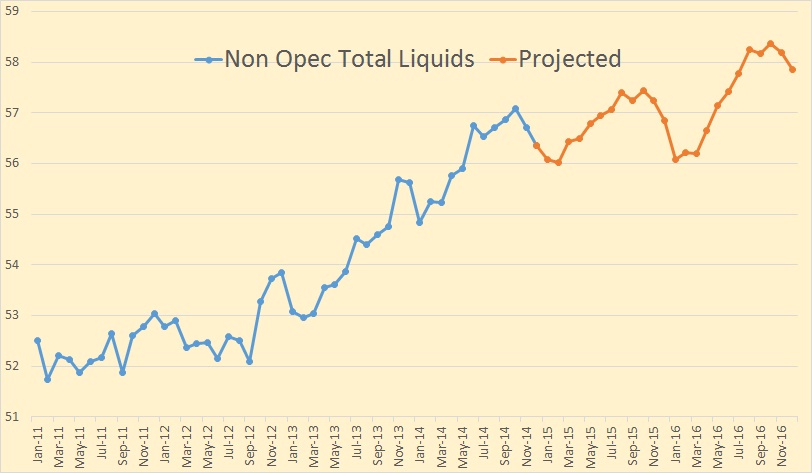
The EIA has Non-OPEC total liquids peaking in October 2015 then dropping by over one million barrels per day by February 2015 before heading up and making new highs in August and October. Then they have the pattern repeating again, bottoming out in January 2016 and increasing by 2.3 mb/d by October.
But all that up and down seasonal movement is caused by ethanol production in Brazil.
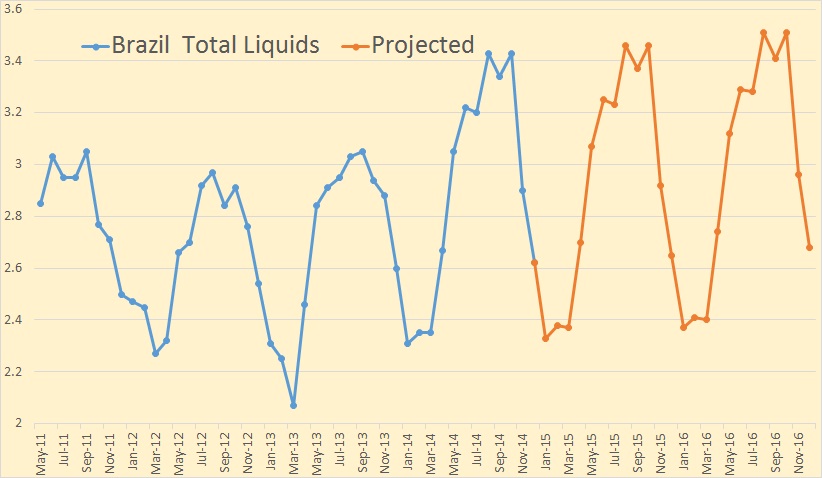
Isn’t it remarkable how Brazil liquids production looks exactly the same for three years, just inching up a few thousand barrels per day each year. But we have to take Brazil out of the picture to get a better picture of what is really happening.
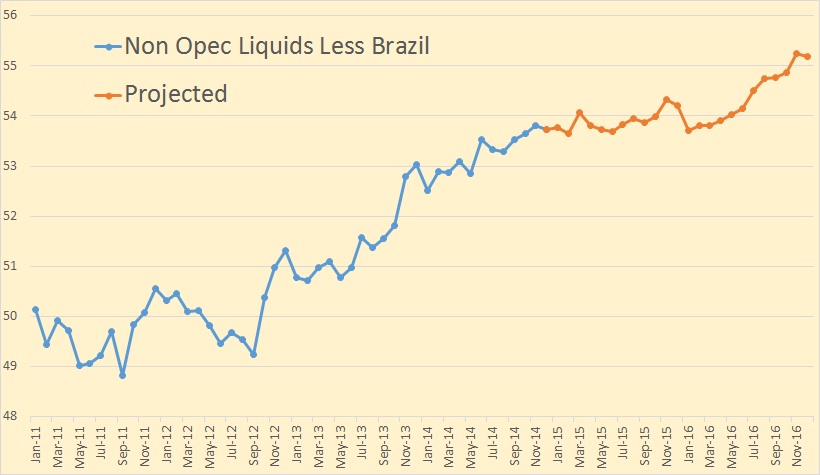
The EIA has Non-OPEC liquids, less Brazil, plateauing until January 2016 then increasing by about 1.5 mb/d during the remainder of the year.
One place where I agree with the EIA is concerning the peaking of Russia and the rest of Eurasia.
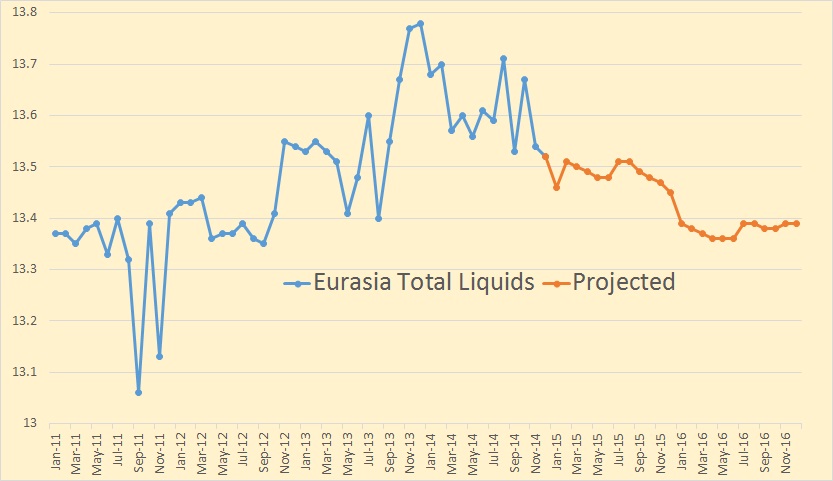
They have Eurasia down about 400,000 barrels per day by the end of 2016 from their peak in December of 2013. Apparently they don’s see Kashagan coming on line before 2017.
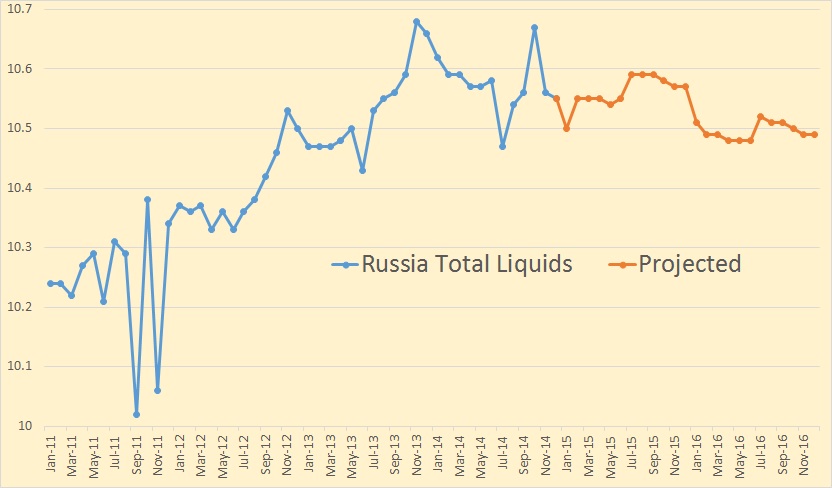
They have Russia declining by about 200,000 barrels per day from their peak in November 2013 to the end of 2016. Notice they have Russia spiking up in October 2014 before coming back to their normal decline pattern.
Note 1: North Dakota is scheduled to post their production numbers for November soon, perhaps later today or tomorrow. In either case I will have a post on it tomorrow if it does come out. Otherwise I will just have to wait for it.
Note 2: I send an email notice when I publish a new post. If you would like to receive that notice then email me at DarwinianOne at Gmail.com.
154 responses to “Short-Term Energy Outlook 2015 and 2016”
Hello everyone,
I barely have time at the moment to even scan this blog, but I have a question for anyone who may have a little extra time. If we were to do a HL on Saudi data through 2005 and compare it to a HL for data through 2014, what would the delta URR be? There may be no significant change, but I am curious.
Thank you in advance to anyone who tackles this question.
Best,
Tom
Hi Tom,
We won’t have Saudi EIA data for 2014 for a while, I could do it through 2013 if you like or estimate Saudi output for C+C from Oct to Dec 2014 as being equal to the Jan to Sept average output to get a rough 2014 estimate? Let me know which you would prefer.
The OPEC MOMR with December production data will be out early Thursday, January 15th.
I used OPEC data for Oct, Nov 2014 and estimated Dec to estimate 2014 Saudi data.
I used 1992-2005 to estimate a URR of 190 Gb and 1992 to 2014 for a URR of 240 Gb. Chart below.
Note that the result depends on the starting point of the data. If we use 1995 rather than 1992 as a start point for the HL we get very different results, this is a problem with HL, the results are not always stable so estimates can change a lot over time, typically URR goes up.
Another note. About 139 Gb have been produced by Saudi Arabia, so if we believe the 270 Gb estimate this would leave about 130 Gb of resources, this is about 10% of remaining world conventional C+C URR(1250 Gb).
Hi Dennis,
Thank you so much for doing this. This is exactly what I was looking for and you answered my next question with your statement, About 139 Gb have been produced by Saudi Arabia, so if we believe the 270 Gb estimate this would leave about 130 Gb of resources.
Amazing statements coming out of the Kingdom recently given these data. http://www.ibtimes.co.uk/oil-prices-will-never-hit-100-barrel-again-says-saudi-prince-alwaleed-bin-talal-1483110
I continue to scratch my head–is it possible we are missing something?
Thanks again Dennis.
Best,
Tom
My estimate for remaining Saudi post-2005 CNE (Cumulative Net Exports is as follows, based on the 8 year 2005 to 2013 rate of decline in their ECI Ratio (Ratio of production to consumption, which fell from 5.7 in 2005 to 4.0 in 2013).
At the 2005 to 2013 rate of decline in their ECI Ratio, they would approach 1.0 (production = consumption) and thus zero net exports, around the year 2045.
Estimated post-2005 CNE = Annual net exports at peak (3.3 Gb/year in 2005) X 40 years (estimated number of years to zero net exports) X 0.5 (area under a triangle) less 3.3 Gb = 63 Gb (total petroleum liquids + other liquids).
CNE for the 2006 to 2013 time period inclusive: 25 Gb.
Estimated remaining Saudi post-2005 CNE: 38 Gb, putting their estimated post-2005 CNE at about 40% depleted.
And it is very likely that 2014 was the ninth year in a row that the Saudis were unable or unwilling (take your pick, but more likely the former in my opinion), to exceed their 2005 annual net export rate of 9.1 mbpd (total petroleum liquids + other liquids, EIA).
This is in marked contrast to the 2002 to 2005 pattern, when their net exports increased from 7.1 mbpd in 2002 to 9.1 mbpd in 2005, as annual Brent prices rose from $25 in 2002 to $55 in 2005.
Jeff, could you possibly list the net exports for years 2005-2013. Always good reinforcement to see it.
And what would you guess will be their 2014 net export rate?
I agree that it is very likely it will be below 9.1 mbpd. My shot in the dark guess is 8.2 mbpd.
Hi Tom,
There are some estimates that there is plenty of oil. Christophe McBride’s doctoral thesis estimated 2600 Gb of remaining conventional (C+C+NGL) URR for his central estimate. I assume this was as of 2010 when cumulative output was about 1200 Gb for C+C+NGL, this makes his URR central estimate 3800 Gb, but he does not break out NGL. My own estimates of the URR for NGL is about 400 Gb, if that is correct and McBride’s central estimate is correct, that would suggest a conventional (excludes extra heavy C+C) URR of 3400 Gb.
McBride also estimates 1300 Gb of extra heavy oil URR for a total of 4700 Gb of C+C. Maybe the Saudis have read McBride’s thesis 🙂
Hi Dennis,
In your comment above you state, Note that the result depends on the starting point of the data. If we use 1995 rather than 1992 as a start point for the HL we get very different results, this is a problem with HL, the results are not always stable so estimates can change a lot over time, typically URR goes up.
To me this is the exact point of conducting this exercise. If I had to guess, I would think virtually every single one of us that was following the peak oil story in 2005 would have predicted that by 2015 Saudi Arabia would be definitively past peak. We may have disagreed on the decline rates and exact production numbers, but I have a hard time believing anyone in 2005 would be arguing for the production numbers we currently see and have seen over the past decade out of the Kingdom. I don’t think anyone would have been arguing that the URR would be 10’s of billions of barrels more than assumed based on HL in 2005.
Now, given the HL you just ran, and knowing that they have no new large projects to supplement production, and knowing that the large projects that have recently come online should reach maximum production in the 2015/2016 time frame, it seems quite reasonable to me to predict that the Kingdom should see peak production either this year or next. Yet in the face of the data, as we currently understand it, the Saudi oil minister is, to put it bluntly, talking trash.
Now, this could simply be the bravado of a punch drunk boxer just before the TKO. If within the next 12-24 months global oil prices are back to $100/barrel and the Saudis are then inexplicably “cutting” production, we will have our answer. Our data is correct and the Kingdom is in decline. But what if we reach the end of 2016, and the Saudis are still producing effectively where they are now? At that point it is time for us, as empiricists, to revisit our hypothesis. IF that happens, then there is something going on that we don’t understand. There is a fact or facts that we are missing.
Of course the production numbers are different from export numbers, and I appreciate that fact Jeff–and thanks for your input.
Thanks again Dennis for taking the time to run those numbers.
Best,
Tom
Hi Tom,
Your welcome.
I was one of those that thought in 2008 that Saudi output could not continue at the peak level for long, maybe a 2 year period at most. At the time many thought that the planned projects would not be able to offset declining output from large fields. Eventually Saudi output will decline, I believe that Ron’s hypothesis that all OPEC nations are producing flat out and there is effectively zero spare capacity is correct.
Where I differ from some is that though the peak is near (or possibly past), I am not convinced that the decline will be very rapid, but I have been wrong in the past and may be wrong in this case, time always answers these questions. Remember that output does not necessarily follow a logistic function and there is no reason to assume that the peak will occur when cumulative output is at 50% of the URR, it can occur before or after this point, it depends on many factors besides geology.
there is no reason to assume that the peak will occur when cumulative output is at 50% of the URR,
Of course not. In fact there is every reason to believe that the peak will occur well after 50% UUR.
Aging oil fields
Around one percent of oilfields globally are giant, but these have around 65 percent of global URR, Ultimately Recoverable Resources.
That ASPO article states that these aging oil fields will soon start to decline at about 5% per year. They will not. In fact infill drilling has kept most of these old giant oil fields from declining at all. Most have been on a plateau for 10 years or more. These old fields, 60% of the world’s URR, will only start to decline after they are at between 65% and 75% of their URR, perhaps higher. Then their decline will look like a Seneca Cliff.
That is just one reason the decline will be much faster than the ascent. Others are explained in this article:
The Seneca effect: why decline is faster than growth
Hi Ron,
I doubt that the peak can be maintained out beyond 60% of URR. We cannot really know the URR in advance, but there is a tendency for the decline to be slower than the ramp up unless the extraction rate from producing reserves becomes quite high.
Although I do not think the peak will occur at exactly, I believe it is likely to occur between 45 and 55% of all C+C including extra heavy oil output. Recent models have done using the oil shock model with C+C URR of 3000 Gb (including 500 Gb of extra heavy oil) would be at 45% at 1350 Gb of cumulative output and 55% at 1650 Gb of cumulative output. As the current end of 2014 cumulative C+C output is only about 1250 Gb of C+C, if we include both conventional and non-conventional (oil sands from Canada and Venezuela) URR we may reach peak at as low a level as 42% of the C+C URR in 2015, if a production plateau is maintained for 5 years and we take the midpoint of the plateau as the peak in 2016 then the peak would be at about 44% of the URR. So most reasonable scenarios point to a peak at less than 50% of the 3000 Gb URR for C+C.
Sometimes people choose to ignore the non-conventional C+C which maybe 500 Gb or possibly 1000 Gb for oil sands.
In that case we are at about 50% of the 2500 Gb URR for conventional C+C at the end of 2014, but we have a fairly large resource of non-conventional oil in the oil sands of Canada and Venezuela to help mitigate the decline.
This is bad for the environment, but may help with the transition to alternatives, especially if the oil is expensive to produce.
The higher the price, the faster the transition, a 5 to 7% rise in prices annually after a 10% rise over 7 years gets us back to $100/b, might be enough to speed the transition.
Ron, the actual decline rate depends on reservoir geometry and rock and fluid properties. Do you have the decline rate for these two fields?
Caño Limón
Valhall
They are very different, both are quite old, and ought to be declining.
We also have to consider that if the Kingdom is continuing to find ways to withdraw the same amount from a shrinking source then when it does tip over the decline rate will be much steeper?
However . . . .
Saudi C+C Production (mbpd, EIA):
2002: 7.6
2003: 8.8
2004: 9.1
2005: 9.6
2006: 9.2
2007: 8.7
2008: 9.3
2009: 8.3
2010: 8.9
2011: 9.5
2012: 9.8
2013: 9.7
As annual Brent crude oil prices rose from $25 in 2002 to $55 in 2005, Saudi C+C production rose by 2.0 mbpd, from 7.6 mbpd in 2002 to 9.6 mbpd in 2005.
Of course, we had the late 2008 and 2009 price decline, when there was clearly some voluntary cuts in production, but even if we toss out 2009, the average production rate for 2006 to 2013, excluding 2009, was 9.3 mbpd.
And there is also a material question of how accurate the Saudi production data are.
In any case, if we take the data at face value, Saudi production increased by 2.0 mbpd from 2002 to 2005, from 7.6 mbpd to 9.6 mbpd, as annual Brent crude oil prices more than doubled, from $25 to $55.
As annual Brent crude oil prices doubled again, from $55 in 2005 to the $110 range for 2011 to 2013 inclusive, Saudi C+C production averaged 9.7 mbpd for 2011 to 2013 inclusive.
Dennis, you want to check out my stretch Saudi HL from centuries ago 😉
http://www.theoildrum.com/files/KSA_HL_wforecast.png
http://europe.theoildrum.com/node/2910
Hi Euan,
Thanks. Nice job from 8 years ago!
One small difference is your HL is for C+C+NGL, but as NGL output for KSA is not that much any differences would be small.
Note that I don’t really trust the HL results and consider this a minimum estimate the logistic function does not really fit the data very well so the HL plot is trying to fit a line to a curve that will approach the horizontal axis asymptotically. This is the reason that the URR will tend to increase over time until we come very close to the URR in cumulative output.
Note that the instability of the HL is a real problem, a 1998-2014 HL points to a URR of 300 Gb.
Bottom line, it is difficult to judge the URR based on Hubbert Linearization, except to define a lower limit on likely URR. For Saudi Arabia I would guess 300 to 350 Gb with remaining URR of 170 to 230 Gb.
I don’t know about this technique you use, HL, other than it can be derived using “common sense” equations we use in the oil patch. But Saudi Arabia isn’t managed according to typical oil patch rules of thumb. My guess is the Saudis will try to limit production to no more than 12. And their remaining reserves would be about 170 gig. This means the Saudis will start declining around 2035 to 2040.
Hi Fernando,
HL is a plot of P/Q vs Q where Q is cumulative output (on horizontal axis) and P is annual output. You look for a linear part of the output and put a trend line through it and the horizontal axis intercept is the projected URR. If output follows a logistic function, this can be derived, in the real world output does not follow the logistic function.
Let me think about it.
Question: would it be reasonable to assume the Saudi fields will have an exponential decline rate once they do start to decline?
I propose this is a likely outcome. What do we see in really depleted areas, for example the Prudhoe Bay complex, or the North Sea Fields? Egypt?
The curves will be slightly distorted because oil prices are increasing. So maybe we would have to use a modified exponential in this mental exercise?
Hi Fernando,
Individual wells would likely decline exponentially, but for the country as a whole, probably not.
Unlike the Bakken, where I have well data, Saudi Arabia is more of a black box, pretty hard to guess the functional form of the decline.
If you wanted to try an HL, cumulative Saudi C+C through year end 1979 was 38.7 Gb, based on OPEC and EIA data. From that point you can use EIA data from 1980 to 2013, and I estimate 9.71 mb/d for average Saudi C+C output in 2014 using EIA data through Sept, OPEC data for Oct and Nov, and the Jan to Nov average output for my 2014 estimate.
Dennis: I wouldnt know how to use that HL system. I would argue that, once all the Saudi fields begin to decline the rate will be exponential, but it will probably have kinks. I don’t see a reason to use a straight line. The HL curve for Ghawar should have a logarithmic shape (I think). This is an interesting topic.
Question. Did you guys check the shape of say the Permian basin HL curve? That should tell you if the straight line extrapolation is valid. I’m referring to conventional, of course.
Ron & Everyone,
I have just one question. What would $10 oil due to the Bakken & Eagle Ford economics? Please respond in short and concise sentences… thanks
steve
Hi Steve,
My guess that output would fall to zero pretty quickly, I don’t think that is enough to cover OPEX, royalties, taxes and transports costs so most output would get shut in. I will of course defer to oilmen who would know much more than me.
Dennis,
Thanks… spot on. Totally agree. By the way, an excellent short and concise reply.
steve
All the wells would STAY shut in, and there would be nobody left to run economics.
Fernando,
Agreed. So, I gather, all the Kingdom of Saud needs to do is continue increasing drilling rigs, oil production to get oil prices down to $10 clams.
steve
SRS, two points: a Saudi project requires much more than wells. The typical plan involves wells, a gathering system, gas/oil separation, gas treating and compression, oil and water separation, oil pipelines, water handling, water supply, water injection wells, and of course the associated power generation, roads, camps, telecoms and security. To get all of this done they use reservoir engineering teams to optimize developments, the preliminary results are fed to other engineering teams, and on and on. It takes quite a few years to get that circus on the road.
Given what I know they probably shouldn’t be producing more than 12 million barrels of oil per day.
So the best option for the Saudis is to teach youngsters to use condoms and save their money. And to get things on a smooth track they just need to have OPEC hold at 30 million barrels of oil per day for a year. The other players will fold way before. Russia, Latin american, Canadian, Far East, Europe and USA producers will start cutting back, and the price will stabilize, then it will rise to the Saudi target. It’s simple.
Fernando,
Yes, I am aware of the countless GOSP dotting the Saudi landscape. However, I got my ALAN GREENSPAN magic RABBIT’s FOOT holding out for $10 buck oil. With a little bit of luck and maybe global oil storage bumping up to its limit at the end of Q1, we may just get there in Q2.
By the way, the reason I call it my Alan Greenspan magic Rabbit Foot, is that I had one of the men’s room attendants snatch one of Alan’s 12 remaining hairs for me which I added to my special Rabbit Foot.
It brings me lots of luck on tough market days.
steve
It won’t get that low. Individual producing entities will cut back before Brent reaches $40 per barrel for five days in a row. The news will go out and the market will be at the bottom.
It makes more sense to shut in for a few weeks and do “needed maintenance” than produce at such low prices.
Eagle wha … ?
Although difficult, I am going to answer this concisely.
-1). $10 oil in today’s environment is impossible !
That means we are deep, deep into a deflationary death spiral and total social chaos. We would be killing each other for food and survival, literally….call it mad max or whatever.
The defaults of high yield/junk/shale energy bond derivatives (roughly $200-300 bln) which are starting right about now (at $30-$40-$50/bl) – if this lasts, would trigger the bigger quadrillion + global derivative domino effect and wipe out the whole global trade/economy.
Sounds drastic?
If one knows the numbers and understands them, it is NOT!
It is precisely the reason why Dod-Frank was repealed 3 weeks ago. They know what’s coming if $40 oil continues for long.
-2.) Contrary to what you and others believe Steve, there is plausible evidence that Saudis are producing at full capacity (or close to it).
They do NOT have much spare capacity left. Explaining that will take another blog, so I will not!
Who ever thinks we are in the 1985-1999 period with regard to oil is greatly mistaken and/or knows very LITTLE of the oil thingy.
So in short, Saudis canNOT increase production at will and take oil to $10/bl akin to what they did in helping collapse of the soviet union.
-In order for this blog to run and you (and me) to answer in/with your computer, a $10/bl oil is IMPOSSIBLE!
We shall not have any computer…or internet…or bread for that matter, left.
Though from different perspectives, I fully agree with Fernando Leanme’s answer: “…..there would be nobody left to run economics…”.
Hope that helps.
Petro
Hi Petro,
I mostly agree. I do believe that Saudi Arabia is close to capacity, especially at $50/b they will not be developing new projects. The only way prices go to $30/b would be a severe financial crisis. World War 3 and/or Great Depression 2 might take oil down to $20/b in 2015$. I agree that collapse would be the only thing that would drive oil prices to $10/b (2015$) or lower, at that point dollars may not be used for currency and we might be back to using gold. For the reasons that Old Farmer Mac has laid out, I doubt things will get to this point any time soon, though I would not say impossible, but very unlikely in the next 25 years. High fossil fuel prices will help to avoid such a crisis because low fossil fuel prices encourage business as usual.
I wish I could share your “optimism” Denis.
Remember Catrina, Sandy, Ferguson…socially speaking this country is at the same state as in 1860…but we had a bright future ahead and UNLIMITED resources afterwards, whereas today….
We are 3 missed meals and 2 cold electric-less nights away from chaos.
When the overweight zombies who roam around the malls of this country sipping slurpees and swiping plastic to buy more plastic kill each other for chinese made crap on black friday, can you imagine what will happen when EBTs will not work?!
And lets not start discussing the “Putin” input….
-I think we just experienced our last good holiday season…starting with the ’15-’16 one, the end of this decade shall look very different from today.
Hopefully I am wrong and you are correct… but then again, I know the numbers and they do not lie!
Be well,
Petro
P.S.: oil might go briefly around $30 level, but beyond that we will not know, for it it drops further there shall be no WAY to price it. Market as we know it today, will not be!
Well said Petro,
re: “When the overweight zombies who roam around the malls of this country sipping slurpees and swiping plastic to buy more plastic kill each other for chinese made crap on black friday, can you imagine what will happen when EBTs will not work?!”
Expectations and entitlements are the western world’s mantra. My wife and I are doing okay, as well as the ‘kids’, but I don’t even take a hot shower for granted, anymore. I suppose one day we will be thankful for what we don’t even notice; full grocery store shelves, lights, hot showers, and cheap clothing. This list would look pretty good in Venezuala right now.
I see Obama is talking about ‘troops’ to fight ISIS, now. What could go worng? Things are getting shaky. I ate breakfast watching CNBC this morning. It’s almost comedic entertainment. The December consumer report came out and the market started to tank. One pundit said the numbers were simply wrong, and that all was well. The other said what we know, that people aren’t buying because they don’t have any money to spare. There is record US debt and an army will once again be sent to Iraq, (and probably Syria). Is it really to protect the Sauds when unrest spreads? If they could only make more bullets the price of copper might rise. If they can bomb a few pipelines maybe oil will start to rise. Or even worse, maybe there is no planning going on, only reaction.
Good resume of the state of play:
http://seekingalpha.com/article/2817376-at-last-the-experts-wake-up-to-oil
Oil Production Vital Statistics – January 2015
12 key charts based on IEA data updated to Nov 14.
The most interesting thing about that chart right now is how shockingly fast the gas rig count fell when the gas price crashed.
Hi Ilambiquated,
Remember that oil and gas rigs are no different, it is just a matter of whether they are targeting oil or gas. It is the relative price of oil to gas that matters, if oil rigs decrease we may see an increase in the number of gas rigs, it just depends on the economics of oil vs gas. Total US rigs fell from 2000 to 1000 in the price crash of 2008-9 and took 2 years to return to 2000 active rigs, chart below
I was wondering about the difference between the rigs, thanks.
I was talking to my nephew who works for a small independent oil/ gas company a few weeks ago (we had a big family meeting). They switched from gas to oil when the gsa price crashed. He said, “We won’t be doing any drilling at all in 2015”.
Their oil price assumptions. Look reasonable to me
WTI Brent
Dec14 59.29 62.34
Jan15 46,00 49,00
Feb15 46,00 49,00
Mar15 47,00 50,00
Apr15 49,00 52,00
May15 51,00 54,00
Jun15 53,00 56,00
Jul15 55,00 58,00
Aug15 57,00 60,00
Sep15 59,00 62,00
Oct15 61,00 64,00
Nov15 64,00 67,00
Dec15 67,00 70,00
Jan16 66,00 70,00
Feb16 68,00 72,00
Mar16 70,00 74,00
Apr16 71,00 75,00
May16 72,00 76,00
Jun16 73,00 77,00
Jul16 73,00 77,00
Aug16 73,00 77,00
Sep16 72,00 76,00
Oct16 71,00 75,00
Nov16 71,00 75,00
Dec16 72,00 76,00
2014 93.26 99.02
2015 54.58 57.58
2016 71.00 75.00
And this one made me smile:
http://business.financialpost.com/2015/01/12/how-falling-oil-prices-are-ending-hopes-for-north-american-energy-independence/?__lsa=b247-a426
”Whatever happened to North American energy independence?
With the price of oil crashing to near six-year lows Monday, and Saudi Arabia and its Persian Gulf allies re-establishing themselves as the global oil bosses, North American producers are running for the hills, axing investment at lightning speed.”
They still seem to be of the opinion that it will be months and months before US production starts to fall. They have been wrong about everything else so I think they will be wrong about this as well.
There is another interesting piece of info in the EIA report regarding world supply and demand.
Q1  Supply (Mb/d)
	      Non-Opec        OPEC        Total
2014	    55.10		35.94	    91.04
2015	    56.19		36.04	    92.23

Q1 Consumption/Demand                (Mb/d)	   Over Supply
     2014				 90.26		0.78
     2015				 91.51          0.72
An over supply of 0.75 Mb/d is pretty typical for Q1. In the meantime most of the talking heads in the MSM are talking about an over supply of 1.5 to 2 Mb/d to explain the price drop in WTI. So I have to ask, Who is right?, the MSM, the EIA or is there some other explanation.
Some other explanation.
Hard to tell when you mix NGL and high proof liquor with crude and condensate.
If there is that much oil “over supply”, where is the extra 285 million barrels being stored?
The Q1 over supply fills the inventory draw down that occurred in the previous Q3 and Q4.
Then it’s all in balance and no justification for price change.
Hi Ovi,
At $90/b for crude about 77 mb/d were being produced, the slow economy results in a demand for 76 mb/d at $90/b. What do you think happens to the price of oil under these circumstances?
I would never guess that it would drop 50% to $45/bbl
Ron, I think this report from North Dakota is worth a separate pots:
https://www.dmr.nd.gov/oilgas/presentations/FullHouseAppropriations010815.pdf
They project that even under $25 oil prices production in July 2017 will be 700 kb/d
We are going to get a barrage of these kinds of questionable break-even reports which are obviously intended as a message to OPEC
In the meantime I have done the following analysis which is part of a series on what impact US tight oil has on oil markets, both crude oil and products
13/1/2015
Tight oil boom can explain only part of drop in US oil product imports
http://crudeoilpeak.info/tight-oil-boom-can-explain-only-part-of-drop-in-us-oil-product-imports
It is worth a separate post Matt but we have already hashed it over the last few days in the comments section.
Your link has a strange analytical method — looking at where the oil came from instead of what it was used for, which would have more explanatory power.
Fig 2, 3, 6, 7, 10 show the type of fuel imported, so that shows you for which purpose imported products were used.
price decline issues spreading beyond shale oil?
“And now the same specter looms for oil. Oil prices have halved since June, with the benchmark Brent crude trading earlier this week at less than $50 a barrel. If such prices are maintained, this would leave many reserves unviable, putting severe strains on even the largest oil companies, according to James Leaton, research director at Carbon Tracker.
Leaton calculates that major companies have earmarked more than a trillion dollars of investment in projects between now and 2025 that require an international oil price of at least $95 a barrel before they make a profit. Most of these high-price reserves are on the industry’s new frontiers — in the Arctic, deep ocean waters, or unconventional sources like the Alberta tar sands, where three major projects were deferred in 2014 because of falling oil prices.
Brazil’s oil giant Petrobras, whose investments in deep-sea oil in the South Atlantic have made it the most indebted company in the world, is reportedly close to going bust. Leaton reports that many of its new offshore fields have a break-even price of $120 a barrel. ”
http://e360.yale.edu/feature/could_global_tide_be_starting_to_turn_against_fossil_fuels/2837/
It’s not that straightforward. The industry response to low prices is to approach governments to get tax breaks. This is a reasonable approach and can be quite successful. As it turns out I was involved in such negotiations at a very early age because I’m fully bilingual and I could serve as the quality checker for simultaneous translators and in high level meetings. And I assure you, if a company operates in a high tax environment it will get those breaks.
FOLKS,
This is a bit OFF TOPIC, but maybe interesting in the way I enjoy “BEATING” the precious metal DEAD HORSE:
Chinese Buy 29 Metric Tons Of Gold In Last 3 Days Of 2014
Gold demand in China remains strong in the build-up to the Lunar New Year, with gold price premiums on the SGE rising to 7%.
http://www.mineweb.com/chinese-buy-29-tonnes-gold-last-3-days-2014/
What is quite interesting about this FACTOID is the huge amount of GOLD BUYING by the Chinese compared to their NITWIT counterparts in the west. While the Chinese bought gold “literally” hand over fist during the last three days of 2014, Americans purchased 34 metric tons of gold investment during the entire first nine months of 2014.
STUPID CHINESE….LOL.
steve
Americans don’t give their wives stuff for the Chinese New Year. I think the custom is for the wife to cook a large bird in November and serve it with an apple pie, then she is supposed to serve her husband beer as he sits and watches some sort of gladiators wearing ballet uniforms and plastic helmets, and the husband rewards her with a gold bracelet and a small pine tree in late December.
Fernando,
Well done, an excellent comparison. However, if we look at two separate asset classes, 1) Mutual Fund Market vs 2)Physical Global Gold Investment, we can see a clearly obvious trend. Please see chart below:
In the first nine months of 2014, the Worldwide Mutual Fund Market Black Hole sucked in a staggering net inflow of $962 billion compared to the paltry $33 billion in total Global Gold Investment. What is also worth taking a look at is the following breakdown:
Total Mutual Fund Asset Value Breakdown as of Q3 2014:
Americas = 57%
Europe = 31%
Asia = 12%
Global Physical Gold Investment Q1-Q3 2014:
India & Asia = 52%
Europe & USA = 24%
Middle East & Turkey = 8%
Other = 16%
So, what we have here in PLAIN SIGHT, is the EAST investing more in physical gold and less in the Worldwide Mutual Fund Black Hole from Hell.
steve
I agree. That gold is going to mixed with other metals and made into fiddly little chains or rings and ultimately disappear into the the cracks of millions of sofas scattered around China. All the effort of digging up and refining the ore will be undone. It’s consumption rather than investment.
Ilambiquated,
That has to be one of the most Stupid comments I have read on gold. Can’t blame you though as you have been brainwashed by the Western Keynesian Fiat monetary philosophy.
Anyhow, all Central Banks still have gold as an Asset on their balance sheets, and its no surprise than many countries are now repatriating their gold back from the United States who is by far the largest gold leveraged-leasing entity on the planet.
Silly Westerners.
steve
Well as long as we’re exchanging compliments, your posts always remind me of Brad Pitt in the movie 12 Monkeys. The RANDOM CAPITALIZATION is the icing on the cake.
Be that as it may, are you trying to say you disagree about what is going to happen to the gold? If so, do you have any evidence?
When I was studying Chinese in Taipei back in the 80s I read a nice story in the newspaper about an old man who kept the family savings in cash in the basement. He hid it in a pile of old newspapers. but one day his daughter in law threw out all the old newspapers in the basement.
Ilambiquated,
Central Banker ELMER FUDD told me that a Big Revaluation of the price of gold is coming. ELMER told me he can’t reveal the time as that would destroy the surprise… which would also allow the public to prepare. This is a BIG NO NO as the Banks are the only one who will be privy to this overnight revaluation.
best regards from Fiat Land,
steve
Another data point that might interest you is that India imported 150 tonnes each month for the last 3 months. It partly explains why gold didn’t go down with the rest of the commodity complex (Its not just oil! copper down 30% in the last 6 months, Aluminium down 20% in 2 months)
At least some of which they eat.
http://www.bbc.com/news/business-16300248
Let’s do the calculation and put this in perspective. One metric ton of gold costs about $40 million. So 29 metric tons is a bit over $1 billion, chump change on a big-country scale.
Suncor just cut 1 billion and laid off 1000.
We in Alberta are having our comeuppance.
Let the good times roll!
New Oil & Gas Industry Regulations:
http://www.nytimes.com/2015/01/14/us/politics/obama-administration-to-unveil-plans-to-cut-methane-emissions.html?_r=0
It doesn’t give any details, therefore it’s hard to know what they are thinking. I wonder why don’t they go for all methane emissions? I understand rice growers and garbage dumps are huge emitters.
Yes, the EPA should follow the EU and ban the dumping of flammable materials.
Beef farming is a big emitter as well. My nephew worked on a project to reduce methane emissions from cows burps. It was intended to save feed costs.
You know, the usa and eu are really inward looking. I bet the best bang for the buck comes from building hydroelectric plants in Mexico coupled to wind farms.
And I would think methane capture in the Mexico and Monterrey dumps are economic.
Oil at ten dollars for a barrel is a good thing. The people here in murka can breathe a sigh of relief. Gas at forty cents a gallon would be a better world. Sixteen dollars and eighty cents per barrel is enough, no sense in making obscene wealth a norm, it is a sick society at this point in time and oil is not to blame, just the mad dog rabid voracious avarice. Soon there afterwards, six dollar oil will be even better. Then all the way down to two dollars for a barrel will make it the world as it should be.
The cure for mad money is mad money. More mad money is peak mad money.
Welcome to madness.
Money? What money? We don’t need no stinkin’ money.
If the critical mass, tipping point, is the madness of one hundred dollar oil, then so be it, that is just the way it is.
The School of Hard Knocks teaches a hard lesson to learn.
http://www.wsj.com/articles/oil-extends-selloff-despite-strong-chinese-trade-oil-data-1421127568
According to this article the price crash is the result of about two million MORE barrels of oil coming to market on daily basis than the end users- the customers- really want. Since nobody REALLY wants it they are only buying it for cat food- in essence you buy as much formula as the baby NEEDS but more than that you will buy only to feed it to the cat.
SOMEBODY is buying it. I am driving my old truck more than I ordinarily would and I am thinking about getting rid of the Escort and putting the full size Buick back on the road.
This makes sense for me because the old truck is at retirement age any way and I might as well squeeze the last few miles out of it I can – and the Buick is fully depreciated as well- not to mention being a VERY comfortable roomy car.
So I am in effect going to buy some gasoline simply because it is now cheap enough to indulge myself.
If the estimate of two million barrels a day of excess supply is accurate then that is about how much will have to be shut in to restore the old supply and demand balance at or near the old price.
So who quits first?
My gut feeling is that production in places like the Bakken will start falling off within just a two or three months but it seems most folks who understand these things better are saying six months or longer.
The question that is most interesting to me at the moment is other than the Bakken and other domestic tight oil operators who are the people who will have to shut in soonest?
With tight oil decline rates being what they are the conventional operators might be able to hang in there until tight oil production falls off enough to allow the price to go back up quite a bit.
“………..who are the people who will have to shut in soonest? My guess would be planned off-shore developments, especially heavy oil projects: There have already been announcements concerning North Sea, North Slope and Newfoundland (i.e., Husky’s White Rose Extension). I guess these would fit your shut-in criteria. “Planned” projects are normally easier to “shelve” that anything ongoing. And of course the giant Kashagan Field seems to get pushed down the road like clockwork (though it’s well passed the “planned” stage. Planned tar sands projects in Alberta have seen deferrals announced for awhile (True, tar sands aren’t conventional). There’s a lot of momentum is the process especially in the big operations.
Doug,
The problem with planned projects being shelved, is that these projects will take the longest to effect the market. These projects are measured in years.it seems even the news that production will decrease in a few months, seems to be too long term for the market at the moment.
It is a crazy world we are living in, but we are setting ourselves up for lower production in a year or two, from the exact reason as you stated above.
Yeah, know what you’re saying and totally agree. But Mac asked what projects would shut-in reserves FIRST so I think my answer is correct: Planned ones. I guess the better question might be (sorry Mac): after cancelled planned projects, what comes next on the list. It seems Majors and governments can always find funds to keep operations going but that’s not the case for publicly financed juniors, at least not in the world I knew. So my guess would be that a lot of real estate (reserves) held by juniors will now be “shut-in” pending “future financing arrangements”.
Thanks Guys,
Now let’s try it phrased a different way.
Who has the highest per barrel current operating costs – among the producers who CAN shut down?
I understand a company may find it easier to run a well or a field at modest loss over the course of a month or a year than to lay out a lot of money to close it permanently. These producers would be the ones in places with ENFORCED environmental regulations.
Beyond this consideration the owners or operators of most wells being produced on a losing cash basis probably have their hopes pinned on prices going back up pretty soon so-up far enough in some cases at least to start generating positive cash flow again.
But in some parts of the world I am guessing the producers can pay a few bribes and just walk away.Which places would most likely fit this criteria -running at a cash loss and potentially able to just walk away ?
There has been a huge amount of publicity about major oil companies walking away from environmental messes in some countries in recent years with the cases winding through various courts just about forever. That sort of faded away and I don’t remember right off the bat just what the final outcome has been. STILL in court?
There’s no need to pay a bribe and walk away. At this time the oil ministries are likely to be asking about how much oil can be shut in, the impact on revenue, employment, etc. This puts a legal obligation on the operator to answer and provide data. The typical approach is for the ministry to issue a new rule to cut back x y and z. The key is to do it so that companies have no recourse to file a complaint in an arbitration court.
Hi Old Farmer Mac,
There will be some marginal stripper wells that get shut in sooner due to low prices (but this effect is relatively small). The bigger effect will be what Doug referred to with new developments being delayed. In the tight oil plays is where this will be most evident over a 3 to 6 month period (from Dec 2014 to May 2015) because the new wells decline so quickly and new drilling will likely slow down considerably so that output either stops growing or declines (depends on how far they go on cutting rigs). If Helms is right then we would expect a rig count under 140 would lead to decline.
This is roughly a 26% drop in the rig count.
If we assume the a 30% drop in the Eagle Ford Rig count would have the same effect, the Nov 2013 to Oct 2014 oil rig count average was 200, so a 26% drop would be 147 oil rigs. The most recent (Jan 9, 2014) weekly estimate from Baker Hughes is 183 oil rigs in the Eagle Ford. Currently the Rig count in North Dakota is 156.
I have a 30% in the comment above which should read 26%.
I might be oversimplifying things, but did not the majority of production increase happen between September and January in 2011,12&13(especially evident in the non-opec liquids less Brazil), with the rest of the year being fairly static (or even dropping). This significant increase seems to be missing in 2014.
A few tens of thousands of plug in hybrids and pure electrics aren’t going to affect the oil market enough to even measure the effect within the next couple of years but progress marches on anyway.
The new Volt is supposed to get fifty miles on a charge- if it gets forty it means that a whole lot of Volt owners who habitually stick close to home will hardly ever need to buy gasoline.
Now hardly anybody but an old gear head farmer seems to understand that unless it rusts away or the electronics get flaky or a Volt may well OUTLAST any conventional car on the road by WIDE WIDE margin.
The gasoline engine in a Volt with two or three hundred thousand miles on the odometer- put there mostly thirty or forty miles or less per day but day in and day out for ten or twenty years – is going to have an engine under the hood that for practical purposes has only as many miles on it as a nearly new car – one only two or three years old.
And if it will still go ten or fifteen miles on a charge then that is far enough to get many an old geezer or cost conscious housewife to the supermarket and back and in millions of cases- far enough to get a commuter to work and home again without using a drop of gasoline.
I BELIEVE in peak oil- and while I also believe in the Wonderful Wonderful Market and the Invincible Invisible Hand I do not believe the market and the hand can provide us with the means to use depleting oil so efficiently that the price of it will stay low. TO THE CONTRARY- I think it will be at or over a hundred bucks in todays dollars within three or four years and maybe for a wild ass guess a hundred fifty bucks in ten years or so.
The resale value of old plug in hybrids that have been well maintained is probably going to be a LOT higher than most people expect.
If the dedicated replacement battery needed when a battery is finally shot beyond hope is available at a reasonable price then an old plugin will be pretty close to as good as new mechanically for the price of an installed battery.But even though batteries in general are getting a lot cheaper a replacement may still be pretty expensive – it will have to be manufactured to fit the car. There may not be enough sales volume to get the price down for older models. BUT BUT it might be possible to get one of these older batteries remanufactured by an aftermarket company by then.
Other than rust there is no reason a car can’t last just about forever once you get rid of the everloving transmission and gasoline engine both of which are subject to uber expensive ( not quite ) unexpected failure and inevitably wearing out no matter what. But with a super simple transmission or NO transmission and a gasoline engine that hardly ever runs a pure electric or plug in hybrid can be expected to last indefinitely compared to a conventional car. I expect a lot of new Volts will eventually be driven a half a million miles.Well made electric motors just don’t wear out. I have seen thousands of them that are forty or fifty years old all in one building all still going strong.
Depending on what happens with the price of batteries there is no reason a car such as a Leaf can’t be kept on the road almost forever for a lot less money per mile than a new car- not to mention avoiding the big upfront investment , higher taxes , higher insurance premiums, most routine maintenance etc.involved with owning a new conventional car.
A small business man or woman who needs a vehicle to run around the city making deliveries can just about get by with a Leaf right now.A Leaf will run ALMOST all day( so long as you lay off the heater or ac) in town at low speeds doing deliveries since it sits about as much has it moves and city traffic usually stays under forty mph.. The teenager or retiree who drives such a car is not going to kick much about how it looks or goes so long as the car generates the paycheck.
The GOOD positive feedbacks of electrics are going to come into play sooner than most people think- people are now finally really getting familiar with the Prius but other than that electrics of any sort are still a novelty to the average driver.
I can’t guess how long it will be but I expect Nissan or some other major manufacturer to come out with a very small light plug in hybrid or pure electric pickup truck pretty soon- one capable of hauling a bulky load – but not a very heavy load- such as a new refrigerator or mattress set. Vans like the little new Ford just aren’t quite spacious enough for a lot of stuff – and not as much fun in the eyes of a young man or woman who wants a truck with an open cargo box. Nobody is in love with vans except old fogey soccer moms and they seem to be getting tired of them as well.
Imported oil is already almost out of reach in a lot of countries even at well under a hundred dollars a barrel. Wind and solar power are coming on strong and coal fired juice is going to stay cheap for a while- at least in comparison to gasoline. There will be a ready world market for millions of such very light trucks as soon as people learn they are dependable and have decent resale value.
Actually there are at least 9 million hybrids, and 600,000 battery electric vehicles on the road today. That many vehicles is definitely having an effect on oil consumption.
It is but hybrids and electrics are still a very small part of the total market and I was referring to the ADDITIONAL electric vehicles that will be sold in the very near future- but I see now that I could have been more clear about that.
I think that electrics and hybrids are going to sell like ice water in hell in a few more years -maybe as soon as four or five years and no more than ten or so is my guess based on battery costs coming down and oil going up plus consumers getting over fear of low resale and short range.
Oil may be up a lot within five years. Battery prices are certainly going to be down substantially within that time unless electrics are selling so well that the battery makers can keep their prices up even as they lower their costs. There is nothing impossible about this scenario.They will be protected from any serious competition by lots of patents and the high cost and long lead time involved in getting into the battery business. Manufacturing capacity may not be adequate to meet demand if oil spikes sharply and stays up.
I saw one estimate that the in 2014 electric and plug-in hybrid vehicles accounted for about one half of one percent of global vehicle sales.
Hi Jeff,
Do you expect that oil prices will increase in the future? Low oil prices are bad for the oil industry, but some economists think low oil prices will boost economic growth. If true, then demand for oil increases while supply decreases (due to less drilling at low oil prices) which leads to higher oil prices.
Whether the higher oil prices will be enough to keep oil output flat for a couple of years remains to be seen, but eventually oil prices will reach a level ($150/b maybe) where Old Farmer Mac’s guess that plug-in hybrids and EVs will sell like hotcakes will become a reality.
It takes some time for people to accept new technology, but 4 to 5 dollar/gallon gasoline makes them a little more accepting.
we are paying 1.09 € per liter at one of the local stations, that’s about $4.85 per gallon. I bought me an Altea XL with a Diesel engine. The range is almost 700 miles, and I get to use my heater and AC.
http://www.carbuyer.co.uk/reviews/seat/altea-xl/hatchback/16-tdi-i-tech-dsg_7162423/review
Hi Fernando,
In many places in the US there is very little public transportation. Where you would use the light rail near your home, some people in the US might own a Nissan Leaf for short range trips and have a second car possibly a plug in hybrid, a hybrid, or diesel for longer trips.
What is a typical price for diesel there at $100/b Brent?
The highest I paid was €1.50 for the high octane gasoline I had to put in my old Mercedes. That clunker was killing me.
Dennis, I still own a couple of vehicles in Texas, so Im pretty familiar with USA lifestyles. I got a hunch that usa suburbs will shrink a lot in the next 50 years. And people who live very far will be using small two seater hybrids. But RIGHT now I’d rather get 50 miles per gallon with my stick shift diesel. Running the heater and AC are really important in this climate.
It’s amazing the a diesel can get 58 MPG. I think the VW is even higher than that. I’ll bet it’s possible to build a diesel hybrid that can get over 100 MPG.
The Altea XL uses a VW diesel. These cars are built here in Spain. But they got Farhfevnuggen. And they are a lot cheaper.
I guess it depends on how you drive it. These guys got 77.99 MPG.
http://www.autotrader.com/research/article/car-news/210689/volkswagen-passat-tdi-sets-world-record-for-fuel-economy.jsp
Remember that is imperial gallons which are 1.25 US gallons, so it is really 48 MPG in US gallons.
Not really, it’s 1.2 to the US gallon. Well actually 1.20095.
Hi Ron,
I stand corrected, 58 MPG (UK)*1.2=48.3 MPG(US). Someone once told me there were 5 US quarts to a UK gallon, I always assumed this was an exact conversion and never checked. I realize now this is an approximation, I was doing 5/4=1.25, which is wrong. Thanks for correcting me!
95 MPG
http://www.greencarreports.com/news/1093875_mazda-to-offer-diesel-hybrid-in-japan-only-while-u-s-diesels-still-mia
I get 50 mpg if I drive smoothly and coast as much as possible. I also memorized all the lights and their timing, so I can usually drive quite a few miles without stopping. The problem arises when I have to stop for pedestrians at crosswalks.
Here in Germany we’ve got below €1.10 per liter as well, to my surprise.
A guy in the office just bought a new Toyota Auris gasoline hybrid that claims to use 3 liters per 100 km, which I guess means about 80 mpg. He hasn’t had it long though.
Jeff, interesting comment about worldwide market penetration of electric and plug-in hybrid vehicles. Meanwhile, I noticed: “Ford dazzles Detroit by unveiling 600+ hp GT supercar”. It probably has a big battery as well: In order to start the engine.
haha
Yeah, and I doubt very much they will be selling 600,000 of them this year.
Car looks ugly anyway. The old GT was 1,000 times better.
“I saw one estimate that the in 2014 electric and plug-in hybrid vehicles accounted for about one half of one percent of global vehicle sales.”
It’s a hand grenade. Some small, innocuous looking comment in a conversation that then explodes and decides the battle.
BTW, pretty sure that % is in free fall since June.
EV sales were up 18% vs 6% for all autos in the US for 2014 compared to 2013.
What was that in the past 6 months? There is no history before June.
EV sales have been doubling every year for the past 4 years. They will double again this year, bringing the total up from 600,000 to 1.2 million.
I suspect EV sales (and Hydrogen vehicle sales), will both double again next year.
In Q2 2014 alone the world production of cars was 33,895,253. http://www.oica.net/category/production-statistics/ 1.2 Million EV accumulated over 4 years is less than a drop in the bucket.
What matters is the rate of increase. Same with solar. Do the math.
I think there are many who do not understand the exponential function.
DC
Exactly my thinking.
NAOM
Actually, I’ll add to that. The differential is important. At the start of an exponential rise it doesn’t look like much is changing. When it gets going then it becomes very visible.
NAOM
And when people realize that the combo of the EV- AND THE PV TO RUN IT- is a bargain, and people who have money to invest will pick that as a very safe investment.
Sure as hell a far safer investment than cold deep holes in real hard rock in some hard to get to place with unbearable weather and every-day threat of total disaster.
Dems change tune after mocking GOP for ‘drill, baby, drill’
http://www.foxnews.com/politics/2015/01/13/dems-change-tune-after-mocking-gop-for-drill-baby-drill/
http://www.foxnews.com/politics/2015/01/13/dems-change-tune-after-mocking-gop-for-drill-baby-drill/
Now I must admit that I didn’t expect domestic production to take off the way it did.
But the voters noticed that it did.
(As an aside the average man or woman on the street also sees this increase in oil production as proof positive that liberals and democrats can’t be trusted – that they have been caught in a lie about oil and that therefore they are lying about anything else relating to the environment. We are going to pay a hell of a price for this mistake on the part of both factions a few years down the road.)
And they got totally fed up with opposition to the Keystone- which became one of the very hottest of hot buttons for conservatives. The pipeline came to be a weather vane that ordinary conservative folks used to form their opinion about democratic party priorities.They said to each other look at the Keystone and you will see easily enough which way the democratic wind blows.
If the environmental movement had any body with POLITICAL brains at the head of it the democrats would have come out and admitted honestly that one more pipeline hardly matters and that the tar sand oil is going to get to market anyway- after extracting a few billions in ransom for letting the pipeline proposal out of political jail.
Those billions would have come in very handy indeed if used to buy up substantial tracts of land to add to nature preserves or to pay for additional research and development of renewable energy technologies.
Everybody with a LICK of sense understands that the pipeline will be good for the country given the cards that reality has put on the table. It will take oil off of the railroads and put it in a BRAND NEW pipeline built to the latest standards. It will put however many people it takes to work to build it. It will ensure than a lot of oil coming thru gets refined here in the US. If it does NOT get built it will almost for sure result in the Chinese gladly helping the Canadians get lines built East or West or maybe both ways to get the oil to market.
And when the shit hits the fan in terms of an international crisis someday – which will surely come – having that oil flowing thru this country where WE have more control of it will be worth as much as an aircraft carrier or an armored division – maybe ten times as much.
Refusing to load it on a ship headed someplace you don’t want it to go is a hell of a lot different from sending the navy to embargo a Canadian port.I doubt our friendly relations would even survive such a move. Actually sinking such a ship headed someplace we are trying to strangle peacefully – meaning without bombs and bullets- would mean going to war. In ten years China is going to have blue water guided missile destroyers to escort any ships headed her way.
Now we may never be at war with China. Rockman’s MADOR is my hope. But anybody who has any sense of history simply must understand that the world is dog eat dog place and that empires are going to fight sooner or later if their interests collide. Our interests are certainly in collision with China’s already.
There would be more democrats and fewer neanderthals in congress.
the Keystone XL pipeline sure has an oddly energetic opposition. As it turns out, the main competitor to the canadian extra heavy blend is the nearly identical blend coming in by tanker. This makes me wonder if the pipeline “enviromental” opposition may not be influenced by venezuelan agents?
The opposition is coming from Nebraska farmers who see no value in having a pipeline crossing their farms.
The oil industry is not considered trustworthy when it comes to preventing oil spills.
A handful of farmers have never yet to my knowledge managed to block a major construction project wanted by big industry big politics and the public in general.
There are farmers along the routes proposed who are opposed.
But it is the White House either pandering or holding true to the environmental faction depending on how you want to express it that is stopping the pipeline.
I would be opposed to it myself if I thought stopping it would actually help solve any problems.
Building it will solve some problems.
Stopping it has created more problems. Beginning with a Neanderthal take over of Washington DC.
I’m just explaining where the opposition started. And these are Republican farmers. A few of them didn’t want the pipeline to go across their property and pushed back when they were told it WAS going to go on their property whether they liked it or not.
It started out as a property rights and imminent domain issue.
And given that it was a Canadian company, some of these Republican US farmers didn’t much like being told what to do.
I meant eminent domain.
Here is a good background article.
http://www.nytimes.com/2014/05/18/magazine/jane-kleeb-vs-the-keystone-pipeline.html?partner=socialflow&smid=tw-nytmag
The people I know who are fighting Keystone are Nebraskans, particularly those with ties to the land.
The pipeline’s route would pass through the Sandhills in north-central Nebraska and over the Ogallala Aquifer, the lifeblood of Great Plains agriculture. In much of the region, the water table is at or near the surface. At the time of the meeting, the BP Deepwater Horizon disaster was still underway, devastating fisheries in the Gulf of Mexico and leaving Nebraska farmers worried about a spill in their own backyards. …
Rather than rallying behind the idea of American independence from Middle Eastern oil, Nebraskans saw a foreign company coming into their state and asserting rights to land that had been in their families for generations. … TransCanada came in with “corporate weaponry blazing,” Domina said. He claimed that agents lied to his clients about whether their neighbors had signed easement agreements and about how little money they would get if they didn’t.
Here’s a bit more from the article.
These farmers and ranchers in Nebraska don’t trust the oil industry to conduct a safe operation because the oil industry has had too many safety issues in the past.
For the hard core Keystone fighters, it isn’t about climate change. It is about protecting their land.
If the line is approved, it could carry 830,000 barrels a day of this “diluted bitumen” across Nebraska, over 275 miles and through 515 private properties. No one knows exactly what a leak would do, but evidence from past malfunctions suggests catastrophe. In 2010, a spill from Enbridge’s Line 6B dropped 840,000 gallons of bitumen to the bottom of the Kalamazoo River in Michigan. Four years and more than a billion dollars later, the cleanup continues. Last spring, Exxon’s Pegasus line burst near a residential area of Mayflower, Ark., spreading 210,000 gallons of bitumen through neighborhood streets, causing evacuations and leaving residents complaining of respiratory problems, nausea and headaches.
The overall thrust comes from watermelons. I like to get inside their organizations to see how they think. What I find is a very incoherent set of reasons. But if I mention, “hey, let’s go start protests to stop heavy oil coming from Venezuela” the leaders go quiet and explain the pipeline is their target. I spend quite a bit of time tracking links and interconnections, and I smell a rat. I think quite a few of the ones at the top are watermelons financed by the venezuelan dictatorship.
I think quite a few of the ones at the top are watermelons financed by the venezuelan dictatorship.
I have no idea. It’s certainly not a theory I have run across before. I am very aware of the grassroots movement to stop the pipeline and that has always come from farmers and ranchers who don’t want it on their property. And a big reason is that oil companies have not had the best safety records.
If the pipeline could be run somewhere other than across their pipelines, they would likely quit protesting. They aren’t doing it for global environmental reasons. They are doing it for personal reasons.
And by Obama saying he wants to wait until the courts settle the issue, I think he has removed himself from the political fight of deciding whether it is a good or bad project. As long as he lets the courts say Yes or No, then he hasn’t taken a stand one way or the other.
It’s the Republicans who are tossing out their traditional support of property rights holders in this one by not letting it work itself out via court rulings.
Instead of saying, “If the pipeline could be run somewhere other than across their pipelines …”
I meant to say, “If the pipeline could run somewhere other than across their property …”
Hey Mac,
A war between the US and China would basically be the end of the world.
But I agree, if we don’t take Canada’s oil, China will.
Ron: Thank you so much. I am not oil expert( M.D.) but enjoy reading the experts opinion. This is a good replacement for TOD. Thanks again.
For those who have advocated more wind turbines on the plains of North America, you may want to maybe give some thought of what an Fx tornado would do to a wind turbine farm.
Fortunately, the results are out there and the wrath of Mother Nature wreaks havoc on those wind turbines to the likes that you have never seen. The wind turbines are more or less ripped apart.
A few F5 tornadoes making swaths towards wind turbine farms are going to have devastating aftermath, you can remove all doubt.
Over time, most if not all wind turbines located on the Great Plains will probably succumb to severe weather events with a few tornadoes in the mix.
Definitely a short term energy outlook, to be sure.
It will be and is the biggest mess you will ever see. Better to quit while you’re ahead instead continuing on a hell bound train.
It’s not nice to fool Mother Nature.
It is better to locate wind turbines where tornadoes are few and far between. You’ll be glad you did.
That’s not a sound reason not to build wind turbines. If we used your logic, we wouldn’t build houses in the Texas panhandle.
http://www.reuters.com/article/2015/01/14/usa-oil-production-kemp-idUKL6N0UT2H420150114
Thanks for all !
Sylvie,
Thanks for the article. The EIA is of course assuming that the shale companies are still in business, and they can still borrow a heap of cheap money from those friendly bankers and Junk bond dealers.
Time will see how that one plays out.
It’s all happening fast. Reports looking back 3 months are ancient history. The EIA is still talking about US oil output growing.
The industry is 100% full of people who want it to all to work and to keep their jobs.
There was a time when you could say . . . everyone who can see the inevitable knows mass firings are coming and they won’t keep their jobs . . . but that time is no more. No one can make those kinds of judgments anymore, because central banks can move at a whim. In 2011 everyone utterly knew the 11% interest Italy had to pay was lethal. Shorting Italian stocks was guaranteed profit.
Then Draghi said he’d buy Italian bonds. The price exploded because the buyer-with-infinite-money just said he was going to buy. Yields move inversely with price and presto, not 11% anymore. Down towards 0%.
Market forces will never be triumphant again. That world is gone forever.
Hi All,
In the previous post there was some discussion about the number of rigs needed to keep output flat in North Dakota. Lynn Helms estimates 140 rigs and also estimates that over 95% of drilling targets the Bakken/Three Forks so I will use 96%. For the past 12 months the average number of active rigs has been 190 according to the NDIC and in the Bakken/Three Forks an average of 163 new wells per month have been brought online (1956 wells over 12 months from Nov 2013 to Oct 2014). In addition the number of wells waiting on completion services has increased by 190 wells over the same period (from 460 to 650), so the total wells drilled was 1956+190=2146 wells over 12 months. We will assume 96% of the rigs are operating in the Bakken/Three Forks, so 182 rigs drilled 2146 wells for 11.8 wells/rig/year.
We will assume that output outside the Bakken/Three Forks is relatively flat at 62 kb/d (it was 65 kb/d the previous October) and that the percentage of rigs targeting the Bakken/Three Forks remains 96% so 134 rigs would be drilling in the Bakken/Three Forks. If we also assume the rig efficiency remains 11.8 wells/rig/year, then in 12 months, 134 rigs would drill 1581 wells or 132 wells per month.
It is interesting that my model also suggests 130 wells per month will keep output relatively flat, with North Dakota output between 1160 kb/d and 1210 kb/d from Nov 2014 to Dec 2017. I think Helms estimate is spot on if all of the assumptions are correct.
The EIA’s Weekly Petroleum Status Report is out this AM. It shows that the 4 week consumption is up almost 4% over last year during colder weather. Of interest is a large jump in gasoline consumption, up 7.1% and distillate, up 7.8%, for the 4 week period compared to last year. Perhaps more importantly, imports went up and exports declined, the result being a net decline of about 1 million bbls/d over the 4 week period.
The great ‘merican consumption machine appears to be cranking up for a big party now that oil has become relatively cheap. One can only wonder how long it will be before the price of WTI oil begins to rise again…
Imagine that. Increased consumption. But price falls.
cart before horse. Price falls consumption increases. If price continues to fall consumption will continue to increase.
How much oil do you think will be produced if the price is $1/b?
As much as is required to feed people. The price won’t matter since money is not a physical concept.
Nope.
Anyway, the world is engaged in a goal seeking exercise to find how supply and demand dictated price fall, and conveniently forgets that they weren’t doing this in June to predict a price fall.
But blah blah, I just spent some time looking at sea-going oil tankers. Lotsa talk out about tankers being booked to sit and eat crew salary.
Oddly, the wiki has nothing newer than 2005 in it. They quote “In 2005, 2.42 billion metric tonnes of oil moved by oil tanker” and in 2007, 3/4 of that was crude, the rest petroleum products.
That’s about 15 billion barrels for the year. Growing that a bit to now is . . . call it 20 billion barrels X 0.75 / 365 and it’s 41 million bpd moving on tankers. About half of global consumption.
With the alleged oversupply of 1 million (or more, or less, no one seems to have any idea (probably because it’s BS)) for 180 days that’s 180 million barrels. Clearly that’s not hiding at sea.
Oooh, there’s a thought. Maybe it’s hiding in the oil fields.
Hi all,
People seem to not understand what too much supply means. It means that at $75/b more is being produced than consumers are willing to buy for $75/b, so what happens? The price falls to the point where consumers will be willing to purchase the oil, now there is a little wiggle room because some oil can be stored, but not that much. The amount supplied and consumed means very little unless the price is specified. The price will move to match supply and demand. Most people seem to understand this, but a few comments suggest a failure to understand this point.
Ya because a barrel of oil on the shelf on day 1 isn’t really there on day 1 if the price is different.
Yes of course prices don’t matter in Watcher’s world.
Russia Just Pulled Itself Out Of The Petrodollar
Back in November, before most grasped just how serious the collapse in crude was (and would become, as well as its massive implications), we wrote “How The Petrodollar Quietly Died, And Nobody Noticed”, because for the first time in almost two decades, energy-exporting countries would pull their “petrodollars” out of world markets in 2015.
http://www.zerohedge.com/news/2015-01-14/russia-just-pulled-itself-out-petrodollar
This may indeed turn out to be quite an interesting year for the U.S. Dollar and U.S. Economy.
steve
Bankrupt Russia is pillaging its sovereign wealth funds to support the ruble. It doesn’t seem like there is any choice on the Russians’ part, if the fund’s managers don’t do something the Russians will swap worthless rubles for whatever dollars they can find and squirrel them away.
There isn’t much of US trade w/ Russia; far more euro trades w/ EU. Dollars to Russia come from China. It seems likely that China is insisting that Russia accept yuan rather than dollars which are becoming dear to the Chinese.
One way or the other dollars will become scarce in circulation and worth more, not really what ‘going off the dollar’ folks @ Zerohedge have in mind.
Big breaking news – even Fed admits falling oil price is having negative economic effects:
http://www.cnbc.com/id/102338135
” Federal Reserve officials are reporting concerns over the impact falling oil prices will have on an improving economy, according to the central bank’s latest “Beige Book” report.
The economic review, which the Fed releases eight times a year, reflected hopes for better growth but noted several problem areas.
Oil prices were seen as a boon to consumers but a problem for energy companies, with the Dallas Fed reporting that Texas energy firms were projecting hiring freezes and layoffs to accompany a 15 percent to 40 percent decline in demand. ”
Boom, so to speak.
Is that the reason why Brent is up $1.75 and WTI $2.00 at 15:05? This would show how nervous traders are.
Yes, the Dallas Fed would see things in that light. The Fed is divided up by US districts, and each district analyzes its regional economy. I bet the New York Fed is more sanguine.
ND reported Bakken data for December today. Production was up by just 3600 barrels. This is the key note in the directors commentary:
The number of well completions decreased from 145(final) in October to 39(preliminary) in November. Oil price is by far the biggest driver behind the slow-down. Operators report postponing completion work to avoid high initial oil production at very low prices and achieve NDIC gas capture goals.
[…] scaricato dal sito dell’EIA. Si tratta di 48 pagine molto noiose da leggere. Fortunatamente Ron Patterson lo riassume per […]