Data for the OPEC charts below were taken from the October OPEC Monthly Oil Market Report
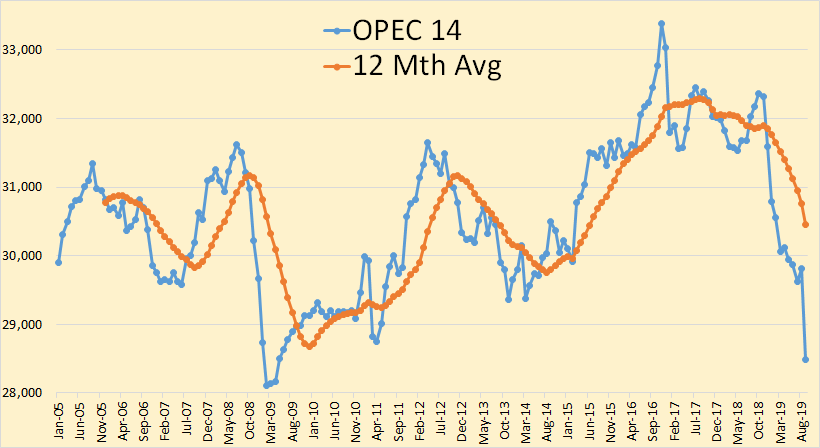
OPEC 14 crude oil production was down1,318,000 barrels per day in September. Most of that decline was due to the Iranian attack on the Saudi oil complex at Abqaiq.
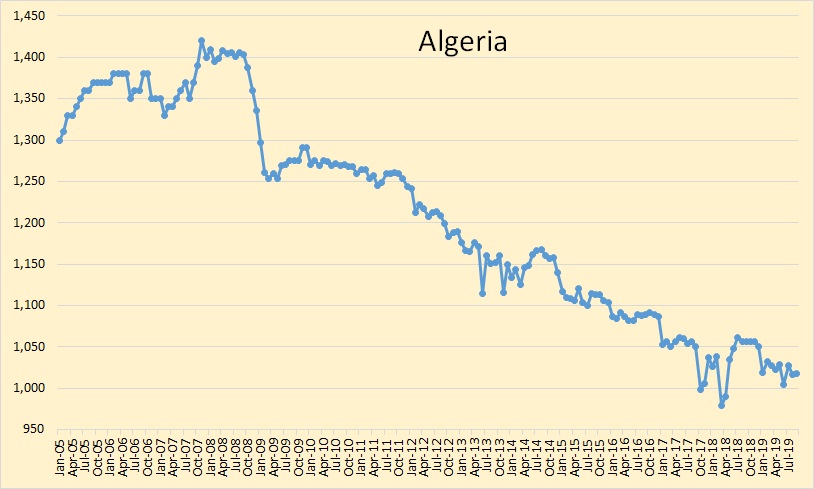
Algeria is in slow decline.
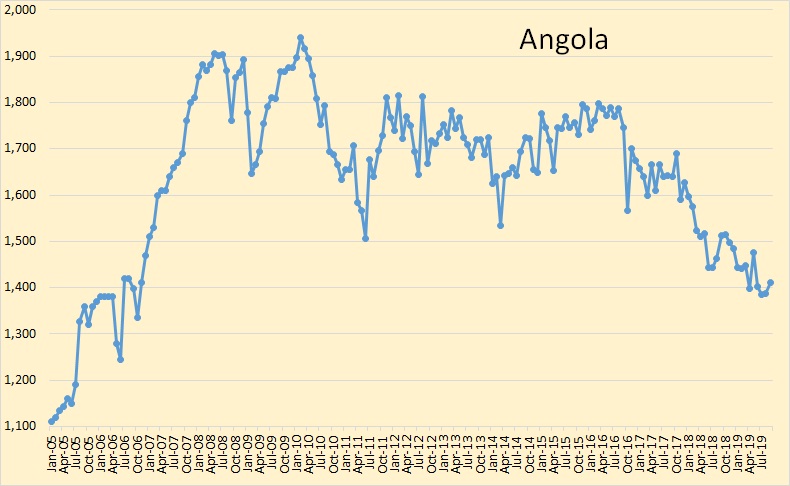
Angola is also in slow decline.
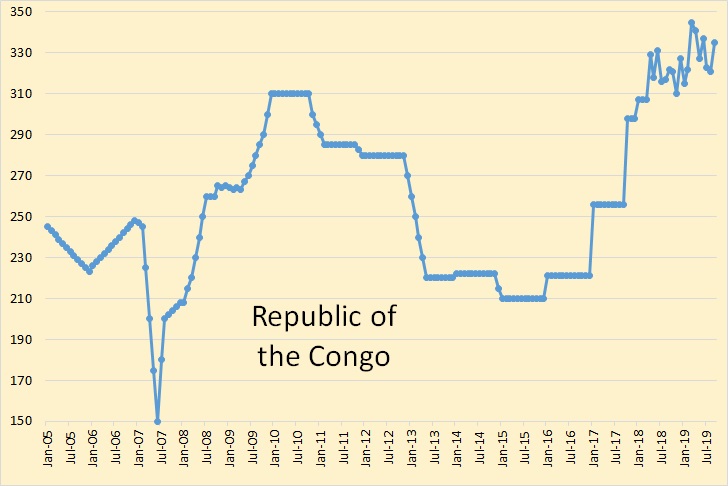
The Republic of the Congo does not have enough production to be a factor one way or the other.
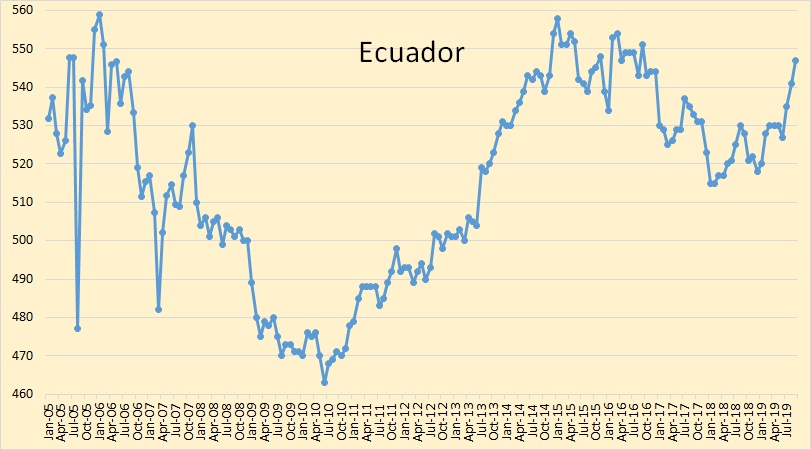
Ecuador will leave OPEC at the end of December.
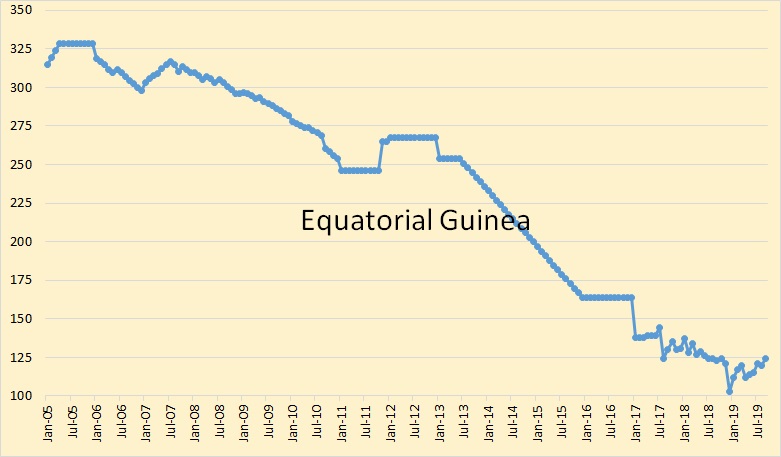
Equatorial Guinea hardly produces enough to make a difference.
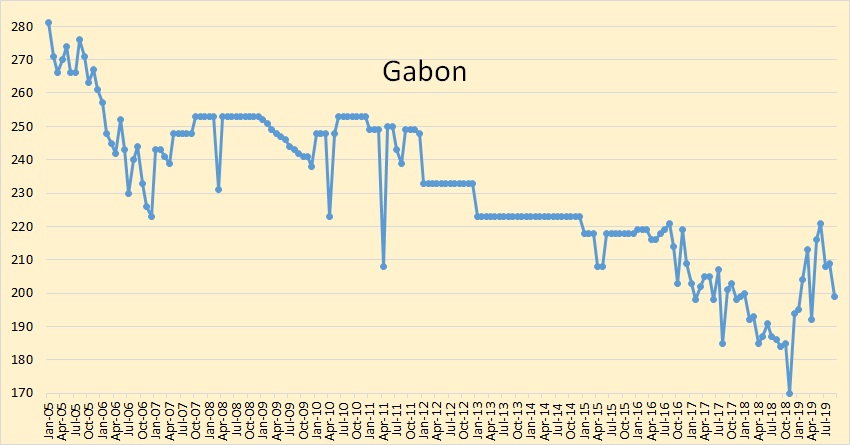
Gabon is at 200 kb/d.
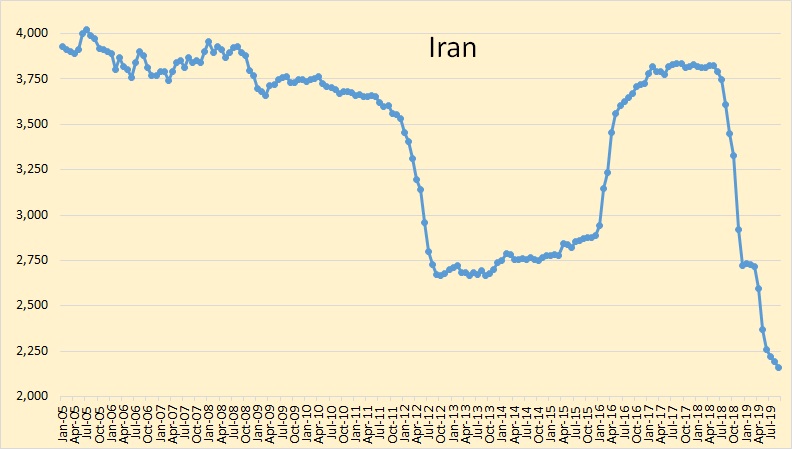
Iran is trying desperately to overcome sanctions but is not having a lot of luck.
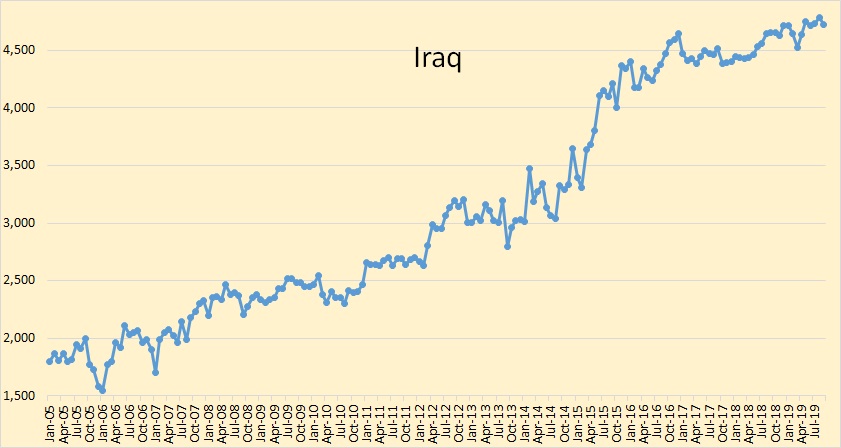
Iraqi crude production was down 60,000 bpd in September but they are still 212,000 bpd above their quota.
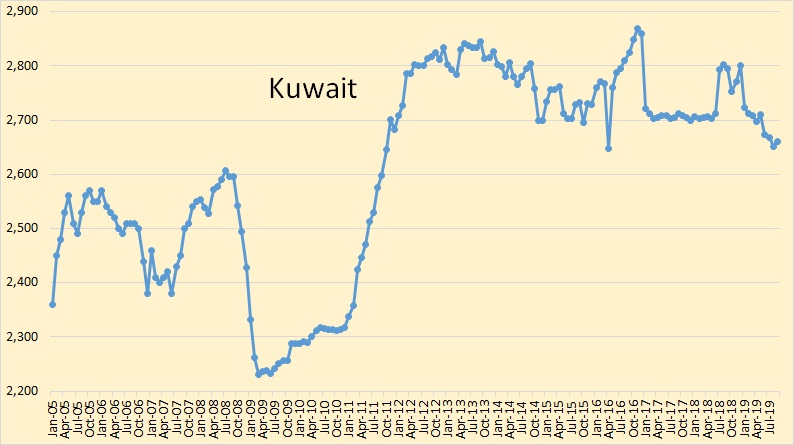
I believe Kuwait is producing flat out and will continue a slow decline. That is except for the Neutral Zone of course, which is shut down due to a conflict with Saudi Arabia.
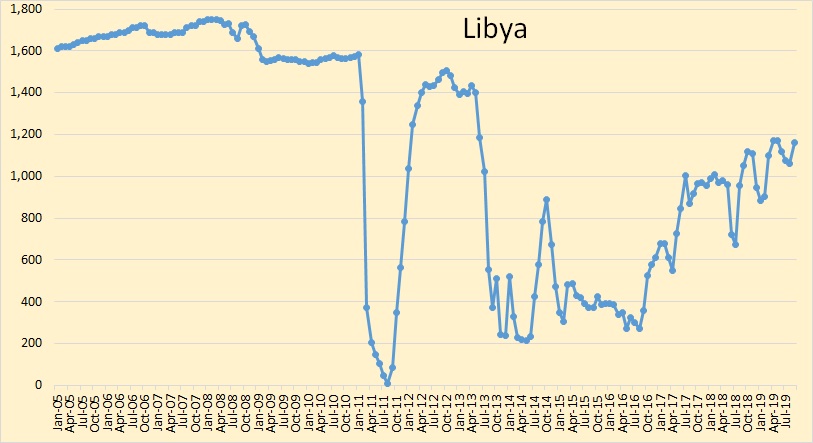
Libya is exempt from sanctions due to ongoing conflict in the area. Nevertheless, I believe the conflict is having little effect on their production
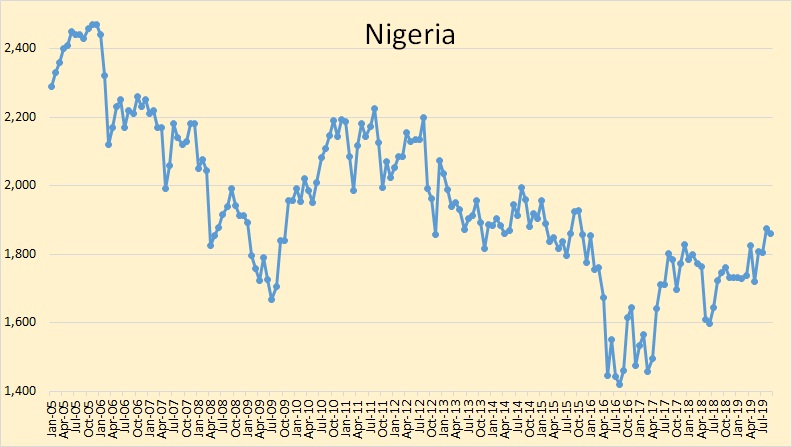
Nigerian crude oil production was down slightly in September, 16 kb/d. However, they are still producing at 174,000 bpd above their quota.
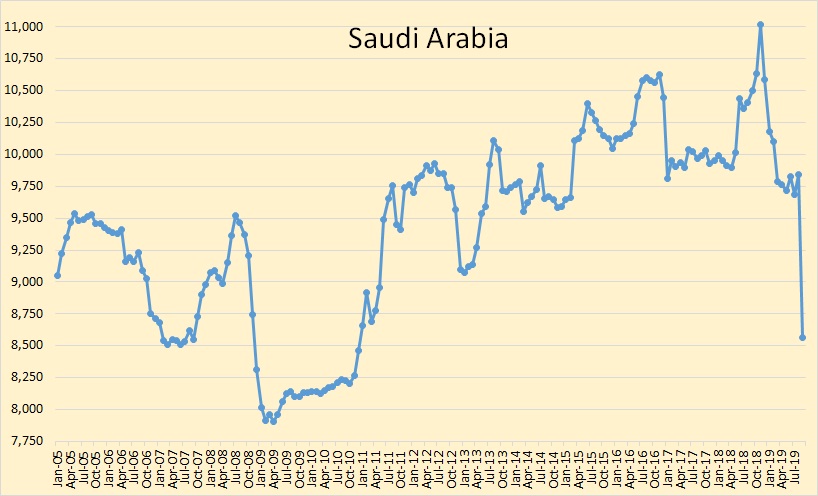
Saudi crude oil production was down 1,280,000 barrels per day in September due to the attack on their Abqaiq facility. It remains to be seen how much they have recovered.
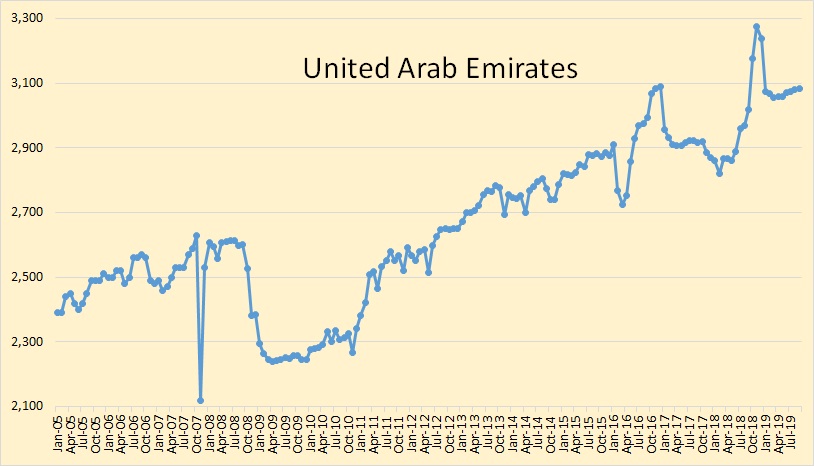
UAE crude oil production is holding steady. They are only 10,000 bpd above their quota. Their October, November, December surge was simply positioning for a higher quota. They may have simply saved oil in storage preparing for quota positioning.
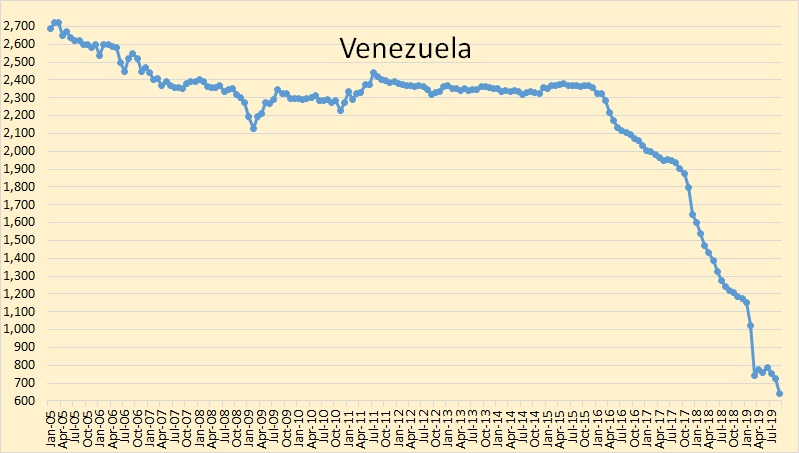
Venezuela took another big hit in September, down 82,000 bpd. What happens to Venezuela is a big question. If their government collapses completely, what will happen to their oil production?
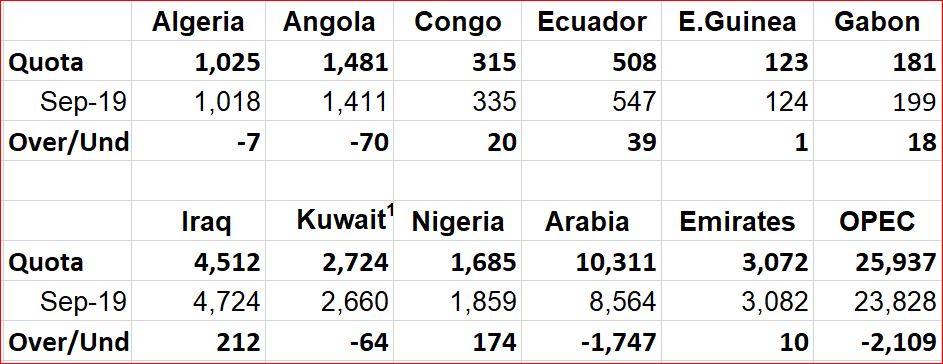
Eleven OPEC nations are subject to quotas. Most of them are simply ignoring their quota and producing flat out. Saudi Arabia is having the only country having a major effect on world oil production.
World oil supply was down 1,770,000 barrels per day in September. Most of that was obviously due to the Saudi Arabia Abqaiq attack. However Non-OPEC total liquids production, according to the OPEC Secretariat, was down 450,000 barrels per day in September. That is very significant. I wonder where it came from?
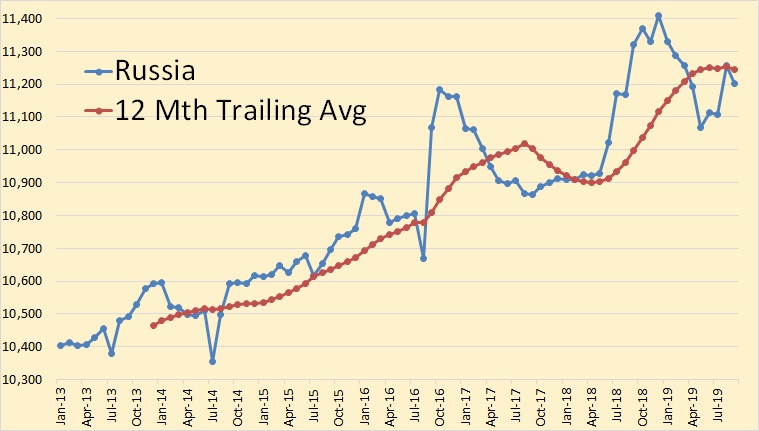
Russia was down 56,000 barrels per day in September.
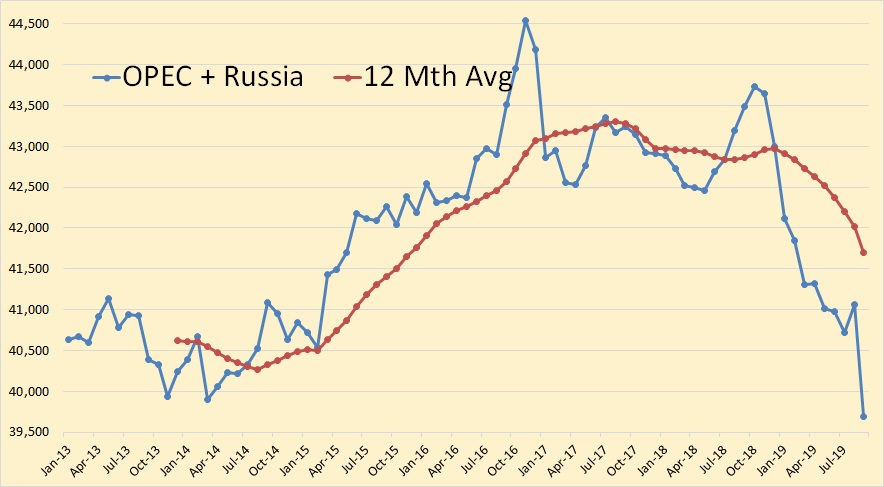
OPEC + Russia was down 1,377,000 barrels per day in September.
242 responses to “OPEC September 2019 Oil Production”
“Most of that decline was due to the Iranian attack on the Saudi oil complex at Abqaiq.”
Interesting that there has been no overt response as of yet.
There won’t be because Iran will respond by finishing the job and everyone knows it.
Yep–
Even the Fat Boy knows Iran could put the planet in a depression in 15 minutes.
I’m sure it has been explained to him.
Just look at the actions (none).
“Interesting that there has been no overt response as of yet.”
Also interesting that there has been no conclusive evidence that Iran was the attacker and yet here are all these articles writing this in the past tense as proven fact.
Simply repeating something often enough does not make it true to me.
+1
“Simply repeating something often enough does not make it true..”
Completely agree Chris.
Tell dick and donald that.
https://www.reuters.com/article/us-iraq-war-quotes/factbox-iraq-war-the-notable-quotes-idUSL212762520080311
I agree. The Houthis have been pinging the system and taking out radar components for years. Craft up some long range fuel tanks and you’re good to go. This is well within their wheelhouse, with lots of help from Iran lol. I’m also starting to feel that the Houthis thanking persons in the kingdom for help on the mission didn’t just mean some maintance guy putting transponders for targeting on the structures. Something is afoot in The House of Saud.
Absolutely correct Chris. This is the era of false flags and asymmetric warfare.
Let’s be done with it. Say along with me; “Peak Demand”, “Peak Demand”, “Peak Demand”.
Well, sort of . . . peak oil at $60 (after 6 years of $100 oil) crushed the world economy, hence “Peak Demand”.
Total absolute bullshit Peter. Peak oil will be peak oil regardless of the cause. If we have peak demand it will be because the oil supply is so short, and the price of oil too high, that people can no longer afford to buy oil. So peak demand will be because of peak supply.
However, demand is still rising and shows no sign of letting up until the supply peaks.
Peak demand is nothing but utter bullshit.
Ron,
There will come a time, probably after 2040 when at a given oil price level, perhaps $125/bo in 2035 that supply will fall, but demand will fall at roughly the same rate as people switch to EVs and other non-oil types of land transport (in this situation oil price remains roughly stable at $125+/-5 per barrel. By 2040 or so demand may start to fall faster than supply and we will know this because the economy is growing at roughly the normal rate (for the World this would be real GDP per capita growth of about 1.4% per year), but oil prices start to fall.
I know you think this is a pipe dream, in 1910, the same was said of ICE vehicles, especially by old guys like you and me.
We probably won’t be around to see it, in the mean time we can tell each other we are full of it. 🙂
I agree that right now we are probably not at peak demand, but the low oil prices do suggest either an excess of oil supply or a lack of oil demand. This is likely due to trade disputes and other factors reducing the rate of economic growth, which reduces the rate of growth in oil demand.
So not really peak demand, just low demand.
Dennis,
Your extrapolation of technological progress is shortsighted at best. You make some fallacies in my humble opinion.
1) Just because an event took place in the past doesn’t necessarily mean it will take place in the future. (tech progress)
2) Moores law is no longer valid as limits of size of CPUs is reached. I believe this might have implications in the future. We shall see.
3) Your predictions about what will or will not happen in 2030+ etc is questionable and i am highly critical of your predictions.
No one can predict oil prices, supply or demand in the short term, but at times it seems you talk with such high confidence about the price, supply and demand of oil in the year 2030+.
You obviously have every right to make a prediction. But others have every right to critique it.
For me it is laughable that someone could talk with confidence about the price, supply and demand of oil in the long-term (2030+), when even short term predictions becoming undone is seemingly the rules of the game in this complex world we live in.
Iron Mike
I am confident oil will peak.
I am also confident that initially demand will outstrip supply unless oil prices rise.
The rise in oil prices is likely to spur a transition to alternatives.
Timing is unknown. I am far from confident about specific timing. You wi note if you read carefully that I suggest demand might fall below supply after 2040. That is a pretty large window 2040 to infinity wouldn’t you say. ;
You are basically correct and I have repeated over and over we don’t know what will happen tomorrow.
In my scenarios I make careful assumptions about the future and simply see wher the model leads.
There are an infinite number of different assumptions that might be made.
Make your own.
It occurs to me that peak demand vs peak supply comes down to oil prices at the peak.
I agree with Ron that oil prices are likely to be high at the peak and are likely to continue to rise after the peak unless/until there is a major recession. My rough guess is peak oil in 2025 followed by severe recession in 2030.
If 2018 proves to be the peak, that might suggest peak demand due to low price level.
My expectation is output will rise above the 2018 level by 2021. A peak over 85 Mb/d after 2023 seems likely, 86 to 87 Mb/d in 2025 is my best guess, but 2023-2027 at 85 to 89 Mb/d probably with 60 % confidence.
“If 2018 proves to be the peak, that might suggest peak demand due to low price level.”
Can you elaborate as to why? Wouldn’t low prices be more attractive to consumers of oil ?
Iron Mike,
The idea is that oil prices are low because supply meets demand at the low price. So if 2018 was the peak in World output and oil prices were relatively low (certainly they were low relative to 2011 to 2014) then the peak would have been the result in a peak for World demand rather than supply.
We would expect in a peak supply scenario that we would see high oil prices as high oil prices would be needed to reduce consumption level (demand) to the level of available supply (production).
I doubt that the peak in 2018 will not be surpassed in the future and doubt the peak in oil output will be due to peak demand, I expect high oil prices, probably $100/b+/-10 at the peak.
Dennis,
What are your thoughts on the following common argument:
As oil becomes scarce, since it is an essential input to the economy, the marginal parts of the economy simply cease. This would have the effect of countering any price increase due to scarcity, as the same scarcity would be destroying demand. This is what is meant by “demand destruction”, and would imply the possibility of prolonged low prices, with temporary high price spikes, as oil production peaks and declines.
This argument can be extended, first to all fossil fuels, and then to energy in general. Then, if we extend the concept once more to surplus energy, taking into account the energy cost to get energy, we could come to the idea that, as surplus energy available to society peaks, the resulting long depression will act to keep energy prices low. This would be a continuous process, and we would never expect a prolonged period of high energy prices.
Another way to think of this is that the economy will be operating in an opposite manner to how it has the last 250 or so years: rather than growing with the occasional spike of degrowth, or recession, it will instead be shrinking, with the occasional spike of growth. It’s worth noting that prolonged periods (hundreds of years!) of the global economy shrinking have happened in the past, so this is not unheard of or impossible.
Surely you agree this would totally change “the rules”, so to speak? There would be a constant downward pressure on demand, until such point as the economy resumed growth in general. Bear in mind, our understanding of economics has all been developed during a period of prolonged growth. We simply do not know what “rules” govern an economy which is shrinking in the long term.
Niko,
I don’t find the argument convincing. Consider 1980 to 1983 when World C+C output fell and did not return to 1980 level until 1993. Oil prices went up economic growth slowed and the economy adjusted to using less oil.
I think much the same will occur when oil peaks. The World economy will adjust and in this case it may become apparent that supply will not increase in the future spurring greater effort to transition away from oil.
It may also become apparent that coal and natural gas will also peak once oil production has peaked, this will spur greater effort to transition away from fossil fuel.
At some point World population will peak (my guess is 2065, but that may be too hopeful) and when it does and starts to decline then economic growth will cease when growth in real GDP per capita matches the decline rate in population (currently real GDP per capita grows at around 1.4% annually). If the growth rate of the past 50 years of real GDP per capita continues long term (it might be more or less than this, likley less) then a fall in population at 1.4% per year would lead to zero economic growth.
I agree with you that the old rules of economics may no longer apply at that point, we may not need to worry too much about that for 60 to 70 years, there will be plenty of other challenges to address in the interrim such as the necessary transition to other forms of energy besides fossil fuel.
Dennis,
In your other comment you said
“I don’t find the argument convincing. Consider 1980 to 1983 when World C+C output fell and did not return to 1980 level until 1993. Oil prices went up economic growth slowed and the economy adjusted to using less oil.”
However, during this time period (1980 – 1993) oil prices(inflation adjusted) fell dramatically, from around $100 in 1980 to $30 – $40 in 1993. More surprising, oil prices were on a downward trend between 1980 to 1983, a period when world oil output was on a downward trend.
How do you reconcile this with your contention that as production decreases, prices will necessarily rise?
https://www.macrotrends.net/1369/crude-oil-price-history-chart
What I think is happening and will continue to happen is that companies, investors, and lenders see better places to put their money. Drain the gas and oil industry of financing and new development slows down or stops.
When you can do anything with your cash, putting it into gas and oil may not be at the top of the list. And if the price gets high enough to make it a premium investment target, likely consumption will go down. Commodities have built in limits to how much they can grow and be profitable.
Niko,
The rise in oil prices from 1973 to 1982 (average annual increase in oil price of $8/b) from $35/b in 1973 to $100/b in 1982 (trendline) led to demand destruction as people moved to more efficient vehicles and reduced oil use for home heating and electric power. At the same time there was development of new reserves in Alaska, North Sea, GOM and Africa and generally more drilling everywhere. Output fell sharply from 1979 to 1982 leading to higher prices for a time, but reduced demand and increasing supply after 1983 led to falling prices, especially in 1986 there was a surge in oil output OPEC increased output by 2.5 Mb/d as the Iran/Iraq war came to an end. This caused a big drop in oil prices from $64/b to $33/b. There is often a lag in the response to rising or falling oil prices as in the short term one does not buy a new home or new car, but over the longer term in a high oil price environment one might switch to a natural gas boiler or heat pump or buy a more fuel efficient vehicle.
Things will be different in 2025 to 2030 from 1974 to 1985, because high oil prices are not likely to bring on much in the way of new supply, but there will be a demand response over the 2025 to 2035 period as the transition to electric and possibly natural gas transportation is likely to accelerate as oil supply becomes short.
At some point demand for oil may start to fall faster than the supply of oil, difficult to predict, but I would say 2040 to 2050.
Note that I do not mean oil would no longer be used, simply that oil prices may begin to fall as oil supply may be greater than consumption at the higher oil price level and oil prices will need to fall for supply and demand to match.
Iron Mike
You do understand what a scenario is I assume.
Any probabilities I assign are quite subjective and I would agree they have little basis except my reading of expert opinion. The confidence you ascribe to my opinions are off by 180 degrees. I often say the future is unknown, the number of possible scenarios is infinite and the odds that any future scenario is correct is zero.
If you call that high confidence, we understand the concept differently.
Dennis,
“Expert” opinion usually doesn’t mean much, well to me anyways. I am an extremely skeptical person i guess.
You might be right. Both on your prediction and your “often saying the future is unknown”. I might not visit the site enough, but as far as your particular comments that I’ve read, I’ve seldom ever seen you saying you don’t know or its too hard to predict. In my shortsightedness, all i see is your linear prediction to a highly non-linear topic.
Just so there is no misunderstand, i am mostly talking about your 2030+ predictions and projections and especially with regards to oil prices. With oil prices i am critical of your near term predictions also. Your peak oil prediction ~2025 +/- 3 years? or so is very plausible (in my humble opinion) and your charting is helpful to many on here, and I am sure they appreciate your efforts, as I do.
Iron Mike,
I too am skeptical about future oil price predictions.
To make a guess some assumption must be made.
That is all it is, an input to a model to create a “what if” scenario. If prices were such and such, what would happen. Highly likely the assumptions are incorrect as we do not know the oil price tomorrow, much less 2030 or later.
How will oil get to $150 (or whatever) if people or nations do not have enough money to pay for it?
Adam, you simply do not understand the market or the law of supply and demand. Of course, many people will not be able to afford oil at that price. But there will not be enough oil to go around. So only those few people who can afford it will get the oil.
Yes Ron, I’m as thick as a post. My comment was somewhat rhetorical – I have absorbed a bit among peak oil discussions for the last 25 years of The Oil Drum and its predecessors.
We’ve seen what $100 oil does for the function of the global economy, and it was not nice. That economy is now more fragile, the risk of large chunks of light oil production going broke at any price seems higher than ever, and a true peak of decent ordinary usable crude oil seems iminent, if not past. So an oil price spike above $100 and anywhere aiming at $150 just seems an impossible hurdle for the economy to cope with, without drastic effects.
Its komplicated. We all know that. I think too we have become somewhat battle-fatigued with all that peak-oil followers have gone through over the last couple of decades – its been a bumpy ride, and very educational for those prepared to learn as they go.
Behind it all is Hubbert’s original illustration showing oil as a 200-year blip in the otherwise miserable global energy supply available to humanity. That picture still stands, the slide down awaits. Its the timing that eludes us, and we are, I think, frustrated that The Powers That Be have not chosen to work out for us a pleasant way down.
https://peakwatch.typepad.com/.a/6a00d83452403c69e201127906eb1028a4-pi
Adam,
The GFC was not due to $100+ oil, that is a common misconception, it may have been a contributing factor, but in my view was not the main factor. The main problem was poorly regulated financial markets. The lessons of the 1930s seemed to have been forgotten by 1979 and there was a move to “free” the financial industry from “unnecessary and burdensome” regulation.
Once this was accomplished, the World economy was “free” to experience a severe financial crisis nearly matching the crisis of the early 20th century.
High oil prices are merely a footnote in that story.
The real question is – how will oil get to $150 without most nation states collapsing. And the answer is – it wont. Once nations collapse and demand dies down (literally), oil will probably dip for brief periods. It’s also very dependent on how well the finance systems maintain during these collapse periods. If money flows stop then maintaining oil production could be a factor preventing “the dips”
Twocats,
The $150/b will be less of a problem because World GDP will be higher. From Jan 2011 to June 2014 the average price of oil was over $110/b. Just the average World growth rate of World GDP (about 3% per year on average) over 10 years gets us to $148/bo.
It will simply mean that less oil is wasted driving big SUVs and pickup trucks to drive the kids to school and buy groceries. The pickup trucks will be driven by those who really need them for their work. In addition there will be more goods shipped by electric rail and plugin hybrids and EV trucks and more personal vehicles will be electrified. The higher the price of oil the quicker such a transition occurs.
Some people will choose not to drive when possible and will use public transport, car pool, etc.
The $150/b will be less of a problem because World GDP will be higher.
Dennis,
GDP counts, but not so much for the majority of world population, the part with low and very low income. With oilprices of 150 $/b the basic necessities of life, like food, get considerably more expensive. Salaries will not (have) increase(d) enough for the majority of world population under this scenario. Then there is the situation of a fragile monetary system now, and the tremendous amount of consumer debt (mortgages, student loans, car loans, credit card debts). That just doesn’t bode well for the coming oilprice increase, a type of increase that we saw 1,5 decade ago.
Imho we won’t see a gradual energy transition because of slow rising oilprices, simply because the oilprices are not going to increase slowly. Yes, the world will get 150 dollar oil. I think that after 1-2 years of 150 dollar oil, oilprices will crash because of world economic recession, and the resulting underinvestment in the oil sector could lead to rapidly increasing oilprices about five years later. It will be a roller coaster of oilprices the next two decades. That’s my prediction, or assumption.
Reading your response is like listening to a child explain a game they created or listening to a lullaby. Relaxing if not a little naive. To think that the consensus economics of 2011 – 2014 is still intact is to almost completely ignore the past 6 years. But I can’t blame you for having hope. It’s a good way to go.
Two cats,
Can you elaborate on the drastic changes from 2014 to 2019, 5 years as far as I can tell?
For World debt see
https://www.bis.org/statistics/totcredit.htm
Chart below uses data from link above for all reporting nations of the World, debt for all non-financial sectors of the economy.
Debt to GDP using market exchange rates for GDP (rather than PPP measure, which gives higher GDP estimates and lower debt to GDP ratios).
Oh and your stories also sound like fairy tales.
Note that I fully expect there will be a severe recession at some point, my guess is 2030, if my guess of 2025 for the peak proves correct (low probability that anyone can guess the peak date correctly).
Han,
Of course there may be a spike in oil prices, this cannot be predicted, when I claim prices will rise to high levels Mike Shellman thinks that is too optimistic (as far as tight oil profitability) so I tend to keep the oil price scenarios lower, generally I would agree prices will rise and may do so quickly, but eventually the higher prices result in reduced demand.
Of course this will be difficult for the poor and food prices will likely rise making life more difficult. I have no simple solution to that problem, though redistribution of wealth through stronger ability for workers to unionize to bargain for higher wages as well as higher tax rates on the wealthy so the government can support the poor are relatively obvious solutions. Social revolution is an alternative and the wealthy and powerful would be wise to consider which option they prefer.
Also consider that emerging economies are growing more rapidly than developed economies, some (India and China) at 6 to 7% per year vs 1 to 2% for more developed economies.
Generally for developed economies especially in Europe, there is a safety net in place for the poor.
Another way to consider $150 oil- its still very cheap horsepower.
Try doing the work with just human muscle,
or try it with horses.
Then you’ll know how cheap $150 oil is.
Still an incredible deal.
Can it be afforded? Perhaps not by most.
Especially when you have a system where it has allowed something like 26 people to sequester unto themselves enough wealth to equal the combined wealth the lower 1/2 of all human beings [3.9 billion people].
A related question on this- how much oil would be necessary in the world, if it was only used for important purposes? Depends how you define important, but important purposes could surely justify higher prices.
Most oil is used for relatively low value purposes. For instance, in the US the average driver could cut their costs by 50% by changing to a cheaper vehicle. The average MPG for passenger vehicles (aka light vehicles) is only 23.
Only 23MPG!
The cheapest Prius gets over 50MPG, and is one of the cheaper vehicles on the road to buy, and one of the very cheapest to own and operate.
The average new vehicle price in the US is about $34k. The cheapest Prius costs about 20k. And, again, is incredibly cheap overall.
We actually had a comment on the current non-oil post that real men drive large pickups. That’s very expensive fake virility.
“Most oil is used for relatively low value purposes”
Did you ever do any work with your body?
Grow an acre of potatoes, then tell us how low value it is.
Yeah, I’ve planted potatoes by hand. It’s hard work…
Uhmm…you’re comment sounded a bit sharp. It’s as if you thought I was disagreeing with you. And…I wasn’t – I was agreeing with you!
So, I said “most”, not all. Passenger vehicles use just under 50% of oil burned in the US. They get abysmal MPG, and only carry an average of 1.2 people – that’s a lot of SUVs and pickups carrying one person and no cargo. They’re used about 4% of the time (an hour per day), and carry less than 20% of their capacity. That means they’re about 1% utilized.
On the other hand, the oil used on the farm is a relatively small percentage of all oil consumption.
Hickory,
Here in Germany with high gas prices farmer have his tractor for all the hauling and working (they don’t use a pickup truck, they pull wagons with it when they have to transport).
When driving to town, they use a normal passenger car using much less fuel. This car has most times a trailer hitch for small transporting.
“…… I claim prices will rise to high levels Mike Shellman thinks that is too optimistic“
Dennis,
Or too pessimistic because high oilprices are no fun and won’t last long in my opinion.
“…., though redistribution of wealth through stronger ability for workers to unionize to bargain for higher wages as well as higher tax rates on the wealthy so the government can support the poor are relatively obvious solutions.”
Obvious solutions but difficult to realize. In many countries we have seen social unrest already, many of them connected with salary issues and high petrol prices. Not much has changed though
“ consider that emerging economies are growing more rapidly than developed economies, some (India and China) at 6 to 7% per year vs 1 to 2% for more developed economies.“
Those high growth percentages make it even more difficult to cope with declining world oilproduction.
A fully electric fleet is an extrapolation, but the switch from combustion engines is pretty much a done deal on the manufacturing side. Big car companies are stopping development of future combustion engines. Development cycles are slow, so you won’t see the results for years, but the last generation of combustion engines is less than a decade away.
In the mean time, there will be a piecemeal replacement of traditional tech by electrical components starting in more expensive vehicles.
Furthermore electronics will continue to reduce the influence drivers can have on performance and efficiency. The same way ABS fixes the bad side effects of slamming on the brakes, mild hybrid makes more careful use of the combustion engine.
Electronics can also do other magic tricks like allowing the navigation system to influence the suspension. Purely mechanical system are being replaced step by step by an overarching electronic architecture. The final disappearance of the combustion engine will be a footnote.
I am nowhere near as confident as you regarding the future.
I can see EVs possibly growing in number due to government subsidies or maybe carbon tax etc.
In my neck of the woods (Australia) I don’t think they will grow in number. Or if they do, it will lag heavily behind the world. The cheapest Tesla here is 2016 S70 which is $70,000 AUD not including taxes. Which is ~ $50,000 USD not including taxes. Right now it’s only for rich people who use coal power electricity to recharge them.
Correction the cheapest is the model 3 ~ $75,000 AUD including taxes.
Iron Mike.
Toyota Camry SL is $44,500, Model 3 is $72,896 (Australian dollars).
Not sure why the difference is so large in Australia (Tesla is 1.63 times the price of a Camry).
In US Tesla Model 3 is 38990 and Camry about 30130 so about 1.29 times more for Model 3 ( the Tesla is much nicer, eventually less expensive EVs will be available).
It may be that EVs will catch on later in Australia. Australia only uses about 1% of World’s oil (in 2018) according to BP Stats, so a slower transition there may be fine. Will be interesting to watch, any projections about EVs I make are clearly guesses based on a set of assumptions about growth rates in sales of EVs. You would be very wise to be skeptical of such a projection, I am as well.
My aim is to see what rates of growth are needed to accomplish such a transition.
I think research into ICE vehicles will diminish, but production of ICE vehicles can fluctuate up and down in perpetuity depending on the oil prices we are constantly debating. If oil prices are kept low despite dwindling reserves and profit margins – then there is no reason to see ICE demand dwindling to zero before 2030.
As far as conversion to electric vehicles – if cities continue to build apartment without assigned parking and charging stations, and people keep using house-sharing as a way to afford big cities, and people super-stretch their budgets just to afford a house – then electric vehicles will not make as many in-roads as you think because those with money won’t have access to reliable charging, and those with reliable charging won’t have access to money.
“2) Moores law is no longer valid as limits of size of CPUs is reached. I believe this might have implications in the future. We shall see.”
This applies for conventional computers. However, quantum computing is now leaving pure academic applications, we “only” need the counterpart to ICs. :-))
Dennis,
“There will come a time”
Ok now you are betting on your version of the future playing out as you think it will fair enough and who doesnt but still its far from certain.
“I know you think this is a pipe dream, in 1910, the same was said of ICE vehicles, especially by old guys like you and me.”
Comparing horses -> ICE transition isnt really the same thing as EV will make demand for oil to dissapear, more like mitigate and then its about speed of mitigation vs other application and global population increase or?
“We probably won’t be around to see it, in the mean time we can tell each other we are full of it. ?”
I dont know how old you are but i think you will be around to see the peak production, and with that you will also see peak demand just at another price point 😛
“I agree that right now we are probably not at peak demand”
I agree, increasing yearly demand hints at that.
“So not really peak demand, just low demand.”
My opinion about it is demand is increasing still and until we actually see 0 barrels per year increase/decrease or less we still have increasing demand, the low price is due to supply excess or the perception of supply excess and that it will last for many many years.
Just my vision of the same future, we will see i guess.
Agree demand is increasing just less than supply at present.
Baggen,
Note that nowhere did I say oil demand disappears completely. I said demand will fall faster than demand (and I should have used may or might as this is far from certain, it is merely a possibility).
land transport uses over 60% of World C+C output based on EIA data for C+C and BP data for consumption of gasoline and diesel.
My modelling for World C+C output (which does not factor in oil price except in LTO scenario) suggests World output will fall from about 87 Mb/d in 2025 to 35 Mb/d (40% of peak level) in 2077. Use of C+C for things other than diesel or gasoline has been fairly steady from 2000 to 2018 (trendline is flat for past 18 years), I assume that trend continues do that the roughly 35 Mb/d of demand for C+C tat is not either gasoline or diesel fuel remains steady from 2019 to 2077, of course this assumption will be incorrect, it is a simplifying assumption we do not know if this other oil demand will rise or fall over the next 58 years.
The main point is that some of the demand for C+C from land transport (estimated at about 52 Mb/d in 2025) might fall as the World transitions to EVs and other forms of non-oil transport over the 2025 to 2077 period.
Perhaps the scenario is far fetched, seems possible to me, perhaps better than 50/50 odds.
For those that think I am certain about the future, nothing could be further from the truth, in fact I am far less certain the many here who are certain that we are doomed.
It seems only bad outcomes are certain. 🙂
Dennis,
“Note that nowhere did I say oil demand disappears completely. I said demand will fall faster than [Supply] (and I should have used may or might as this is far from certain, it is merely a possibility).”
I dont think i claimed you did either, if i did that was not my intention.
“The main point is that some of the demand for C+C from land transport (estimated at about 52 Mb/d in 2025) might fall as the World transitions to EVs and other forms of non-oil transport over the 2025 to 2077 period.”
I agree there and that is what i tried to convey by “mitigating” perhaps its the language barrier here that i cant express myself well enough. I just believe that whatever gets mitigated by EV will be more then replaced in new demand simply by global population growth, globalization where people are mass-moved from low energy lifestyles into high energy society/consumption.
If i remember correct you believe we will have peak oil around 2025 right, or is that peak shale or peak permian only perhaps?
Anyway say its only peak permian i think most of us agrees or believe that when US tight oil peaks the world peaks or rather the world will peak a little ahead of this since it will already be in decline. So more when tight oil hits plateau or even when tight oil production increase slows down the world peaks.
So if we have tight oil peak in 2025, world should have peaked in 2024-25. I dont expect any demand reduction before those years, and by that my conclusion is peak oil will be first and as Ron so gently put it, peak demand is BS. 😀
“It seems only bad outcomes are certain. ”
Yeah and i think my vision of the future is gloomier than yours im afraid.
Baggen
Poorly stated by me,
Will should have been may.
I just have an alternative vision of how things might play out from Ron.
It is correct that just because there has been tech progress does not necessarily mean that it will continue.
Assuming that all tech progress will stop seems a leap to me.
But hey an asteroid could hit the Earth.
Dennis,
“Assuming that all tech progress will stop seems a leap to me.”
I dont know if this is directed at me? I dont think i have claimed tech progress will stop somewhere.
“But hey an asteroid could hit the Earth.”
Would that mean peak oil or peak demand? 😛
Baggen,
No the tech progress comment should have been directed to iron Mike.
World real GDP grew at an average annual rate of 2.77% from 1998 to 2018 based on IMF data. From 1998 to 2018 World C+C minus gasoline minus diesel grew on average by 3.5 kb/d each year, if that rate continued to 2077 the consumption of C+C less gasoline and diesel fuel would be only 28.93 Mb/d in 2077. Most of the growth in liquid fuel demand has come from increased gasoline and diesel consumption even with 2.77% annual real GDP growth (at market exchange rates, PPP rate is higher).
Note that this extrapolation is probably wrong, rate could be higher or lower. Probably real GDP growth will gradually slow as population growth may continue to slow down in the future, which would tend to lead to lower growth rates in oil use.
To me it makes no sense predicting oilprice for the year 2040, or even 2030. Too many variables.
Predicting oilprice (+/-10%) for the year 2040 is almost comparable with going for winning the jackpot.
Han,
It is not a prediction, it is an assumption. One cannot evaluate the economics without a price. Essentially I pick several price levels $75/b, 90/b and $110/b for a maximum 12 month average price level, these are real oil prices in constant 2017$.
Any price could be chosen, and of course we don’t know what oil prices will be in the future, this point is so obvious it is left unstated.
We don’t know precisely what oil prices will be tomorrow, but I can state with 90% confidence they will fall between $10 and $1000/bo in 2017$ for the 12 month average Brent oil price between Sept 2019 and Dec 2050.
The $75 to $110 price window for maximum 12 month average Brent oil price that I use I would guess has about a 50% probability of being correct through 2045. Beyond that I am simply assuming there will be a slow transition to alternatives to oil for land transport as expensive oil might lead to changing demand. If that is incorrect the economy would falter also likely leading to reduced demand, if neither of those scenarios is correct then oil prices may remain high forever and my output scenarios may be too conservative in that case as I assume higher prices would allow more oil to be profitably produced.
Don’t get hung up on the fact that we don’t know future prices, this is simply an assumption about future prices and we see what happens if prices were what we have assumed (it is highly unlikely that any future scenario created would be correct, probability equal to zero).
I find the whole ‘peak demand’ story bogus, it’s just a rebranding of the problem definition; from, we’re running out and we’re fucked, too, we didn’t really want it anymore anyway (cognitive dissonance much?), So, don’t worry about famine, you just need a new car. Saved by consumerism, as it were.
https://en.m.wikipedia.org/wiki/Cognitive_dissonance
Part of this derives from a concept of gentle decline. It’s not human nature to share and share alike.
Ron has had this particular item correct for years now. You cannot burn what is not produced from the ground. And we can define ground as including where we keep the SPR.
You cannot consume what you do not have.
When scarcity arrives it’s just not reasonable to expect there to be a gathering of people to agree globally to share out what exists evenly. What you will see in the media are quotes about measures being taken to share things evenly, but what you’ll see in behavior is whatever gets people re-elected, and what gets people re-elected is whatever keeps voters out of gas station queues.
Seeing gas station queues in the media in a different country does not affect someone’s re-election. So share and share alike is just a bizarre perspective to expect.
The American perspective of share and share alike would necessarily be maintain the relative ratios of consumption. The US burns 20 million barrels a day, others burn less, and if there’s scarcity then share and share alike would evolve in a sequence which starts out we get everything that we want — and then after enormous debate and argument the US in its generosity announces that it will accept a lesser amount equal to our current ratio of consumption applied to the smaller overall pie. When there is international rage about this and how it is not share and share alike, that rage will largely be ignored and a transition from everything we want to maintaining the current ratio of consumption will be talked about and will be moved towards. Slowly. With slowly defined as the rate at which voter queues at gas stations are minimized.
Other countries won’t tolerate this. Then global consumption will decline sharply in response to population decline from the wars.
It certainly seems obvious that this is the most probable scenario.
I’m sorry Ron, but my impatience is showing. Your comment “oil supply is so short, and the price of oil too high” was precisely my point. Demand all over the world was crushed (by 6 years +$100 oil). Wasn’t that clear enough? Timelines, and peak oil is a multi-year event. Not a news story. Or a simple geographic analysis.
Peter, peak oil, that is the decline of oil supply will cause the price of oil to go so high people cannot afford it. But here is the bottom line:
Peak supply will occur before peak demand. Peak demand will be a non-event because peak supply will occur well before peak demand. Therefore:
Peak demand is pure unadulterated absolute bullshit. End of story.
Ron,
Whether it is peak supply or peak demand is really a moot point in my view as supply is equal to demand so in a sense peak supply vs peak demand cannot really be determined, the peak is the peak regardless of reason. I tend to agree that at the peak oil prices are likely to be high which suggests that supply is the real problem, I doubt oil prices will be low at the peak (I will arbitrarily define low as under $90/b for Brent in 2017$).
I have heard that S.A. has maintained contractual deliveries from storage so it is not so surprising that prices haven’t moved to much this month. I am more impressed that between November 2018 and June 2019 supply decreased by about 3% and price decreased by about 15%. To me this price decrease was the result of Fed tapering.
Our latest take on how things will play out can be found here: https://www.math.univ-toulouse.fr/~schindle/articles/2019_oil_cycle_v2.pdf
Thanks for the link Schinzy. Very interesting, as usual.
“Our analysis sees a high probability of financial collapse” (p. 22).
Schinzy,
“I am more impressed that between November 2018 and June 2019 supply decreased by about 3% and price decreased by about 15%. To me this price decrease was the result of Fed tapering.”
Your analysis on price-supply works fine over longer periods but I think it would be prudent to use consumption data (perhaps seasonal adjusted) when you analyse short periods. I assume that consumption of low cost energy (oil) during a certain period of time is what matters for economic growth – not how much was produced. Nov 2018 saw pretty high overproduction and resulting inventory build, consumption has not declined – yet.
Concerning your paper: Do you think that a new oil price spike is likely in the near term?
I interpret your paper this way. Particularly figs. 4 and 6, seems to suggest that oil prices will first spike before the next financial turmoil also on p. 20 you wrote “Such an event could be set of either by a rise in interest rates or the price of oil”
“Demand all over the world was crushed (by 6 years +$100 oil).”
/Checks charts/
Sorry, but the charts don’t align with your assertion.
Right! I never noticed that. Demand was definitely not crushed by 6 years of +$100 oil. Sometimes people just make shit up in order to make their point. In doing so they just end up making themselves less credible.
But that is not the point. Peak demand, or peak supply, does not mean peak for one year or even six years. Peak oil, regardless of the cause, is the peak forever. If high prices suppress demand for a given period, that is not peak demand or peak oil. That is just a rough patch in the road.
Ron,
Whether it is peak supply or peak demand is not that important, the peak itself (regardless of cause) will be important as well as the choices we might make to mitigate the problem.
Hi Chris,
Long term, production is roughly equal to consumption. If we look at C+C output growth from mid 2004 to mid 2014, the average annual rate of growth was 405 kb/d (see chart below). The long term rate of growth for World C+C output from 1982 to June 2019 is about 800 kb/d. The rate of growth was indeed quite slow (half the normal rate from 2004 to 2014).
You seemed to have checked the wrong chart. 🙂
Dennis,
weird time frame to use…you put the Global Financial Crisis of 2008 right in the center of it.
In case you were unaware, there’s a relationship between economic expansion/retraction and oil consumption
What’s the slope from 2009 to 2014 one wonders?
By eyeballing it [(78 – 72.5)/5] it looks to be about 1.1 mbd/yr. Well above your stated average and during a time of very high oil prices.
Whenever I hear people say “this or that price oil cratered demand” I always check my charts…the *only* thing that I can correlate with a decline in consumption, ever, is a recession or (once) an embargo.
The rest is wiggly noise as the charts head upwards from left to right.
Chris,
I agree World C+C output correlates very strongly with World GDP and not very well with oil prices.
If high oil prices have an effect on output or consumption it is likely a second order effect. In most cases high oil prices result from high demand for oil and a lack of supply to meet that demand, the “reduced demand” or demand destruction is at the margins where expensive oil may reduce the less important uses of oil (heating a home to 25 C in winter or going on a “Sunday drive”.
I chose a period where the average annual oil price was about $94/bo in 2018$ (2005-2014).
Yes, I am well aware that the primary thing that affects oil demand is real GDP. However the point is to look at a high price period, regardless of GDP. I chose a 10 year period, cherry picking high growth periods (like the recovery from GFC) proves very little in my opinion.
If we wanted to eliminate the GFC and recovery we would use only 2011 to 2014 and you are correct that during this high oil price period C+C output grew at 1000 kb/d annually.
From 2015 to 2019 World C+C output growth has been slower at 649 kb/d. Part of this difference might be accounted for by stock builds and stock draws, Unfortunately consumption data depends on stock level estimates and those are not very good at the World level.
Chris,
I took a look at BP data for middle and light distillates and fuel oil (about 90 to 92%% of World C+C output).
The long term trend from 1983 to 2018 is an annual increase of 791 kb/d, from 2000 to 2015 the annual average increase was 800 kb/d (a bit higher than the 35 year average). For 2011 to 2014 (high oil prices of $117/bo in 2018$ on average) this “liquid fuel” increase was 850 kb/d over this short 4 year period. During the lower oil price period of 2015 to 2018 (average oil price in 2018$ was $57/bo) “liquid fuel” consumption rose at an average annual rate of 922 kb/d. The average annual increase in liquid fuel consumption was 929 kb/d over the 2010 to 2018 period. From 1988 to 2007 liquid fuel consumption increased at an average annual rate of 812 kb/d. Liquid fuel=light distillates+middle distillates + fuel oil. Liquid fuel consumption was about 91.7% of World C+C output from 1980 to 2018. BP Statistical Review regional oil consumption was used for the data source.
Is water still wet in your reality Pete?
Broadly –
2002 – 2007 – oil prices rise due to “peak cheap oil”. Debate – how much did that lowering of supply, and subsequent rise in prices have to do with GFC. Doesn’t really matter – supply and demand rules were in effect. (Final spike in prices was just capital fleeing in different directions – not supply/demand)
2007 – 2009 – GFC causes uncertainty and blow to demand – prices fall. S&D rules in effect.
2009 – 2014 – Golden Era of Central Bank Easing – flooded market with cheap dollars, some of which invariably speculated in oil commodity, shale, etc. This caused oil prices to rise. Yes demand was rising, but its unclear whether +$100 barrel of oil was really demand caused or just Gold Rush mentality.
2014 – 2019 – Late Era CB Easing – Without ungodly sums of free money, shale oil economics begin to clash with economic limits. Shale still producing largely at a loss, so its really unclear how the rule of Supply and Demand can be applied. If the Demand is there, but Supply is willing to Supply below cost, then there is no real test of Demand.
2019 – forward – Demand finally overtaking Supply? Even with Supply coming at a loss (on the margins, 10%?), demand has finally creeped up on Supply. We are also adding in that the business cycle itself is one of the most extended in modern financial history, and that several countries are already in various modes of recession, which could affect demand outside of supply.
So for the last 17 years, the significance of supply and demand has been present, but probably not universally significant. Oh, and no where in there is Peak Demand. that’s not a thing.
Except Iraq and UAE, everyone seems to be in steep or not-so-steep decline.
I think we can assume the loss of at least 1 mbd per year in future.
It is instructive to look at World C+C output minus US tight oil output. In the chart below I show the trailing 12 month average through June 2019 (last data point for World C+C output). Pretty much a plateau from Jan 2016 to June 2019. Average output over that period was 76145 kb/d with a TTM minimum of 75918 kb/d and a TTM maximum of 76539 kb/d.
As Ron has said before the peak in US tight oil may well coincide with the peak in World C+C output.
Great chart Dennis. While not exactly apples to apples, I have yours next to the recent one by Enno at shaleprofile for USA LTO to June 2019. They’re a great pair. It’s not hard to imagine a 12 month trailing average on USA LTO.
https://shaleprofile.com/2019/10/08/us-update-through-june-2019/
Thanks Survivalist.
Here is EIA’s estimate of US tight oil TTM average from Jan 2015 to June 2019.
US tight oil TTM average increased at an annual rate of about 1250 kb/d for the past 2 years. I expect the annual average rate of increase over the next 5 years to be roughly 500 kb/d, so considerably slower than the recent past.
Thanks Dennis. Much appreciated. It’ll be interesting to see how World C+C output minus US tight oil output does in the meantime.
Survivalist,
I expect the plateau will continue until 2025-2030. Falling tight oil output after 2023-2027 may lead to falling World c+c if my guess is roughly correct.
The above Saudi graph shows a drop of production from 9,800 kb/d to 8,500 kb/d. If the numbers are correct, this means that production in the 2nd half of September was around 7,200 kb/d. Assuming that the Saudis maintained supplies to customers at pre-attack levels and not counting Saudis asking Kuwait and UAE to step in, Saudi inventories of 180 mb must have declined by roughly 40 mb.
Maybe they are filling the empty tanks with oil only partially processed, i.e with high sulfur content.
I had shown that Ghawar oil supplied to Abqaiq has peaked anyway
1/10/2019
The Attacks on Abqaiq and Peak Oil in Ghawar
http://crudeoilpeak.info/the-attacks-on-abqaiq-and-peak-oil-in-ghawar
In the meantime, the tanker war seems to continue
https://www.aljazeera.com/ajimpact/oil-prices-jump-iranian-oil-tanker-explosions-191011065750928.html
Tanker trackers stopped reporting about Adrian Darya off loading oil to the Baniyas refinery in Syria
Seems number of active riggs in Permian is increasing again, I believe this is mostly Exxon ramping up. Would be interesting to see a report related to the majours like Exxon now investing heavey in shale. Are they doing better than the average related to profit each foot latheral drilled, produced and how much in persentage if any.. I believe it should be possible to have some data after 6 months and indication after 3 months as decline courves , wellcost and oil price forcast is relative known. I guess also Quarterly reports from Exxon will be interesting as it will show profit of production guess to drill a well is an investment djuring lifetime in production that is funded with profit in bank after tax or borrowed money and only depressation will be written in the income budget the rest remain in the ballance . Perhaps one way if known how many foot wells Exxon produce in Permian there could be estimated how much they sit back with each foot average producing before capital cost , depreation and Compare this with other Shale Companies there. This is important because EIA ,Rystad have stated that companies like Exxon will invest heavey in US shale espesial Permian and this will add millions off profittable barrels anual. What if they fails , decline rate ruin their dreams , stock holders sells and Exxon will be transfered to a sinking ship. In that case there will be shortage of oil that will increase oil price before resession in world economy for decades.
Rystad’s 2019 global exploration update through 3 quarters was recently released – showing discoveries totaling 7.7 BBOE, with a year end projection of about 10 BBOE, which is in line with 2018. 58% gas/42% liquids. This equates to resource replacement of about 15% from conventional discoveries.
GOM’s biggest discovery was Blacktip – in the subsalt part of the Perdido Fold Belt in the western gulf.
Biggest oil discoveries world wide were from multiple Exxon wells offshore Guyana – totaling a little over 1 BBO.
In my opinion, 2 places with good hopes for future offshore oil projects are Mexico and Brazil.
Chevron and Shell just inked a 3 lease deal offshore Mexico – where Chevron will partner with Shell on some of the leases they picked up a few years ago. These are mostly an extension of the Perdido fold belt into Mexico waters.
A lot of interest in offshore Brazil where in a November-2019 auction numerous leases will be made available to industry. These are leases where discoveries have already been made, so the exploration risk is eliminated. Total lease bonus amounts are expected to be over $20 billion. (I’m a bit confused about some of this – I thought this auction was in November, but I’m seeing reports that some of the leases have already been awarded, but, those may be a separate sale for pure exploration blocks?? Regardless, a lot of interest and activity in this area)
The northern GOM still has a lot of significant projects in the queue for first oil in the next 2-5 years or so. These include Mad Dog 2, Vito, Anchor, Ballymore, Whale,, and a number of smaller projects that will probably get developed. The Wilcox trend, from an exploration standpoint, is already quite mature. Maybe more in the east central Gulf associated with the Norphlet, and, maybe untested Mesozoic targets (deepwater Tuscaloosa is a good example).
Link to Rystad article referenced above, from Offshore Magazine.
https://www.offshore-mag.com/drilling-completion/article/14068341/oil-and-gas-resource-replacement-ratio-lowest-in-decades-rystad-energy-report-finds
SouthLaGeo,
You had mentioned before that GOM should getto about 2Mb/d in late 2019(I think). Do you have a rough guess on output in 2020? Does the EIA’s STEO for GOM output seem in the right ballpark to you?
Thanks.
Dennis,
There are a lot of strong, legacy assets where production, as a whole, has been flat since about a year ago. (At that time, starting in July-2018, GOM seemed to take a step change in production from about 1.6-1.8 to 1.75-1.95 mmbopd). These assets include Atlantis, Thunderhorse, Mad Dog, Perdido/Great White, Jack/St.Malo, Tahiti/CaesarTonga, Mars/Ursa/Olympus, Shenzi. These fields account for about 1/2 of GOM production. These assets have spun off a lot of new projects, and it’s these new projects that are helping maintain GOM production. Thunderhorse, I believe, has at least one more new project in the queue, as well as Mad Dog (Mad Dog 2), St Malo waterflood, Atlantis also has at least one more, It’s too early to know if Appomattox is going to achieve it’s 150 kbopd+ or not,, but, assuming it does, then, I think a couple things can be predicted about GOM production. I think it could stay at least at or above 1.8 mmbopd until as late as 2025 or so.
I believe, in the short term, say between now and the end of 2019, we could see a month or two where production exceeds 2 mmbopd. Through 7 months in 2019, GOM has averaged about 1.84. And I do think this trend could continue through 2020. In a most likely scenario, I could see both 2019 and 2020 averaging about 1.9 mmbopd.
Without spending the time looking at more specifics, this is about as far as I’m willing to go . Our old friend George Kaplan was better at this kind of thing than me! I’m OK at talking about the geology, but George, and a lot of the other contributors to this site, including you, Dennis, are better at making informed projections.
SouthLAGeo,
Thanks for the kind words. George was much better than me for sure, and so are you especially for GOM, but probably in general as well, you are too humble.
Thanks for the insights I am sure I am not alone in thinking that every time I read one of your comments I learn something important.
https://www.theguardian.com/environment/2019/oct/10/oil-firms-barrels-markets
Guardian talking of supply glut…
This article seems to almost ignore the issue of natural decline. Assuming a conservative decline rate of 1%, that is roughly, 1Mb/d/yr.
7 Mb/d in 10 years is an addition of 0.7Mb/d/yr, a replacement shortage of 0.3 Mb/d/yr. This, IMHO, is saying supply shortage, not glut, and we haven’t even added increasing demand.
Can anyone confirm or provide a more realistic number for a world wide natural decline rate. Saudi Aramco says that natural decline in Ghawar is 2%/yr.
Hi Ovi,
Just posted as interesting to see what mainstream media is saying.
No talk of what would happen in oil shortage scenario, (i.e. potential famine due to supply chain disruption), entirely focused on carbon/ climate.
Ovi can you define natural decline?
Dennis
When I used the words “Natural Decline”, I was thinking of what is happening in Ghawar and did not want to get into the weeds of 8 and 2 and was explained in a report published in 2006, as noted by Ron.
I would define natural decline rate as that associated with the drop in pressure associated with the depletion of the reservoir, assuming no water injection. The pressure drop is strongly linked with the size of the field and with the rate of extraction. The difference in decline rates associated with large and small fields is best exemplified by what is happening in Ghawar and the Permian.
Ovi,
The term means different things to different authors, so I was trying to zero in on what you meant.
Most well decline is hyperbolic a d the rate of decline changes with time. For a field the rate of decline of the field will depend on the rate of development of the field which varies from field to field.
When people have looked at production weighted averages for declining fields for the World it is usually 5 to 6%.
Whether this coincides with natural decline is another matter as most large fields have had secondary or tertiary recovery methods applied.
Natural decline would probably be higher as you define it, perhaps 7 or 8%, a petroleum engineer might have a better guess.
Ghawar has seen water flood and lots of other fancy tech for many decades.
Saudi Aramco says that natural decline in Ghawar is 2%/yr.
No, they say they have a natural decline rate of 8%.
They said, in 2006, that with their massive infill drilling program, they had gotten their decline rate down from a hypothetical 8% to almost 2%. Understand however, that is not a natural decline rate. They had a natural decline rate of 5% to 12% with their old vertical wells. (An average of 8%). However, with massive infill drilling with horizontal wells, skimming the top of the reservoir, they had gotten the decline rate to almost 2%.
So a natural decline rate with vertical wells, for Saudi fields, was 8%. The unnatural decline rate with horizontal wells is now 2%. But what they don’t tell you, and perhaps they do not understand, is that by decreasing their decline rate they have greatly increased their depletion rate. That will, sooner or later, bring about a Seneca Cliff in their oil production.
Note: In their reports, Saudi uses the terms “decline rate” and “depletion rate” as if they were interchangeable. They say they have gotten their depletion rate down to 2%. Obviously someone doesn’t understand the difference.
Check it out–From 2006. Bold mine.
Saudi Oil Field Depletion Rates
• The Kingdom’s average state of reserve depletion for all its fields is approximately 29%.
• The oldest field, Abqaiq, is 74% depleted, and the world’s largest field, Ghawar, has produced just under 50% of its reserves. By contrast, Shaybah, one of the Kingdom’s youngest fields, has 95% of its proven reserves remaining.
• Without “maintain potential” drilling to make up for production, Saudi oil fields would have a natural decline rate of a hypothetical 8%. As Saudi Aramco has an extensive drilling program with a budget running in the billions of dollars, this decline is mitigated to a number close to 2%.
• These depletion rates are well below industry averages, due primarily to enhanced recovery technologies and successful “maintain potential” drilling operations.
“They say they have gotten their depletion rate down to 2%. ”
It’s hard to believe they would not know the difference. Is this possibly just a bad translation or a wording error?
Its the KSA—-
Reality only gets in the way.
It’s hard to believe they would not know the difference. Is this possibly just a bad translation or a wording error?
No, neither is possible. The author of this bit of information obviously spoke perfect English. He simply thought the two words meant the same thing. Here is the “about the author” at the bottom of the article. Except for the name, bold mine.
Nawaf Obaid
Managing Director
Nawaf Obaid is currently the Managing Director of the Saudi National Security Assessment Project, a government consultancy based in Riyadh. He is also the private Security & Energy Advisor to HRH Prince Turki Al Faisal, the Saudi Ambassador to the US.
He is the author of The Oil Kingdom at 100: Petroleum Policymaking in Saudi Arabia (Washington Institute for Near East Policy, 2000). He is also an Adjunct Fellow in the Office of the Arleigh Burke Chair in Strategy at the Center for Strategic & International Studies (CSI) in Washington DC where co-authored with, Anthony Cordesman, National Security in Saudi Arabia: Threats, Responses, and Challenges (Praeger & CSIS Publications, September 30, 2005).
He has a BSFS from Georgetown University’s School of Foreign Service, an MA in Public Policy from Harvard University’s Kennedy School of Government, and completed doctoral courses at the Massachusetts Institute of Technology’s Security Studies Program.
Good discussion of depletion rate in paper below
https://royalsocietypublishing.org/doi/pdf/10.1098/rsta.2012.0448
For Saudi Arabia if we use 300 Gb for their URR and 10 Mb/d for output then the depletion rate for their URR would be 3.65/300=1.2%, if we do the calculation in terms of remaining reserves it would be about 2.4% where remaining reserves are about 150 Gb at the end of 2018.
I think decline rates are less confusing as people forget to specify whether they are using URR or RR for the denominator for a depletion rate.
I often use the term extraction rate which is related to the depletion rate but uses producing reserves in the denominator.
For the Saudi case, let’s assume that 50% of their remaining reserves are developed producing reserves (a guess on my part as I do not have this information). If output was 3.65 Gb in 2018 and at the beginning of 2018 the producing reserves were 75 Gb, the extraction rate would be 3.65/75=4.87%.
Based on the information in the presentation Saudi fields were 29% depleted at the end of 2005, cumulative production was 108 Gb, so the implied URR was 108/0.29=372 Gb, with remaining reserves(RR) of 372-108=264 Gb so in 2006 the depletion rate for RR would have been 3.34/264=1.26%. In 2017 RR=222 Gb and 2018 depletion rate from RR would be 3.8/222=1.7%.
If you look at the charts provided by Ron, of Saudi Arabia, Venezuela, and Iran,
you can see a common thread- significant dropoff in production that is not based on
geologic depletion or weak demand.
Rather it is due to human policy factors, such as military activity, trade sanctions, and failed state/poor management status.
These factors have taken about 4.6 Mbpd out of production (Iran 1.6, Saudi 1.3, Venez 1.7). That is roughly equivalent to the entire production of Iraq- no small potato.
Libya certainly served as another example of this kind of disruption over the past decade.
My guess is that human factors will only serve to bring about peak production much more quickly than forecasts derived from geology based URR capabilities. Certain countries will have seneca cliff patterns due to failed state status/war, and this may severely disrupt the amount of oil available to importing countries.
Below are the 15 countries that imported the highest dollar value worth of crude oil during 2018.
China: US$239.2 billion
United States: $163.1 billion
India: $114.5 billion
Japan: $80.6 billion
South Korea: $80.4 billion
Netherlands: $48.8 billion
Germany: $45.1 billion
Spain: $34.2 billion
Italy: $32.6 billion
France: $28.5 billion
Thailand: $28.4 billion
Singapore: $28 billion
United Kingdom: $26 billion
Taiwan: $23.4 billion
Belgium: $19.5 billion
Of these countries, the USA is most capable of losing oil importation I suspect [USA net imports of oil consumption is 11% of total as of 2018- eia], as long as LTO production holds up.
The rest are all highly vulnerable.
Hickory,
Of your big 3 only Venezuela is likely to be a long term problem, other nations may see such drops in output on a temporary basis. A change in policy by the US would bring Iranian output back online in short order, KSA output may have already come back online (unless there is another attack).
All of these potential disruptive events are not likely to happen simultaneously throughout the World in my opinion.
If I am wrong, then oil prices rise because supply is short and nations reduce consumption due to high oil prices.
That seems true to me, but these kinds of disruptions are a major source of error in predictions of supply, and they can be completely unexpected and sudden- Libya 2011-2014, for example.
The big wild card in all this is the Gulf. I place no bets on stability in that region.
Hickory,
I agree, definitely impossible to predict these disruptions. If we see a major war between Iran and Saudi Arabia, the World will be short of oil supply and we would see $150/bo or more for Brent in short order.
It would not be pretty, the World would be in chaos no doubt.
FED restarted QE the day after i last posted here. Out of nowhere with no warning or build up or talk. This changes the whole outlook for price of oil. It’s $60 billion a month. Not far from the $75 billion when QE was at it peak. Regardless of the details their back expanding the balance sheet.
It’s going to support oil price. It’s going to support US equity markets as well. Combine that with enough on US/China trade to keep market happy and possible deal on Brexit. Bottom just might be in for the price of oil with Brent actually reaching it’s long-term supporting trendline and WTI hoovering a few dollars above it’s supporting trendline. The price action on Brent chart suggest trendline will hold. And if that is the case WTI will never reach it’s supporting trendline.
Dollar is going to roll over here. How much depends on FED. But this will be a broad base risk on move. Stocks up, oil up, US treasuries at least the long end of it will steepen somewhat. Yen crosses have all put a turn in as the Yen will weaken in a risk on move. Which will also crush those who ran to gold and silver. Safe haven trades that worked so well leading into the trade war and Brexit won’t be working so well anymore.
Things went from a world stacked against the price of oil to stacked in it’s favor in a matter of 2-3 days.
This is why it is impossible to forecast the price of oil, I have been following the oil market for 20 years, the best you can do is stick to a low cost producer and ride the cycle through them, they’ll make money in the ok years, breakeven in the bad years and make a ton in the good years.
Folks really should be aware QE did restart this week. That was off the mainstream radar screen.
Powell announced that asset purchases by the Fed of bonds were now taking place at $60B/mo. He further announced that this was not QE. This was a measure taken to address technicalities in unbalance in the repo market. Y’all can go look up what that means, or you can go dig into the QE wiki and find this:
— QE is not monetization of debt. It is monetary stimulus injected when interest rates are so low that lowering them further would have no stimulative effect [note this was written before negative rates became common]. So whereas monetizing debt (using a central bank to finance a deficit) involves the central bank buying government bonds, QE is the central bank buying government bonds while saying they are stimulating, not financing a deficit. —
In other words . . . it’s in other words. The action is identical. You just say it is something different.
Look familiar? The action taken by a CB for monetizing debt, quantitative ease or addressing Repo imbalance is exactly the same. You define the identical action with a claim, to embrace whatever definition might be least embarrassing at that time.
“The action taken by a CB for monetizing debt, quantitative ease or addressing Repo imbalance is exactly the same. ”
This really isn’t true, as much as the recent move is eyebrow raising. Buying bonds to finance the debt is a different animal from buying MBS to shore up the housing market is a different animal from buying short term treasuries held at member banks.
Absent obvious cuts, outages and short-term boosting, did Russia effectively peak in 2016 at 11.2-11.3m? That production is all *heavily* supported with infill drilling and EOR, they don’t have big new fields or even discovery prospects (Arctic anything will take a decade to bring online). And they were forecast to have peaked in the middle of this decade, including by domestic forecasts.
Norway’s Huge New Oil Project Clashes With Growing Focus on Climate
Sverdrup, discovered in 2010, in an area that had been disregarded by most explorers, the site started production on Saturday and is set to reach 440,000 barrels a day by next summer. That represents a 33% addition to Norway’s crude output in the first half of this year, a hike not seen since the 1980s.
https://www.bloomberg.com/news/articles/2019-10-07/norway-s-huge-new-oil-project-clashes-with-growing-climate-focus?srnd=climate-changed
Hi,
I’ve been following this arguement now since 1997 and I have to say I agree with Gail Tververg from our finite world that the models used to predict peak oil were far too simplistic…. the EIA 2019 report published a few weeks ago clearly shows a massive increase in oil production in the USA over the last number of years from approx 5mbd to over 12mbd … if this technology and methods can be used in all the other oil production regions the peak of global production is beyond a decade away.
Meaning , humanity has enough oil, gas and coal available for production and burning to literally cook the world. Peak oil will not arrive in any meaningful timeframe to avoid the worst case scenario in the IPCC reports.
We are going to have to choose to shrink the global economy and reduce emissions.
I give us a 5% chance of that happening….. why? Because fossil fuels are required to power the system that produces the renewable energy infrastructure. The mining, transport, refining, manufacturing, distribution, selling, installation and maintenance all depend on oil at every level…. there is no substitute even on the drawing boards!!
cheers
We are going to have to choose to shrink the global economy and reduce emissions.
You’re telling 7.7 billion people what they must do. They ain’t listening.
We are going to have to choose to shrink the global economy and reduce emissions. . . .
Response:They ain’t listening.
How about:
The economy will shrink. Emissions will be reduced.
The economy will shrink. Emissions will be reduced.
But of course the economy will shrink. And of course emissions will be reduced. The decline in world oil production will have a dramatic effect on both. And I must add, the shrinking economy will be extremely painful. It will be a never-ending great depression. A depression that gets worse every year. And hungry people are angry people. They will lash out at those whom they hold responsible, that is whoever is in power.
It will get nasty, real nasty.
But apparently they will still buy EV’s and motor about as normal. So say some on this site.
I don’t get it.
R Stone,
There are differing opinions. Some think EVs will make no difference and they are very certain they are correct. Others are certain EVs will allow the World to transition away from oil as a land transport fuel.
I am certain of nothing, perhaps EVs will help a bit, but it is far from certain that this will occur. With proper policy it seems feasible to me, but proper policy is rarely followed, so maybe a 50/50 chance a transition from oil to other forms of land transport (electric, natural gas, and biofuels perhaps) might be accomplished.
Hi Dennis,
I know there are different opinions about the future and that is fine, we shall see.
What I do not understand, but would like to, is how we transition, the theory is easy. Where will people get the money as the economy contracts. I am with Ron on this. After peak the economy will contract. Energy is the ability to do work. Less energy – less work. EV’s do not really solve anything. They still need to be made, bought and powered and that requires a functioning economy and political system. Good luck with that.
R Stone,
I know that many are convinced that a transition to less oil use is not possible, I just do not agree based on my expectation of future oil output. Cars and trucks get replaced every day, that is simply an ongoing feature of a dynamic economy. ICEVs simply get replaced by EVs gradually over time and less and less oil is required. As oil prices rise and people become aware that the peak in oil output is permanent, the process likely accelerates and over a 5 year period the sales of ICEVs may fall quite rapidly.
As the EV industry ramps up there will be economies of scale and innovation that will reduce the cost of EVs so that by 2025 the ICEV may no longer be competitive on a TCO (total cost of Ownership) basis.
Also note that Exergy per unit of primary for many non-fossil fuel types of energy is much higher as there are fewer thermal losses, average thermal power plants waste about 60% of the primary energy burned as waste heat, for an ICE vehicle (non-hybrid) typically 70% of the energy content of the fuel is waste heat.
So an economy running on wind, solar, hydro, and electric transport would require far less energy (50% to 60% less) than the economy of today.
Will this happen? Nobody knows.
Is it possible?
From a physical perspective, yes.
Will it be a smooth and easy transition?
Highly unlikely in my view.
R Stone,
In the USA ‘after peak’ doesn’t mean oil or Nat Gas will just disappear one year. There will be a rough plateau and then decline. This will play out over a long enough period that considerable adaptation will occur, unless we get into some sort of abrupt failed state situation.
Critical uses of oil for industry, manufacturing, and agriculture isn’t about to go away one day. If we had an energy policy, those uses would be prioritized.
Light vehicle transport could be transitioned from petrol to primarily electric over a decade. I’ve no doubt we could do that if it was a priority, even without any further innovation [ex- I have a plugin hybrid van, and about 70% miles is on solar electric and 30% on petrol. Made in the usa vehicle. It was easy to get, and rides better than any vehicle I’ve had before. I can put a sheet of plywood laying down in back if I choose].
We could save about 10% of vehicle consumption just by slowing down to 60 mph. We don’t need to fly around so much. Many trips people take are frivolous. There are many ways to keep up a quality of life without using so much energy.
Those are ideas are short term. Longer term its tougher. I think we will need a combination of population (demand) downsizing, and build out as much domestic renewable energy production as we can muster. There really is a lot of nat gas, solar, and wind energy available on this continent.
My first reaction on reading this was to think looking from afar I thought the US was already a failed state, certainly a mad house.
Your van sounds great, can I have one. Our one car is 14 years old and on its way out. It will be replaced by a 10 year old car. Some people just do not have the money. I know about TCO but if its all you can afford at the time hard luck.
On flying, yes we are entertaining ourselves to death.
“I thought the US was already a failed state, certainly a mad house.”
yeh, good point.
Certainly a country without any energy policy.
The point about the US being a failed state is along my thinking. I think recession/depression will put a damper on consumption before the oil runs out.
There are so many pitfalls in the global economy now that I don’t think access to more oil is going to fix those.
Scenario for World C+C, the scenario reaches 30 Mb/d by 2084, assuming there is demand for the oil supplied. sorry for small chart, click on it for larger view.
R Stone
A very good documentary made about 12 years ago called A Crude Awakening. Highlighted what needed to be done at least 20 years before peak in order for the world economy not to be impacted.
Electric cars and trucks powered by wind and solar, hydrogen powered ships and airplanes are all possible. However the research and development has received only a fraction of what was needed over the last 20 years.
So we will come to peak oil and not have the alternatives in anything like the scale needed.
This will result in factories and businesses closing and millions out of work.
Hugo,
In 2007, some in the peak oil community believed that World C+C URR was about 2500 Gb, with many predicting far less (2000 Gb was a common estimate in 2005.)
It is pretty clear that World C+C URR will be at least 2800 Gb and Jean Laherrere’s mean estimate is about 3000 Gb as of 2018. My medium scenario is pretty close to that 3000 Gb at 3100 Gb, with C+C resources at that level there will be enough oil to allow a gradual transition to EVs over the 2020 to 2040 time period, rising oil prices after the peak may speed the transition along with falling costs for EVs as production ramps up and economies of scale reduce production costs for batteries and electric motors and other components.
The wind and solar will be used to replace coal and natural gas, coal may have already peaked as demand may have fallen below supply and natural gas will likely peak in output in 2035 and again rising natural gas prices and falling cost for wind and solar is likely to increase the rate of development (in GW installed per year, a better metric than dollars spent) of wind and solar power.
J- ” … if this technology and methods can be used in all the other oil production regions”
Well, its possible, but far from a factor you should hinge your whole argument upon.
The most likely candidates for significant LTO production outside N America include China, Argentina and Russia. It will take a decade to get much sense of their prospects. Of these, China has the most incentive, and strength of purpose.
I wouldn’t suggest holding your breathe while you wait for results.
While geology has a lot to do with the success of tight oil, let’s not forget human factors and the financial environment.
In the US you had, American ingenuity, expertise, zero interest rates, aggressive financiers and investors, and land owners with mineral rights.
Where else are you going to find this combo.
Ovi,
I doubt it will be found anywhere, but the Chinese may be the most likely if their geology is appropriate. My guess is the rest of the World will produce very little tight oil, perhaps 50 Gb, 100 Gb at most in my view. The EIA’s 500 Gb estimate for tight oil output from nations outside the US is ridiculous in my opinion. Even my 50 Gb estimate may well be too optimistic.
Dennis
Thanks for your reply above. The point of the documentary was not so much URR but the preparation time before peak, in order to avoid serious energy constraints.
If the UK car fleet was only electric it would require 16,000 extra wind turbines.
https://wattsupwiththat.com/2017/10/30/16000-additional-wind-turbines-required-to-power-british-electric-car-fleet/
Considering we only have 9,000 that is quite a challenge.
The situation is in fact far worse than that. Studies of wind power have shown that there are over 50 occasions during the year that wind power over a full 3 day period is less than 20% of capacity. Many of those occasions are during winter when solar power is very weak and limited to 5 hours. The German website is a suitable comparison.
https://www.energy-charts.de/power.htm?source=all-sources&year=2019&week=4
If you look at week 4 of 2019, this is a classic case of little wind and practically no solar.
You would have millions of cars with flat batteries and where would homes, factories and hospitals get their power?
That is why the PHD engineers who are working on things like batteries, hydrogen etc said an all out effort for 20 years was required.
If you see the energy shortfall in week 4 you will see the vast problem we face.
Do we really have any time left?
https://www.bbc.co.uk/news/science-environment-49483580
Hugo,
Energy can be imported, including electricity, there is likely to be enough natural gas to fill in the occasional low output periods, for quite a while as energy demand for fossil fuel falls. Other fuel sources such as ammonia or hydrogen can be produced during high wind periods and stored for backup. Plenty of time to figure this out.
Dennis
Your response shows that you have not done even the most basic calculations of how to move from a global economy driven by coal, oil and gas, to one powered by wind and solar.
As and example Germany installed solar and wind is more than 130% of the maximum consumption. Yet it only produces 33% of consumption and in 10 weeks that figure is just 5%.
When wind is low in Germany it is low in Holland, France and Poland and there is no where to import it from
Hugo,
Really one has to look at all of Europe and all sources Wi d solatlr and hydro.
Also you fail to account for producing hydrogen or ammonia from excess output during high wind and solar periods.
I think it is you who have failed to research what is possible.
See research by Marc z jacobsen
J, It is funny that you start the first paragraph by mentioning Gail’s work, as what you going on to say is just about the opposite of what she thinks. She may think peak oil has been poorly estimated or given too much importance, but she definitely thinks affordable energy resources and overshoot in general, especially economic overshoot, will mean the IPCC is way off. She is not as concerned about global warming as you suggest.
America’s Great Shale Oil Boom Is Nearly Over
Ron,
tight oil will grow more slowly, but will continue to grow, the following scenario assumes the completion rate in the Permian basin gradually increases from 500 new wells per month to 725 new wells per month over the next 6 years (note that the Permian completion rate increased from 25o new wells per month to 500 new wells per month over the previous 2 years so roughly a 125 well annual increase from 2017 to 2019 vs a 38 well average annual increase in this scenario.
peak for TTM average is 10 Mb/d in 2025.
Dennis, those prior two years have been conducted at a loss and is actively slowing down, not accelerating. Drilling in the Permian is down 11% in the Bloomberg piece.
It doesn’t follow there will be more new wells per month. Nevermind questions of Tier of acerage or drilling for actual profit if it is conducted by a supermajor instead of someone trying to service junk debt.
Propoly, so far Permian output has continued to increase through Aug 2019, eventually oil prices may rise and when they do the completion rate may increase.
Note that most of the increase in US tight oil output will come from the Permian.
Permian output increases from 3.7 Mb/d in Aug 2019 to 6.7 Mb/d in 2025.
In the most recent week reported, Permian Horizontal oil rigs increased by 1.8% from previous week.
As Ron has suggested, trends can change, I agree.
Dennis, trend lines are the tools of technical analysis. Technical analysis is bullshit. Trend lines continue until they don’t. And predicting when they don’t is impossible. But they never continue forever.
Ron,
That is not a trendline it is a scenario based on an assumption about future oil prices and how it might affect completion rates.
i assumed the trend changed from an annual increase in completion rate of 125 new wells per month to 38 new wells per month, more than a factor of 3 different. I have assumed a change in trend.
I have suggested that the trend in the completion rate will change. My guess is that oil prices will rise over time, though clearly we do not know their precise future path, the scenario for prices is conservative as is the increase in completion rate, at a far lower rate than the past 2 years.
An alternative scenario with no increase in completion rate seems unlikely to me.
Chart below is for the Permian scenario above it has completion rate (trailing twelve month average or TTMA) on left axis and Oil Price on right axis. In my opinion the oil price is likely to be at least as high as this scenario.
Also don’t forget the new pipeline capacity that will reduce transport costs and increase profits, I have not accounted for this in my model for the Permian.
There is a lot of technical analysis out there that is bullshit. In fact it’s meant to mislead those that are viewing it. Fake charts are done up to reflect a reality that isn’t really real. Some so called reputable sources aren’t really reputable at all.
I see trendlines on charts posted in investment articles all the time that aren’t really real. Fake charts on doom sites like Zero Hedge are very common. They support the narrative that is being pushed. They don’t even come close to matching what i’m seeing in real time on multiple trading platforms.
There is a very large broadening wage or megaphone pattern sitting on top of the Dow,S&p500 and Nasdaq. That don’t mean shit. Price is fairly close to the upper bounds of this megaphone pattern. and you have people pimping a short stocks here.
Well Yen crosses which are all major currency pairs against the Yen aren’t pointing to a major sell off in US equities. They are saying the exact opposite.
FED expanding the balance sheet negates technicals. WTI and Brent are headed higher from here.
HHH, I am not going to argue with you about technical analysis. It cannot be proved either way. However, there is no evidence whatsoever that it works. There is no evidence that it predicts the future price or supply direction of any equity, commodity or index. It is just mumbo-jumbo.
The best thing that can be said about it is: It works, on average, 50% of the time.
There’s a quote mark mixed in with the end of the link address, breaking it.
Not sure how the article concludes that significantly less aggressive capex in not as good rock is going to get anything other than decline. Longer tail in new stuff or not, all the current stuff still has to be replaced to maintain production levels. Maybe they are trying to say a decline and just using too many words.
The supermajors also have no incentive to conduct burst development and production at a loss. Much longer time horizons, can internally finance, have dividends to pay to institutional owners.
What’s going to happen first though is a wave of bankruptcies and fire sales. The big boys want the decent land, not the unprofitable corporate structures, dried up holes and environmental liabilities.
Thanks, ProPoly. I fixed it. The link works now. But here it is again:
America’s Great Shale Oil Boom Is Nearly Over
Try this link. It works.
https://www.bnnbloomberg.ca/america-s-great-shale-oil-boom-is-nearly-over-1.1330954
Syria and turkey face oil. Should Iran shoot up Saudi again peak oil is done. As about 40% is autos carpooling and telecommuting works. 20% is agriculture food to your table, probably no cuts.
Russian shale info
Tight oil projects, including the Bazhenov, Abalak, Khadum, Domanik Suites among others, are exempted for 15 years from paying the mineral extraction tax.
Do a search for that text to get the link. For whatever reason, links sometimes prevent me posting. Which is weird. It’s a .ru link but oilprice.com picked it up. 2017.
Operative item in this, a blurb that said those reserves are positioned UNDER already producing, or produced, Siberia fields. The production infrastructure is already in place (this is a pretty big deal, recall Bakken early days and all the trucks).
Other blurbs — the area is the size of Ethiopia. Numbers 20 billion tons. Which looks like 140 B barrels.
Porosity or whatever 16-17%. The layer thickness is 40 meters and the surface area . . . Ethiopia.
Gazpromneft and these guys Surgutneftegaz . . . seem to be intense.
Surprising we missed this 2 yrs ago.
Russia is going to win, btw.
“Russia is going to win, btw.”
They are one of the few countries in the world that could actually benefit from a warming climate. The risk to them on that is episodes of drought in their crop growing areas. Muddy permafrost is difficult to work on (road building for example) as well. But on balance, they have many advantages.
How much tight oil has Russia produced so far?
These Russians don’t expect much LTO production outside the USA-
https://www.eriras.ru/files/global_prospects_of_unconventional_oil_in_the_turb.pdf
Watcher,
Fernando Leanme would be a good go-to on this.
Gaspromneft is doing something in the Irkutsk region. This is not part of the list above. They’re talking about 10 stage fracking achieving 120 tons per day production. A second well was picked up with a reporter calling it 250,000 barrels per day which is pretty much impossible for shale. Note that 120 tons per day is in the right ballpark for a shale well.
The way it is phrased is that the second well confirmed that the seismic studies and technology that they used to choose their positioning had been vindicated and this methodology will be used elsewhere. The date is July of last year and discussion of the second well was in a different article which people can track down if they care.
https://www.gazprom-neft.com/press-center/news/1790158/
IEA OMR was released and as usual it is hoping that in “2020, when non-OPEC supply growth, led by the US, Brazil and Norway, accelerates from 1.8 mb/d to 2.2 mb/d, reducing the call on OPEC to 29 mb/d.”
Brazil and Norway are both offshore with big production decline rates. US shale oil has even bigger decline rates. I don’t believe that US, Brazil and Norway will increase production by 2.2 mbd in 2020 compared to 2019. Maybe 1 mbd.
https://www.iea.org/oilmarketreport/
This is IEA OMR total liquids forecast, 100 mbd in 3Q2019 and continues optimistically upward, every quarter, until reaching almost 103 mbd in 4Q2020. Nah, not gonna happen.
Heavy drop predicted in demand between Q4 2019 and Q1 2018… It’s usually not that high.
Tony,
I like your estimate, sounds roughly correct for C+C, the all liquids forecasts include NGL which is of little interest to me. I would say 500 kb/d from US and 250 kb/d each from Norway and Brazil might be about right for 2020 increase above 2019 levels. It will be interesting to see what OPEC chooses to do, I assume they will continue to keep output down to try and support oil prices. If I am wrong and they increase output to gain market share we may see lower US output than the 500 kb/d increase I am guessing at as oil prices would fall and completion rates may fall in response leading to flat or even decreasing tight oil output. A major war in the Middle east would have the opposite effect, high oil prices and perhaps higher tight oil output than I have guessed.
Woodmac forecasts US shale oil up about 500 kbd.
“S&P Global Platts Analytics said that 2020 production is likely to expand at 1.1 MMbbl, while Wood Mackenzie estimates growth at roughly half that level.”
https://www.worldoil.com/news/2019/10/14/is-peak-output-around-the-corner-for-us-shale-drillers
Tony,
A bunch of different estimates were quoted in that piece ranging for 550 kb/d to 1300 kb/d, I saw 550, 650, 1100 and 1300 kb/d estimates mentioned for 2020, the average of those 4 estimates is 900 kb/d, perhaps it might be as high as 700 kb/d if prices rise to $70/b for Brent, at current price levels or lower ($60/bo or less for Brent) even 500 kb/d might be a stretch.
Peak oil will occur because of declining quality of oil reserves, not because of too litte oil reserves. The declining quality of oil reserves will manifest itself by oil price lower, than what is needed to increase supply. Maybe it has already happened.
I am 100% with u on this . I have earlier ranted that most or all most all of shale oil which is plus 45 API and the new oil coming out of Permian is even 50 API is not oil . Add to this the bull shit of bio uels, NGL ,NGPL (call it what you may ) and the must stupid refinery gains to give a grand figure of about 90 Mopd is bollocks . What matters is the black goo and that is stuck at about 75-76 Mopd give or take a few . Problem is that this is on a plateau since 2005 ,in the meanwhile the quality of the black goo has deteriorated . I am looking to a day when a refiner calls in to say that he cannot get the grade of oil required for his operations . Then TSHTF .
So what you are saying is that the LTO claimed to be 45 API is not actually 45 and likely higher? That everything is trending toward shorter chain hydrocarbons notwithstanding claims?
Correct . It is inching more and more to condensate .
China September crude oil imports rise on strong seasonal demand
https://www.reuters.com/article/us-china-economy-trade-crude-idUSKBN1WT099
“China’s crude oil imports in September rose 10.8% from a year earlier as refiners ramped up output amid stable profit margins and solid fuel demand. ”
“Over the first nine months in 2019, crude oil arrivals reached 369.04 million tonnes, or 9.87 million bpd, up 9.7% from the same period last year, the data showed.”
Wow … what happened to the “trade war is destroying demand” mantra.
Some of that is loss of domestic production, but not much. Their consumption growth is relentless.
Only 1 barrel discovered for every 6 consumed so far in 2019, a 20 year low.
https://oilprice.com/Energy/Energy-General/Replacement-Rate-Hits-20-Year-Low-Oil-Industry-Only-Replace-1-In-6-Barrels.html
More or less everything I read is negative here on oil, so why is the price still so low?
Sean,
the negativity is directed at the consequences when world oilproduction
doesn’t rise anymore and some time thereafter starts to decline.
To avoid some of the problems, car manufacturers should within the next 3 years decide to not produce ICE cars anymore. But that is mission imposible, because there will be not enough EV infrastructure in place yet then. Let’s say that within 10 years only EV cars are sold, then in the year 2035 there are still very much ICE cars on the road ( or part of them parked forever because there is not enough petrol/diesel available). So hoping is for a long peak plateau oilproduction, supposed that world oilproduction will peak somewhere in the next decade, to give this transition some chance to succeed. The problems for the aviation sector to name one, which is still expected to grow strongly, is another story
for every article I read about poor discoveries, or potential, eventual, maybe-possibly some steam running out of shale, I read twenty articles on a global economic slowdown, with multiple countries already in recession, and thirty articles about crumbling trade-relations, and forty articles about some nuclear powered madman who might kill us all. the investing mood is not exactly euphoric.
Yes i agree. The key factor for the low prices is the anemic global growth rate.
Biggest reason is that the shale oil narrative is still intact.
Shale oil production will grow, so there will abundand oil on world markets no matter what happens elsewhere.
China is increasing importing oil – doesn’t matter.
Let’s see how this growth next year will happen. The common predictions are:
-WTI price next year is in 50$ range
-LTO production will grow 4-800 kbd
-LTO companies will have to pay back high double digit billion$ amounts of debt – or find some investor to roll them
So it’s not geolotical, not political (rockets don’t impact oil price anymore), but wallstreet which determines the LTO growth next year since all this can only happen when the companies have the possibility to load up further dept.
Updated forecast for 7 US shale regions derived from just released EIA DPR. This forecast of peak 9.5 mbd in 2021 is for all oil production from these 7 shale regions, although it is mostly shale oil.
https://www.eia.gov/petroleum/drilling/
This forecast is based only on linear extrapolations of production from new wells vs legacy decline. In 2019, production from these 7 shale regions is estimated at 8.6 mbd. In 2020, the forecast is 9.3 mbd.
Here is the corresponding 7 US Shale regions monthly oil production forecast to Dec 2022
Interesting thing, the DUC count decreased a lot, by 200 units. It’s not the completions that are on the rise (they are steady since March), but the drillings that are much lower.
Of course, the amount of DUC is so high that it doesn’t make much difference…
This can be interpreted as a slowdown in making.
The normal cycle of a well should be:
1- Planning and financing
2- Getting a drilling licence
3- Drill it creating a DUC
4- Build infrastructure (oil tanks, water bassin for fracking…)
5- Organize fracking, get a free time slot
6- Get some more money
7- Frack it
8- pump and sell oil
When you reduce drilling as a company, you start your slowdown at point 1. So a normal DUC is a drilled well waiting for steps 4-6 to finish.
You’ll see the drilling slowdown first, and the fracking slowdown later. The other way around it will be the same, when the boom reignites. Lot’s of drilling and DUC grow, until production grow will start.
Think also this list should include plugging and clean up after the oil is taken up, this represent also a cost…
Tita,
I agree that the DUC count is high but it has been falling and I’m guessing that DUC completions favour the more profitable DUCs. Also the DUC/completions ratio has been falling. The chart below shows these two statistics for the 5 oil regions.
Tony,
Keep in mind that the rate of increase of the absolute value of the legacy decline rate will decrease over time as the completion rate falls as the peak approaches. Assuming a linear increase is likely to be flawed. Just look at historical rates to confirm this (2010 to 2019).
DC, for crying out loud:
“Keep in mind..rate of INCREASE of the absolute value of the legacy DECLINE rate will DECREASE over time as the completion rate FALLS as the peak APPROACHES.”
Oh yes–keep that in mind.
My head is still spinning, and I’m sitting down.
Sorry, there is a thing called legacy production change (which I called the legacy decline rate) in the DPR report, the change is always negative for legacy production, it is sometimes confusing to talk about negative numbers so I switched to the magnitude of this negative number (in mathematics this is called the absolute value).
For the Permian basin the slope of the legacy production change will become flatter over time, Tony has assumed the slope will be unchanged, I believe that is not a good assumption based on past history (see Jan 2015 to June 2016 in chart below, which may or may not make things clearer).
The chart is for Permian basin only and my estimate (DC estimate) assumes the completion rate is fixed at 495 new wells per month from June 2019 to Dec 2022 (this has been the completion rate from June through August 2019.)
The trendline shows the linear assumption for the legacy production change and that it might be 150,000 barrels per day too low (or too large in magnitude) by the end of 2022 relative to the conservative flat completion rate scenario which peaks in Nov 2024.
Dennis,
I agree that legacy decline rate should decrease as completion rate falls. However, since April 18 the legacy decline rate has been increasing linearly.
I wanted to make a simple forecast so that’s why I used simple linear extrapolations of both new well production and legacy decline. If I used a non-linear decreasing rate of legacy decline then I might also have to use a similar assumption for extrapolating production from new wells. This means that new well production could still fall below legacy decline in mid 2021, also giving a production peak in 2021.
It’s also interesting that, acknowledging the data quality of EIA DPR, that the EIA forecasts that in Nov 2019, production from new wells is 627 kbd, which is only 57 kbd greater than the legacy decline of 570 kbd. The gap seems to be getting smaller.
If there is less cash available for shale oil producers this could also cause production from new wells to drop faster than expected, especially if WTI stays under $55.
https://www.latimes.com/business/story/2019-10-15/how-us-oil-output-went-from-explosive-to-sluggish
Tony,
The DPR is not very good. Simplify by focusing on Permian, that basin alone is responsible for almost all US tight oil increase in 2019. The completion estimates by the EIA are also not very good.
Below are Permian completions from Jan 2018 to August 2019:
342
411
420
388
414
425
435
445
455
465
475
450
425
430
440
450
465
480
495
495
Use data from Shale profile for average 2018 and 2019 wells for first two months to find production added by new wells each month, then you can find actual legacy decline, it probably won’t match the DPR numbers, believe your own numbers. A simpler method is to simply use the maximum average well output (month 2) from shale profile, that gets you pretty close. Use EIA tight oil production estimates by play, those are far better estimates than the DPR, that report is really not well done.
Chart below has legacy decline estimate with future decline rate based on a scenario with 495 new wells added each month from July 2019 to Jan 2026.
Edit: Ignore this chart which mistakenly assumed no decrease in new well productivity when calculating legacy decline, better chart (a correct analysis) in a later comment at link below:
http://peakoilbarrel.com/opec-september-oil-production-2/#comment-690082
Tony production from new wells depends very simply on the completion rate, probably the completion rate will either be flat or increase, if it goes down, it will be short term unless oil prices remain $65/b or less for Brent long term, my guess is that is a highly unlikely scenario. An assumption of a flat completion rate would give about 22 kb per well per month times 495 wells divided by 30.4 days or 358 kb/d output increase if there was no legacy decline.
Below is Permian output in kb/d for July 2019 to Dec 2022 assuming constant completion rate of 495 new wells per month
3624
3694
3759
3818
3873
3925
3973
4019
4063
4104
4144
4182
4217
4251
4283
4315
4345
4373
4401
4428
4454
4479
4503
4527
4550
4572
4594
4615
4635
4654
4673
4691
4709
4726
4743
4760
4775
4791
4806
4820
4835
4849
Output peaks in Nov 2024 at 4621 kb/d assuming completion rate continues at 495 new wells per month from July 2019 to Nov 2024. Note that I assume new well productivity starts to decrease in Jan 2019 at 0.34% each month at the assumed 495 completions per month. Note that I realized that I forgot to include this assumption in an earlier chart on legacy decline (the well productivity was assumed fixed in the earlier chart which should be ignored.)
Corrected chart below, also output data above corrected at 12:09 pm
A further revision to my model results in a different legacy decline estimate, the 0.34% estimate in monthly decrease in new well EUR is too high and results in a low TRR estimate, for the mean USGS TRR estimate of 74 Gb the monthly decrease in new well EUR is 0.1323% each month, a revised legacy decline estimate below, compared with DPR legacy production change estimate. The estimates are a bit different as I include only horizontal wells and the DPR includes all oil wells tight, conventional and both horizontal and vertical wells for the entire Permian basin. Chart in comment below.
Corrected legacy production change estimate for Permian Basin.
Also in comment above I said:
Output peaks in Nov 2024 at …
That is incorrect (from an earlier scenario with too low a TRR).
Output peaks in 2029 at 5251 kb/d for this scenario, where 495 new wells are completed each month from July 2019 to Dec 2039. URR for the scenario is 55 Gb with 170,000 total horizontal wells completed from Jan 2008 to Jan 2049.
Dennis, quite interesting estimate off Permian growth. If 3.624 Mbpd in July 2019 and increase to peak 4.621 Mbpd in 2024 it means growth in 5 years and 4 month 1 mill. bpd. If we look at EIA weekly production was at end of December 2018 11.7 Mbpd in US , than after 10 months increase to 12.6. This is 900 kbpd in less than one year and normaly 4th quartile have shown strong increase in US oil production. Also EIA predicts oil production in US increase by more than 1 mbpd in 2020 and most of this will come from US shale as majours suppose to scale up. Another issue unthil Permian suppose to peak in 2024 other shale fields like EF will peak before and it means US might peak before permian. I read there is some tie back in GOM that might add 200k bpd in 2021-2022. Else EIA exspect GOM to exseed 2mbpd within end of 2019. Perhaps Guyana will add 500kbpd , Norway have might add 400kbpd in 2019 and additional 200kbpd in 2020 Phase 2 Johan Sverdrup. World demand might grow 1 mbpd in 2019 , 1.2 mbpd in 2020. Perhaps we will see increased oil price WTI 75 in 2021..?
Freddy
Note the scenario was revised with peak of 5251 in 2029 for Permian basin.
That is a very conservative scenario with no increase in completion rate it remains 495 new wells each month for 2019 to 2035.
A more realistic scenario with completions gradually increasing to 727 new wells per month in 2026 peaks in 2027 at 7000 kbopd.
Oh, no shale growth without de facto slaves?
https://oilprice.com/Energy/Energy-General/The-Crackdown-On-Illegal-Immigration-Is-Hurting-Oil-Drillers.html
Eulenspiegel, you’ve beat out NickG for the stupidest 2019 comment on Peak Oil Barrel and believe me, there have been a bunch of them.
Much of Texas and indeed much of America runs on Mexican labor, Mexican ingenuity, Mexican work ethics and Mexican love for family. They are not “de facto slaves,” you ignorant ass; in the oilfield we pay people for how they work, not who they are. No lazy American would do the kind of work that Mexicans do and we pay them well and give them an opportunity they would never otherwise have. They are humans and they are one of us. In the oilfield most of those guys will make $20,25 and 30 dollars an hour, work their ass off and never, ever complain. Not ever. They pay taxes on that income and then send 80% of it home, to their families. They are treated with respect and admiration; in my business, on my ranch they are invited in my home, we care for their health and the well being of their families. Mexican culture and Mexican people are very much a part of who Texas is. You could not possible understand that.
This oilprice.com article was a stupid one, to which you fell for, and put your pathetic liberal slant on. The shale oil business can’t make any money regardless of who does the labor. Mind your own business about Texas, wherever the fuck you are from, and don’t come back now, hear?
Mike, you come across like an employer who exploits desperate Mexican labor with a guilty conscious. Justified by your view of lazy Texas Americans.
$25 an hour is not exploitation and my conscious is fine, DH. The US oil and natural gas industry does not use illegal immigrants as “slaves,” almost all of whom in Texas, are Mexicans. That’s a stupid comment.
If we could fence the whole of Texas off, trust me, it would be to keep Californians the hell away, not Mexicans.
Immigration and Customs Enforcement crimes reporting number 1 866 DHS 2ICE.
Please post the address of your ranch for inspection
Mike,
I assume the Mexicans you are speaking about are legal immigrants, otherwise you wouldn’t hire them.
The illegal immigrants generally are paid less.
Wait I thought Californians were turned away at the border. 😉
California, having a GDP larger than the UK and France (5th in the world) might just want to leave the 3rd world US behind.
Its federal taxes are already giving 20% of revenue to our Red State friends.
Aside from that dog track in New York, a few nasty corps in Washington State, some tech in Boston, and all that corn in the midwest, why bother?
(I’m not a CA resident)
Alabama outlawed Mexican labor and the crops rotted in the fields. I know because I was there and saw the rotting fruit and vegetables.
We’ve Already Learned That Losing Immigrant Farm Workers Is A Disaster
Alabama Illegal Immigrant Crackdown Destroys Farm Business
Alabama law drives out illegal immigrants but also has unexpected consequences
Has the opinion of Alabamians changed?
I have no idea but I seriously doubt it. They are mostly Trumpites, especially the farmers. Except for the produce farmers of course. They always believed that Mexican labor was a great idea.
If you have been watching cable news lately you will note that the Midwest soybean farmers, who are losing millions due to Trump’s tariffs, still back him to the hilt. They have confidence that eventually he will turn things around.
Ideology is usually set in cement and very hard to change.
Than make them legal and pay them market wages
They were paying them market wages. They were paying them all the market would bear. However, no local workers would work for those wages. That’s why the crops rotted in the fields.
The lost produce was imported from Mexico where the workers are paid even less.
Then help getting your people papers then everything is all right. Perhaps your family lawyer doing all the other paper stuff.
Employing illegals is modern slavery, period.
I don’t have any concerns against mexicans.
Eulenspiegel,
I disagree unless one believes all wage labor is slavery. I do not.
These people choose to come to the US to find work because even as an illegal immigrant they earn higher wages in the US.
In most cases the Mexicans are better workers than the average US citizen, I think they should be given the opportunity to earn a living and I commend Mike both given the Mexicans the opportunity to work and for treating them with the respect they deserve.
We do not live in an ideal world nor do we make the laws, we do the best we can with the World as it is.
Mike,
Were there inaccuracies in the Oilprice story?
I don’t agree with calling labor by illegal immigrants slave labor.
Is it correct that Trump’s policies towards Mexican workers is hurting the oil industry?
You would know, I don’t.
I happen to have a close and personal relationship with an employment lawyer in West Texas.
Illegal immigrants are paid the same as anyone else in the oil patch. there is too much competition for good hands. out here. There are instances where some complain about being paid less because of gender. That is harder to address because of qualifications, experience, and performance issues. There is some allegations of racism and discrimination but from what I have seen, its generally Hispanic vs Black.
Yes, the US Department of Labor conducts wage and hour audits in West Texas and the DOL is getting more aggressive. Most disputes are about job classifications as exempt, non exempt, independent contractor or employee. Its not about paying slave wages to anyone because of immigration status.
If there is a dispute about immigration status, $ to doughnuts, its a personal issue between individuals.
Mike is Right! If you want to work, we don’t care!
Thanks John. Not sure if you read the Oil Price piece which seems to claim crack downs on immigration status of workers has been a problem in New Mexico. Perhaps things are different in New Mexico, or the article may be inaccurate.
I did read the story Dennis, and I read it again this morning. Its a news story designed to take up space.
There is only 1 actual business referenced in the article, a company called Micro Services. the other corporation mentioned is a county government economic development board. Its not a business.
You can’t tell the actual date or the context of the quote from the Micro Services owner. With rig counts falling a lot of companies have idle equipment stacked in yards. I am sure every owner or manager is thinking of hiring out its surplus equipment. If only!
As for the 300-750% surge in federal investigations, 300-750% of what? And what fiscal year?
Huntington Beach. Tell us where you live. Then we can see who you hire to clean, garden and take care of your crap, and the national origin of your mail order bride.
Better yet, why don’t you move out here and and get a job in the oil patch before you start telling us how to live.
We always have room for another social justice warrior. Come on down!!!
Huntington Beach?
I actually lived there– in 1968 (or was it 1969?)
Hint: lots of oil
https://en.wikipedia.org/wiki/Huntington_Beach_Oil_Field
We used to climb the derricks just for fun.
(As of 2000, Huntington Beach had produced over a billion barrels of oil )
It was 1967 I lived there.
John
The main takeaway from the article was a labor shortage.
Seems you are saying that is not the case, though not directly.
Dennis,
If there is a labor shortage in West Texas or SE New Mexico someone should tell the hundreds if not thousands of people that have lost their jobs this year.
I checked with my better half today about illegal immigrants in the oil patch. They do exist.
It is the Department of Homeland Security that conducts I-9 audits with employers. There are both civil and criminal penalties for employers who violate the law.
She has been involved with one company that was found to have illegal’s immigrants employed. I was astounded by the number of Illegal workers! There were 4! 4!
Did you get that HuntingtonBeach? And the workers provided the employer with fraudulent papers.
Homeland Security deported those workers.
The owner? Well he got death threats from the workers as they were being deported.
Yeah its really worth your time to employ illegal workers. Every business needs another headache!
John,
Thanks for the insights, based on Mr. Shellman’s comments some of the best workers in the oil patch are Mexicans (whether legal or illegal), so the question would be are there enough Mexicans to fill the positions available and has the change in policy towards immigrants made the available supply of labor lower.
You seem to be saying no, though I am guessing that unemployment numbers don’t reflect what is happening to illegal immigrants because they are unlikely to be collecting unemployment benefits so they would be left out of the employment numbers.
I suppose there is no answer to my question with good data to back it up, there would only be anecdotal observations.
Thanks, John. The relationship between legal or illegal immigrants in Texas is as old as Texas and it is not for weenie necks from the right or left coasts to judge. Its our business, as you say.
If you work in Texas you are going to be paid well, and cared for, and treated with respect; there is actually no distinction whatsoever between illegal and legal. These are human beings we are talking about. I worked with 12 today; we spoke Spanish together and we worked, hard, all of us. I could care less whether they had their stupid fucking “papers” or not. Its work. We drank some beer together and that was that. Another day.
Fix your own stinking problems, America, and leave Texas out of it. I don’t for instance, hear of a lot of homeless people shitting in the streets of any city in Texas like they do in California…there is actually a pretty good reason for that.
Mike,
I am from one of those awful coasts. I commend you.
Agree the slave labor comments are stupid. I also chafe at the scapegoating of Mexicans by many on the right. Though you may disagree.
Mike
Do you see many immigrants from central America in your area? Seems much of the problem at the border is immigrants from central America. Though perhaps most Texans think it is not a problem.
Also seems like there is no labor shortage or am I misinterpreting?
I know the situation here from construction sites with illegal labour.
The people are paid shit, and they have no rights. And the employers know how to exploit that. They pay the first 2 months, and then never again, only “next week”. Until the workers don’t even have enough money left to pay the bus home, working here on tourist visa or other things…
When there are accidents they try to hide them and not calling the doctor, avoiding questions about insurance (and therefore legal status), falling back to the employers.
This cancer has wormed even into the big companies by hiring sub sub sub contractors where the deepest layer is half Mafia.
If everything is all right with you, your thing. Contracts between uneven people are most time, ahm one sided, with the weaker side even not possible to get a lawyer or go to the police.
Considering the fact that Texas was essentially stolen from Mexico that is a very gracious attitude! Those familiar with Texas culture do not doubt that Texans value what the Mexican people add to their way of life. But it shouldn’t take very much self awareness to realize that this relationship is paternalistic. That it is predicated on the understanding that political power is not to be as widely shared as oil patch and construction jobs. The Texas Republican Party is working overtime trying to hold back the political empowerment of the Hispanic population in Texas apparently having made the calculation that the outreach made by the Bush family and their allies could never succeed. Perhaps they will reconsider this misguided and ultimately futile approach to dealing with demographic change.
https://oilprice.com/Energy/Energy-General/The-Pipeline-Lifeline-For-Texas-Oil.html
“Record-high exports from Corpus Christi contributed to the highest exports ever from the U.S. overall in the week ending September 27, as they jumped to 29.612mn bbls, or 4.23mn bpd. Export volumes passed the previous high mark of 28.659mn bbls, or 4.094mn bpd, set in week ending July 5, our data shows.”
Uh O, I wonder what happens to storage volumes if we keep raising exports…while production flattens. People may notice.
Shut down those exports … raise those tanker fees!
May work for a while 😉
It’s just swapping oil.
The USA is still a netto importer – so Exports don’t matter. It’s more a “I give you a black one you give me a green one”. For every barrel exported another will be imported. Until reffineries are refittet, since all this ex / importing costs money.
More about Russian Shale:
https://rogtecmagazine.com/technology-roundtable-proppants/ dated last summer
Maybe the best discussion of proppant technical specifics I’ve seen from anywhere. The Russians are generating oil and gas from fracking completely off the radar, and the interviewee notes in off handed fashion that Russia has been fracking fields since the 1950s. (this is true)
Some good stuff:
” The demand for proppants is ever growing and the majority of our fields cannot produce efficiently without hydraulic fracturing. If we have a look at 5 years history, the use of proppants sky-rocketed from 350k tons in 2013 to 1300k tons per year (forecast for 2018), and we speak about Russian market only.”
“So, I would say that 99% of Russian proppant market is the ceramic proppants, so far. In respect of advantages, it should be mentioned that reservoirs conditions, closure stresses first of all, and permeability values require the proppants of coarse mesh sizes (20/40 – 12/18) with crush resistance of 4000 – 6000 psi. So, Russian sands are still not the right alternative to ceramic proppants as they have poor grain shape and strength even being precisely sieved. Resin coated ceramics take about 20% of the market, and are mostly used as curable RCP for flowback control. Any attempts to substitute ceramics with Resin Coated Sand have been unsuccessful”
Reminder for the new folks. The early days of Bakken used ceramic (from China). Let’s make sure everyone understands this — ceramic is superior. It generates higher flows of oil. The US moved away from it because of expense. Sieved sand was cheaper and yielded pretty good oil flow, but “pretty good” is less than ceramic. The guy in the article notes that Russian sand sources just do not match ceramic performance.
But also note that the guy in the article came from the Soviet military in the 1990s and he runs the ceramic sales department of his company. He’s going to talk up ceramics, naturally, but his quoted performance points are correct. We do not hear about proppant much in the US anymore, and I don’t think I’ve ever heard anyone quote psi crush levels of the sand particles in either Bakken or Permian.
Not gonna paste too very long passages. Scroll down to item 6. in the article where he discusses proppant quality certificates and dispute resolution between ceramic supplier and customer. This is just superb discussion.
“9. Proppant transportation to a remote location can be a significant part of the cost of the proppant. How do you try to minimise the cost to your clients?
Borovichi Refractories Plant: In Russia, the logistics is the issue, of course. To satisfy the customers, we have warehouses in the main locations of Siberia. Big volumes of proppant at a warehouse allow us to decrease the costs of storage. In some cases, we rent services of transport companies to deliver proppant from warehouse directly to a single well. Unfortunately, we can’t control the costs of Russian Railways as they are greedy guys with ever growing appetite. In any case, all the people that work in Siberia and in the Russian North understand that the price of doing business within these areas is high and you have nothing to do with it.”
THEY ARE ALREADY FRACKING. This has been entirely off our radar screen. We never think about Russian production as anything but legacy flow from conventional fields. Victims of our own propaganda of the backwards Soviets — despite Russia being the only way to get astronauts to the ISS for what, 10 yrs now?
The US fracking model won’t work in Russia. Even if the resource quality and geology was the same as the Bakken or Permian – and it isn’t – the other factors don’t exist. There’s no supporting infrastructure for labor access. There’s no transport infrastructure. Most critically, Russia does not have the type of capital markets the United States does, making it not practical to raise and burn money at the same rate. None of the US shale buildout either in the fields or in supporting infrastructure was paid for by profits from fracking operations. Because there haven’t been any.
Oil prices will need to be much higher for Russian shale to even be feasible.
Nope, these fields are beneath already in production or finished production fields. The pipelines and infrastructure was put in for those fields years or decades ago. It’s actually a substantial advantage over Bakken day 1.
And clearly using ceramics makes it clear they aren’t going to pursue the US model.
And further, why would money matter. It hasn’t for US shale.
Money not mattering for US shale is the point. Russia doesn’t have capital markets even ex-sanctions capable of deploying what the USA burns on its LTO.
And no, the infrastructure to support extraction on the massive labor and active drilling scale LTO needs, that doesn’t exist in Siberia. Everything about the infrastructure and terrain is worse than the US fields. So add costs to that, like a hybrid of Alberta and the continuous resource inflow a fracking play needs. This is a hundreds of billions of investment proposition to build out the infrastructure and companies and ultimately production.
It’s doable, but at what cost per barrel?
Fracking has been around for a long time. Used even in conventional oil production.
https://www.rigzone.com/news/us_shale_production_on_track_to_hit_almost_9_mm_bpd-16-oct-2019-160080-article/
Seems EIA estimate an increase off 58 kbpd increase in shale oil production from Okt. to Nov. Perhaps year end might end by 500k increase of US oil production in 2019 rven the majours like Exxon are ramping up for several months now. Seems much of permian increase are offset by declined production in other shale plays like EF. Think both EIA and Rystads estimates for US 2019 oil production and also 2020 need to reviced down significant if WTI remains at 50-55 usd . The DUCs are also been used and remaining might be of wurst quality or even no value at all as requires much higher oil price to be profittable..
Most of the DUCs are in process I think.
Think about drilling, and then preparing the frack. Building infrastructure like water tanks, additional roads, installations, install the oil and gas catching hardware (before you needed the space for the drilling tower and pipes/mud handling).
In this time the hole is a DUC, even when everything goes to plan. If this takes 2 months, and you have a basin finishing rate of 500 wells / month – you’ll have 1000 DUCs being no real DUCs.
DUC^s are in my opinion just fig leaves for bull shit quality wells that are with a high WOR or a high GOR or just dry holes . The shale industry has shown itself to be nothing better than a used car sales man or snake oil man . All lies , smoke and mirror . Nobody
knows where these are located. If they are in tier 3 locations then they are bullshit and if they are in tier 4 location then they are bullshit +horse shit . Mike Shellman and Shallow know where the bodies are hidden and maybe they can enlighten .
Dollar index is touching it’s weekly supporting trendline this morning. Right at about 97,60. This should break to the downside with force as traders unwind their long dollar trades amid FED expanding it’s balance sheet. This should give the price of oil wings.
Shouldn’t that support the gold price too? I thought you wrote they would both decline?
silly, silly Jeff /sarc – that was until something that was completely and utterly predictable happened – FED expansion. I guess so long as all bets in the market are completely refundable at full price due to “shit changes” then HHH is worth listening to. Of course – he moves all his bets into “oil long” and then, boom, the other obviously already happening event of global slow-down suddenly “happens for real for real” in that it seizes up finance systems causing financial crises. Oil tanks, putting HHH on the losing side of two monumental shifts in the space of a year. So, its a good life.
U.S. Shale Productivity Declines Even As DUCs Decrease
But US shale productivity registered its first decline y-o-y in September.
The Permian alone had an increase of 729,367 barrels per day, September 2019 over September 2018 according to the latest, (October), EIA Drilling Productivity Report. And according to this same DPR, September 2019 had an increase of of 94,086 barrels per day over August 2019.
Okay, they are talking about productivity, not production. Nevertheless an increase of 94 thousand barrels per day???
Ron,
The DPR is likely overestimating, for Sept 2019 compared to August 2019 if we assume the completion rate has remained steady at 495 new wells per month from June to Sept (495, 495, 495, 495 for June, July, Aug, and Sept.) Then Sept output would be about 60 kb/d higher than Aug 2019, not that this assumed completion rate matches the EIA’s “tight oil estimates by play” (link below) through August 2019. No data for Sept yet (I ignore the DPR which is garbage).
https://www.eia.gov/petroleum/data.php
The productivity estimates are productivity per rig so rig productivity might have reached a maximum, but I am skeptical of the DPR models.
Ron,
The estimate I made above is for Permian basin only, not for all US LTO.
How much does Russia earn from oil and how much from natural gas? What is the proportion?
Russia production last year 11.4 mbpd (all liquids). Russia domestic consumption last year 3.228 mbpd. Crude export lists from EIA as 5.2 mbpd and another 2.6 mbpd in petroleum products (refined before exported). Doesn’t match up precisely but close enough. Probably the All Liquids is the 500K bpd diff.
They are trying to stop using the dollar so there will be currency conversion for you to get a dollar number. Reasonable SWAG would be average Urals price from Bloomberg, though a lot goes to China at a volume discount.
Gas production 62.8 billion cubic feet/day. Consumption 44 bcf/d. GAZPROM Europe pricing is about $215 per thousand cubic meters. Good luck with the unit conversion.
Are we overdue for a Bakken report?
Watcher,
See
https://shaleprofile.com/2019/10/14/north-dakota-update-through-august-2019/
About 142 wells completed in both June and July and 104 wells in August in Bakken and Three Forks, if we assume all “unknown” wells are Bakken or Three Forks wells.
Output in Bakken and Three Forks of North Dakota increased from 1372 kb/d to 1404 kb/d, an increase of 32 kb/d and a new peak for monthly output.
Over the past 2 years an average of 100 new wells per month were completed in ND Bakken/Three Forks and output has increased from 1023 kb/d in Aug 2017 to 1404 kb/d in Aug 2019. This has been due to increasing productivity of new wells in first few months of output over this period.
If we assume this increase in average well productivity does not continue then about 120 new wells per month are needed to keep output at current levels, output is likely to start declining by late 2020, if 120 new wells per month are completed each month over the next few years with a peak of about 1440 kb/d in mid 2020.
The scenario has a total of 24,000 wells completed from Jan 1960 to March 2029 with a URR of 7.9 Gb by Dec 2050.
EUR of the average 2019 well is about 390 kbo.
Of course we don’t know the future productivity of new wells or the future completion rate, this is simple one of an infinite number of possible future scenarios, odds of the scenario being correct are virtually zero (1/infinity).
Latest North Dakota report is scheduled for 2:00 pm today. Should be out soon!
Fracking has been around for a long time. Used even in conventional oil production.
Venezuela’s October production figures will be down sharply but this should have no impact on oil supply. Their short term problem is that their storage is full due to embargo, so their *exports* would be stable. If they could export.
https://oilprice.com/Energy/Crude-Oil/Brimming-Storage-And-No-Buyers-Venezuelas-Oil-Production-Tanks.html
The concern longer term is that with the general degradation from asset stripping and no investment is how messed up idled fields will get.
Rick Perry (Dept of Energy) will be leaving by the end of the year. Trump said they already have his replacement.
The Sept LTO report is out and it looks like the Permian continues to power LTO output. According to the LTO report, over the last three months, LTO production has increase by 333 kb/d, or 111 kb/d/mth. Of that the Permian has contributed 248 kb/d, or 83 kb/d/mth.
The production trend line for the Permian has increased its slope as monthly revisions have shifted the output numbers higher, Deep blue line vs red. Again the last three months are showing a higher rate of production than over the whole year.
Could the increase in Permian compared to active riggs that is down 150 related to a year ago be exsplained with use off DUCs. Else news tells Exoon ramping up production and their number off Riggs have increased 3 fold.
https://www.google.com/amp/s/www.rigzone.com/news/woodmac_bullish_on_exxon_permian_growth_campaign-08-oct-2019-160004-article/%3famp
Permian Chart
Thanks Ovi.
Transparency for production/exports from these fields or local consumption? Any production from Syria sold to open markets? Included in any of the above charts? As we know Governments never Lie about Oil. https://www.zerohedge.com/geopolitical/trump-boasts-us-has-secured-oil-syria
I’m surprised no one has posted about this yet.
https://oilprice.com/Energy/Energy-General/Trump-Claims-To-Have-Taken-Control-Of-Middle-East-Oil.html
https://www.google.com/amp/s/www.rigzone.com/news/woodmac_bullish_on_exxon_permian_growth_campaign-08-oct-2019-160004-article/%3famp
Syria Assay.
Light API 38.
Very good oil, Diesel and Kerosene 37% of the barrel.
The Open Thread this week is for Petroleum related comments only, sometimes people see Open Thread and assume it is non-Petroleum, which would be a poor assumption this week. Comments in the wrong thread may be deleted along with any responses to those comments.
Open Thread Petroleum at link below
http://peakoilbarrel.com/open-thread-petroleumoctober-20-2019/
Also, a new Electric Power Monthly is up, any non-Petroleum comments (not related to oil or natural gas production) should be under that post.
http://peakoilbarrel.com/eias-electric-power-monthly-september-2019-edition-with-data-for-july/