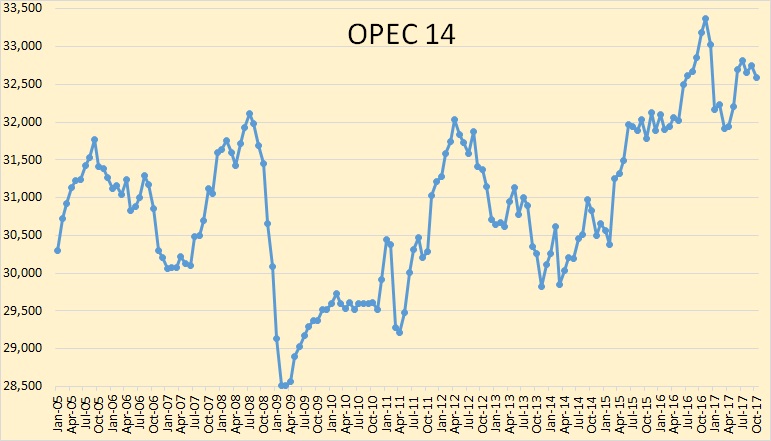
All data below is based on the latest OPEC Monthly Oil Market Report.
All data is through October 2017 and is in thousand barrels per day.
I have now included Equatorial Guneia although I only have data from January 2015 from OPEC’s secondary sources. The January 2015 E. Guneia data was extended back to January 2005. I know this is inaccurate but production from E. Guneia is so small it will make little difference.
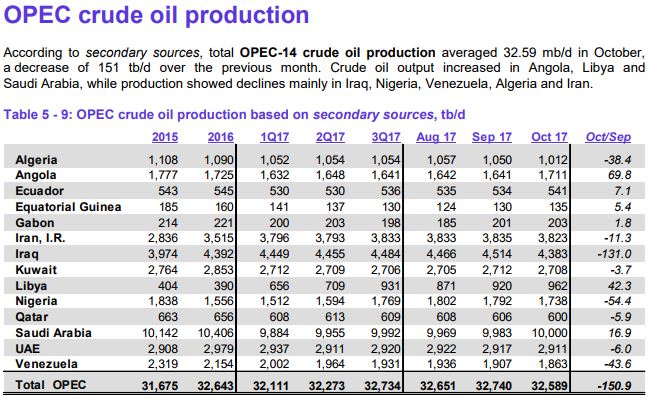
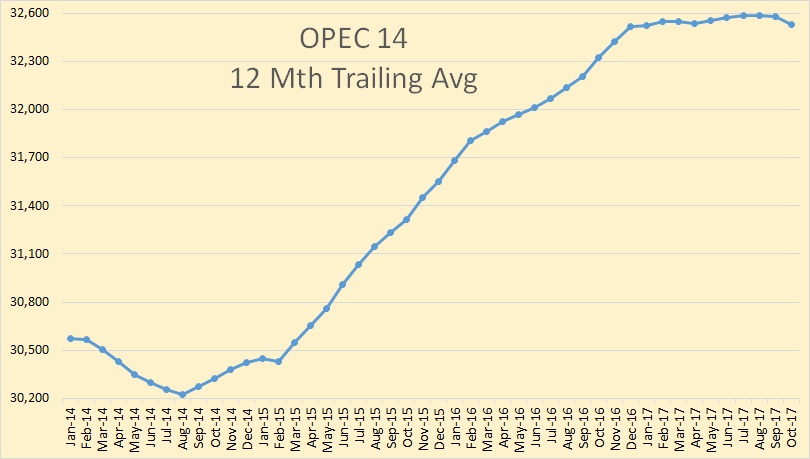
OPEC crude oil production dropped by 151,000 barrels per day in October.
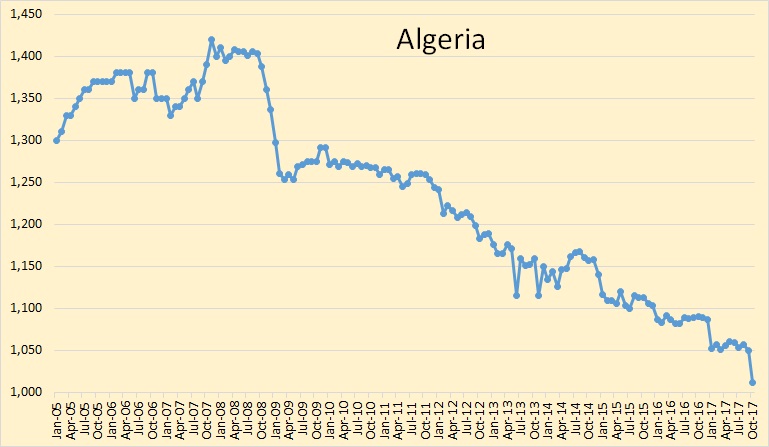
Algeria took a hit in October, down 38,400 bpd.
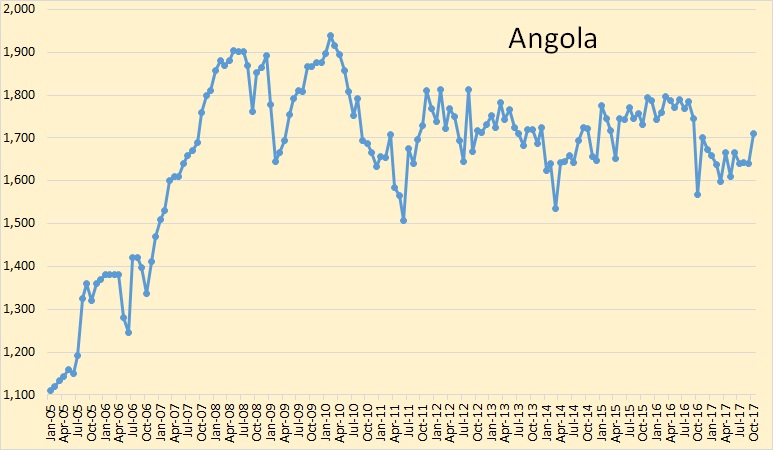
Angola was up almost 70,000 bpd in October.
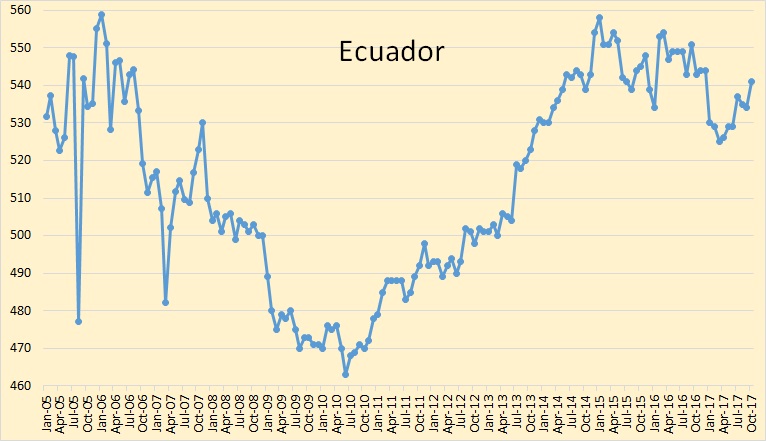
Not much is happening in Ecuador. They were up 7,100 bpd in October.
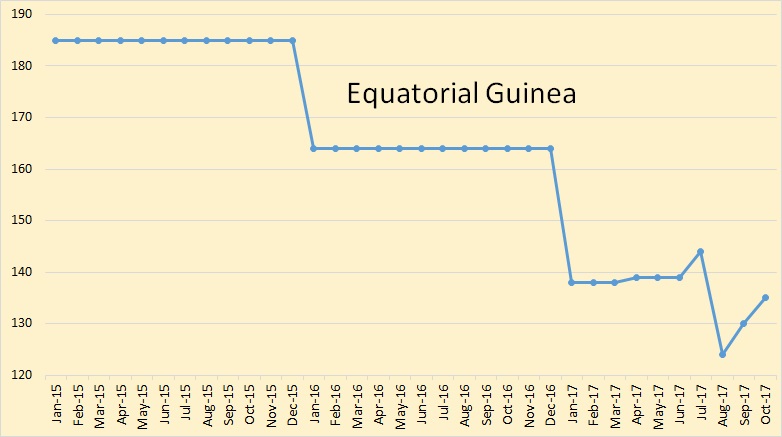
I do not have historical data for Equatorial Guinea. The OPEC MOMR gives average annual production data for 2015 and 2016 and quarterly data for the first two quarters of 2017. But now we will have monthly data from now on. However, they produce the least of all OPEC countries and their production will make little difference.
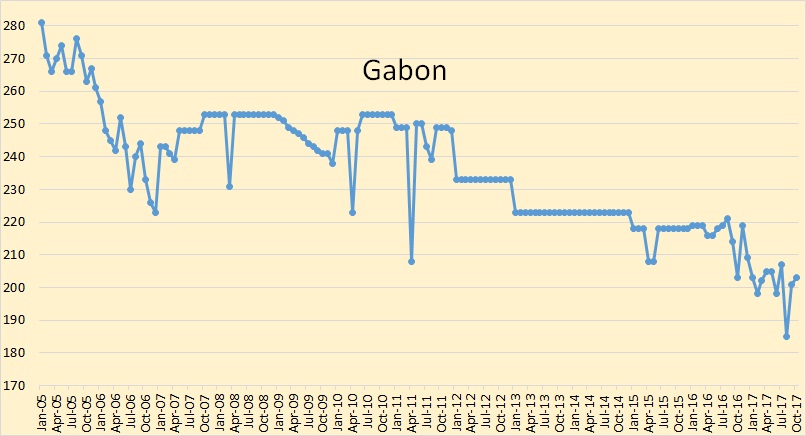
Gabon, another of the also-rans. Any change in their production will have only a small effect.
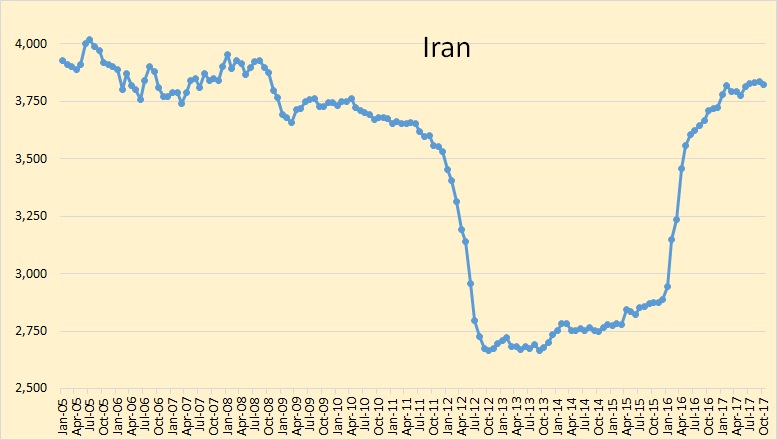
Iran has clearly reached a post-sanctions peak.
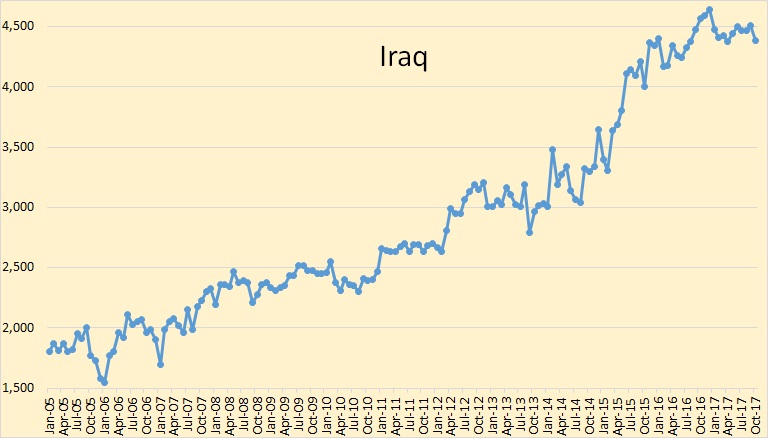
Iraq, OPEC’s second-largest producer, appears to have reached at least a temporary peak.
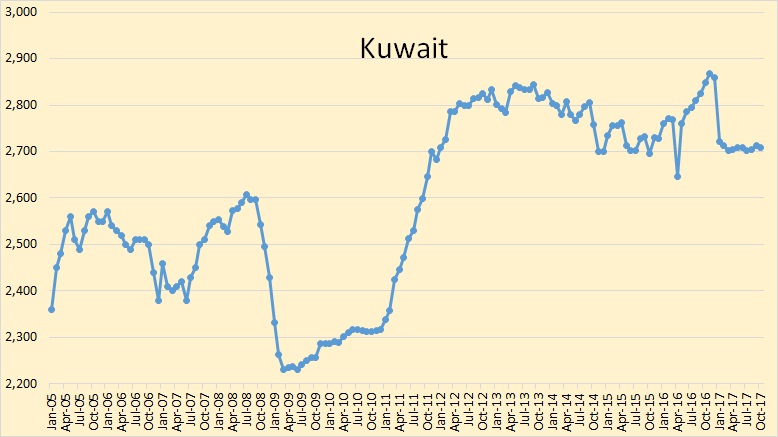
Kuwait’s crude oil production has been holding at just a tad over 2,700,000 bpd for all of 2017.
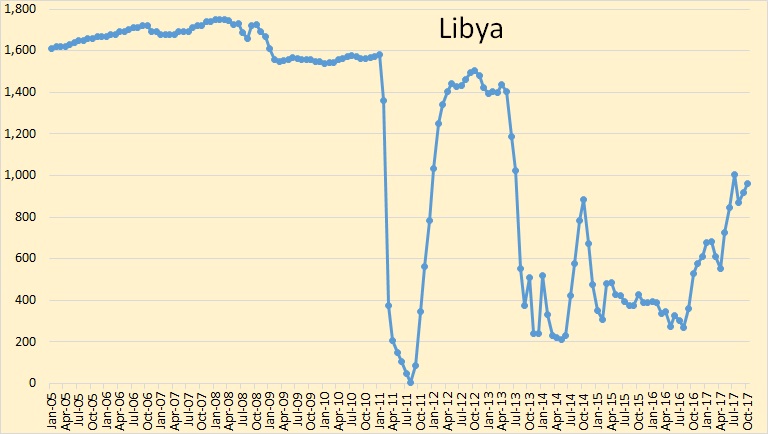
Libya has overcome most of their political problems. They should be producing a bit more than they are currently producing. Perhaps it will take them some time to repair their infrastructure.
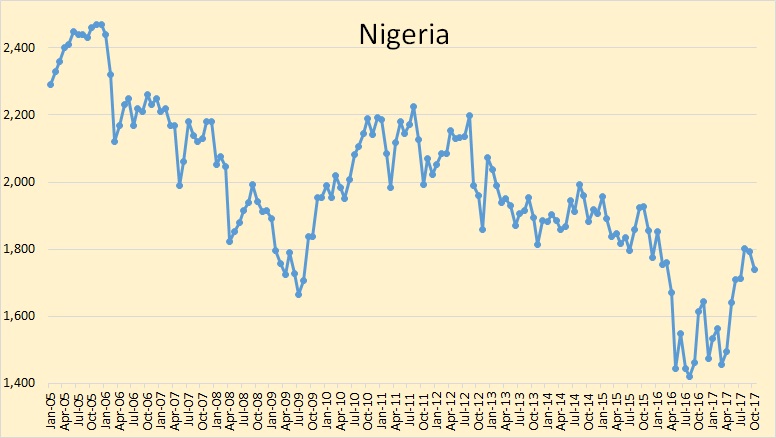
I believe Nigeria will always have serious political problems. They are dramatically overpopulated and will always have rebel factions. Don’t look for any dramatic increase in production from Nigeria.
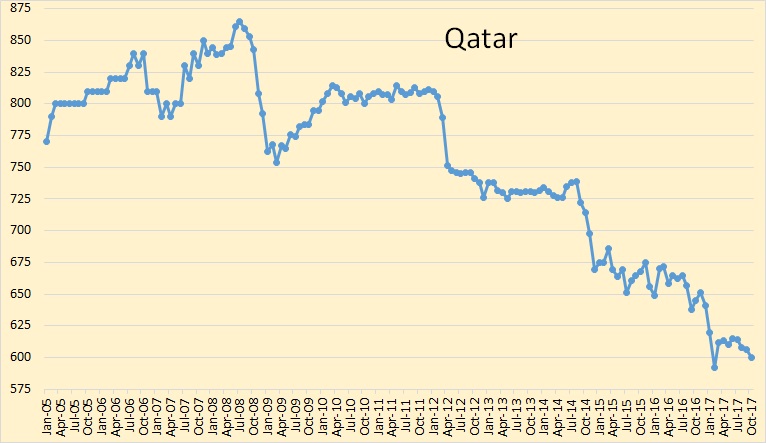
Qatar’s crude oil production peaked almost ten years ago. Their decline will continue.
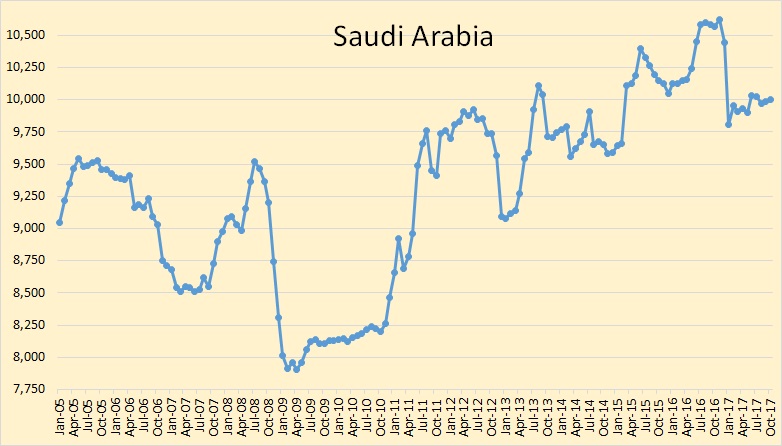
Saudi produced exactly 10,000,000 bpd in October.
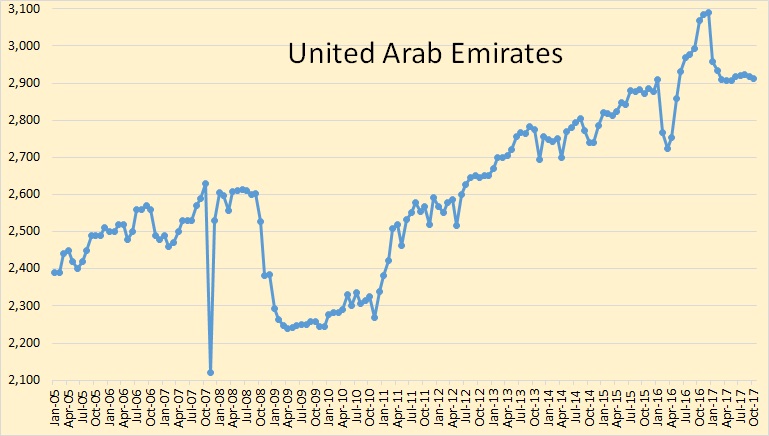
UAE’s crude oil production is holding steady at just over 2,900,000 bpd.
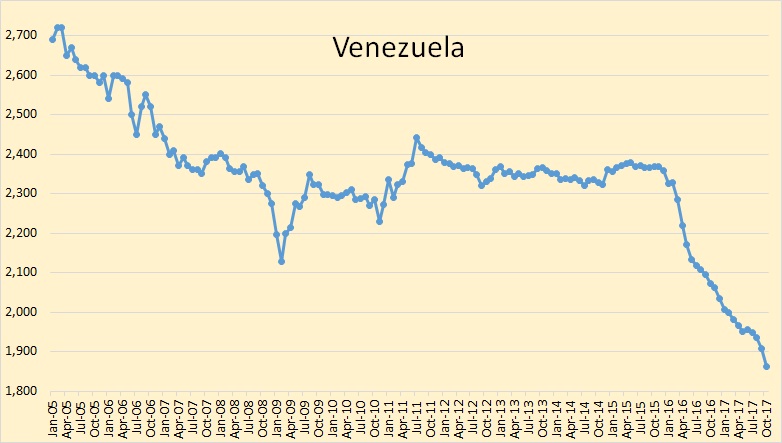
Venezuela’s crude oil production decline has accelerated in the last two months. Venezuela will very likely become a failed state in the next few years, or perhaps months. Their economy will totally collapse. This will hit their oil production even harder.
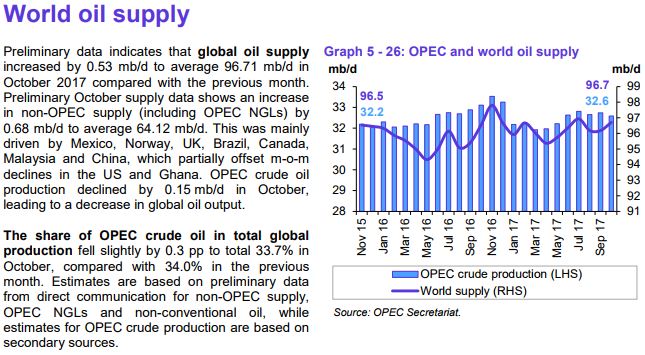
World oil supply has held steady for two years.
OPEC Head Says Oil Cuts ‘Only Viable Option’ to Stabilize Market
The Organization of Petroleum Exporting Countries should decide at its meeting later this month whether or not to extend the cuts,…
Cuts? What cuts?
246 responses to “OPEC October Production Data”
U.S. SHALE OIL PRODUCTION UPDATE: Financial Carnage Continues To Gut Industry
As the Mainstream media reports about the next phase of the glorious U.S. Shale Oil Revolution, the financial carnage continues to gut the industry deep down inside the entrails of its horizontal laterals. The stench of fracking fluid must be driving shale oil advocates utterly insane as they are no longer able to see the financial wreckage taking place in these companies quarterly reports.
This weekend, one of my readers sent me the following Bloomberg 45 minute TV special titled, The Next Shale Revolution. If you are in need of a good laugh, I highly recommend watching part of the video. At the beginning of the video, it starts off with President Trump stating that the U.S. has become an energy exporter for the first time ever. Trump goes on to say, “that powered by new innovation and technology, we are now on the cusp of a new energy revolution.” While I have to applaud Trump’s efforts for putting out some positive and reassuring news, I wonder who is providing him with terribly inaccurate energy information.
I would kindly like to remind the reader; the United States is still a NET IMPORTER of oil. We still import nearly six million barrels of oil per day, but we export some finished products and a percentage of our shale oil production. Thus, we still import a net of approximately three million barrels per day of oil.
A few minutes into the Bloomberg video, both Pioneer Resources Chairman, Scott Sheffield, and Continental Resources CEO, Harold Hamm, explain how advanced technology will revolutionize the shale oil industry and bring down costs. I find that statement quite hilarious as Continental Resources and Pioneer continue to spend more money drilling for oil and gas then they make from their operations. As I stated in a previous article, Continental Resources long-term debt ballooned from $165 million in 2007 to $6.5 billion currently. So, how did advanced technology lower costs when Continental now has accumulated debt up to its eyeballs?
READ MORE: https://srsroccoreport.com/u-s-shale-oil-production-update-financial-carnage-continues-to-gut-industry/
Unfortunately, it seems as if energy investors are taking the BAIT that the U.S. Shale Oil Industry has turned around. Well, it would be nice if it were true. However, when the market finally crashes from being tremendously over-extended and over-valued, then the oil price will head down south with it. This should strike the fatal blow to the U.S. Shale Oil Industry.
steve
I agree with everything that you say up until the last paragraph.
What if Bloomberg came out with a story that said US shale oil companies are insanely over-valued because at current prices, they will all go bankrupt and US shale production in the next 3 years will decline by 2 million bbbls/day from current levels. [My summarization of your position, more or less.] There would seem to be a huge supply deficit in 3 years since many projections are counting on +2-3 million bbbls/day increase in US shale production in that time-frame.
Why does your scenario lead to the conclusion that “then the oil price will head down south?”
clueless,
As you are probably aware, well… I believe you are, the market and economy are being propped up by a massive amount of money printing, debt, and leverage. So, when the market finally crashes, it will gut employment tremendously. Thus, Fewer workers = less demand for energy.
When the markets crashed in 2008, the oil price went down along with it. This has less to do with SUPPLY & DEMAND, and more to do with deflation.
However, demand will fall as supply falls, but again, it is not the critical determining factor for the price. Unfortunately, the quality of oil has fallen so low, it really isn’t worth bidding it up.
Lastly, if the world didn’t have $270 trillion of debt and a quadrillion in derivatives, then maybe the price of oil could trend higher for years.
steve
Hi Steve,
Looking at US debt (all sectors) to GDP, it has been stable since 2009 (slight decrease of 0.2% per year) after rising at 2.4%/year from 1992-2008.
https://fred.stlouisfed.org/series/ASTDSL
https://fred.stlouisfed.org/series/GDPA
I used data from links above and did Debt/GDP then took natural log to determine growth rates (slope of trend lines) from 1992-2008 and 2009-2016.
Chart below. It is debt to GDP that matters, this has not changed much since 2008.
Dennis,
That doesn’t include the now $13+ trillion in FX and currency swaps that aren’t included in the debt figures. However, they behave like debt. That $13 trillion figure ballooned over the past 4-5 years.
steve
Hi Steve,
There are counterparties to every derivative, when one side loses the other side wins. Perhaps there will be another major Global financial crisis. In the past 100 years there have been two major financial crises (1929 and 2008), financial doomers predicted a major crisis every year from 1930 to 2008, after 78 years they got it right.
https://www.theguardian.com/business/2017/jul/10/how-healthy-global-financial-system-mohamed-el-erian
Good piece on derivative risk (Steve probably has seen this but others may not have been introduced to derivatives beyond “The Big Short”).
https://www.aol.com/2010/06/09/risk-quadrillion-derivatives-market-gdp/
There may be a financial crisis when oil and other fossil fuels peak and decline around 2030, much will depend on the price level of fossil fuels and how quickly the transition to renewables and alternative transport systems occurs.
“After 12 years shale producers still have to borrow to pay for development. After 12 years even a successful pizza parlor has accumulated its required operating capital.”
So, does having a positive cash flow even matter any more?
Energy News – From previous thread, THANKS for the Saudi Export Info!
You have to wonder how much of the world’s 96.7 mbpd ‘crude’ oil output is natural gas liquids?
Hard to get a handle on because non-oil liquids are not reported separately, (from 2014):
“Refiner Phillips 66 (PSX.N) and midstream giant Plains All American (PAA.N) have said condensate is oil with an API gravity of 45 or above. Meanwhile, Marathon Petroleum Corp’s (MPC.N) top executive said in a recent interview he believed condensate should have an API gravity of 60 and above.
Without a universal standard, production data vary wildly. The EIA’s own figures suggest that anywhere from 8 percent to 16 percent of U.S. crude oil production is condensate – a difference of more than half a million barrels a day.”
https://www.reuters.com/article/us-oil-condensate/u-s-oil-industrys-billion-dollar-question-what-is-condensate-idUSKCN0HX0BU20141008
Depletion of oil fields means increase in non-crude liquids with decreased energy content and decreasing percentage of motor fuel product, not just in the US but in other oil regions. If 10% of the 96.7 million barrels is non-oil gas liquids then actual crude oil output isn’t really increasing as OPEC secretariat seems to suggest.
I know this has been mentioned before, I’ve heard it from Art Berman and others w/ energy backgrounds, but the ‘good news’ is constantly repeated.
steve from Virginia,
Dennis was kind enough to send me an excel spreadsheet on Global NGL production. According to his data, the world produced 92.1 mbd of C+C+NGLS in 2016. Of that total, NGL’s accounted for 11.5 mbd. Thus, NGL’s represents 12.5% of the total.
And yes, not only do NGL’s contain approximately 55% of the energy in a typical barrel of oil, but it fetches about 55% of the market price for oil as well. So, the world is producing a lot of crappy liquids, which gives the impression to the BrainDead Layman, that we are producing a record amount of oil…we are not.
We are producing a record amount of LOW-QUALITY CRAPPY PETROLEUM LIQUIDS. I would imagine if we would break it down by separating oil sands, shale and NGL’s… the good quality stuff peaked a while ago.
steve
There are different ways to define “conventional oil”. If we include deepwater offshore and polar oil but exclude “extra heavy” oil (API Gravity < 10 degrees) and tight oil output in our definition of "conventional" Crude plus condensate (C+C), then in 2016 annual output of conventional C+C was at a peak (annual data through the end of 2016) at 73.2 Mb/d. The previous peak in 2005 (72.1 Mb/d) was exceeded in 2015 (72.9 Mb/d). There are other definitions of conventional oil, many (like BP) include NGL, in that case the data by mass is better than volume because it approximates energy content more closely. NGL is useful for heating and petrochemicals, but less so for land transportation.
About that Venezuelan default and all the crap from NYC banker propaganda?
http://www.zerohedge.com/news/2017-11-15/venezuela-signs-32-billion-debt-restructuring-deal-russia
$3.2B
The deal spreads the loan payments out over a decade, with “minimal” payments over the first six years, the Russian Finance Ministry said in a statement. The pact doesn’t cover obligations of state oil company Petroleos de Venezuela SA to its Russian counterpart Rosneft PJSC, however.
“The terms are flexible and very favorable for our country,” Wilmar Castro Soteldo, Venezuela’s economic vice president, told reporters in Moscow after the signing. “We will be able to return to the level of commercial relations with Russia that we had before,” he added, noting that a deal to buy Russian wheat will be signed next week.
Wheat. Oil. NYC will rage. (Particularly the NY Fed)
Then we have this from ye olde ISDA
A finance industry committee convened to discuss whether Venezuela’s state oil company has defaulted on its debts has elected to delay the decision once again, underscoring the uncertainly swirling around the country’s bond payments.
ISDA is made up of bank reps. If anyone among them has big bond holdings, they are NOT going to declare default. S&P can make whatever call they like. They are not the arbiter.
To learn what crap this is, go back and research what ISDA did when Greece could not pay their bond payments. Did they declare default? No. Hell, no. Such a declaration could have become global systemic. So no way in hell they obey their own rules and declare things according to those rules.
It’s all silliness, people. 2008/9 destroyed it all. Pretense holds the system together now.
The propaganda is amazing.
The fear of Ven gaining control of the largest reserves on the planet has the elite a bit shaken.
Venezuela doesn’t have the largest reserves in the planet. Based on what I’m seeing, Venezuela’s reserves are now less than 75 billion barrels. The figure they booked was always bogus, but now it’s more bogus than ever.
We shall see—–
http://geab.eu/en/top-10-countries-with-the-worlds-biggest-oil-reserves/
Venezuela’s oil reserves are bogus. They are estimated using unsound technical and economic methods. The heavy oil recovery factor is overstated, and all reservoirs are poorly managed. As time goes by, and nothing is done to correct the damage being done to oilfields, oil reserves must be reduced beyond the volumes being produced.
Here’s something I wrote about the topic a while back
https://21stcenturysocialcritic.blogspot.com.es/2015/05/venezuelas-heavy-oil-scam.html
3.2 billion US dollars is less than 3 % of the money owed by Venezuela and state owned companies. The Russians agreed to refinance because they aren’t about to get paid anyway, and this allows the maduro dictatorship to launch propaganda making believe debt holders are going to renegotiate.
Most bond holders aren’t going to negotiate with the regime because Maduro named a couple of guys under USA and Canada sanctions for drug traffic, money laundering and human rights abuses. There’s also the lack of a National Assembly approval, plus the regime has no plan whatsoever to show how it will fix the economy. Cuba has a lot of power over maduro, the Castro dictatorship foreign minister stated privately to an European diplomat that their Venezuelan colony would remain in castro’s hands because oil prices were going to go up and they had cut the cost to keep the Venezuelan people alive, they simply keep them half starved and without medicines.
While not the life expectancy of Cuba (79.55 years– US has 78.74), it is about 75, comparable with Brazil.
And the population is increasing.
How could that be?
I guess the lack of condoms and pills, lack of electric power keep the young ones having babies. As for any health or life expectancy figures, they are either old or faked. So don’t bother with that garbage.
Yea, garbage.
Somehow, I won’t take your word for it.
It doesn’t matter. The statistics you use only prove that castroism focuses on having its slaves live long miserable lives. So are you in Cuba working for the regime? You use their lines, but you lack finesse.
I have friends who are in Cuba frequently.
I’m sorry comrade, your world ended with the Bay of Pigs.
I enjoyed watching the USSR fall, and the way it looks I may see the end of the Castro dictatorship. As long as we can keep the Obamas of this world helping it survive, it’s just a matter of time. It has become heavily dependent on the oil and cash it steals from Venezuela, and it’s scared of change and loosening its grip on the people. Thus it will remain a backwards, abusive sore on the face of the planet, it won’t cure itself, and in time it will die. The key is not to allow Castro to colonize Venezuela and expand into a mini empire of evil.
Cuba is changing.
We live in a dialectical world.
The USSR was a much too conservative and a authority centric world for me.
The revolution ended in 1922.
We shall see– but things will not remain the same.
Fidel died of old age.
“3.2 billion US dollars is less than 3 % of the money owed by Venezuela and state owned companies. ”
I haven’t seen any number other than $21B for total debt. OTOH there IS a mention out there of debt/GDP of 28% and GDP is 300B. Of course one cannot know what proportion of the 100B would be external. Probably that’s the 21B, in which case this is pretty powerful stuff the Russkies just did.
As for the oil company’s debt, it doesn’t matter who the shareholders are. That’s not Venezuelan debt and is not backed by Venezuela’s govt. Imagining it is would be like declaring Nestle’s debt is backed by Norway’s Sovereign Wealth Fund just because they own shares in Nestle. Or declaring the government of Switzerland backs Apple debt because the Swiss National Bank (their central bank) buys shares of Apple.
Beyond all these details is the big picture. Russia is not going to allow regime change via “financial force” aka banking sanctions. Russia’s alternate financial network is becoming a real thing with real power, because it is based in oil and oil is all that matters.
The Wall Street Journal says it is $142 billion.
https://www.wsj.com/articles/default-in-venezuela-whats-next-1510705378
The total debt can be a moving target. Some use only sovereign bonds, others add the bonds issued by state companies. Others add several tens of billion of Chinese debt, and others add outstanding debt to nations such as Brazil, money owed to companies which delivered goods and services, money owed due to arbitration and court awards, etc.
GDP is also very hard to estimate at this time, because the economy is paralyzed and inflation seems to be way over 1000%. What we do know is that Venezuela is suffering from very serious brain drain, which impacts PDVSA and service companies, the population is suffering from hunger, lack of medicines, epidemics, lack of electricity and clean water, and very serious human rights abuses. Regime leaders are involved in cocaine traffic, and they continue to send oil and cash to Castro even though the country is borderline failed.
I posted a link to Daniel Yergin’s remarks about Venezuela in the non petroleum thread. It’s worth reading and somebody commenting on it over here in this thread.
North Dakota Director’s Cut just released for September.
Increase almost 20k bbd over August.
Bakken stats
https://www.dmr.nd.gov/oilgas/stats/historicalbakkenoilstats.pdf
active wells increased by 158 from August to Sept and output increased by 19 kb/d for the Bakken Three Forks to 1055 kb/d. Only 77 new wells were completed in the North Dakota in August 2017 and output increased that month by 23 kb/d.
Director’s cut at link below
https://www.dmr.nd.gov/oilgas/directorscut/directorscut-2017-11-15.pdf
They have added over 1,100 Bakken and/or Three Forks wells to boost production back to where it was in March, 2016.
So, conservatively $8 billion spent just to climb back up.
The amount of capital being burned on energy in the USA is truly remarkable.
Dennis, I have seen data that shows the total cost of all “shale” oil and gas wells from maybe 2003 forward, and then the gross proceeds from same. Very interesting how far from payout the USA wells are, in aggregate.
shallow,
I have mentioned this before, but SERIOUS TROUBLE will come down hard on the Bakken. Looks like someone hasn’t been honest about its production figures.
Fireworks will arrive shortly….. hehehe.
steve
Any hints?
Company or government?
shallow,
I probably said too much already. However, I just spoke with the ex-senior person from the company. He is going public before the end of the year.
If this news spreads as far and wide as I imagine… oh well, we are going to see investors FLEE the Shale Oil Ponzi.
steve
shallow,
If you get this, why don’t you respond to me at my contact info below:
[email protected].
steve
Hi Shallowsand,
Let’s say those 1,100 wells net $30/b at 200 kb per well (average 60 month cumulative) that would be $6.6 billion net income after 60 months. It will take $37/b net for these wells to pay out. Rising oil prices may allow this to happen.
Also they have been high grading so 60 month cumulative may be higher than I have estimated (I used the average 2014 well to create a hyperbolic well profile).
Also well costs may have come down as service costs have been reduced, though I doubt the average well cost has fallen to $6 million per well.
Not sure about the economics of these wells, clearly most of these companies have continued to burn cash, but higher oil prices will certainly improve the economics.
In the interest of those few oily readers you have left on POB, Dennis (I see you ran Guy, a knowledgeable royalty owner from Texas, off with that stupid comment about the Texas Railroad Commission), lets NOT say what you said.
Instead lets say that at $50 dollar hedged oil prices the net back, take home pay for a Bakken operator is actually $20 a barrel. And it is. Costs are not going down, they are going up, and longer laterals and enormous frac’s make true well costs actually closer to $9M. Such a well would therefore require 450,000 BO to payout.
Some very learned people on this site, actually knowledgeable about the oil industry, who are now also gone, have proven it will take $85 dollar plus oil prices, sustained, for the unconventional shale oil industry to pay back its debt and simply be able to replace reserves. The days of all this enormous ‘growth’ crap are over.
To render credible analysis of the future of unconventional shale resources in America one must have had actual first hand experience in the actual business of oil extraction. In other words, one must have had to write checks to drill wells, write checks to pay operating costs, write checks to the Federal government for taxes, write check after check, etc, etc., and watch their net revenue drop like a rock every month. Ignoring debt and economics to simply say there is 40GBO of recoverable shale oil in America is, forgive me, not in the least bit credible. The EIA, the IEA, almost every predictor of the future ignores the economics of shale extraction and it’s debt. Those predictions are therefore meaningless. Hoping for higher oil prices to make the future work out like you want it to is not a tactic, it is not a plan. It is a disservice to people searching for knowledge.
So, ignore the Million Dollar Way thing, and Michael Filloon, the self serving dribble in investor presentations, the “we are going to unleash America’s oil ‘might’ on the rest of the world” Perry/Trump bullshit and listen instead to Shallow Sand. He has written some checks in his day. Best not run him off.
Don’t worry, Mike. I don’t post as much, but I appreciate the oil section of this site.
I do miss the oil people that used to lurk here.
Just hoping, praying really, the shale dudes finally exercise some restraint. But not looking to promising on that end, despite being in their best interests.
Thanks shallow sand.
“Just hoping, praying really, the shale dudes finally exercise some restraint. But not looking to promising on that end, despite being in their best interests.”
The game is probably more complex than we think: it might not be in the best interests of the US financial institutions that “the shale dudes finally exercise some restraint.” And bankers rule the world. “The shale dudes” are essentially puppets of the US banks. And being a puppet means that they are incentivized to do what banks want them to do: to drill and produce even at a loss. After all, perverse incentives are common — the longer top honchos survive the more money they can grab via salary and bonuses, so you actually do not need to coerce them.
You do not need to be a “conspiracy theorist” to understand this part of the environment.
But for banks the losses on loans given for the production of shale oil can be compensated somewhere else (for example profits on derivatives; the game must be rigged, but so what), if they help to depress the oil price (in other words loans can be given without expectations that they will ever be repaid). After all the USA is the net importer of oil and for country as a whole some level of subsidy for oil production (even given to wrong people) makes perfect sense.
Also the price of oil is an important geopolitical tool. And always was. In this dimension, one popular version of the events is that in 2014 it was a gambit (accidental or planned does not matter much) to put Russia on the knees again so the movement of prices down was amplified somewhat artificially. And with the help of KSA.
Much like the USSR was put on its knees by collapse of oil prices ( also with the help of KSA) just before its dissolution (although the reasons for dissolution were mostly internal: facing economic stagnation, the USSR elite with its inept leader ( Gorbachov ) changed sides and joined neoliberal camp, effectively privatizing the assets that they controlled and putting the rest of population into misery)
See for example:
https://www.usatoday.com/story/money/business/2014/10/22/russia-oil/17716263/
The key question here is: Are big banks using derivatives to suppress oil prices? If yes (and I suspect the answer is yes), that means that some complex games around this capability, including the “Cold War II” style geopolitical games against Russia are not only possible, but quite probable.
That also means that “supply and demand dudes” are somewhat detached from reality. Looks like in oil, the tail can wag the dog for several years, I think.
Of course, there is a limit and at the end we need to face the reality. But when finance dominates the economics living in “artificial reality” can last several years, if not half of a decade.
That probably why “shale dudes” can get “evergreen” loans on reasonable conditions without any problems all the time and “Continental Resources long-term debt ballooned from $165 million in 2007 to $6.5 billion currently”
They now have more debt than equity.
https://www.gurufocus.com/term/deb2equity/CLR/Debt%252Bto%252BEquity/Continental+Resources+Inc
I think in ten years of so we will get a more clear picture about what exactly happen in mid 2014 and why this “oil price recession” lasted till, say, 2018.
Chou En Lai was reportedly once asked what he thought was the historic impact of the French Revolution. After considering the question for a moment he replied:
“It’s too soon to tell. ” ;-).
I think the same is true about the historic impact of the current low price period.
One negative side effect way was that at the stage then the US population was financially spooked by high gas prices (over $4.5 per gallon, which is a common price is Europe) and started buying more economical vehicles, the process was suddenly reversed. And everybody is happily driving SUVs ever after.
Hi mike,
https://www.eia.gov/analysis/studies/drilling/pdf/upstream.pdf
link above has well costs, $6 million D+C for Bakken, land cost about $2 million
USGS tight oil undiscovered is about 36 Gb
https://energy.usgs.gov/OilGas/AssessmentsData/NationalOilGasAssessment/AssessmentUpdates.aspx
Proved tight oil reserves 11.7 Gb
https://www.eia.gov/naturalgas/crudeoilreserves/
So about 48 Gb of proved reserves plus undiscovered resources (F50).
I agree higher oil prices ($85/b or more) will be needed.
I expect by 2020 this is likely to be correct (oil prices above $85/b), but maybe there is more cheap oil out there than I realize. I expect 400-500 kb/d of tight oil increases each year over the 2017-2021 period, not enough to take care of increased oil demand, OPEC, Russia, Brazil, and Canada will probably not be able to make up the shortfall so stocks will continue to fall and oil prices will rise.
Timing unknown, but my WAG is $75/b by Sept 2018.
I based my $30 net on an example given by shallow sand, but you are correct I remembered incorrectly. His example was $45/b wellhead and $15/b net. Sorry I got it wrong.
Divide my 60 month net income by 2 so $3.3 million for a well that cost $7.3 million (in shallow sand’s example), so in the red by $4.4 billion for those 1100 wells.
Thanks for correcting me.
Hi Mike,
Using shallow sands $7.3 million well cost (8000/1100) and $15/b net, it’s 487 kb over 5 years for payout, for the average 2014 well my estimate is about 250 kb over 5 years.
So $29.20/b net is needed for payout and an increase of $14.20 per barrel in the well price (with no increase in costs) would do it. That would be about $70/b WTI, to take care of debt would require higher prices, though perhaps not another $15/b.
If your estimate of $9 million per well is correct, we would need $36/b net for payout and $77/b WTI, perhaps $8/b extra is needed to cover interest costs, but that would imply about $58 billion in debt if interest is 5% on the debt (assuming Bakken output of about 1000 kb/d).
Rune Likvern estimates cumulative debt at about $35 billion, at 5% interest and 1000 kb/d this implies an extra $5/b in interest cost so about $82/b WTI would be needed if well cost is indeed $9 million per well.
Bottom line, higher oil prices are needed for profits somewhere from $75/b to $82/b WTI, and Rune Likvern’s estimate is about $84/b, but for a point forward estimate breakeven (7% return) is as low as $63/b (for the average 2016 well).
https://fractionalflow.com/2017/10/08/a-little-on-the-profitability-of-the-bakkennd/#more-1235
Yeah, it amazes me when I see companies constantly drilling in areas where I can see they are seriously draining money. They would have to keep borrowing heavy just to drill. On the other hand, there are some companies that get it right. Take one company I know of, specifies that they will drill most of their wells in areas that will only gross them $8 million a year, at $40 oil prices. That’s a serious sweet spot definition. In the Eagleford, that returns most of your capex the first year, if not all.
Hi Guym,
Has that company actually achieved many wells that are that prolific?
What percentage of their wells have achieved what they are claiming?
You don’t have to name the company, I am just wondering if this is investor hype or real results.
It’s EOG, the number of wells and percentages are on their presentations (hype). But in this case, I tend to believe them. On well completions use operator 253162, and check out the initial productions on completions. I think in their hype, they have at least 15 years of that kind of inventory. Basically, they have the richest areas in the Eagle Ford (and the largest Eagle Ford operator), and did an acquisition last year that landed a bunch in the Permian. They did a record well in the Permian this year, and if you check out the wells drilled in Karnes, district 2, about half the wells are in the Austin Chalk sweet spot, which are, overall, outperforming everything else. The percentage is bigger this year, because they dumped a lot of the areas that would produce less than 100k barrels the first year. I know, because they miscalculated and sold part in my area that recently came in at initial production of over 1000 barrels a day. The other leases were held by production at well over 100k the first year. Can’t win em all.
But even though the undrilled part of my property would be coveted by just about any other company, EOG will not drill, because it doesn’t meet their criteria until oil is at close to $70 for a good while. Which is ok by me.
Thanks Guym.
It would be nice to know how much condensate from those nat gas wells is being added as crude. Has that contributed to the increase?
No, it wouldn’t. Don’t find any mention of wells drilled for the primary purpose of flowing gas.
Which is puzzling since there is lots of talk about how rich Bakken gas is in NGLs.
Hi Watcher,
The oil wells produce “associated gas”, this is pretty much true of nearly every oil well.
It is the associated gas that is relatively “wet” and has some NGL which can be recovered if the gas is not flared.
Somewhat not the point, but maybe obliquely.
The point is pre capture, those liquids didn’t get into the truck. Now they do.
Hi Watcher,
I think they get separated at the natural gas processing facility and then go somewhere by pipeline, but perhaps they use trucks.
My point is that there are not many natural gas wells in ND, the gas comes from oil wells and is “associated gas”. Associated with oil production from oil wells.
The associated gas is gathered, taken to a gas plant, most of the C2+ molecules are separated, put in a cold pressurized tank, and shipped by pipeline to a fractionation plant. The fractionation plant ships ethane to chemical plants by pipeline. The C3 and C4 can be shipped by rail, pipeline, barge, etc. c5 is natural gasoline, that’s sent to a refinery.
Search Results
Eyes in the sky raise questions over Saudi oil storage – Financial Times
https://www.ft.com/content/3a1626f2-c47a-11e7-b2bb-322b2cb39656
“…Orbital’s analysis of satellite imagery suggests that Saudi Arabia’s above-ground tanks — whose floating roofs allow them to see when oil inventories are rising or falling by measuring shadows cast across the top of the tanks — have seen no real change in the past 18 months…While Saudi Arabia has reported to Jodi that its oil stocks have declined by about 70m barrels since early 2016, the Orbital analysis suggests the above-ground tanks have actually seen inventories rise marginally over the same period.”
So Ron is right in regard to Saudi. Inventories in storage within Saudi Arabia itself are up. But sales ex storage in other countries keep the money flowing in even while Saudi can claim to have reduced production.
Of course, an oil sale of oil ‘borrowed’ from another country would also allow it to keep income, claim reduction, and store a buffer of oil domestically in case of a ‘geopolitical perturbation’ it is working on.
Will WTI above $50 make a difference? At least in the Tier 1 acreage (sweet spots)…
Bloomberg: Shale drillers are promising to add a new wrinkle to their world-shaking oil boom: they may finally make money.
In third-quarter earnings reports, explorers including Pioneer Natural Resources Co., EOG Resources Inc. and Anadarko Petroleum Corp. said they’re on the cusp of shrinking or even eliminating the gap between operating expenses and the cash they take in. That would mark a turning point for an industry that’s piled up losses and lived on borrowed money for years, as drillers plowed resources into developing new oil plays across the U.S.
https://www.bloomberg.com/news/articles/2017-11-15/shale-goal-in-sight-pump-with-a-profit-without-hurting-growth?
For the zillionth time, free cash flow includes net borrowing.
You can borrow your way to positive cash flow. FCFE (to equity holders) includes net debt. Wanna get really crazy? Consider the fact that it includes preferred issuance but not common issuance.
Cash flow is just another hype parameter.
Gulf of Mexico – HOUSTON (Reuters) – A combined 75,206 barrels per day (bpd) of oil and 215,122 million cubic feet per day of natural gas production are shut-in at four platforms in the wake of a Nov. 8 fire at Royal Dutch Shell’s Enchilada platform, according to U.S. government data.
http://www.reuters.com/article/us-shell-gulfmexico-shutins/about-75000-barrels-per-day-of-gulf-oil-output-still-shut-after-shell-fire-idUSKBN1DG03X
I’m not sure if this will interest anyone, just been looking at ND completions, they are said to have become more variable – whatever that means?
Director’s Cut – Lynn Helms – NDIC Department of Mineral Resources
10/10/2017 – The number of well completions has become highly variable from 95(final) in July to 63 (preliminary) in August.
11/15/2017 – The number of well completions has become highly variable from 84(final) in August to 71 (preliminary) in September.
Also those dips in the number of completions at the start of 2015, I remember reading that they were due to freezing weather. But now looking at the annual review files those dips have been revised out.
Not posting opinions, just facts:
September Texas C&C 76,578,264
Texas RRC – I don’t always remember to note down the initial number but here are the few that I’ve got. Hurricane Harvey reduced output from the Eagle Ford.
Or compare since 2015 (2014 had massive verticals) completions to Dean’s estimates based on initial, to EIA monthly numbers. Bet that would tell a tale. Yes, part of that is Harvey. Then, again, how well were the wells read August 31 during the downpour? As I said before, September will prove nothing. October will. Another month.
Chart
Wow, looks even better charted. As I thought, it really started to diverge after the first quarter.
I was just looking at this, but don’t have enough data 🙂
You can eyeball with the chart above. Predictably, a very strong correlation. October was the lowest completion month, so far. We can, obviously, up production two hundred barrels a day from wherever it finally stops with about six hundred completions a day. Which is probably maxing out current completion crews, but I don’t know that, so just sit back and look at some weird EIA numbers vs some pretty well known numbers. Be even more strange, if EIA weeklies were charted, and current predictions of where it will be by EIA. Through the Looking Glass strange.
Guym – Typos? I am always doing it, but –
“We can, obviously, up production two hundred barrels a day from wherever it finally stops with about six hundred completions a day.”
200 barrels/day??
600 completions per day??
However, you do say “obviously” so I agree with that.
Typo, 200k barrels a day, sorry. 600 completions a month. Not typos, just typing before I think.
The EIA weekly data, STEO, and DPR are not very good. Lately the monthly numbers have also not been very good (since April 2017.) At some point he EIA starts to correct their mistakes and revises their estimates, not clear when that will occur. Based on the most recent RRC data and the correction factors from last month it looks like the EIA’s August 2017 Texas C+C estimate is 240 kb/d too high and Sept Texas C+C output fell another 80 kb/d to 3045 kb/d.
It seems there are no facts, just estimates, we will know in Nov 2019 what, in fact, was output in Sept 2017. Or the way I look at it, we won’t ever know, but we will have a pretty good estimate at that point.
Hi Energy News,
Data below is monthly for Texas C+C in kb/d from Dean’s estimate starting with Nov 2015. Hopefully you can copy and paste for your completion chart for Texas.
3397
3337
3360
3324
3283
3246
3193
3173
3170
3169
3159
3199
3213
3211
3230
3329
3319
3315
3319
3279
3257
3176
Data charted
Looking at Dennis’s chart, and comparing it to EN’s chart does raise some real question as to the number of completions it will take to seriously increase production. If going from 300 to 600 a month, we can only raise it about 200k barrels a month from where it stopped last, how many completions per month will it take to increase it 500k a month? How long will it take to build up frac crews? Or, the next time we get to 600, will it just keep production from falling? I really don’t think anyone can answer these questions. We are lost in the quagmire of the calculations of over a hundred thousand well depletions, drilled at different times in different EUR locations.
Or, we can sit back and just enjoy playing house with EIA and IEA, and pretend we are net exporters with play oil.
Hi GuyM,
Many of the older wells decline at a pretty steady rate (especially when averaged over a large number) maybe 8% to 9%. The field (Permian basin) can be roughly modelled (assuming a fixed, increasing or decreasing well profile) if we have the number of horizontal completions, we can get that at shaleprofile along with an approximate well profile.
On problem that confound the analysis is we must distinguish between Eagle Ford and Permian completions. The Permian recent wells (from 2017) have peak output of about 639 kb/d on average in month 2. Eagle Ford average wells in 2017 have output in month 2 of 594 kb/d. After 12 months cumulative output of recent (2016) Permian wells is 25% higher than Eagle Ford wells. Over time better profitability in the Permian basin may result in a movement of frac crews to the Permian basin from the Eagle Ford. In May 2017, 339 horizontal wells were completed in the Eagle Ford and Permian basin (TX only) based on data at shaleprofile.com. The peak rate was in 2014 at about 600 horizontal wells completed.
I am not sure how accurate the completion data is.
Basically you are correct that changing well profiles and changing completion rates in several different plays makes any analysis a challenge.
Out of curiosity guym, how do you read a well? Are many of them automated in sending data? Any?
Thanks enjoy your posts
Others would be better to ask for Bakken info, but for Texas the well info is posted on the Texas Railroad Commission site. Most of the information can be obtained on the Online Research Queries section. They have completions, permits, and various other queries. Within that section, there is a GIS map section that has all of the producing oil and gas wells in Texas. You have to keep enlarging the map before a well is visible. You can click a drop down to select info per well, unfortunately, production is given per lease, except when there is only one well per lease.
There is more valuable information in the oil and gas section under research and statistics. I would say, start with a completion report to begin with. Has more information on it than I can answer, but there are those here that can. All this is free, but confusing, at first.
To get an example of a completion report, select district 1 or 2 for Eagle Ford, Distrct 7C, 8, or 8A for Permian on the completion query.
Hope I am getting close to answering some of your question. My background is accounting, not a petroleum engineer.
Using Dean’s correction factor from last month the corrected output would be 3046 kb/d for Sept 2017 for Texas. That would be a fall in output of 130 kb/d from the August 2017 corrected estimate from Dean Fantazzini’s methodology (using April 2016 to August 2017 data sets).
Using last month’s correction factors for the August 2017 output data from the RRC gives a somewhat lower estimate than last month of 3123 kb/d, suggesting output fell by 77 kb/d from August to Sept in Texas. Note that this estimate for August 2017 is 243 kb/d lower than the EIA’s August 2017 C+C output estimate for Texas.
Guym – Glad to see you back.
Thanks, just had to take some midol.
Bloomberg Gadfly is saying that the wide Brent-WTI spread is due to a lack of pipelines?
Enterprise Products Partners LP and Energy Transfer Partners LP have new pipelines coming in the next few months that should enable another 550,000 barrels a day of Permian output to reach coastal refineries and ports. These, and other projects, should narrow the gap between WTI and Brent to a more normal level below $4 next year.
https://www.bloomberg.com/news/articles/2017-11-07/wti-crude-prices-aren-t-going-with-the-global-oil-flow
The EIA estimate the Brent-WTI spread needed for exports from Cushing at $3.5/b ($4/b if exporting to Asia)
~$3.50/b from Cushing to U.S. Gulf Coast (I guess this will drop with the new pipelines)
+$0.50/b more expensive to move WTI to Asia than Brent
https://www.eia.gov/petroleum/weekly/archive/2017/171108/includes/analysis_print.php
Hi,
Here are my Bakken updates. The production graph looks strange this month. Production for most years increased a bit and the ones that did not increase declined less than expected. So something is happening. Number of production days did not change much compared to previous month, so that is not the reason.
Looking at the GOR graph we can see that GOR decreased for all years except 2007 and 2009. The increased oil production suggests that they pumped up the oil faster. But then I would have expected increasing GOR. Instead we se decreasing GOR. So what is going on?
Freddy, this graph in particular. There are frequent items of hype about new technique this and new technique that. We could only assess that from the segment chopped off at the top of the graph.
This has come up before and there was a reason, but I don’t remember it. It would be late 2016 and onwards.
Arghh, comment put below the wrong graph. I meant the yearly production.
Yes up until 2015 we have not seen much improvements. Higher initial production has been followed by higher decline rates. However 2016 looks quite a lot better so far. But I think high grading plays a big role there.
Depletion is what is going on. GOR increases, then decreases, in gas expansion driven shale containers (this term in lieu of ‘reservoirs,’ which I do believe they are). There are some good articles out now suggesting shale containers may actually be ‘oil expansion’ driven. Nothing lasts forever; declining GOR is an example of that. We are beginning to see the fallacy in doing DCA on a shale well within the first year of production; those long tails won’t end up being very long after all.
This stupid ‘halo’ thing is meaningless. Think of a new frac creating a brief water flood affect to nearby, shut in wells, or that induced energy from the new frac creates a sort of pressure wave that travels toward a pressure sink created by nearby older wells. This so called halo BS does nothing more than speed up the rate of withdrawal in offsetting wells; it is not increasing UR. Drilling $9M wells that communicate with each other is really economically stupid.
There are no production ESTIMATES in Texas. The day that barrel or MCF leaves the lease premise it is accounted for and reported to the TRRC, by both the seller and the buyer. Hundreds of billions of dollars are exchanged by this process, each month, for the previous month’s production. Rarely, almost never, do people give money back and it is distributed to someone else based on estimates. This argument is ridiculous. The EIA surveys a handful of large companies in Texas but no operator in Texas reports production to the EIA. The delayed data that gets a few peoples panties in a bunch is very real, very accurate, including deductions for BS&W and pipeline shrinkage and can be found under ‘pending,’ filed under drilling permit numbers. Once the completion data is processed on a new well that production is moved lease ID numbers and made public. In the mean time the folks in Texas who need to know what there production is, do know. Enno Peters pretty much has this all figured out now for those that so desperately need to know and can’t do the research themselves. I have been an oil operator for a half century; the TRRC regulates the snot out of my industry and has taught the entire rest of the world how to regulate the oil and gas industry. There is nothing embarrassing about the TRRC.
Oil and gas extraction in America is undertaken by private enterprise. It is not a video/internet game, it is a BUSINESS. Increased productivity does not equate to profitability. Now the US LTO industry, trapped like goats in a pen with massive amounts of debt, will never, short of much, much higher oil prices, sustained, be profitable ENOUGH.
The American shale oil phenomena is a financial disaster. Ignore that at your own peril.
Hi Mike,
Yes the RRC is great. I am referring to the online research query that is straightforward to use, I do not have the programming skills of Enno Peters and to get easy access to the pending file, I believe a subscription is needed.
Even if the pending file is included we don’t have accurate final data (in terms of final output numbers).
I guess we are talking past each other. Every barrel reported by the RRC has been produced, that is not in question. Currently do we know the total crude plus condensate that was produced in September in Texas?
If the answer is yes can you tell us, please?
I would report the actual number if I knew what it was, otherwise I would need to estimate what the final complete output number would be.
It is all good, we will know what the output is in about 4 months (using the data reported by Drilling info, which adds the online data query with the pending file).
The EIA has data from drilling info at
https://www.eia.gov/petroleum/production/
Chart below shows 914 survey data, EIA, RRC, Drilling info and Dean Fantazzini’s estimate. The 914 survey covers about 89% to 92% of total Texas output, on average, we can get a rough estimate by assuming the 914 survey is about 90% of final output for the most recent 4 months and use the drilling info data for other earlier months.
The RRC does a great job regulating the industry and Enno Peters does a great job with the data on that we might agree.
That rough estimate of 914 survey divided by 0.9 (assumed that 914 survey covers 90% of Texas output) is compared with drilling info and Dean Fantazzini’s estimate in chart below (data only through August 2017).
Duh! Missed that all along, although I have used that query many times. I wonder how Eno does them all? Only thing I can think of is to do a wild card search. Pending is not included in initial production. Makes sense now. I could not imagine royalty owners missing payments for 18 months. I am sure there are some independent producers that make up the small difference, especially if they own the mineral rights. Overall, I agree, unless prices go up, the majority of independent producers don’t have enough to high grade at these prices.
Ok, I see, he probably pays $10 for it with the RRC (pending leases). I hadn’t seen all these data dumps before. Probably not the only thing I have missed. Next month it will be in csv format, instead of Oracle. Not that expensive.
http://www.rrc.state.tx.us/about-us/resource-center/research/data-sets-available-for-purchase/production-data/
Hi Guym,
I am a cheapskate, so I will just use the EIA information when it gets released, I think the drilling info data includes the pending leases, or that is what I have been told. I imagine shallow sand or Mike or someone subscribes to drilling info and could fill us in with the latest data from Texas, or if you get the pending lease data maybe you could tell us.
Not sure what I will get, and when, but I will try. Unless, Eno feels like donating that number. Not even going to try with September.
Hi guym,
http://www.rrc.state.tx.us/media/42749/own423_20171110_rrc180_sep2017.pdf
Aug 2017 output 2534 kb/d (“final statement”) at link above, compare to 3336 kb/d assuming 914 survey covers 90% of output, that’s only 76% of the higher number. A similar comparison of final statement for Aug 2016 (in Sept 2016 link) and comparing to drilling info data shows about 81% of drilling info data in RRC final statement.
It is not clear why the RRC doesn’t use its own pending lease file when making these final statements. For example they report 2630 kb/d for July 2017 on Oct 17, 2017 and the EIA reports drilling info data of 3083 kb/d on Oct 31, 2017, a 453 kb/d discrepancy. I just don’t understand, but I guess I am impatient. In any case the RRC does a great job and it’s not my state or my industry.
Hi Mike,
On the lack of estimates by the RRC, I found this:
* Preliminary Crude Oil & Gas Well Gas Monthly Production Total – Significant changes to the preliminary production figures will occur in decreasing amounts for approximately six to eight months due to the filing of corrected and late reports by industry. Commission staff anticipates that the production totals following that period are substantially complete, although continued minor changes occur thereafter. There is no point beyond which an operator may not file corrected production reports.
http://www.rrc.state.tx.us/oil-gas/research-and-statistics/production-data/texas-monthly-oil-gas-production/
To my mind the number reported on that page for the most recent month (currently August 2017) would be an “estimate” of final output. You may call it something different. I don’t speak Texan. 🙂
For August 2017 they list 2683 kb/d for Texas crude plus condensate output (I divided the number listed by 31,000 to convert from barrels per month to kilobarrels per day.)
Dennis, you may call it “estimates” if you must; hell, you can make dumb, snarky remarks about the Texas Railroad Commission all you want. I don’t care and I assure you, neither does the rest of Texas. As I have said, the people that need to know in Texas, do know. People like yourself ultimately get to know, but it is on our time frame, not yours. A few months here, a few months there, is nothing in the great scheme of life. You’ll be alright, I promise.
I think for you to accomplish want it appears you need to accomplish, that being some sort of successful prediction, you should not worry so much about a few months of confusing production data in Texas and instead focus on oil prices and the financial plight of the shale oil industry. For it, the shale industry, to deliver on your predictions it must start doing something significantly different than it has done in the past. That is, it must pay back its debt and become profitable.
If the shale oil industry borrows money to drill a stinking well that declines 75% in the first 60 months of its life time, it needs to pay that money back in 60 months. It hasn’t. Now it is so far behind it can never catch up. It baffles me plum to death that people don’t get that.
I simply wish to remind everyone that our hydrocarbon industry in America is in the hands of private enterprise; it’s a business and for business to work, it must be profitable. Not a quarter every four years, depending on how gracious OPEC feels, but consistently profitable, year after year. The shale oil industry has never been profitable, not even at higher prices. You are an economist, Dennis; you of all people should understand that.
Mike,
Always appreciate the CANDID & REALISTIC comments. I wanted to share something with you, but can’t do it in the public realm. If you are interested, please email me at:
[email protected]
thanks,
steve
Hi Mike,
Yes I don’t worry about the RRC, they do a fine job.
Many people are interested in the latest data, but for Texas C+C output, we have to be patient as you have mentioned on many occasions.
I imagine there are a number of people who have access to drilling info data or the Texas C+C pending leases file.
If there is anyone willing to share that information anonymously they can email it to peakoilbarrel.com.
That is probably the best data we have.
On the economics, Rune Likvern does the best job in my opinion and I agree with his assessment.
His blog is called Fractional Flow and a recent analysis of the Bakken can be found below.
https://fractionalflow.com/2017/10/08/a-little-on-the-profitability-of-the-bakkennd/
I think I have been pretty consistent in saying that it is a mystery to me why wells continue to be completed by tight oil focused companies.
I also think I have consistently said that higher oil prices will be needed for tight oil to be profitable.
In short I agree with you.
I apologize for saying anything negative about the RRC, I will reserve negative comments for the EIA (hopefully that’s ok even though a Texan now runs the DOE 🙂 ).
I think we don’t agree on future prices, I think most of the predictions of low oil prices forever will be incorrect. Oil output will grow more slowly than demand for oil at low oil prices, supply will become short and oil prices will increase.
In my opinion, this is likely (greater than 66% chance) to occur within a year with oil prices rising to $75/b (monthly average) or higher by Oct 2018. At that point many tight oil producers may be profitable on a point forward basis, about $85/b average prices might be needed over a 5 year period to pay off debts (and cover interest payments).
This price level also seems pretty likely from 2019-2024 as supply will have difficulty meeting demand even at $85 to $90/b in my opinion.
Note that the USGS undiscovered F95 estimate plus 2P reserves is about 38 Gb. If my guesses for future oil prices are correct, this is the minimum we can expect to be produced imo.
Mike,
Yes maybe it´s depletion and wells are running out of gas. I was considering that. If GOR is high then gas suppresses oil production. So at least logically there could be a temporary boost in oil production as GOR goes down and there is less and less suppression. But it seems to happen everywhere at the same time. I would have though the more mature areas would be affected first. But Mountrail, which I consider the most mature area, appears to be the least affected. So I’m not sure…
Freddy W – could the GOR issue just be a result of the increased flaring (i.e. gas not recorded as sales)?
I use produced gas, so it shouldnt. In the flared gas graph I use gas produced and gas sold and assume that the gas which is not sold is flared.
I suggest you check for slope (derivative) changes associated with the weather. I’ve worked in areas where GOR dropped when we had very cold fronts, flowlines and separators cooled down, and sales contracts allowed us to ship fizzy oil by pipeline. But this gas comes out at the central plant where the oil has to meet vapor pressure specifications. So the question is whether the regulators change gas accounting properly.
But then it should go down every winter and it doesn´t do that.
Here we can see that GOR decreased mostly in McKenzie, Dunn and Williams. But also slightly in Mountrail.
Freddy
Your graphs are showing the impact on older wells – by definition, located in the core of the core – of the newer, nearby wells that have indisputably been drilled in these best areas for the last 24 months or so.
That is to say, operators in the Bakken are now normally completing 2 to 3 wells at a time on a pad with at least one older well already in production.
The terms being used are frequently ‘parent/child’ wells.
These operators are familiar with competitors techniques, but regularly stay silent on specific, detailed procedures.
I say all that because the entire downspacing protocols are enormously influential on how much hydrocarbon will ultimately be extracted.
As you are aware, I’ve done ‘halo hunting’ on approximately 130 wells with dramatic uptick in production in about 110 when nearby wells were frac’d.
If you want to check this for yourself, the procedure is straightforward.
Get the DMR basic subscription.
Scan the Gis map for any random energy corridor (preferably in the core).
Pick out older wells by their permit # that have a few newer wells adjacent.
Check the production history.
You should find – both via oil/gas output as well as produced water – that these older wells increase production (as your above graphs show) coincident when the new wells are frac’d.
I guess the main issue is if the adopted techniques/practices increase the recovery rate or mainly shift production in time (more now but higher decline rate in the future). I guess it is some combination but it will take several years before we know (or those of us not working in the shale plays will know – some people probably already know the answer).
Also, the flipside of “high grading” is that remaining projects are inferior. Price needs to rise or technologies improve (how?) to make reaming projects attractive.
The whole matter of accelerated production versus increasing ultimate, overall recovery has been a contentious issue for several years now.
The phrase ‘pulling production forward’ has been used by some who feel hydrocarbon recovery has not increased, but simply taken place sooner rather than later.
All the operators claim vastly higher EURs from newer wells in general.
I do not know the answer, and rather focus on proven, displayed production numbers alongside ever evolving procedures that might indicate future trends.
Many factors, naturally, play into this with the permeability of the rock being highly significant.
A commentator on Filloon’s latest post used Enno’s data to get the 10 highest oil cums from horizontals in wells started in 2016/2017.
His numbers ranged from almost half million barrels to over 800,000, mostly from EF and AC formations which, I believe, are relatively permeable compared to marble-like lower Bakken.
(Interestingly, one well was from the Powder River Basin).
So, now the ever-present components of economics looms large.
If enormous amounts of oil are recovered early in a well’s life, is it worthwhile to do so?
Apparently EOG, and others, think so.
In a related aside, Core Lab’s CEO has stated that the effective use of micro proppants (still in the early stages of use and evaluation) will extend the productive ‘tail’ of wells due to the added distance the liquids must travel to get to the wellbore as the fractures have become WAY more complex. (Notably, this is NOT an increase in frac half length).
This, in addition to these newly-propped pathways are even WAY tinier than earlier wells.
FWIW, this CEO is on record with a number of other researchers to claim that the Stimulated Reservoir Volume -SVR – can be increase ten fold via successful use of microproppants.
Your final question regarding current high grading/remaining areas has great relevance for many reasons.
When operators can now drill from spud to TD in 4 to 14 days – which is occurring all over – when completing 3,6,30 wells at a time (Rice and Encana being the leaders here), when high, early recovery rates provide upfront revenue … all these and more expand potential development areas both in existing plays and lesser known trends such as the PRB, Unita, TMS, Rogersville and more.
There is another topic that is just starting to appear which may or may not pan out, that is, smaller operators in Colorado, Ohio, and elsewhere are trying ‘big boy’ techniques in shallower, less expensive formations.
Early times in evaluating effectiveness, but so called unconventional hydrocarbon production is actually expanding, not in its twilight.
Hi Coffeguyzz,
It is the productivity of the average well that matters,
for the average 2016 US well it is about 185 kb cumulative through 60 months. Assume an $8 million well and $20/b net at $55/b WTI and that payout by 60 months is needed for profitability, in this case we need $43.25/b net for a profitable well. So assuming fixed costs (these go up usually with higher field activity), for profitable average wells, we would need $78.25/b WTI, if we ignore the high debt load and interest payments of the industry.
This is the straightforward explanation for why most of these tight oil focused companies lose money almost every quarter.
It is also the reason that over the long run, either oil prices will go up or many of these companies will go bankrupt.
Meant to add chart below. Slightly bigger chart by clicking, quality not good sorry.
https://shaleprofile.com/index.php/2017/11/09/us-update-through-july-2017/
From Directors cut:
“The percentage of gas flared increased to 17% primarily due to six force majeure events.”
Not sure what those force majeur events were. In bellow graph we can see that precentage of flared gas increased mostly in Dunn but also in McKenzie and Williams. It did not change much in Mountrail.
Maybe we cannot trust the gas production numbers because of the force majeure events. At least that is the only explaination I can think of right now.
I did notice one thing now. Even though average number of production days did not change much, the percentage of producing wells did. So perhaps those wells that were put back on production has a relatively high oil production and low gas production.
If there were older shut in wells put back on, likely a flush of production in the first few weeks, that will tail off.
I have wondered if this accounts for the “halo” effect, at least in part.
My best example from personal experience was a well we owned at one time. It had been shut in for 3 years or so.
Made over 50 BO first 24 hours, by the end of one production week it pumped off. We pumped it one day on and three days off thereafter. Averaged 2-3 BO on days pumped.
I understand most older LTO wells are not pumped continuously. By older, I mean 5+ years.
Shallow
The length of time these older wells are offline seems to average about 3 months.
In the past year, though, many wells are down for 6 months.
When they are turned back online, it is common for production to equal (sometimes exceed) the very original production numbers.
These guys – in the Bakken, at least – have been doing a lot of innovative work as these wells are getting closer together, but they rarely discuss in detail what is going on.
In 2017, in the Bakken, something different is definitely occurring as the produced water coming from parent wells is regularly double initial produced water numbers after being offline for 3 to 6 months.
Oil/gas stays elevated for 8 months or so.
coffeeguyzz and shallow sand,
I am well aware of the “halo effect”. I think it was I who first discovered the phenomena a long time ago. However I have not seen it affecting all years at the same time before. Of course, the wells are getting closer and closer so more and more wells should be affected. But still… It could be one of several reasons and old wells where pressure has been built up is being put back on production is another. I would need to look into the data more deeply. But that would require a lot of work, so I´ll see if I get time to do some more investigations.
I believe the force majeure was due to a gas processing plant having problems.
The oil and associated gas production continued with the excess gas being flared.
Ok thanks. Does Mountrail use another gas processing plant as it was not affected?
I did some more investigations. I looked at average oil and gas production from wells that restarted production the same month or restarted production previous month (as on average they only produce for half the month during the first month so most of the increase will be visible the month after). They may have restarted production either because they were shut in while nearby wells were fracked (halo effect) or perhaps were refacked or they have been shut in for some time for other reasons. So here are my findings for a few of the years:
2010:
The restarted wells did have a positive effect production, but the effect was not that much more than what it has been before. I calculated that it could only explain maybe 50% of the increase. GOR was also lower for those wells but can only explain a small part of the GOR decrease.
2011:
Here the production increase was only small and the restarted wells can explain all of that increase. The GOR decrease was also small but the restarted wells could not really explain all of that decrease.
2014:
Similar to 2010. The restarted wells contributed more than usual to production, but could not really explain why it was as high as it was. For GOR they could only explain a small part of the decrease.
So to conclude. The restarted wells only contributed to some of the production increases and only a small part of the GOR decreases. So it´s still a mystery whats going on. Maybe it´s depetion related after all as discussed with Mike.
I looked a bit more into it and I found examples of wells where production ramped up slowly over several months after being suspended for some months and wells that were producing most of the month or even the whole month while there was apparent fracking going on nearby. So the method I used will not find all those wells I was looking for which means the halo effect or restarting of suspended wells can still be the reason for the increases.
For GOR something similar happened last winter when there were also gas capturing problems. Then GOR dropped and then increased again after the problems were solved. So I don´t think we can trust the GOR numbers. We have to wait one or two months and see what happens.
A Long Time Coming: Offshore Project Sanctioning
I can’t recall this being posted, but it’s from August (the text and chart don’t necessarily agree with the headline, depending on how you read it). Offshore investment continues to decline, especially in the larger projects. Since it was issued I can’t remember anything else large being approved except Johan Castberg, which seems pretty close if not quite at FID. For large to mega projects gas numbers are beating oil by two or three to one.
https://clarksonsresearch.wordpress.com/2017/08/03/a-long-time-coming-offshore-project-sanctioning/
More pipeline drama, coming after the spill.
Dakota Access Pipeline Company Paid Mercenaries to Build Conspiracy Lawsuit Against Environmentalists
https://theintercept.com/2017/11/15/dakota-access-pipeline-dapl-tigerswan-energy-transfer-partners-rico-lawsuit/
New developments with Venezuela and their oil company.
“Several intellectuals, such as former Minister for Basic Industries and Mining Victor Alvarez, have urged the government to default on its debt in favor of investing in national production.
This position found an unexpected advocate last week when opposition head of the National Assembly and First Justice leader Julio Borges also called on the government to default and restructure its debt repayments. ”
This does not mean the opposition is joining with Maduro. This guy has written to Goldman all year long demanding that they lend no more money and told Goldman that a future opposition government would default on any loans provided the Maduro govt, and so they better not lend any. This would seem to be pre-emptive punishment.
But it does mean Ven thinkers are outside the box and may have come to understand that oil is rather more important than money.
And this before the restructuring mtg of this past Monday;
“The top-level consultation took place despite warnings from the US Treasury to creditors last week that it would be extremely “problematic” for US financial institutions to attend. Any agencies thought to be breaking US economic sanctions against Venezuela could face heavy corporate fines and jail time of up to ten years. ”
They not only want payments obstructed, they are threatening bondholders with jail if a way to take payments is found.
“Last Friday international press reported that Venezuela’s state-owned energy utility CORPOLEC had defaulted on a bond interest payment worth more than USD$650 million. Venezuelan authorities later responded that the payment had been made but arrived late.
The Venezuelan government has since reiterated its commitment to making foreign debt repayments, while state oil company PDVSA confirmed Wednesday that it had made payments on a string of its bonds.”
Though China has reportedly made no offer of debt relief to Venezuela, Foreign Ministry spokesperson Geng Shuang reiterated to press Thursday that his government believed Venezuela was “capable of adequately managing the debt problem”.
“We hope that the parties involved can settle the matter through consultation. At present, financial cooperation between China and Venezuela continues as normal,” he added.
Ven’s oil company owes about 9B to Rosneft and some other entity owes 23B to China. Neither Russia nor China seems to care what S&P or ISDA says.
“The South American country now has 10 years to pay its debt to Russia, although it is expected to make “minimal” payments within the first six years, the Kremlin said.”
That’s 10 yrs. The first 6 yrs will have token payments. They are not going to allow regime change by financial force.
Some of the past debt to Russia, it should be noted, was to buy Russian weapons. This is normal stuff. The US has various programs ongoing where they loan money to a country, which then buys US weapons. Greece was required to buy European weapons with some of its ECB bailout money. All normal stuff. The point being a failure to repay such loans doesn’t bother the lender much because they made a profit on the weapons sale, and money is created from thin air anyway.
https://oilprice.com/Energy/Crude-Oil/Chinese-Crude-Inventories-Fall-For-First-Time-In-12-Months.html
China not having trouble using oil.
About Venezuelan debt, the size of a debt means doesn’t mean a whole lot, except when you also ask about the ability of the debtor to pay.
It appears to me that the Maduro regime is just about out of repayment options.
So, it isn’t the size that is important, but what you do with it is important? Sorry, couldn’t contain myself.
https://www.marketwatch.com/story/oil-climbs-in-electronic-trade-as-isda-rules-that-pdvsa-and-venezuela-defaulted-on-debts-2017-11-16
The credit debt swaps were only 1.5 billion of the total.
Goldman Sucks is probably sucking wind.
Another item important to understand . . . repayment of loans is the last thing the NY banks want.
Not in the context of influence. In the context of earning interest. The problem with Venezuela all along is they don’t borrow much money. 28% of GDP contrasted with over 100% of GDP for the US (25% of which has its own central bank as the lender). The NY banks are being denied income by this refusal to borrow.
And worse . . . what borrowing there is has shifted to Russia and China and won’t require the US banking network for flow. Venezuela has the ultimate collateral underground and refuse to involve NYC.
THIS is the source of the demonization.
So NY banks should be quaking in their boots, because Ven won’t borrow from them?
It’s ok, I am sure they would have to pay a premium, but I heard Goldman Sucks has billions the NY banks could still buy up.
There is a bit of that. Maybe more so the evolution of Russia and China’s alternate payment networks that eliminates US banking power.
Hell, Bitcoin does that. However, you have to be able to fund it.
Mac–
Not really.
What they do lack are the paths to pay those debts with US sanctions.
They have very little government debt.
Maybe Maduro has cash enough to pay GOVERNMENT debt as such.
The country is sure as hell busted, economically and politically.
The people there are in one hell of a fix, even if they happen to be Maduro supporters.
It’s my firm opinion that Maduro and company are about as low as the proverbial snake’s belly, as low as it is possible to be.
YMMV.
Guys, “Hightrekker”‘s baloney parallels regime propaganda so closely I have to conclude he’s plugged in to their talking points, may even be on the regime payroll. The maduro regime can’t pay because it lacks cash flow. It lacks cash flow because it destroyed the Venezuelan economy.
It’s useful to see how government social media propaganda gets distributed, and the level of sophistication of their scriptwriters. Hightrekker isn’t a professional, but hee/she does seem to be getting official talking points.
Hightrekker has been on my ignore list for quite awhile. I don’t remember why I chose to hide his posts, but I never see what he posts.
On this date: (Nov 20th)
1975 — Spain: The Beloved & Respected Comrade Leader Fascist Dictator Francisco Franco (for 36 years) dies (& he’s still dead!) He is replaced by another General — General Rejoicing (!!).
https://oilprice.com/Energy/Energy-General/Oil-Tycoon-Hamm-Slams-EIAs-Overoptimistic-Shale-Forecasts.html
Can’t believe Perry is not listening to him. However, waiting until after OPEC makes a move is probably wise.
Guym.
Have you seen the calculation of how much CLR lost by cashing in their oil hedges in late 2014?
I could figure it, but I have gotten a little lazy in looking at the 10K’s
Lol, forgot about that one. I will look, but I doubt they calculated it. Should have been. Hamm said, something to the effect that he was so confident that the price would go up, he was going to sell all his hedges for a profit. The price then went dowwwnnn, and then dowwnn some more!
https://seekingalpha.com/amp/article/3294555-continental-resources-billion-dollar-blunder
Not written well, years are off in article, but roughly one billion, less the $400 million gain on it.
Net loss in 2015 was about 350 million, and the profit via hedge would have made it a net profit of over 400 million.
The leading contenders for the EIA were Hamm and Perry. Proves Trump has a sense of humor. Sick sense of humor, but humor.
https://oilprice.com/Alternative-Energy/Renewable-Energy/Teslas-Surprise-Unveiling-Reveals-Fastest-Production-Car-Ever.html
Ok, I could definitely live with this one.
Unlikely it’ll corner at all well. Massive battery bricks at speed prefer continuing in a straight line, as per Mr Newton!
It also has a $200,000 price tag. Every action, has a reaction, equal in force, and in the opposite direction. Which is exactly the direction I will go in with that price tag.
http://market-ticker.org
Is Tesla On The Verge of Bankruptcy?
[Comments enabled]
If you want one of their alleged “Super-Roadsters” you need to ante up $5,000 now plus $245,000 more within 10 days by wire transfer.
Note that the car will not be “ready” and “deliverable” for three years according to Master Touter Musk.
What happens if “three years” turns into “never”?
You flushed $250,000 down the toilet.
May I remind you that Tesla is a money-losing enterprise and has been since it was founded. It has never made a profit, it has zero in retained earnings and you will be an unsecured, back-of-the-line creditor with your “reservation” — which they will spend the minute it comes in the door.
If the “Reservation” was a modest amount of money this might be defensible. $5,000 as a punt on a “supercar”? Sure, why not.
When it’s a quarter of a million bucks it not only is indefensible in my opinion the solicitation of same borders on criminal fraud since the company has absolutely no reasonable reason to believe it will be able to ever deliver said car.
Let me remind you that their “example” shown was damn fast and impressive.
It also almost-assuredly had nearly zero range, was “damn fast” because it intentionally had nearly no battery in it and thus might have had a range of a few miles in its “present” configuration which was simply “stick big electric amp-sucker on each wheel and it breaks the 3-second barrier, damn actual ability to use said vehicle for more than a stunt showing to Hell.”
You cannot get around physics folks. Tesla is betting you will fork up a quarter million dollars for something they cannot deliver now, might never be able to deliver as I suspect the technology necessary in the battery department to do it within the weight and power budget does not currently exist in a form that can be manufactured and further, the company may not exist in three years as it only does so today due to being able to continually go back to the well of Wall Street and either issue more stock or debt to fund the charismatic preaching of Elon Musk which thus far has translated into losing money on each vehicle made.
One “market disruption” that occurs at the wrong time and Tesla is literally out of money and out of business.
If that happens, which I believe is quite likely, your $250 large is going to go “poof” like a fart in a church.
Oh, may I remind you that EV subsidies, which have enabled Tesla to run a “tax farm”, are going away — and may well precipitate that “market disruption”?
Musk ought to be in prison for running this crap.
It’s only 5k$ ante – for someone being able to buy toy cars for 250k$ kind of peanuts.
And it has to have a big battery, bigger than model S now. Without that, it couldn’t get enough current for the 2 seconds and the quartermile. Small batteries will just break down without delivering anything.
But it is in no way rocket science – just tech in 3 years.
Why?
Because you can alreay buy a car like this:
https://www.nio.io/
Ok, it costs 1.5 Million $, and is produced in smallest numbers by a sports car manufactur. But it’s the fastest street car on the Hockenheim Nordring already, and not in 3 years. Tesla has to top this.
It has 335 hp on each wheel, totally 1MW.
Hi Texas Tea,
The EV subsidies are expected to expire within 15 months for GM and Tesla (those two have sold the most “battery” cars) under current law.
Nobody expected that to change and Tesla will sell every Model 3 that it produces (already 500,000 people or more have put down deposits for the Model 3). After 200,000 vehicles the EV rebates phase out over 15 months and both GM and Tesla have sold 150,000 vehicles already.
EV subsidies being removed will actually help Tesla (and GM) because those companies late to the game (Ford, Toyota, and Honda) will not get as many subsidies.
Companies that are growing rapidly often are not profitable as they spend a lot of capital to expand.
The Roadster has 600 miles of range. With a 200 kWhr battery pack (2 times larger than the largest available on the Model S or Model X).
Too much money for me, I like the Model 3 for 50k.
Good in a straight line.
Unfortunately, the physical world is far from linear.
Texas RRC numbers for September are out and they show for all categories huge declines in production from last year. This is especially true for condensate (see below chart red line). Production has never shown any material recovery since its peak in 2015. The year over year change (green line in below chart) shows also excellent predictive power and predicts far steeper declines ahead. True, the latest data points are adjusted upwards, yet the chart clearly shows that the trend is steeply downwards and no recovery at all is in sight. And these data also contain the Permian. The RRC data are also confirmed by data from companies which reported in most cases year over year declines or stagnating production (BHP, CHK,…).
These data are in stark contrast with the EIA numbers, which show a substantial recovery of production in 2017. The big question is where does the production increase come from, if not from Texas? Bakken is simply too small to explain a one mill bbl/d production increase and Alaska, GOM and Caliornia are maturing and declining fields. So, what is correct? We will find out soon. The market has already reacted as the dollar/oil ratio declined the first time in over three years. This indicates that the US is not anymore considered as an oil producer, but an oil consumer: dollar is down when oil is up.
Maybe Dennis has a graph with the adjusted numbers using Dean’s method? It´s hard to say anything by only looking at the raw data.
All this has been discussed above. Discussion and meaningful charts. Use 3050 as September on Dennis’s chart above, which he calculates to be September. Chart only reflects through August. Interestingly, it is almost the same as EN chart which just added an estimate of 500 barrels to RRC initial production. You have to remember that Harvey results are in August and July. Although, October had historically the lowest number of completions in Texas at 257, so not a likely big increase in Oct over Sept. Through the discussions between Mike and Dennis, I found where to obtain most of the “missing” barrels, and will try to buy and include for next month’s analysis.
Guym,
The message of the my chart is that far steeper declines are ahead. The chart has been right over the last five years – for the upside and the downside.
Freddy,
It is possible to see the trend from the chart. And the year over year change has great predictive power. The key message comes from the dollar/oil ratio, which has plunged over the latest months. This indicates that the dollar does not get relief from increased oil production and falls. Also the trade numbers confirm the trend of increasing oil imports (up by USD 50 bn towards 150 bn ytd).
I expect completions to remain low through December, where production finally ends up at, is going to be interesting. From the low point in December, they will probably kick up completions in January to closer to a six hundred a month completion rate. Which could raise production another 200k barrels a month through the first quarter. Frac crews can not be added very quickly, so it should be interesting to see how it plays out the rest of 2018.
Hi Guym,
A lot depends on where the completions are. As you have pointed out some acres are much better than others so where the wells are completed is a big factor.
Hi Heinrich,
Condensate is not very interesting and tells us little, how about C+C?
Also RRC data tells us little without pending lease output. Texas C+C was about 3450 kb/d in July about 150 kb/d below previous (near term) peak in March 2015 (3600 kb/d). Output declined in August and September as expected due to severe weather. Maybe 3320 kb/d in August and 3200 kb/d in Sept 2017 for Texas C+C output. Higher oil prices of late may result in a gradual increase back to 3600 kb/d (or more) by next April.
The numbers you just quoted don’t jive to the numbers you gave above to EN. That is 3257 for July, 3176 for August, and 3045 for September. September was in a different post to me.
Hi Guym,
Those numbers are based on the second chart using drilling info data and the 914 survey. The drilling info data is pretty good up to the most recent 4 months, after that 914 survey divided by 0.9 (where it is assumed 90% of output is represented by 914 survey data) gives a better estimate, that is what I used through August 2017, Dean’s method seems to underestimate output a bit for recent months ( by about 200 kb/d) so I added about 200 kb/d.
For Texas it’s all a guess for the most recent 4 months, we must be patient and wait 4 months or so before we know what Sept output is, unless we want to estimate.
Hi Guym,
I went back and looked at several old data sets from the EIA.
The drilling info data is pretty accurate for all but the most recent 2 months with the most recent month about 9.3% too low and the next earlier month about 0.4% too low, the most recent 6 months, except the most recent month are all within 0.4% of the most recent estimates from drilling info. I used 8 data sets with most recent data from Dec 2015, Feb 2016, May 2016, Feb 2017, April 2017, May 2017, June 2017, and Aug 2017. The earlier 7 data sets were compared with the August 2017 data set, which was assumed to be the most accurate.
Also I found the drilling info estimates were a bit too high for all but the most recent 2 months of the most recent 12 months reported (though it was within 0.4% on average for the most recent 6 months, with the exception of the most recent month).
Using the recent drilling info estimate compared to the 914 survey data for the April 2015 to August 2016 period (where full data was likely to be reported fairly accurately) the 914 survey was 90.67% of the drilling info data over that period. The most recent 2 months of drilling info data are “corrected” by dividing July by 0.9068 and June by 0.9957, for August we estimate by using 914 survey divided by 0.911 (ratio of 914 July data to July estimate).
Dennis, condensate goes hand in hand with other production. It is the canary in the coal mine and my chart has great predictive power , predicting much lower growth ahead.
Karnak says; “canary in the coal mine will not breathe gas, but will turn black”. Karnak, the Magnificent also says, “oil production may go down, a little. Then next year, and the years after, it will rise like the great Phoenix”. Karnak projections are free to the public, no donations needed.
Hi Heinrich,
I disagree. Condensate output in Texas is based natural gas completions, which will depend in large part on natural gas prices ( and the price of NGL to some degree). It will move independently of crude oil output, which will be influenced by oil prices.
You are wrong about Texas C+C output if you believe it will be going down steeply, just as in the past you overestimated how steeply tight oil output would fall.
According to the condensate chart I am spot on. But of course it is ‘ not official’.
Hi Heinrich,
Your prediction was for C+C, nobody cares about condensate only, show us the C+C chart. You were predicting about a 1 million barrel per day drop in tight oil output, it dropped by about 588 kb/d over an 18 month period. The annual rate of decrease was 415 kb/d (slope of trend line from March 2015 to September 2016).
From Sept 2016 to Sept 2017 tight oil output has increased at an annual rate of 656 kb/d and the March 2015 peak has been surpassed.
See tight oil production estimates at link below
https://www.eia.gov/petroleum/data.php#crude
The RRC is great, but drilling info data is better see
https://www.eia.gov/petroleum/production/
and click on “crude oil comparisons with other estimates” on right side of page below table 5.
Drillinginfo gets it’s data from the RRC.
Hi Timthetiny,
Yes that is correct, but drilling info includes data from pending leases (no number assigned yet maybe) which I do not have access to.
The drilling info data (RRC online query plus pending data) is quite good except the most recent month reported which is about 9% too low.
Also 914 survey data divided by 0.915 gives a pretty good estimate (fairly close to the drilling info data).
Dennis, what I am questioning is the mismatch between EIA data and RRC data, which I have mentionned already one month ago and which has been discussed also in this forum above. The difference is very strong in condensate and to a lesser degree in crude, yet the difference is significant. There is much more explaining by the EIA required how they get their numbers.
Hi Heinrich,
From
https://www.eia.gov/petroleum/production/
There is a good explanation at
https://www.eia.gov/petroleum/production/pdf/eia914methodology.pdf
All you need is right there.
See also
https://www.eia.gov/petroleum/production/xls/comp-stat-oil.xlsx
Note that the EIA does not report condensate separately, it is not clear why you choose to focus on condensate.
There is no way to compare EIA “condensate” and the condensate reported by the RRC, EIA reports crude plus condensate so comparing apples to apples would probably be better.
The difference between the RRC online query and the EIA estimate is that the RRC data is incomplete, especially for the most recent 12 to 18 months with the most recent month the most incomplete (20 to 25% of the data is missing) and gradually getting more accurate as you go farther back in time.
The EIA surveys the larger oil companies that produce about 88 to 90% of total Texas output an then estimates output based on the survey results. Drilling info includes the pending lease data which gives a pretty good estimate for all but the most recent month reported (which will be about 9% too low), earlier months are within about 0.5% of final output data, which is unknown for 12 to 18 months ( from RRC online query).
Dennis, evidence is mounting the US production is lower than last year. To compensate the void and to present the picture of a growing industry, just one mill bbl per day are released from the SPR. I admire the RRC to present the correct numbers and staying out of this game.
Hi Heinrich,
As pointed out by Timthetiny, the Drilling info data comes from the RRC (but includes RRC pending data not in the online data query). At least through July Texas C+C output was increasing according to the drilling info data. August and Sept have both been affected by bad weather so it is expected that output would be somewhat lower due to lost production days during hurricanes.
As Guym has said previously the October data will tell the story, also I would think hurricanes might interfere with completion work and may have reduced the number of completions.
https://www.bloomberg.com/news/articles/2017-11-16/transcanada-shuts-keystone-oil-line-after-south-dakota-spill
Enno’s charts have a blurb under them that is powerful stuff. Having to do with ultimate recovery.
Averaged all LTO wells in the US of Q3 2016 birthdate. Looks at cumulative recovery. The sequence says those wells nationwide will achieve 200-250K barrels produced by the time they descend to reach 30 bopd.
30 bpd is 11K/yr. It would take 20 yrs at that output level to get ultimate recovery to just 450K. They won’t mantain 30 bpd that long, either.
The number of barrels waiting offshore USA has increased from last week. Back up to approx 30 million barrels above normal level. No idea why. Charts on Twitter…
https://pbs.twimg.com/media/DO7qAGjWsAEt9vl.jpg
https://pbs.twimg.com/media/DO7qOEpX4AEfW3x.jpg
There is inventory build up season. This year refineries have unusual low inventories as they have sold and exported a vast amount of products.
Just doing some shale oil stripper well data mining as I try to wind down to go to sleep.
I will say I can never match Enno Peters with shaleprofile.com. What a resource of information.
Anyway, my subscription database shows 63,233 horizontal wells in the States of Texas, Oklahoma, New Mexico, Colorado, Wyoming and North Dakota with first production between 1/1/2005 and 12/31/2014. Wells that are between 3 and 12 years old.
15,329 of those wells produced less than 300 barrels of oil in the most recent month reported, which for most of said states was 9/2017.
32,865 of those wells produced less than 1,000 barrels of oil in the most recent month reported, which for most states is 9/2017. So over half.
44,335 of those wells produced less than 3,000 barrels of oil in the most recent month reported, again, which is mostly 9/2017.
Just something I find interesting. As shaleprofile.com so vividly shows, continuous CAPEX required.
I figure big oil is already preparing for this.
https://www.bloomberg.com/news/articles/2017-11-17/norway-idea-to-exit-oil-stocks-is-shot-heard-around-the-world
Boomer. I guess maybe that is my reasoning for holding on to our stripper wells for awhile.
I see capital drying up for new oil and gas projects. Renewables may eventually take over, but my view is that transformation will take decades, and even then, there will still be plenty of uses for petroleum besides transport and power generation.
That is Norways SWF. Their motivation — and “their” means SWF’s portfolio managers, is to recognize that they get revenue influx from sale of North Sea oil. Since that is true, they want to reduce oil exposure in the rest of the portfolio.
It’s not a forward looking thing. It’s diversification. My recall is something like 32B, which would be 0.3% of portfolio. I also note in that article not a single phone call was made to portfolio managers to talk to them. It’s all quotes from other analysts who have their own green this and green that agenda and know absolutely nothing of what the SWF’s management is doing. The SWF said nothing about coal but all those other quoted guys managed to add coal into the discussion.
Repeat, this is not backing away from fossil fuels. The annual influx of money to the SWF is STRICTLY AND ONLY from fossil fuels. They are just adjusting portfolio reliance.
The recent uptick in oil prices triggered a rally in producer shares. However, oil service shares have been left far behind. I have checked over the last 15 years and this has never happened as oil service shares closely followed the oil price. Does anyone have an idea why?
My GUESS. The drillers/banks have recognized the lack of payout in many instances. Therefore, as demand has picked up, they are unwilling to pay prices that will let the service companies again be profitable at historical levels. So, the service companies are reluctant to put the infrastructure in place [at a loss to them] in order to meet the demand for more completions [at a loss to the service company]. Helmerich & Payne had a loss again for the most recent quarter, despite some increase in revenues,
So, until service companies can provide services and make money at their historical margins, why would someone buy them? I would venture a guess that they need $80 oil to get margins back to where they were. And, the majority of forecasters do not see that happeing any time soon.
I would note Keane Group’s recent CC. Keane has 25 frac fleets operating in the major shale basins. All are booked. A year ago just 9 were active.
Profit per fleet rose nearly 40% from the previous quarter, yet Keane just earned pennies per share after losses in all previous quarters. Projections are that profit per fleet will continue to sharply rise, yet the company did not see pricing rising high enough at this time to justify building more fleets.
I focus on Keane because they are the only publicly traded company I am aware of that just operates in US shale basins and almost exclusively derives income from well completions.
$80 per barrel is a good guess, many MSM pundits say we will never see $80 again.
Of course traders say ridiculous things. I recall in early 2016 predictions of $10 per barrel. Dennis Gartman said oil would not rise above $44 WTI in his lifetime. Last I checked, he is still living and WTI has recently been trading $55-57.
Follow that logic pick. Basically, hardly any of these analysts are capable of independent thought, as EIA and IEA estimates are the basis of their projjections. When there is not enough oil, there will be little restrictions on price.
The big question is why are there still so many rigs out? There has to be more DUCs than they can possibly complete in the next year. Continuous drilling clauses? Some companies are drilling, and completing. Anyone have any idea which companies are responsible for most of the DUCs?
Clueless, what strikes me is that why does this happen now? For decades, the relationship between oil price and oil service companies has been very close. But now? Oil is up 32% since September, but the stock of Schlumberger SLB fell by 10% during this time.
I do not have access to historical studies, but I believe that when upturns happened in the past, both the oil companies and the service companies started to make money proportionately. Now we have an upturn and the oil companies are not making money. But, they have convinced many that they are profitable. But, they certainly cannot afford to pay another $2 million per well to truly get the service companies healthy again.
And I think that it will take up to $80 per barrel to pay the service companies that additional $2 million.
A lot of moving parts, but the big picture is probably in there somewhere. Maybe when you see offshore rigs going back to work, it will be a sign that the oil companies are starting to pay the service companies enough to invest in them again.
Clueless, what came to my mind is that the drillers are late for paying their bills, despite higher oil prices. A driller can use the service company as a bank receiving some short term credit by delaying payments. However, the financial burden is shifted towards the service company. And this shows up in the share price of oil service companies. So, there must be some trouble out there, despite reasonable high oil prices.
https://www.epmag.com/oil-service-pricing-plateaus-1664916
The way I read this, the higher level of completions in the first two quarters may have been due to a high level of zipper fractures on previous DUCs. The most recent months may indicate a new norm.
In other words, to keep up the number of completions like in the first two quarters, they will need to continually frac multiple wells at a time, because the can’t get frac crews. Doesn’t bode well for production for awhile.
And it probably answers my question above, with the answer of most companies.
You keep hearing about how everything is increasing as far as production goes. However, it is more like the guy who visits a building with a lot of widgets being produced, taking the widgets from that buildings production, and multiplying it by the other buildings that make the widgets to estimate production. However, nobody tells him the other buildings are empty of workers.
Did you see these? Dean’s September charts (don’t forget Hurricane Harvey in September)
Texas RRC data up to September 2017: Dean’s corrected data vs EIA
C+C https://pbs.twimg.com/media/DO-7lzdW4AA36n_.png
N.Gas https://pbs.twimg.com/media/DO-7vRoX0AAxEjO.png
Oil on its own https://pbs.twimg.com/media/DO-7ZoeXUAAOrpj.png
Condensate https://pbs.twimg.com/media/DO-7fT7WkAAlfUy.png
The growing net short position of swaps dealers reflects hedging by shale producers
Bloomberg chart: https://pbs.twimg.com/media/DO_1LnwWAAEMqHs.jpg
https://www.bloomberg.com/gadfly/articles/2017-11-19/it-is-never-wise-to-bet-against-a-saudi-oil-minister
Mark Papa – Thoughts on 2018+ US Oil Production – Bank of America Merrill Lynch Global Energy Conference November 16, 2017
pdf file: http://www.cdevinc.com/wp-content/uploads/2017/11/MGP-BOA-111617.Final_.pdf
A large portion of the Tier I Bakken and Eagle Ford acreage has already been drilled – approx 70%
There’s a steep drop-off in oil output/well between Tier 1 and Tier 2 geologic quality
Completion technology improvements can’t cure bad rock
Bakken and Eagle Ford will grow from present levels – but much less than expected
WTI will have to be very high to stimulate US growth of 1.2-1.4 MMBD/yr. Expect 600-700 MBD/yr. annual growth rate
Mark G. Papa is the founder and former Chairman and CEO of EOG Resources. Papa forged a reputation by building the Enron Corp. castoff EOG Resources Inc. into the fourth-biggest U.S. driller. Now, starting with a $500 million private-equity stake, he’s boosted the value of Centennial Resource Development Inc. more than sixfold in under two years. The company has no debt, unheard of in the industry, and is flush with assets in one of the world’s busiest oil patches.
August at 9.2 is the latest monthly number (shown on chart), beyond that is STEO forecast.
IEA – Non-OPEC supply is expected to rise by 0.7 mb/d in 2017 and 1.4 mb/d next year, led by higher US output.
https://www.iea.org/oilmarketreport/omrpublic/
IEA Oil Market Report – October 12th 2017 (The latest free one)
According to Rystad Energy, the number of horizontal US tight oil wells completed in the US during has risen above 800 per month since August, compared with around 400 at the start of the year. Earlier this year, completions had significantly lagged the number of wells spudded, causing the number of drilled but uncompleted wells to surge to record highs. Rystad put this number at around 5 000 in August, while the DPR estimated a backlog of more than 7 000 wells. US oil production is forecast to increase 470 kb/d in 2017 and 1.1 mb/d during 2018, of which 350 kb/d and 820 kb/d is crude oil, respectively.
Obviously, Rystad is relying on the drilling productivity reports by EIA, and not Texas statistics, which reflect the opposite.
Texas RRC used to try to estimate production, but decided years ago, that’s not our job. The job is to try to protect the public, and royalty owners. They now provide extensive downloads at a cheap price, and provide other extensive data, and queries for others to do that. Do they? No, they make up their own data, ignoring the only primary data provider. Insanity.
Yes I’m inclined to think that the former head of EOG must know more than anyone. And the other forecasts are probably over optimistic.
Rystad’s latest presentaion – November 17, 2017 – Artem Abramov, VP of Analysis at Rystad Energy presented our view on latest trends and perspectives in the Permian Basin during the webinar held by EIA yesterday.
https://www.eia.gov/petroleum/workshop/crude_production/pdf/20171116_RystadEnergy_EIA_Permian.pdf
Mark Papa must be tamed a little since he and EOG parted back in 2014. His response to the OPEC buildup was to say that EOG would outdrill OPEC. Shortly after that, he “left” EOG.
https://amp.ft.com/content/e313e1f6-cd47-11e7-b781-794ce08b24dc
Similar to EOG’s current program, except EOG is still using $40 price. And there is very few areas that yield a profit at those prices. I think upstream has finally got the message from investors. That is, put up, or shut up.
The most sense I’ve read from anybody concerning USA oil production in the last three years, although I’d like to know where he thinks the growth in GoM for next year is going to come from.
Hi George,
Yes I agree with all that Papa says. His prediction is not much different from what I have been saying, which is tight oil at around 7 Mb/d by 2023, an increase of 2.23 Mb/d from the Sept 2017 level (4.77 Mb/d). If we assumed a linear increase from 2018 to 2021, that would be about a 557 kb/d increase each year for 4 years.
Papa’s estimate is 650 kb/d per year, a little more aggressive than my US tight oil scenario. He also knows more than me. 🙂
He doesn’t say what “constructive oil prices” are, but my guess is that he means $75/b or higher.
He is using EIA monthlies, which recently have been too high, we both agree. He may be high on his gross per year, I may be too low, but we would be nitpicking to argue much about it, as none are that far different when compared to EIA and IEA’s ugly predictions. So, I vote yes, on Pappas’ analysis.
I go with Clueless’ prediction of over $80 as “constructive”, although $75 is not that much different.
Hi Guym,
If you look at the drilling info data at the EIA website for Texas, EIA monthly estimates are probably only 50 to 100 kb/d too high (for recent months). Taking the 914 survey report and dividing by 0.907 gives a pretty reasonable estimate for Texas when that is compared with the drilling info data (which comes from the RRC, online query plus pending file). Perhaps $80/b would make more sense, it will depend on how much that boosts output, Papa estimates it will not be much because of lack of Tier 1 prospects in Eagle Ford and Bakken.
I just noticed that the trend line from the low in sept 2016 to August 2017 has a slope of 650kb/d per year, so perhaps that is the basis for Papa’s predicted rate of increase for US output, it is far lower than this for the past 7 months (which he points out in his slide show), about 250 kb/d per year. He may expect the rise in oil prices to a “constructive” level will lead to an acceleration in the rate of output.
Lol, other than George Kaplan, who provides the most comphrehensive analysis of the GOM, where else can you get a GOM estimate? EIA, of course, whom I heard plugs a 300k figure into projections. Now, where did I here that?
Mark Papa is, from a historical perspective, one of the most influential individuals in this entire, unfolding unconventional arena.
A petroleum engineer by training, he early on recognized the impact of horizontal drilling/effective fracturing on hydrocarbon production.
Watching Aubrey McClendon borrow fortunes and buy leaseholdings all over the country, he abruptly shifted the focus of EOG from natgas to oil, most specifically ordering his landmen to target the Eagle Ford in a massive way prior to drilling any wells.
Biggest reason I am relating this is the potential future shortfall of oil output may well be far exceeded by gas/NGLs availability as rapidly evolving events seem to indicate.
Specifically, the announcement last week by Tellurian that they will have Bechtel build a 20 train facility on Lake Charles, LA for $15 billion, with annual output of 27 million tonnes per year. This is one half the cost of the historical norm.
I’ll not go into an array of numbers, terms, comparisons, etc., but – suffice to say, folks – we are entering into an age of gas where the remaining redoubt of oil – transportation – is in the crosshairs of an army of engineers, visionaries, and entrepreneurs.
There exists incredible amounts of economically recoverable gas on the planet.
Processes such as this Telurian venture is but one of an ongoing push to exploit this form of hydrocarbon energy.
Hi Coffeeguyzz,
We will have to see if the output matches your expectation, I will go with the geophysicists at USGS over the economists at EIA, every time.
The USGS estimates about 168 Gboe of undiscovered shale gas in the US, the US uses a lot of natural gas and this may expand as coal use falls.
Gross withdrawals in 2016 were 32.6 TCF for the US or 5.62 Gboe. If the shale gas peaks at the halfway point, that would be 84 Gboe, with no increase in natural gas output after 2016 that would be 15 years, an increase in output means the peak occurs earlier. There are another 30 Gboe of shale gas proved reserves, again dividing by 2 gives a peak at 15 Gboe which would extend the peak to 18 years (again assuming no increase in natural gas output after 2016.)
Note that the input to refineries for crude is 5.9 Gb per year, if we were to replace this with natural gas we would need 11.5 Gboe of natural gas output per year. At that rate of output, a peak is reached in about 9 years.
Natural gas may be useful as a bridge fuel, but we are using energy resources very quickly and damaging the environment in the process.
Better to work towards replacing oil and natural gas as depletion requires that this be done, unless we plan to do without energy in the future.
Dennis
Can you steer me to the source for the USGS numbers?
Sure, EIA pegs 2,300 Tcf recoverable which – at 27 Tcf/year consumption gives a century’s worth … give or take a decade.
If your USGS source uses the 2011 Marcellus and 2012 Utica assessments, throw it in the trash.
I did the current/2011 Marcellus USGS comparison a few weeks back.
Just checked the 2012 Utica … 4 wells/square mile … .6 -say again POINT SIX billion recoverable over 30 years.
Dennis, Utica wells are doing .6 Bcf in three WEEKS now.
Same same for the Mighty Marcellus.
So, if’n you’d kindly tell me the source for your USGS number, I’d be mighty obliged.
Thankee.
Hi Coffeeguyzz,
https://energy.usgs.gov/portals/0/Rooms/oil_and_gas/noga/multimedia/USGS%20Continuous%20Results%202000%202017.xlsx
from
https://energy.usgs.gov/OilGas/AssessmentsData/NationalOilGasAssessment/AssessmentUpdates.aspx
Do you remember the EIA’s estimate for the Monterrey Shale?
There are a variety of estimates for the Marcellus, I will go with the geophysicists from the USGS.
Note that often people use “recoverable resources” differently. USGS gives “undiscovered technically recoverable resources”, one needs to add 2P reserves (48 TCF) to the USGS estimate from 2012 (84 TCF) for a total recoverable resource of 132 TCF, this is similar to the EIA’s 2012 estimate of 141 TCF for the Marcellus (data based on link below).
https://en.wikipedia.org/wiki/Marcellus_natural_gas_trend
Estimates have ranged from 49 TCF to 363 TCF since 2008 (both of those estimates came from geology professors).
The EIA estimates 622 unproved technically recoverable wet shale gas (Sept 2015) for the United States.
https://www.eia.gov/analysis/studies/worldshalegas/
shale gas 2P reserves are about 263 TCF (1.5 times proved reserves) at the end of 2015 (1P reserves=175.6 TCF).
https://www.eia.gov/dnav/ng/ng_enr_shalegas_a_EPG0_R5301_Bcf_a.htm
Total recoverable shale gas is 885 TCF based on the EIA estimate 5.8 TCF= 1Gboe, so 885/5.8=152.6 Gboe.
Peak is at half way point with 5.6 Gboe output per year of natural gas in 2016, plus you assume transport will move to natural gas (5.9 Gb crude per year) so we need 11.5 Gboe of natural gas per year. So at that 11.5 Gboe/year rate peak is reached at 76.3 Gboe cumulative output (half of resource) or in 76.3/11.5=6.6 years.
As I suggested, the resource is not as large as you assume.
If we don’t switch to natural gas for transport and output remains at the 2016 output level of 32.6 TCF (no increase in natural gas output), then the peak is reached in 14 years (half of cumulative output would be reached) and output would be completely used (not realistic of course) in 28 years, a linear decline starting at 14 years would allow 28 years of declining output with output at zero in 2058 and peak in 2030 (actually a plateau from 2016 to 2030 so I would call the peak 2023 at the mid point of the plateau. Any increase in natural gas output means the peak will occur sooner than 2030, the higher it rises the sooner the peak, as the resource is limited.
Hi Coffeguyzz,
You seem to be star stuck by the best wells, it is the average well that matters.
The average well EUR may be about 6 or 7 TCF, though for the 7500 wells drilled so far it looks more like about 5 TCF.
Remember that the entire basin is not uniform, the sweet spots get drilled first, as these run out of space EUR will decrease. Sometimes people take the area of the play divide by acres per well and assume a fixed EUR per well based on the EUR of the sweet spots.
I believe it is pretty clear that those assumptions will lead to overly optimistic estimates of recoverable resources.
You will claim that EUR per well has increased over time.
You are correct. An assumption that this will continue for the foreseeable future is likely to be incorrect. In a battle between technology and geology, geology eventually wins out as there are immutable physical laws that create limits.
I don’t have much data on the Utica shale.
Just USGS and EIA estimates. Perhaps it will be more than the estimates made so far.
Do you know how many wells (horizontal) have been drilled in the Utica shale? What percentage of the total horizontal wells drilled have produced 0.6 BCF in 3 weeks?
I agree the “sweet spot” estimate for EUR seems pretty low, but the model may have been based on a well with a short lateral.
In any case even if we assume the economists at the EIA are correct (623 TCF unproved resource) and 200 TCF shale gas proved reserves for 823 TCF, at 28 TCF/year of marketed production, half the resource is used in 15 years. Note that conventional natural gas is well past peak and will continue to decline, only about 124 TCF of conventional gas proved reserves at the end of 2015, probably not much will be discovered.
About 12 TCF/year is the current rate for conventional natural gas output. We could create a simple scenario where conventional output decreases by 0.5 TCF per year for 20 years so that the conventional natural gas resource is used up and that shale gas fills the gap with output remaining at the 2016 level. Adding cumulative shale gas output (109 TCF) to proved reserves (200 TCF) and unproved and undiscovered (623 TCF) for a total resource of 932 TCF and assuming peak is at 50% of URR (466 TCF cumulative output), the scenario above reaches a peak (50%) in 2034. Assuming a modest increase in output (1% per year increase) peak is reached in 2033.
Shale gas output has been increasing at about 8.8% per year over the past 5 years. If we assume shale gas continues to increase at 5% per year, the peak for US natural gas would be 2031.
Bottom line, based on current EIA natural gas resource estimates a peak between 2030 and 2035 in US natural gas output is likely.
Dennis
You have covered a lot of ground in your comments and I may need at least two postings to address them.
Re USGS assessments … Your linked blue letter guy shows the Marcellus from 2011 and Utica from 2012 … so, WAY obsolete as the displayed Barnett increased from 26 to 52 TCF and the Mancos from 1.6 Tcf to over 60 Tcf.
In other words, both the Mighty Marcellus and Utica are apt to be assessed in the 1,000 Tcf range when evaluations are released.
(Strongly recommend pulling up both Utica and Marcellus assessments for quick glance. Don’t let the eye glazing TOC/CAI jargon throw ya. Pretty brief, straightforward data from a bunch of talented, uber fuzzy heads).
Enno’s data shows 1,300 wells out of 7,700 ALREADY surpassed 5 Bcf in just a few years online … almost 20%.
Utica info easily gotten from oilandgas.ohiodnr.gov site .
Clicking on “Shale Activity/Horizontal Production/Well Production” pulls up quarterly pdfs for 1qtr/2qtr 2017.
1,562 producers in 2 qtr show about 85 over 1 Billion cubic foot with another 80 over the .6 used in the 2012 USGS assessment.
Again, over a 3 month period, about 160 Ohio Utica wells have exceeded the 30 year lifetime projection from the USGS.
But wait! There’s more!
Of those 1,562 Ohio producers, a large percentage have targeted the grossly underperforming oil window.
The true gas producer percentage is fairly low overall.
My hyperbole about 3 weeks production of .6 Bcf Utica well is just that, an exaggeration. However, the Gaut and Scotts Run Utica wells did do that, and extending the 3 weeks to 12 shows many, many wells routinely achieve this output.
Regarding the scope/size of the Marcellus … that would be a lengthy post for another time.
But, Dennis, I’ll leave you with this …
The distance between southwest PA and northeast PA is about 300 miles.
While much of the area in between has been minimized, it actually contains several productive wells using antiquated (pre 2012) completion techniques.
In addition to the areal extent, there is the seldom-mentioned vertical, aka stacking, that exists … the deeper Utica and shallower Upper Devonian formations.
One recent example is a Pettit well from EQT targeting the obscure Geneseo trend.
In its first four full months online, it has produced 1.7 B f on restricted 13.5 MMcfd choke.
All of this, Dennis, is to buttress, somewhat, my observations that the abundance and relative ease – with respect to unconventional oil recovery – will continue to shift both the development and adoption of natgas over the coming decades.
Appalachia Rising!
To coffee below. Not surprising is the relative ease of shift. The Barnett shale was starting to be developed when the Eagle Ford was still a pup.
Hi Coffeeguyzz,
I don’t have any inside information, there are varying estimates. The EIA and USGS estimates for US shale gas are pretty similar at present.
Note that an assumption of 0.6 BCF does seem low, perhaps their model well had a short horizontal.
The area is large, but not all of it will be sweet spot.
“Better to work towards replacing oil and natural gas as depletion requires that this be done, unless we plan to do without energy in the future.”
Dead on, and while politics are mostly supposed to be discussed in the other thread, there’s this to consider.
It’s altogether possible to win right wingers over to supporting renewable energy if you show them how doing so bolsters their own bottom line. Virtually all of them understand, if you take a minute to respectfully remind them that oil comes out of holes in the ground, that over the long term oil must necessarily get to be VERY expensive due to depletion and rising population…… . unless we transition to renewable energy.
There’s a KILLER argument to be made that because the price of oil is highly inelastic, the relatively trivial sums we spend on subsidizing electric cars earns us a collective substantial net return by way of forcing the price of oil DOWN, everything else held equal.
The price reduction is very small NOW, but it will grow every year with every new electric car added to the fleet. A new electric sold this year will be saving oil for the REST OF US driving conventional cars for fifteen years at least, on average.
Not very many people own stock in oil companies, but tens of millions of us buy gasoline and diesel fuel, lol.
Saudi Arabia September crude oil production 9.973 million b/day, up 22 kb/d month/month. exports 6.549 mb/d, down 161 kb/d m/m. crude stocks 253.271 mb, down 1.344 mb m/m. JODI data.
Exports JODI: https://pbs.twimg.com/media/DPEpAejW4AAz84o.jpg
I really don’t know (obviously) but I would have thought it was not in Saudi Arabia’s best interests to fake their inventory statistics, especially as the credibility of OPEC rests on them.
Plus they would have to fake more than one number as the equation would need to balance. Production = Refinery input + exports + inventory change
Orbital Insight chart : https://pbs.twimg.com/media/DOmwihnWkAEEUi6.jpg
Orbital Insight
We’ve found 624 floating roof storage tanks in Saudi Arabia, nearly double the 318 reported by industry databases
https://twitter.com/orbital_insight
“In spite of this oil demand will continue to grow”
http://www.iea.org/weo2017/
lots of gems in this report. hard to say who will be more wrong Mike “little hands” or the folks at iea with regard to future US LTO production and export capacity. but as noted in this and many other studies the future for US oil and gas industry is as bright as ever. making america great again…now more than just a slogan?
https://wattsupwiththat.com/2017/11/19/irony-can-be-so-ironic-trumps-solution-to-agw-drill-baby-drill/
Reality may be upcoming soon for these “intellectuals”. On second thought, they will probably never grasp it.
https://oilprice.com/Energy/Energy-General/The-Wireless-Power-Grid-More-Than-A-100-Years-In-The-Making.html
Doesn’t sound too healthy.
Mike & Shallow,
If you get this message, please contact me at [email protected]
I believe you will be quite interesting in the data and information
steve
The US SPR is down another 1.8 million barrels, I don’t know why…
Weekly change, chart on Twitter: https://pbs.twimg.com/media/DPGdh6yXUAAIXMJ.jpg
SPR website: https://www.spr.doe.gov/dir/dir.html
The SPR sales, I guess it’s this – the fiscal year 2018 started on 1 October 2017
https://pbs.twimg.com/media/DPHw04wXcAEqu5S.jpg
Above twv posts are very interesting. None of the reports on inventory draws address the SPR draw, which is as significant as commercial draws.
I wonder why these sales happen at all. First, it should be better to sell SPR inventory when prices are sky high – this was the main reason to have the SPR. And secondly, why add to supply when OPEC is trying to reduce supply? This is somewhat counter- productive.
It’s a government run operation. Logic and good management would be by sheer accident.
Anybody interested in the oil industry for ANY reason should read this article.
https://www.washingtonpost.com/business/why-saudis-are-pinning-their-future-on-giant-oil-ipo-quicktake/2017/11/20/d3923018-ce5d-11e7-a87b-47f14b73162a_story.html?utm_term=.0852aee7d6d4
Requires a subscription.
Unless there has been a change in policy at the WP within the last few weeks, you can read eight or ten articles there per month, free.
And if you clear cookies regularly, and turn off your router a few hours once in a while, you can read more.
Yes I managed to read it.
I think parts or all of this was posted by Energy News. It is interesting to note that ALL of the arguments are complied by data from third party sources who are addressing it basin by basin, with the exception of Depa’s use of company analysis, which indicate a downward trend. Which is similar to Morgan Stanley’s analysis done from the first of the year, that indicates production is flat. None look at it by state totals. Not all of production is derived from horizontal production in the major basins. Decline rate estimates, are just that, estimates.
https://www.eia.gov/petroleum/workshop/crude_production/
Of course, all of this will come to naught. EIA has proved their point, as graphic presentation is superior.
I didn’t notice this DrillingInfo presentation when I looked, it’s worth a quick look. Not many wells in Q3 2017
https://www.eia.gov/petroleum/workshop/crude_production/pdf/Drillinginfo_USProduction.pdf
North Dakota – update through September 2017
This interactive presentation contains the latest oil & gas production data from all 12832 horizontal wells in North Dakota that started production since 2005, through September 2017.
https://shaleprofile.com
In Sept, 89 new wells were completed in North Dakota based on Enno Peter’s article linked above.
Yes I was just comparing Enno’s numbers to ND Director’s Cut and EIA DPR.
Papa dood says 1.6 mbpd consumption growth this year, global.
There is mid year hard data that says Chinese consumption growth this year will be 6.6%. That’s about 790K bpd growth just from China.
India’s growth 2017 . . . Platts said 7% for 2017 in January. That was before BP’s bible of June said 2016 was 8%. It was also before the February restriction of cash use in India. Some import measurements suggest sub 7% growth in India consumption this year but not much under 7%. Demand growth has no reason to decline since population rose and so did vehicle total, but consumption growth does (the cash issue). No, they are not the same thing. Ask the guy who didn’t have cash to buy if he demanded more oil than he consumed. He did. Overall, call it 5% growth and 225K bpd increased consumption.
Global sum of growth from the big 2, about 1 mbpd. I think Papa dood relied on 600K from the US and that would hit his 1.6 number. BUT
Note that last year Brazil subtracted 150K bpd from the global consumption total — but unlike last year, this year is showing some GDP growth. There doesn’t seem to be any mid year measure around, but GDP can mean something.
Japan oil consumption decreased 100K bpd last year. GDP this year is a tad higher, but not much. However, there is some evidence of an uptick in Japanese oil imports. There could be a consumption surprise in Japan, and this does have precedent. There was an increase 2011-2112. Overall the surprise would be not growth, but a flattening of decline. [factoid, Japan reports about 130K bpd of domestic oil production. It’s all refinery gain.]
India’s crude imports rise to a record of about 4.47 million b/d in October: petroleum ministry data. Up 7.7% from September. Up 5% year/year
https://pbs.twimg.com/media/DPPezBhWkAAcgyE.jpg
Ha. I pulled 5% out of the air.
8ish% last year throttled slightly by the few months start of year when cash had to be dealt with, then . . . dealt with and back on track the rest of the year.
5. Probably more than 5 when all numbers are in, for 2017’s growth over 2016.
Norway – The main reasons that production in October was below forecast is that Goliat was closed down most of the month and production from Gina Krog was less than expected,
http://www.npd.no/en/news/Production-figures/2017/October-2017/
The October production numbers released so far this month. The chart title is in the order of the release date. Chart: https://pbs.twimg.com/media/DPLQHsZXcAAHa62.jpg
seasonal version https://pbs.twimg.com/media/DPLcG6SX4AY35W8.jpg
WSJ – (Nov. 13, 2017) – RIO DE JANEIRO—In a few months, Brazil’s federal government will start receiving crude oil from a huge field, known as Libra, off the coast of Rio de Janeiro. But the government has no tanker ships to unload oil from the platform where it will be pumped. It has no terminals to store oil, no pipelines to transport it and no refineries to process it.
The situation, which officials are scrambling to resolve before the government receives its first 500,000-barrel boatload in February or March, underscores the complications of taking too literally the rallying cry of resource nationalists: “The oil is ours.” It also puts Brazil’s government at risk of getting less money from the field that it envisaged.
https://www.wsj.com/articles/brazil-faces-offshore-oil-dilemma-1510569003
I bet things aren’t as bad as they say – it reads more like a standard WSJ “capitalism/globalisation/money for our pals good – everything else bad” piece.
I will gladly pay you Tuesday for a hamburger, today.
https://oilprice.com/Energy/Energy-General/Bankrupt-Venezuela-Asks-Partners-For-Free-Oil.html
I think there’s a growing chance one or more of their facilities will have a major failure and simply go off line, possibly for ever (it doesn’t have to be an explosion), so they will go from slowly accelerating decline to step changes.
Sign of a good money manager, buy high, sell low.
https://oilprice.com/Energy/Oil-Prices/Has-The-Big-Oil-Fire-Sale-Started.html
https://oilprice.com/Energy/Energy-General/Can-The-Gas-Glut-Kill-The-Permian-Boom.html
Obstacles in the Permian keep mounting. We have dearth of frac crews, drivers, pipelines, water, and don’t forget the lizards. But drilling is going ok.
http://www.rrc.state.tx.us/about-us/resource-center/faqs/oil-gas-faqs/faq-flaring-regulation/
Flaring allowed for 180 max. That would be a lot of money to waste anyway.
Canadian August production (crude oil + condensates + bitumen) was 4,365 kb/day, up +323 kb/day year/year.
Suncor Energy’s 194 kb/day Fort Hills mine is due to start producing oil by the end of this year
Chart on Twitter: https://pbs.twimg.com/media/DPMgjcXWkAA2Ux9.jpg
Split – in-situ & mined: https://pbs.twimg.com/media/DPMhZrlWsAAXP1t.jpg
I am guessing that would be useful, in conjunction with Keystone, to replace heavy oil lost in the Venezuelan debacle.
Anyone know if China is having any success with fracking their shale?
The fight for northern iraq’s remaining oil.
http://crudeoilpeak.info/the-fight-for-northern-iraqs-remaining-oil
Two more dry wells in the Barents and further indication that if anything is to be found it will likely be gas:
Non-commercial gas discovery on the Hufsa prospect in the southern … gas discovery was made in the main well while the sidetrack was dry.
https://www.lundin-petroleum.com/non-commercial-gas-discovery-hufsa-prospect-southern-barents-sea/
If this is right, Venezuelan crude exports are down 1 million barrels/day.
TROilResearch (Reuters tanker tracking) – Venezuela seaborne crude oil exports trailing significantly in November, Likely set to end the month at a new low.
Chart on Twitter: https://pbs.twimg.com/media/DPO5vgsX4AABnyr.jpg
Exports by region: https://pbs.twimg.com/media/DPO68RuXkAIEBii.jpg
Twitter account: https://twitter.com/TREnergy
Venezuela stopped reporting their export numbers to JODI in December 2016
Seeking Alpha, along with their own HFIR view, continue to hammer the stories of EIA overestimation of oil production. Both Hamm’s fight, and Pappa’s presentation are heavily touted. Throw in Morgan Stanley’s view, and your beginning to see a large scale complaint build up. There is an absence of stories claiming Hamm to be a quack.
The Gulf Coast Express pipeline for gas from the Permian is not scheduled to come online until mid 2019. Hope there is a large pool for DUCs to swim in for awhile.
https://news.google.com/news/video/4y9iAndtRfw/du1W3C9gPIiT2dM6PbxauVEHVrhgM?hl=en&gl=US&ned=us
This link will be of interest to anyone following Venezuelan oil and politics.
More bullish news in EIA than grabs the normal pundit. Draw was actually 3.6 when SPR draw is considered, and exports were at 1.591 million a day. Big draw in Cushing of 1.9 million. Not shabby for November. But EIA keeps producing oil in Washington DC.
2017 factoid of note.
India SPR. Start of year about 29 million barrels. 3rd largest oil consumer in the world and fastest growth in consumption at about 8%/yr. Burn 4.5 mbpd. So that 29 million is 6.5 days of consumption. This is way under the global standard (desired standard, nearly no one has it, it’s codified in EU silliness text) of 90ish days.
India added some storage to this, mostly this year. Another 18 million barrels. Takes them up to 10 days of storage.
Significant oddity, half of the 18 is UAE oil. UAE wanted an SPR and put it in India. India is a caretaker of that oil. It doesn’t belong to India.
Not too very weird. Japan has offered some of its SPR to Australia and New Zealand. It’s like geographical warehouse outsourcing.
Parenthetical. The US is required by law to provide oil to Israel for up to 5 years from the US SPR.
Hi all,
A new post is up on Texas
http://peakoilbarrel.com/texas-update-november-2017/
and a new Open Thread Non-Petroleum
http://peakoilbarrel.com/open-thread-non-petroleum-november-22-2017/