OPEC March Data and Saudi Report

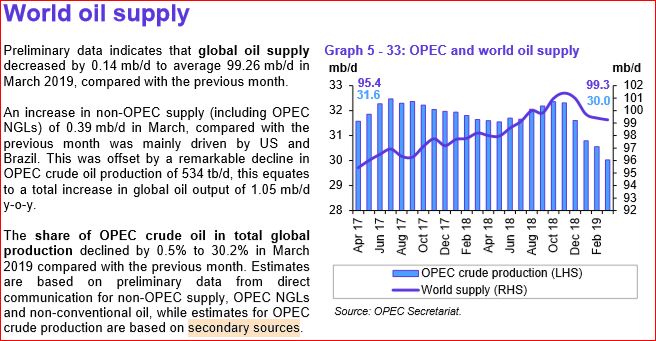
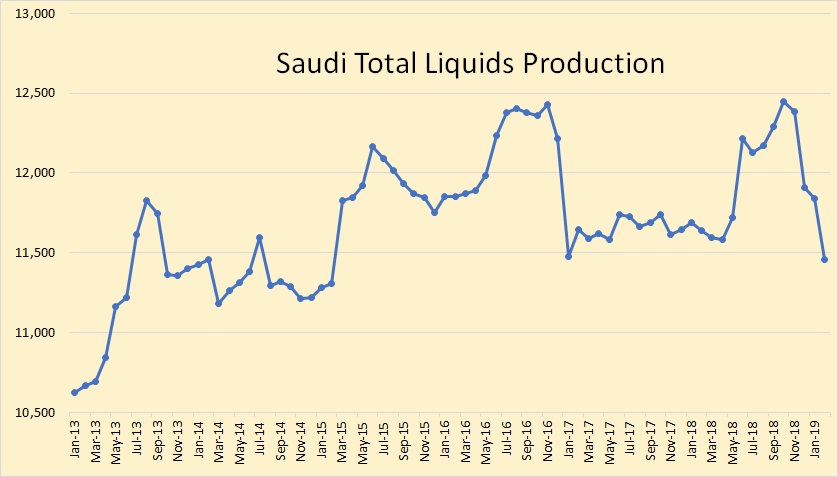
The below OPEC charts were taken from data in the OPEC Monthly Oil Market Report. All data is through March 2019 and is in thousand barrels per day.

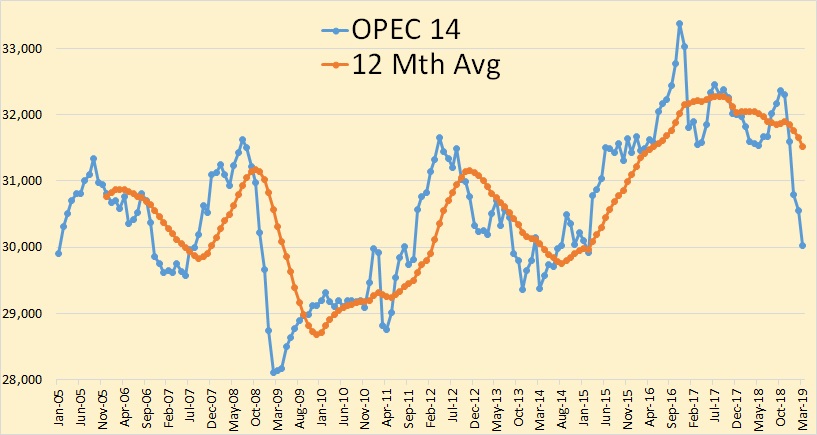
There was another big decline in OPEC production in March, down 534,000 barrels per day.

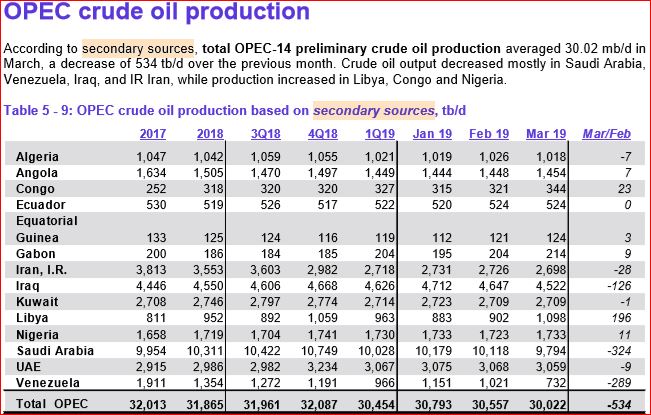
The decline was mostly Saudi Arabia, Venezuela, and Iraq.

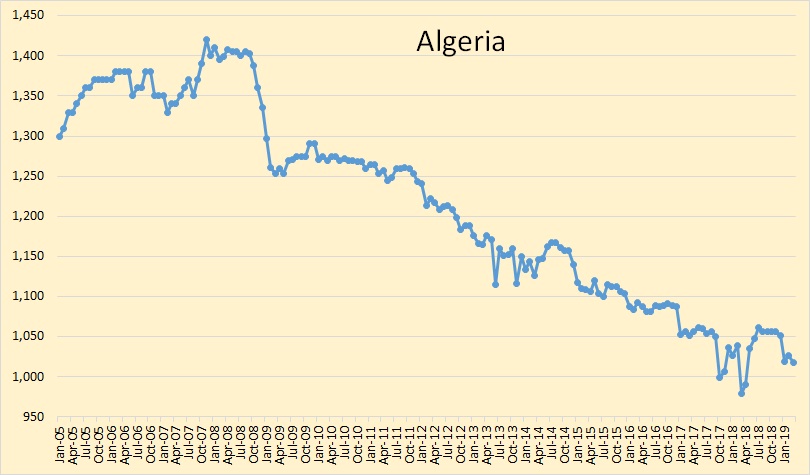
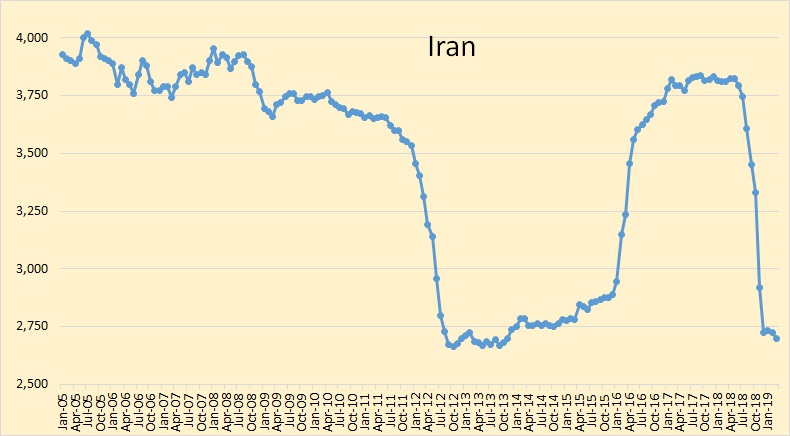
Iran, Libya and Venezuela are exempt from quotas. Everyone except Saudi Arabia are near their quota. Saudi is over half a million barrels per day below their quota.

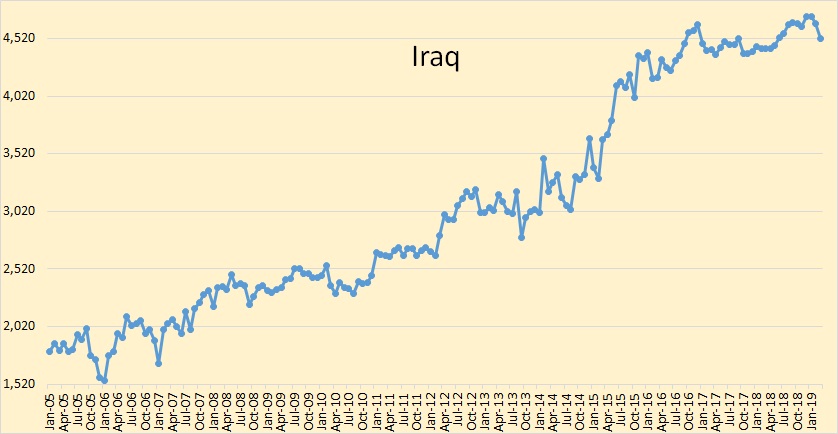
Although Iraq was down  126,000 bpd in March they are still at their average for the last two and one-half years.

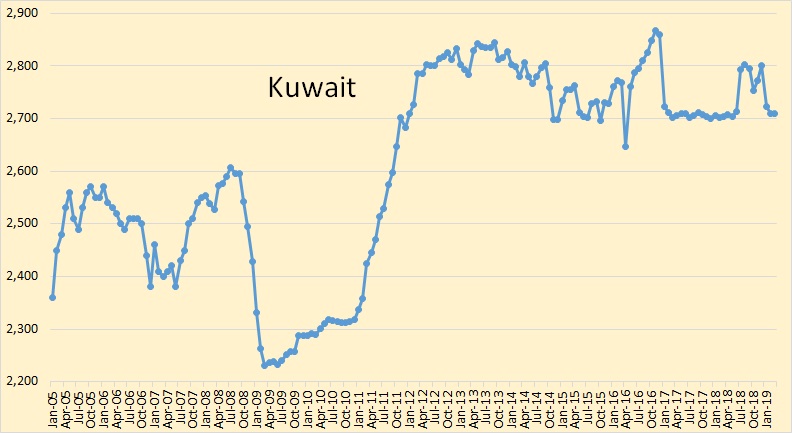
I think Kuwait is at, or very near, peak production except for their share of the neutral zone. That is shared 50/50 with Saudi Arabia. Their share would be about half a million barrels per day. It is shut down because of a political disagreement between the two countries.

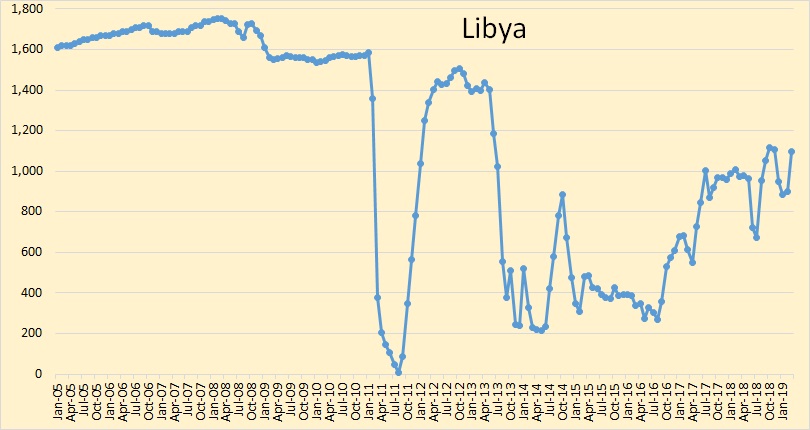
Lybian production was up 196,000 in March. They will likely be down again in April as fighting there has escalated.

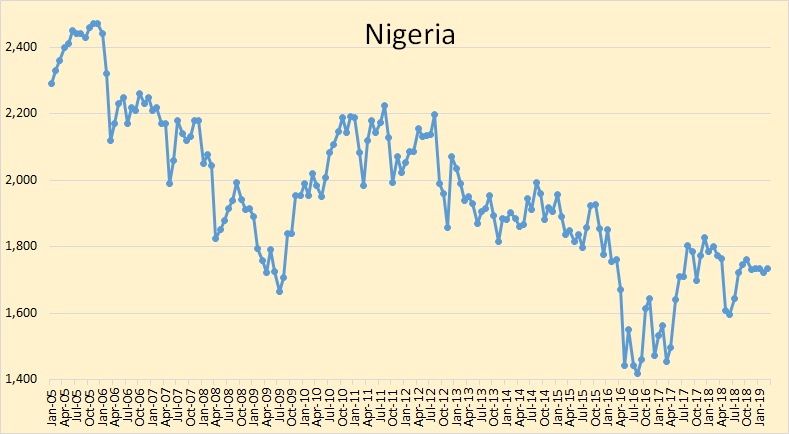
Nigeria appears to be in slow decline. They are still producing well above their quota.

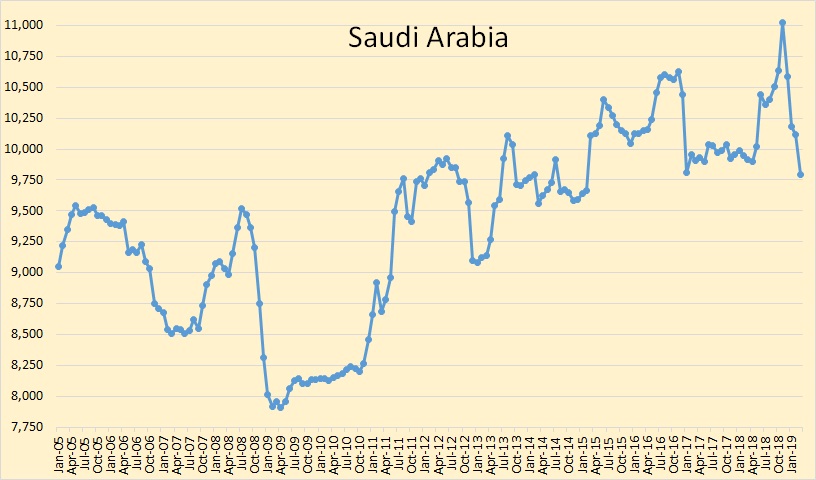
Saudi Arabia is another story altogether. They are over half a million barrels per day below their quota.

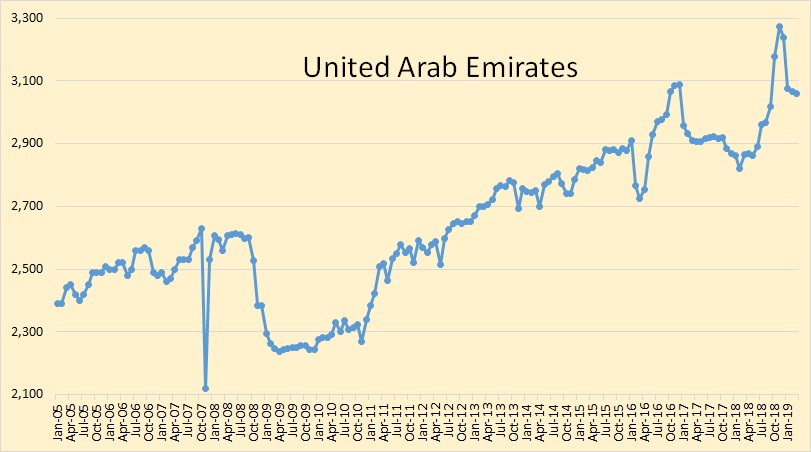
The UAE is producing slightly below their quota. The October, November, December spike in production was obviously a heroic attempt to increase their quota as they are still producing well above their average before that three month period.

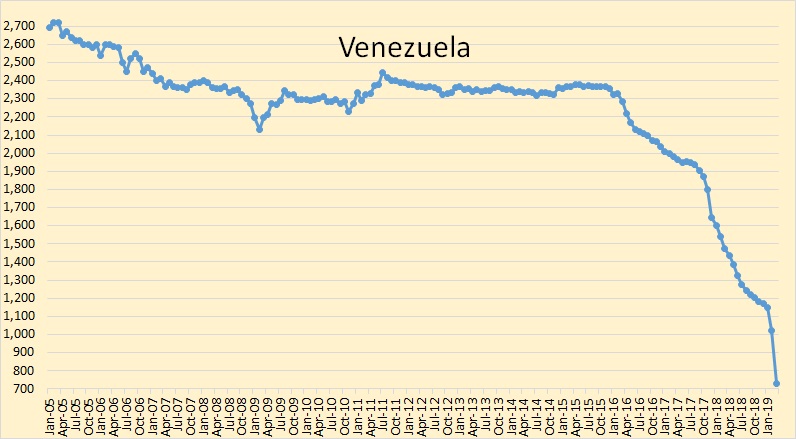
Venezuelan production was down 289,000 bpd in March. The blackouts there hit them hard. I would be afraid to even guess where they are going from here.

Concern Saudi Arabia’s Oil Reserves

In February 2004 Saudi Arabia published a slide PDF stating, among other things, their current depletion status. But first, I want to post a bit of their history.

Crude Oil Supply Scenarios: Saudi Aramco’s Perspective

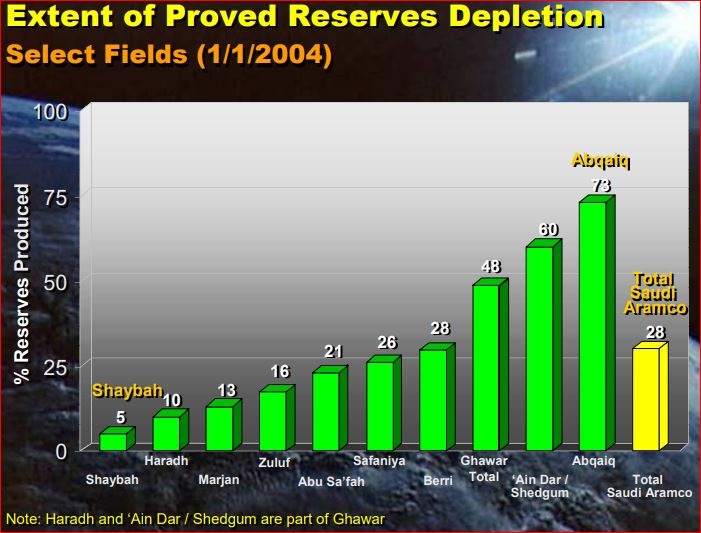
Saudi stated, fifteen years ago, that Ghawar was 48% depleted and the Ain Dar/Shedgum section of Ghawar was 60% depleted.

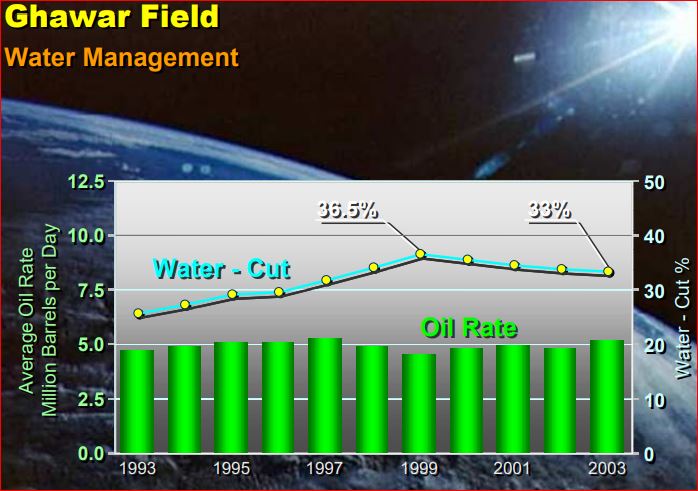
They stated, in the same PDF, that they had gotten their water cut under control. But what happened, around the year 2000, that resulted in this improvement?

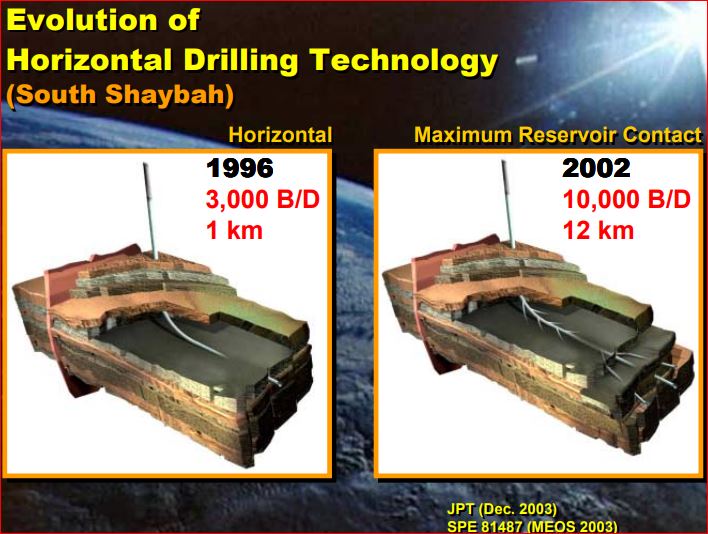
Injected water was rising fast in their reservoirs. They began to plug vertical wells just below the oil line. And they began an infill drilling program with new horizontal wells, then horizontal MRC wells, that pulled the oil from the very top of the reservoir.

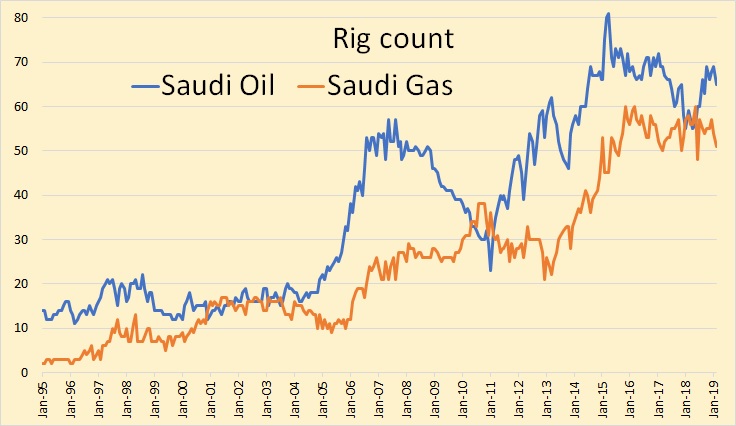
It was not until 2005 when the infill drilling program began in earnest. It slowed down in 2008/2009 when prices collapsed. But it picked up again as prices recovered and they needed more infill wells to keep production up.

Saudi stated such in this remarkable PDF they posted in November 2006:

Saudi Arabia’s Strategic Energy Initiative: Safeguarding Against Supply Disruptions

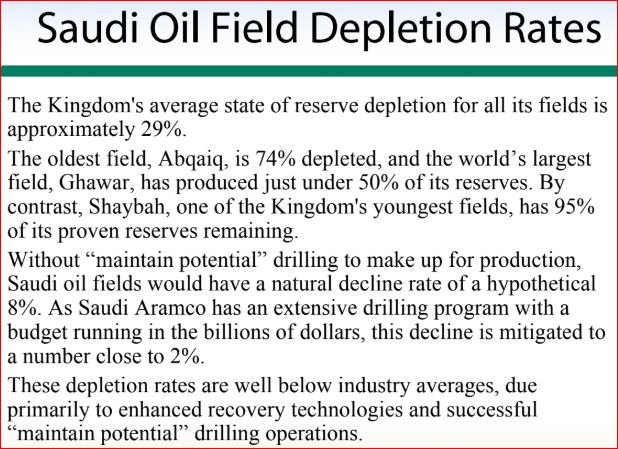
The above statement is really astounding. One needs to read it carefully to fully understand the claims made here. They are saying that their fields have a natural decline rate of 8%. But with their massive infill drilling program, they have gotten the decline rate down to almost 2%. Their new horizontal wells are pulling the oil right off the top of the reservoir so they get less water. They are pulling the oil up a lot faster so their decline rate drops to almost 2%.

But the most astounding thing here is that last sentence: These depletion rates are well below industry averages… Now just a cotton picking minute here. We are talking decline here, not depletion. They are entirely two different things. If you suck the oil out faster, causing the decline rate to decrease, you have to be increasing the depletion rate.

Euan Mearns posted in April 2007, using 2004 data:
GHAWAR: an estimate of remaining oil reserves and production decline

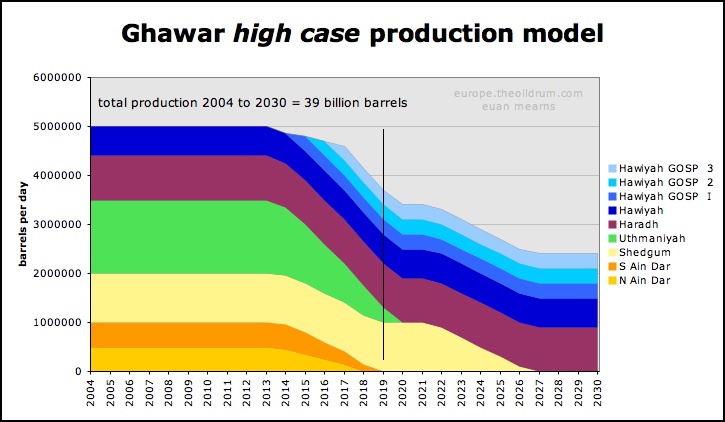
Euan posted two scenarios, base case and high case. The high case hit the nail on the head, 3.8 million barrels per day in 2019.

It is important to note that Ghawar’s older northern fields have a much higher decline rate. Also Ghawar showed no decline until around 2013. This is because they were not producing the field at full capacity. Then around 2013, the depletion caught up with them and, as they admitted, they began producing at full capacity.

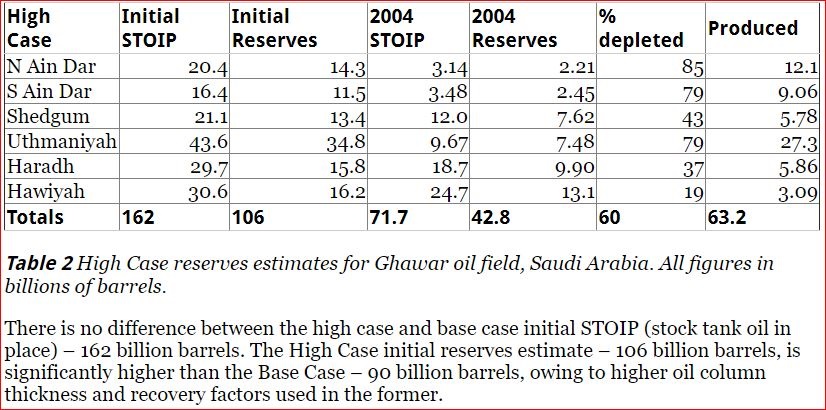
Here is the data Euan used to make his assessment. He had Ghawar at 42.8 billion barrels of recoverable reserves in 2004. If Euan was correct then Ghawar likely has about 18 billion barrels of recoverable reserves left.

Ghawar’s top three fields have been producing for 70 years. Why is anyone surprised that they are now in serious decline? 

A few days ago Saudi Aramco has published a bond prospectus, the first ever since the total Saudi takeover of ARAMCO in 1980. There have been several reviews of this prospectus on line:

From Bloomberg
The biggest Saudi oil field is fading faster than anyone guessed

And from OilPrice.com
Aramco’s Mythical Ghawar Field Could Be Its Weak Spot

The online version of the prospectus is quite long, 235 pages plus a 10-page introduction. But it is extremely revealing. It has generated a lot of controversies. For instance, on page 21 we find this, bold mine:

Based on the initial 40 year period and 20 year extension of the Concession, as at 31 December 2018 the Company’s reserves were 256.9 billion barrels of oil equivalent (sufficient for proved reserves life of 52 years), consisting of 201.4 billion barrels of crude oil and condensate 25.4 billion barrels of NGLs and 185.7 trillion standard cubic feet of natural gas.

Their claimed proven reserves have been downgraded by 10 billion barrels but that is not all. Those reserves are BOE. That is crude oil, plus condensate, plus other liquids, plus natural gas. Crude + Condensate is only 201.4 billion barrels. Assuming their percentage condensate is 5.5%, a very conservative estimate, that would mean, that they are claiming, their “crude only” reserves are around 191 billion barrels. So the below reserves what Saudi Arabia claims they have, in billion barrels.

BOE ———————– 256.9
Total Liquids ———– 226.8
Crude + Condensate – 201.4
Crude Only ————- 191

On page 88 we find this:

Notice the last line, MSC or maximum sustainable capacity.

MSC refers to the average maximum number of barrels per day of crude oil that can be produced for one year during any future planning period, after taking into account all planned capital expenditures and maintenance, repair and operating costs, and after being given three months to make operational adjustments…. 

Based on the initial 40 year period and 20-year extension of the Concession, as at 31 December 2018 the Company’s reserves were 256.9 billion barrels of oil equivalent (sufficient for proved reserves life of 52 years). 

In their definition of MSC they say crude oil but in their 52-year projection they use their “combined reserves” figure, (BOE), so which are they talking about. If we multiply 12,000,000, (their MSC), times the number of days in 52 years, we get a number close to 227 billion, their “combined reserves” figure.  So their MSC of 12 million barrels per day is, very likely, total liquids. However, they mix their data so often it is hard to tell.

On the same page they say:

The Company generated revenues by utilizing the spare capacity provided by MSC of SAR 133.0 billion ($35.5 billion) from 2013 to 2018.

In their own words, they have been producing at maximum sustainable capacity since 2013. Let’s see what the numbers say. According to their data above, LNG is 11.72% of their reserves, and we assume, of their production. So if we assume condensate is at least 5.3% of production, (in the US it’s between 8% and 16%), then we add 17% to get Saudi total liquids production.

So yes, Saudi has been producing at maximum sustainable production, at least for the last four years. That is not to say that they are currently producing at MSC levels.

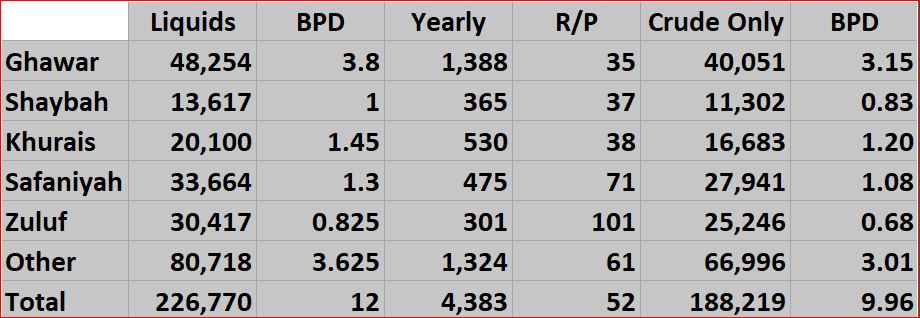
I have created the below table using 17% for Condensate + NGLs. All data except the R/P ratio is in million barrels. Understand these liquids reserve numbers are Saudi’s own figures, not my estimate. The “crude only” numbers are assuming condensate plus NGLs are approximately 17% total liquids.

Dr. Mamdouh Salameh has commented on this prospectus. I thought his comment worthy reposting here. And I might add I agree completely with his conclusions. Bold mine.

Dr Mamdouh G. Salameh is an international oil economist. He is also a visiting professor of energy economics at the ESCP Europe Business School in London. Dr. Salameh holds a PhD in Economics specializing in the economics and geopolitics of oil and energy.

There was a lot of fanfare about Saudi Arabia created by investment banks which are destined to benefit hugely from Saudi Arabia seeking to launch a major bond issuance to help finance its acquisition of 70% stake in Saudi petrochemical giant Basic Industries Corporation (SABIC).

With supposedly 266 billion barrels (bb) of proven reserves, exports of some 7 million barrels a day (mbd) providing an annualized revenue of $171.19 bn at current oil prices and production costs of $7.5 per barrel before tax, Saudi Aramco could to all appearances be confirmed as the world’s most profitable company. However, appearances could be deceptive.

To help a successful bond issuance, Saudi Aramco has for the first time since it has become a fully-owned Saudi company issued a prospectus in which it shed some light on its finances on what is being touted by investment banks like the discovery of the secret of long life.

However, the prospectus left many crucial questions unanswered. Prominent among them is the real size of Saudi proven reserves and the production levels of its very aging oilfields which underpin its current production. 

Four giant oilfields Ghawar, Safaniya, Hanifa and Khafji (shared with Kuwait) all of which are more than 70 years old and which are being kept producing by a huge injection of water, have over the years accounted for more than 90% of Saudi oil production with Ghawar accounting for 50% of the total. 

Now the Saudis are saying that Ghawar which is the core of Aramco’s oil production and which has been for years contributing 5 mbd to Saudi total production, can only produce 3.8 mbd. If this is the case, then the persistent reports about depletion of reserves which have been circulating for years about Ghawar must be true. It is fair to suggest that the same depletion would have also affected the other aging oilfields. This is supported by the fact that Saudi oil production peaked in 2005 at 9.6 mbd and has been declining since. In a nutshell, Ghawar could be the Achilles heel of Saudi oil production. 

This also gives the lie to Saudi claims that they have a production capacity of 12 mbd meaning a spare capacity of 2 mbd.

Meanwhile, the persistent question marks about the actual size of Saudi proven reserves will continue unabated until a truly independent audit is undertaken.. Far from having proven reserves of 266 bb, I estimated the remaining Saudi proven reserves at no more than 70-74 bb. By adding Saudi production since the discovery of oil in 1938 till now (for which we have figures) and then deducting them from Saudi claimed proven reserves along with an annual depletion rate of Saudi aging fields averaging 5%-7% for the same period, my calculations came to around 70-74 bb of remaining reserves.

  The fact that Saudi Arabia’s proven reserves remained virtually constant year after year despite sizeable annual production and a lack of major new discoveries since 1965 is due to the Saudis increasing the oil recovery factor (R/F) and the oil initially in place (OIIP) to offset annual production. The Saudis have been declaring an R/F of 52% or even higher when the global average is 34%-35%. They have also increased the OIIP from 700 bb to 900 bb on the basis of Saudi Aramco projecting new discoveries which are yet to be discovered. 

And for a different opinion from Michael Lynch:

Declining Production At Saudi Arabia’s Largest Oil Field Is Not Cause For Concern

Why did Ghawar’s production decline? Since the field still has 48 billion barrels of proved reserves (according to Aramco’s numbers), maintaining 5 mb/d should be technically easy. However, the field is not a stand-alone operation; Aramco has a choice of investments among numerous fields, and explicitly chose to add capacity elsewhere, as proven by the fact that the national capacity is 12 mb/d, showing no signs of decline.

Got that? Ghawar is declining simply because ARAMCO chose to move production elsewhere. Lynch is right if Ghawar still has 48 billion barrels of oil. Euan Mearns estimated that Ghawar had 43 billion barrels of recoverable reserves in 2004. If that is close then Ghawar should have about 18 billion barrels of recoverable reserves left.

Michael Lynch and Robert Rapier are among a dwindling few oil people who still believe Saudi Arabia’s absurd reserve numbers. After this Saudi prospectus, it is likely that the vast majority now agree with Dr. Salameh. However, it is possible that Robert could have revised his opinion after reading the Saudi prospectus.

And another contrary opinion from climate change denier site WUWT

No… “The biggest Saudi oil field is [NOT] fading faster than anyone guessed”…

The author of this article, David Middleton, makes the absurd claim, “The MSC rate is more of a minimum rather than a maximum. That sentence just shows the absurd levels of twisted logic deniers will go to in order to deny the obvious.

There are many replies to this WUWT post, pro, and con. Many of the replies are from people who actually worked, or talked to people who worked on Ghawar. I will quote one of them, Mr. Glen Morton.

I am a geophysicist and former exploration director for a large independent oil company. At one time I had the top web page on Ghawar on the internet and have studied this field extensively. At one time, I was in charge of reservoir simulation for my company. Every seminar and meeting I went to I talked to people who had worked Ghawar doing reservoir simulations. Absolutely everyone of them said the field didn’t have the reserves people thought it did in the West. In 1996 at the SEG convention, a Saudi Aramco employee gave a paper showing the water level for northern Ghawar and it was nearly at the crest of the field. Yes, the southern part of Ghawar had less permeable and porous rocks than the north and that was developed in a drilling mania in the first decade of this century. I for one do not think you are correct about Ghawar not declining fast. One guy told me that they had drilled a well for a core below the water level to see how much residual oil was left in northern Ghawar. Because of the vugular nature of the rock, there was only about 10% residual oil saturation. I for one find the Bloomberg article consistent with everything I know about Ghawar. I think Ghawar’s problem is why the Saudi’s were unable to ramp up production fast enough to kill off shale in 2014–go look at their production and it gradually rises from something like 9.5 million a day to 10.5 a day over a period of a year or so. That is my recollection of that curve. There was no step function in Saudi production.

Conclusion:

In 2004 and again in 2006, we had hints, from Saudi officials themselves, that Saudi oil fields were beginning to have serious water cut and depletion problems. Now with this bond prospectus, we have the coup de gras. Ghawar and the majority of Saudi’s other super-giant oil fields are in serious decline.

The idea that Saudi still has 266 billion barrels of proven reserves must now be regarded as pure fiction. The Saudis themselves are no longer supporting that figure. They are now saying 256.9 billion barrels of oil equivalent. That included condensate, NGLs, and natural gas. Their oil reserves, they say, are 201.4 billion barrels of C+C. But even those numbers are absolute fiction. They have been lying for years so why should we start believing them now.  Then they say they got their decline rate down to almost 2%. But then they confuse things by claiming this is also their depletion rate.

My estimate of Saudi reserves. I agree with Dr. Mamdouh Salameh, Saudi likely has between 70 and 74 billion barrels of recoverable reserves.


260 thoughts to “OPEC March Data and Saudi Report”

  1. EIA – U.S. Petroleum Balance Sheet
    A crude oil build of +7 and a gasoline draw of -7.7 (record 3rd largest draw). Finished gasoline supplied is up but also refinery outages have probably played a part as refinery crude input is lower than last year
    pdf file http://ir.eia.gov/wpsr/overview.pdf
    Oilytics chart summary https://pbs.twimg.com/media/D3zNFjGW4AElO-6.jpg
    4 wk ave. imports https://pbs.twimg.com/media/D3zL-QkWAAE_Inj.jpg

    Japanese weekly inventory change, crude oil -2.82 million barrels
    https://pbs.twimg.com/media/D3xoRdfX4AABUAM.png
    Fujairah weekly inventory change, total: +1,811 thousand barrels.
    https://pbs.twimg.com/media/D3xpZsfWAAA4unH.png

  2. 2019-04-10 (Reuters) The battle for Tripoli is still raging, and little is certain.
    Some diplomats who had met Haftar many times and lobbied their governments to overlook his hardline comments – such as that Libya was not ready for democracy – despaired when it became clear he was committed to taking the city by force.
    Haftar, for his part, has been consistent in speeches and statements about his commitment to military force in his declared mission to restore order to the north African country and also dropped hints about ultimately ruling the country.
    https://www.reuters.com/article/us-libya-security-haftar-insight/how-libyas-haftar-blindsided-world-powers-with-advance-on-tripoli-idUSKCN1RM0PJ

  3. RON,

    Excellent post. Great job on all the Saudi data. If you believe that the Saudi’s total crude oil reserves are closer to 70-74 billion barrels, what sort of realistic annual production can they pump for an extended period? Or do you think their production will start to really fall in the next few years?

    Steve

    1. The below is Saudi Arabia’s annual average, crude only. I don’t ever expect their average to be their 2016 average. The 2019 average is the first three months only.

      I do expect their production to start to decline, but not all that fast.

    2. Steve,

      We will know what MSC is for Saudi Arabia when oil prices rise to $110/b. So far the MSC for any 12 month period has been 10.46 Mb/d of C+C output (Dec 2016). If we include NGL (as BP does), the MSC in 2016 was 12.4 Mb/d, which implies NGL output in 2016 of 1.94 Mb/d.

      I imagine that even if the 72 Gb proved reserve estimate is correct, KSA could probably maintain the 10.46 Mb/d output though 2025 at least. Note that US proved reserves were 42 Gb at the end of 2017. So far MSC for US (highest 12 month average output) is 11.1 Mb/d for C+C output (most recent 12 month average US C+C output).

  4. Hi Ron,

    Generally I would go more with the estimates of a geophysicist, geologist, or petroleum engineer than an economist.

    Also note that if proved reserves were 72 Gb, then 2P reserves (best estimate) are likely to be 115 Gb.

    Reserve estimates change in the US, typically increasing at an average rate of 2% per year (or that was the case from 1980 to 2005). In Twilight in the Desert, the 1979 estimate from US companies for Saudi 2P reserves was 177.5 Gb and 111 Gb of C+C was produced from 1980 to 2017. That would imply 66 Gb of 2P reserves if there had been no revision of reserve estimates in the past 40 years. If we assume Saudi reserve estimates were revised at the same average rate as US reserves from 1980 to 2005 (2% per year) and then reserve growth ceased from 2006 to 2017 (unclear why this would be the case), then Saudi 2P reserves would be 167 Gb at the end of 2017. Below we have a Hubbert Linearization which suggests a Saudi URR of 277 Gb and implies remaining reserves of 166 Gb at the end of 2017. Note that Hubbert Linearization is a flawed method that in most cases underestimates remaining reserves.

    See also page 98-99 of link below
    https://aspofrance.files.wordpress.com/2018/08/35cooilforecast.pdf

    The link above is an August 2018 estimate by Jean Laherrere and his URR estimate for Saudi Arabia is 300 to 350 Gb, if we take the average of 325 Gb, this suggests about 214 Gb of remaining C+C 2P reserves, very close to the Saudi estimate (201 Gb).

    Perhaps they read Mr. Laherrere’s work. 🙂

    1. Generally I would go more with the estimates of a geophysicist, geologist, or petroleum engineer than an economist.

      Good! How about this guy?
      I am a geophysicist and former exploration director for a large independent oil company.
      I quote him up top. He has two other comments in the 121 replies to this post:
      No… “The biggest Saudi oil field is [NOT] fading faster than anyone guessed”…

      Mr. Morton has two other comments there in addition to the one I quoted up top. Here is part of the second one:

      If the max rate of production today is 3.8 million per day, that is around a 25% decline from 15 years ago. Talk about micrporous saturation (most of which will never see the surface tank) really pales in comparison to the data we have on the actual number of barrels produced in the past vs what is said to be the maximum possible production today. I will stand on the schist and on my position on this issue.
      I guess I am a bit surprised that yall think a 75 year old field wouldn’t have problems producing at earlier rates. Anyway, as I said, I will stand on the my schist.

      Also there are six replies there by “brianjohn” who states:

      I was the lead production engineer for several pilot projects. They were in 2 offshore fields (Abu Sa’fah and Berri) and in “production challenged” areas of the Ghawar field (in Uthmaniyah and Haradh)

      Okay, he was the lead production engineer who actually worked in the Ghawar field. Would you value his opinion? I would suggest you read his comments along with those of Mr. Morton.

      1. Ron did these guys give an estimate for proved reserves for Saudi Arabia or for Ghawar?

        I do not doubt that production is lower today in Ghawar, I doubt the 72 Gb reserve estimate by an economist.

        Did these guys give estimates? I didn’t find any.

        Most of the discussion was about MSC, I agree that would be a maximum rather than a minimum.

        For crude alone it looks like about 10.4 Mb/d, and for C+C+NGL roughly 12 Mb/d based on the data. Perhaps KSA has peaked, we will know for sure when oil prices rise to over $90/b.

        1. No, they did not. They just showed that Ghawar, and the rest of Saudi Arabia has suffered tremendous depletion over the past 75 years or so. However, there is nothing alarming about that. It is only what one would expect. Except for those who believe Saudi has “Magic Oil”. That is when a barrel of oil is produced another barrel magically appear to take its place.

          1. In the US we have the same magic oil I guess. Without revised reserve estimates US oil reserves would be negative. 🙂

            Laherrere estimates URR of 325 Gb (300 to 350 Gb), cumulative production through 2017 was 111 Gb, this suggests 214 Gb of remaining reserves, fairly close to the Saudi 201 Gb estimate for C+C.

            1. Dennis, I am curious. What do you think caused the decline in Ghawar production? Do you agree with Michael Lynch, that there was really no decline, they just decided to cut Ghawar production for some other reason. And they could easily ramp back up to 5 million barrels per day if they wished to do so?

            2. Ron,

              I imagine the Northern end of the field probably is spent, or nearly so. We don’t really know what has been happening to output in the fields of Ghawar, or I don’t.

              Let’s say output was 5 Mb/d in 2005 and that in 2018 it was 3.8 Mb/d, that would be about 2% decline per year from 2005 to 2018, exactly the number the Saudi’s have given for the decline rate target with infill drilling.

              Generally I don’t agree with much that Michael Lynch has to say. My expectation is that Ghawar will continue to decline at 2% per year. In 13 years (2031) output may be down to 2.89 Mb/d.

            3. Well, no, Ghawar is not declining at 2% per year. Ghawar did not start declining in 2004. And the southern two fields are not declining at all. The northern three fields reached their Seneca Cliff somewhere around 2010 and began declining at several times 2%. They will decline to near nothing in the next few years. Then Ghawar will have level production at somewhere around 2 million barrels per day and hold that level for a decade or two.

              Ghawar cannot possibly be adequately described as one field. It is five different fields with five different decline and depletion rates.

              When Saudi said, in 2006, that their average decline rate was down to almost 2%, that was the average for all their fields. Some fields were declining at a much faster rate and some fields were not declining at all. Khurais and Manifa were still to be ramped up. Those fields had been in mothballs and would be brought back on line. Now they are likely not declining at all but other fields are declining at a much faster rate than 2%.

              But here is the important point. The depletion rate is another matter altogether. That figure is likely above 8% per year.

            4. Hi Ron,

              Do you have production data for the various fields from 2006 to 2018? Seems we have very limited information on output from these fields for the past 12-14 years, so your description may be correct, but it seems there is not a lot of data to back it up since Euan’s post in 2004, the model looks interesting, but whether it is in fact correct is unknown. In other words his total output for Ghawar proved a good guess and it seems likely that Ain Dar and Uthmaniyah would have very low output (perhaps zero) by now as they were about 80% depleted in 2004. Euan’s model has output decreasing to 2.4 Mb/d by 2030 or at an average rate of 4% per year over the next 11 years. So far his model has been excellent and it might prove correct through 2030. It is not clear if other fields can ramp up output, clearly somewhere in Saudi Arabia took up the slack of the 1.2 Mb/d decline in Ghawar output, plus a little extra compared to 2004 output. It may be difficult to repeat that feat as there are not a lot of great prospects, but perhaps they can speed development n other fields by faster completion rates.

              Of course I realize this increases the rate of depletion, the faster you pump, the more quickly remaining reserves are reduced.

            5. Do you have production data for the various fields from 2006 to 2018?

              Dennis, you know better than ask such a silly question. Saudi production of individual fields is a closely guarded secret.

              Dennis, have you ever wondered why the Saudis keep all this data such a secret? Why don’t they just let the actual data known to the world? What was the production data from Safaniya in 2018? Or what was the production data from Manifa in 2018? Or what was the production data from Khurais in 2018, or from Berri, or from all their other fields? And how did that compare to the production in 2017, or 2016?

              Dennis, we don’t know shit about any of this. We don’t know because it is a closely guarded secret. Why, Dennis, Why?

              They know Dennis, they know and they don’t want you to know. Why?

              I know why Dennis. Because what they actually report, which is almost nothing, is a lie. You simply choose to believe it. I do not. I choose to believe the analysis who try to figure out why they are lying. You choose to simply believe the Saudis.

              Dennis, the idea that Saudi Arabia has 266 billion barrels of reserves is preposterous beyond belief. Even the Saudis realize that now are trying to slowly reduce that figure. Yet some people, like you, Robert Rapier and Michael Lynch, seemed perfectly ready to believe such an absurd figure. That just floored me. Goddammit, have some people gone insane?

              Okay, I have said my peace here and showed my ignorance as to what Saudi Arabia actually can produce for the next 50 years. But you know, it is what they say they can produce.

              You believe them. I don’t. And neither of us can prove our case. And there it must rest until the actual production data comes in… next year and next year and…..

            6. Hi Ron,

              Michael Lynch is also an economist, so I don’t put a lot of stock in what he says. Robert Rapier is an engineer who has worked in the oil industry and is pretty knowledgeable, Jean Laherrere also knows a lot. The Saudis say their proved reserves are 201 Gb for C+C, that is probably too high (this would be 320 2P reserves and I think that is likely to be too high).

              The likely reason the Saudi reserves are not revealed is that all the OPEC nations lie about their reserves to get bigger quotas, as you well know.

              In 1979 American companies estimated Saudi proved reserves at 110 Gb and 2P reserves at 177.5 Gb (data from Twilight in the Desert). In 2018 Laherrere estimated URR for KSA at about 325 Gb, so at the end of 2017 2P reserves would be 325-111=214 Gb and proved reserves would be about 133 Gb. As Laherrere often says the 2P estimates are the best estimates, so I pay attention to those.

              So I tend to believe Laherrere’s 2P estimate of 214 Gb rather than the Saudi 2P estimate of 320 Gb. Sometimes HL can underestimate so potentially remaining 2P reserves might be 260 Gb for C+C (average of Saudi and Laherrere estimate).

      2. Unfortunately it looks like those comments have been removed from that site Ron.

    2. Error in my chart above, cumulative production was 149 Gb so remaining reserves would be 128 Gb for 2P reserves and proved reserves would be about 80 Gb, not that far from the 74 Gb proved reserve estimate of Salemah.

  5. Good work Ron.

    When this is true, that’s the reason China is pushing electric travel as hard as they can.

    They have more possibilites to know the truth (secret service) than we reading reports. And with SA and Russia having only round about 80 GB left, and producing each round about 10 mbpd, there are not many years left before a major oil incident.

    I wonder why oil prices are that stable at the moment. Oil production fell hard this year so far, down everywhere except USA. And there the growth is decelerated.
    And demand is still climbing, it will use up all the US growth projected by the optimistic EIA.
    A 500 kbpd decline from OPEC is not included here, they still calculate with an increase from opec.

    Last question: Where is Russia standing at the moment?

  6. Ron,

    I’m wondering if you can help solve a mystery.

    In the bond prospectus SA revelaed their financials. Puzzling to me was the claim of revenue of $356 billion.

    Why puzzling?

    Because Brent averaged ~$75/bbl in 2018. Divide $356 by $75 and you come up with 4.75 Gbbl, which when we divide by 365 days in a year, we get 13 million barrels per day production.

    ???

    I can’t get their numbers to work. Even with a 10% premium on their grades of crude (generous), that leaves 11.7 mbd of production…. I can’t get anything to line up here.

    Any ideas?

    1. Chris,

      They also produce NGL and natural gas, in 2016 it was about 1.94 Mb/d or 708 MMb of NGL, I have no idea what the average selling price is for NGL on World markets, it would depend on the mix of NGL of course.

    2. Saudi Arabia, in 2018 produced approximately 3.76 billion barrels of crude only. Their BOE produced was approximately 4.75 billion barrels. That would account for the revenue is they sold every barrel of it. But they consumed a lot themselves. So other than that I have no explanation. Do they count their own consumption as revenue?

      1. EIA has about 4.5 Gb of total liquids produced by KSA in 2018, that would imply $79/boe average selling price.

        I suppose in accounting terms the Saudi Government could pay Aramco for the subsidized oil and the 4.75 Gbo would give us the $75/boe selling price.

        1. Aramco produces oil and gas and sells it to foreign and domestic users.

          Saudi power companies that buy oil and gas are separate companies.

          Saudi Arabia has the perfect situation to develop solar power, lots of sun and the reward of being able to sell another 3.5 million barrels of oil per day.

          What is stopping them?

          They intend to produce only 10% from solar by 2023

          1. “Saudi Arabia has the perfect situation to develop solar power, lots of sun and the reward of being able to sell another 3.5 million barrels of oil per day.

            What is stopping them?

            They intend to produce only 10% from solar by 2023”

            I’ve been wondering myself why they aren’t going solar faster, thus saving millions of barrels that could pull in billions in cash…. obviously more cash than the oil itself will ever bring in.

            I don’t know why they are so slow about it, but here are my semi educated guesses.

            One the royal family has been undergoing a generational and cultural transition, and it’s altogether possible that because of internal political considerations, that it has been difficult to impossible to change things around very much, in terms of their overall management plan. There are probably tons of people with power and influence who want things to stay the way they are now, because change would hurt them personally in terms of power and money.

            Maybe the entire country IS a pressure cooker about to explode, as I have read in various places, and the government aka the royal family has been unwilling to rock the boat by way of making any serious new changes for fear of losing control of the country. I do know, or at least believe, that in spite of the incredible amount of money oil exports bring in, the national budget is pretty tight, and that the royal family has managed to stay in power mainly by buying the loyalty of the people as a whole, and that most of the money that isn’t siphoned off, maybe ALL of it, is spent as fast as it comes in.

            And last but not least, maybe they’re holding of going solar on the grand scale for the same reason I’m holding off at the personal scale. Maybe they believe that every year they delay the investment, they will get so much MORE for their money that they’re simply watching the prices of solar farms fall from one year to the next, and holding out for more capacity for less money.

            The real answer is likely some combination of these and maybe some other explanations.

            1. ofm

              There certainly are power struggles going on in Saudi Arabia.

              https://oilprice.com/Geopolitics/Middle-East/Is-A-New-Crisis-Brewing-In-The-Saudi-Royal-Family.html

              They are so busy trying a hold on to power, remove people from power, fighting a war in Yemen that constructive planning becomes very difficult.

              Repdo may be getting there act together and are releasing tenders this year.

              https://www.pv-magazine.com/2019/01/10/saudi-arabia-to-tender-2-22-gw-of-solar-in-2019-and-wants-40-gw-in-2030/

              We will only know in 3/4 years if they have any chance of reaching the 40GW of installed capacity they now plan by 2030.

    3. The most compelling point in this is how it undercuts the narrative of KSA being under pressure because of domestic spending. This is enormous money flow into the kingdom. They have no particular problems.

      There is then the question of . . . why borrow money at all? Mostly . . . to establish themselves in that market. With rates so low, it’s a favorable cost of capital matter.

  7. hubbert linearization generally has three regions… first is limited drilling, second is horizontal drilling, third is ‘crash’… given time with horizontal drilling be long due to under producing… third region should be entered soon..

    1. Cameron,

      I guess we will see, Mr. Laherrere has been doing this for a while, his HL estimate for KSA is 350 Gb.

      1. The last 10% of EROIR oil is uneconomical to produce… and crashes. Unless some form of terary recover is pursued?

      2. Dennis,

        Can you please send me a link regarding Laherrere estimates of Saudi Arabia. I couldn’t find the specific figure of 350Gb.

        Thanks

        1. HL KSA using 2005-2017 data as Laherrere does (data from EIA for C+C). Cumulative output to the end of 1972 is 16.99 Gb. Using the equation for the line, the URR is 357 Gb.

          1. I seriously doubt the 350 B bbl EUR.

            Note the SA rig count plot above (in the article) … the drilling steps up in ~2005 — about the time data used in the above HL begins. I suspect this is infill drilling. That is, mere acceleration of existing reserves (i.e., keeping deliverability up, not adding reserves). If so, extrapolating it to get an EUR is very misleading.

            For what it’s worth, I’m a petroleum engineer with 30 years experience…but, the above observation requires no knowledge of engineering…it should be obvious.

            1. Good point Roger. That is the point in time when they reduced their decline rate from 8% to almost 2%. And of course, that increased their depletion rate. Yes, yes, that would make the HL estimate very misleading.

              Damn! Why didn’t I think of that?

            2. Actually a Hubbert Curve would be consistent with maximum depletion rates, that is why it gave pretty good results for the US L48. So let’s look at Saudi Arabia’s output Curve, doesn’t look like a hubbert curve, especially 1981 to 1991.

              Plot below shows a 1998-2018 Hubbert Curve estimate. Note how the 1991-1997 data is far from the line, the actual data follows a curve rather than a line as a logistic is a very poor estimate of the output curve.

            3. Dennis, don’t reply to me, reply to Roger, the petroleum engineer with 30 years experience. He made the argument, I just agreed with him…. and I still do.

              The 91 to 97 line gives a recovery rate of about half the later line gives. But even that line must be shortened by the fact that infill drilling only decreases the decline rate while dramatically increasing the depletion rate.

              You have not addressed that point! Why?,

            4. Hi Ron,

              Nobody has drilled faster than the US. When there was a drilling frenzy in the US during the 1973 to 1983 period of rising oil prices, the HL plot became steeper, not flatter. So a period of higher depletion rates would tend to have the reverse effect on the Hubbert plot as you seem to believe.

              Roger may be thinking about individual well profiles, the characteristics of an entire field when all well output is aggregated has different behavior.

              Yes the 91-97 HL plot points to about 150 Gb for the URR, do you believe that is accurate? Cumulative production is 153 Gb, so that would suggest 2P reserves would be negative 3 Gb. 🙂
              “Shortening” the 91-97 estimate would make remaining reserves more negative.

              If you believe proved reserves are 70 Gb then using the 1978 2P/1P reserve ratio of 177.5/110=1.6, we would have 2P reserves at 112 Gb, cumulative production to the end of 2018 is 153 Gb so URR=153+112=265 Gb, this would be the minimum we would expect.

              Mr Laherrere expects URR for KSA will be 35 to 85 Gb more than this, I think he is correct and my expectation is the higher estimate of 350 Gb is more likely to be correct.

              The HL method has plenty of problems as Robert Rapier pointed out long ago on the Oil Drum.

              It works only if output follows a logistic function which is rarely the case. Worked pretty well for the US L48 onshore conventional C+C, but that is an exception to the general rule which is a tendency to underestimate URR especially for early estimates when annual production divided by cumulative production is more than 5%.

              Early HL estimates for US production prior to 1950 also tended to result in URR estimates that were too low. A 1920-1950 US HL plot points to about an 80 Gb URR, low by more than a factor of 2. A plot on 1935 to 1950 does a bit better pointing to a URR of 140 Gb (note that in each case the estimate is too low).

              US L48 onshore conventional plot which excludes Alaskan, GOM, and tight oil output is below, the flat part is 1965-1970 and the steeper section following is 1971 to 1980.

              Chart is small, click on it for larger view.

  8. Announcement this morning of “bipartisan” bill being floated to cut oil consumption via EV subsidy expansion/extension.

    Two Republican Senators, both green types and of little influence when votes are not close. No GOP House members mentioned as being on board. Bill probably dies in committee.

    Budget stuff and the debt ceiling are coming. This other stuff will be off the radar screen. The Mueller event has eroded agenda defining power of the left. Tesla may not have years remaining they can wait, either.

    There was a blurb out the past few days . . . somewhere. About how the pie chart of transportation dominating oil consumption was reorganizing towards plastic. Seems doubtful. We need a new pie chart.

    1. interesting how you choose to frame/spin this-
      “bipartisan” bill being floated to [cut oil consumption] via EV subsidy expansion/extension”

      you could have just as easily said something like-
      continue current levels of support to GM and Tesla for their EV sales, or
      support the nations early phase efforts to keep up with the Chinese and European auto industry, or
      continue with the early phase efforts to reduce carbon emissions.

      I point out here that the slower the US innovates on energy, the less of a fraction of the worlds market will be open to its products in this huge economic space.

      Don’t insulate your house, it just a green plot to kill the coal industry.
      Don’t quit smoking, its just a movement to put surgeons out of business.
      Don’t buy a model T, it just a scheme to replace horses.

      1. dood, there’s no agenda. Just an evaluation of probabilities. “bipartisan” in quotes because the relevant Senators don’t move GOP policy particularly. The sponsors needed “bipartisan” to have any chance of passage. Won’t fly.

        And it was worded in oil consumption context because it’s an oil blog. Why would it be different?

        1. why would it be different-? you ask.
          Well for just one reason- being straightforward about the issue.

      1. IT doesn’t seem any more fact based than any other argument. It’shard to base a report on facts that haven’t happened yet It’s just another model done by a ” 240-person agency”. Others have come to other conclusions.

        The agency in question is the IEA. The IEA has been consistently wrong about the changes coming to the energy markets, as discussed here:

        https://www.quora.com/profile/Paul-Mainwood/Flotsam/A-modest-proposal-to-the-International-Energy-Authority

        To which the IEA responds:

        The World Energy Outlook (WEO) does not aim to forecast the future, but provides a way of exploring different possible futures, the levers that could bring them about, and the interactions that arise across a complex energy system.

      2. “Electrification of the vehicle fleet is going to happen slowly”
        So the market share for EV did not triple in three years? (2014 to 2017)
        Sales rate of plug in vehicles rose 61 percent in 2018.

        “We will probably see the peak of combustion engine car sales in 2018 based on global sales through October, plus estimates for November and December,” Felipe Munoz, global automotive analyst for Jato Dynamics, told Financial Times.

        As of January 2018, predictions were that the demand for ICE-powered cars will continue to grow until its peak in 2022. It turns out that the major drop in overall new car deliveries in the three largest regions in terms of sales, Europe, the U.S., and China, might have significantly changed the forecast.

        “When you look at 2018 since the summer, new car sales in all of the important markets are going down. Selling combustion engine cars to customers – this will not grow in the future,” commented Axel Schmidt, global automotive lead for Accenture.

        In 2019, global vehicle sales aren’t expected to decline as electric vehicles are expected to quadruple their market share to about 1.6 percent. Even if overall sales increase through the next 12 months, deliveries of ICE-powered vehicles will likely fall, say specialists.

        https://insideevs.com/combustion-engines-peaked-2018-ev-rise/

        Probably very few new vehicles produced without batteries in 2025 to 2030 time period. After that, almost none. ICEV’s will become stranded assets as producers of parts and repair facilities diminish.

  9. At some point the Seneca Cliff will be hit. If they are doing all this advanced recovery to to keep flow rates up then fields will probably hit a wall and crash rather than slow decline. Is my thinking correct on that?
    Karen

    1. There are lots of places oil can be made to flow as long as there is no requirement for profit — and when that steep decline arrives, there will be no requirement for profit.

      But it will only lessen steepness of the decline in a marginal way.

    2. Karen,

      There are many wells, they may not all water out at the same time. Take a look at US production before the tight oil revolution. Do you see a crash in output? Me neither. The Seneca cliff for World output requires heroic assumptions which are unlikely to be true in practice. There are many oil field throughout the World in varying states of depletion. Scenario below assumes a constant rate of extraction from conventional producing reserves from 2017 to 2065, the usual tight oil and extra heavy oil scenarios are used to estimate World C+C output (2800 Gb conventional, 86 Gb tight oil, 190 Gb extra heavy oil produced from 1870 to 2300).

      1. Dennis,

        I’ve been meaning to ask you for a while now, what program do you use to plot the data? It’s definitely not Matlab right?

        1. It is just Microsoft Excel. In some cases the models are in a spreadsheet, in others I created a simple python program that outputs to a csv file which I then use excel to create charts.

      2. Hi Dennis,
        I fully agree that there is only a vanishingly small chance that world oil production will hit a Seneca Cliff, for the same reasons that I argue that the world will not likely suffer a sudden global ecological collapse.

        The world is probably too big and too diversified a place for the end game to play out in a sudden collapse, unless we pass some particular environmental tipping point that knocks the legs out from under the global environment. Ditto the oil industry, it’s too big and too diversified, globally, to suffer a Seneca Cliff crash.

        It’s far more likely imo at least that collapse will be piece meal and regional over time and that some countries have a decent shot at pulling thru the coming bottleneck more or less whole.

        But any wide scale collapse, ecological or economic, could bring on really TOUGH consequences, such as say WWIII.

        Personally I think that if any of the five to ten biggest oil producers suffers a really major decline in exportable production, the effect will be to put the price of oil back above a hundred bucks, and that might throw the whole world into a new deep recession. Hot war is a real possibility.

        Are there any countries that currently export a lot of oil that are likely to turn into net importers within the next few years, other than maybe Venezuela?

        1. OFM,

          I don’t follow net exports, as I assume markets will take care of this, too many moving parts for me, I prefer the big picture.

          As far as oil prices at $100/b in 2017$, this is not likely to be a problem, perhaps $160/b in 2017$ might cause an economic slowdown. Keep in mind that in 2011 to 2014 when World oil prices averaged around $115/b in 2017$ the World economy was growing by 3.3% in real (constant $) GDP at market exchange rates(IMF data). In 1981 the percentage of World GDP spent on crude oil was about 8% of the World economy. The World economy will be at 95 trillion in 2025 if we assume 3% economic growth and C+C output will be about 32 Gb and if 8% of GDP is spent on this oil output that would imply a price of $237/b in nominal dollars and a price of $194/b in 2017$ (assuming 2.5% annual inflation on average from 2017 to 2025). Prices up to $160/b may have little effect on the World economy and it will speed the transition to EVs, light rail, rail, electric buses, car pooling, biking, walking, freight by rail and water.

          In short there are many ways the World will be able to adapt. In fact the bigger problem by 2040 will be a lack of demand for fossil fuel, but that is a good problem to have and mostly a problem for fossil fuel producers who will not see it coming until it is too late. The workers will need to retrain to seal air leaks in homes and commercial buildings, install insulation, install heat pumps, as well as manufacture them, install PV panels for utilities and homes and businesses, install and manufacture wind turbines, build railroads and light rail, manufacture EV buses, trucks, cars, rail cars, you get the idea. There is much to be done, we just need to giturdun.

          1. Dennis

            Oil consumption has been increasing in all sectors and the growing global economy will require more oil in industry. You seem to think oil is just used in transportation. NOT true.

            https://www.statista.com/statistics/307194/top-oil-consuming-sectors-worldwide/

            Imagine oil production peaked today.

            In order for aviation to continue to grow, along with other industries that use oil. How many of the 98 million vehicles sold this year would need to be electric cars?

            How many electric motorcycles would have to be sold?

            https://motorcyclesdata.com/2019/03/25/world-motorcycles-market/

            Knowing these answers gives us a real understanding of what needs to happen.

            1. Hugo,

              First, oil will not peak today, it will peak in 2025.

              Take the 2 million plugin vehicles sold in 2018 (with about 58% average growth rate in sales from 2014 to 2018), if that rate of growth continues to 2025 then sales are 49 million in 2025 and increase to 78 million in 2026, cumulative light vehicles that are plugin increases to 94% by 2025. For simplicity I assume plugin vehicles use no fuel (eventually as the share of BEVs increases over time this will become true, here it is a simplifying assumption). If we assume the average ICEV travels 30 miles per US gallon consumed and drives an average of 12,000 miles per year, then with the replacement of ICEVs with plugins (rate of growth in plugins slows to 1.5% per year after 2026 ) we get consumption of oil by light vehicles falling from a peak of 26,3 Mb/d in 2021 to 2.03 Mb/d in 2045. I have not included heavy trucks and buses or motorcycles, those will also be replaced with BEVs and add to the decrease in demand.

              I realize oil is used in sectors besides land transportation (about half is used in other sectors). As oil prices increase, demand in all sectors may be reduced through greater efficiency and substitution.

            2. Dennis

              Surely you can see the unrealistic assumption of taking very low numbers with high percentage increase and extrapolating into the future. It simply never happens.

              Can you really imagine that the car manufacturers build 50 million diesel and petrol cars one year and the very next year rip out half of that production and build an additional 30 million electric vehicles. That is simply ridiculous.
              Not only do companies need to get rid of machines building diesel and petrol engines they have to order and install the new machinery that will build the new electric vehicles. They also need to retrain their workers.

              Look at Mercedes, these are all new cars, being built with new machines.

              https://www.mercedes-benz.co.uk/passengercars.html?csref=WEB1602080002_ppc_180216&s_kwcid=AL!160!3!292554137222!e!!g!!mercedes&gclid=EAIaIQobChMI5eiPtO_J4QIV6rDtCh1kLg6gEAAYASAAEgKJH_D_BwE

              and half a dozen new diesel and petrol models are coming out in the next couple of years.

              This is a far more realistic projection.

              https://www.jpmorgan.com/global/research/electric-vehicles

              and another

              https://bnef.turtl.co/story/evo2018?teaser=true

              11 million sales in 2025 and 30 million in 2030 is what the manufacturers are planning.

              You cannot buy what is not made and retooling and retraining will be a costly process.

              Also in many areas house have no front drive. Every single parking space will need a charging point. People will come home, park on the road and will need to be able to charge their car for the next day.
              To think this will happen in 5 or even 10 years is beyond hope. There is one charging point within 3/4 mile of my house and probably around 10,000 cars owners in this area.

              The scene below is typical all over England.

              https://commons.wikimedia.org/wiki/File:Nowhere_to_park%5E_-_geograph.org.uk_-_272993.jpg

              Fixing this chaos will take political will at government and local level.
              It took our council 2 years to paint a double yellow line on a hump back bridge to stop accidents.

            3. Hugo,

              Pretty sure I said the projection was not realistic. So I agree.

              Note that in this unrealistic scenario it takes 7 years for this to occur. In reality it will take longer. Most mainstream estimates will be too low as they do not anticipate peak oil.
              The higher price of oil that may occur with a slower ramp in EVs will tend to accelerate the rate of sales.

              Once people start driving Teslas more widely and as charging infrastructure gets built out, many will consider the ICEV the horse of today. An interesting mode of transport that their parents use. 😉

              The Tesla model 3 is far superior to most other cars in its price range. About 33k for the standard rnge (220 miles) up to June 30 in the US.

            4. 33k? That is just over 45k AUD! Not including importation and tax costs. No one in their right mind would pay that in Australia for a model 3 (And it isn’t available here either, not sure why).

              The cheapest tesla in Australia is:
              2016 Tesla Model S 60D Auto
              Around 70k AUD. (according to carsales.com.au)

            5. Hi Dennis.

              RE: The Tesla model 3 is far superior to most other cars in its price range. About 33k for the standard rnge (220 miles) up to June 30 in the US.

              I know you recently purchased your Tesla, you can put an end to the controversy by posting a copy of your invoice, just leave off the address and any particulars.

            6. dclonghorn,

              My Tesla was more than that, and I got a $7500 rebate so my cost before sales tax was about 52,500. It has AWD, long range battery, and enhanced autopilot.

              Tesla recently eliminated the lowest cost Model 3, so in the US it is $36,950 until June 30, 2019, this “Standard plus” has autopilot (used to be a $3000 option) and a longer range battery than the “Standard version” (240 miles vs 220 miles).

              This was a recent change, supposedly one can call Tesla or visit a store to order the lower cost model.

              Not really a big difference between the lower cost model and mine aside from difference in range and options.

              https://www.tesla.com/model3/design#battery

            7. Hi Dennis, At $52,500 plus sales tax, most folks can’t afford a Tesla. Tesla has a reputation of using bait and switch marketing, and the $33k Tesla seems to be somewhat an illusion.

              There is certainly a market for electric cars today, but outside of China, that seems to be a subset of the luxury auto market. I would agree that someday electric cars will be common, but that will probably be a while.

            8. DCLonghorn,

              I agree most people cannot afford a 52K car (note that in some US states there is no sales tax and rates vary from state to state.

              Yes the low price Tesla seems to be an illusion, though most people don’t buy the lowest price vehicle available, it could be that most people thought the standard plus was worth the extra few thousand and maybe most customers were getting the autopilot option so they decided to make it standard, not sure. So the extra $4000, may be a deal breaker for many, a lot of vehicles are sold in the US that cost 37k or more.

              A nicely equipped F150 retail price is about 54,000, the best selling vehicle in the US. Even the bottom of the Line 4WD super cab F150 with 3.5 l V6 retails for $37,620, so clearly a lot of people are willing to spend 37k for a vehicle as the F150 has been the best selling vehicle in the US for quite a while, the nicer versions of the truck (Lariat) with more technical features and leather seats etc is similar in price to my more expensive Model 3, it seems a lot of the trucks that I see are these nicer versions.

      3. The Seneca cliff for World output requires heroic assumptions
        which are unlikely to be true in practice.

        I strongly disagree with that assessment. I believe the probability of a
        Seneca cliff is increasing. I think oil extraction is an economic
        phenomena, not a geological phenomena. During economic expansion, a
        positive feedback loop is in place: oil extraction produces economic growth
        which encourages investment in oil extraction producing more economic
        growth. Once peak oil occurs, I anticipate that this feedback loop will go
        into reverse: decreased oil production will produce economic contraction
        which will discourage investment in oil extraction reducing extraction rates
        leading to economic collapse.

        Without investment the IEA estimates that production would fall by 50% in
        2025 and by 80% in 2040.

        I actually think economic collapse is a great opportunity to introduce a new
        economic system. The one we have is not only unfair, it encourages
        environmental devastation.

        David Graebner asks rhetorically how a theory such as neoclassic economics
        based on false hypotheses perdures. His answer is that you teach the biggest
        lies in the first year. That’s why false preconceptions about the economy
        are so common. I think neoclassical economics chose the wrong mathematical
        tool to analyse the economy, they chose optimisation. I don’t see anything
        optimal in the economy, I think differential systems would be a much more
        appropriate mathematical tool with which to analyse the economy, keeping
        track of money flows.

        Our assessment of how the oil cycle will play out can be found here:
        https://www.tse-fr.eu/publications/oil-cycle-dynamics-and-future-oil-price-scenarios.

        1. Schinzy,

          Thanks for the input. Assuming the Seneca cliff scenario occurs, wouldn’t war be a likely outcome as a result? That’s the most likely scenario in my worthless opinion. There will be little to no chance to create a new economic model you suggest.
          What are your thoughts about a break out of war in the Seneca cliff scenario?

          Cheers

          1. A war? Between which countries? I know the question was not directed to me but I don’t think war is likely at all. I mean a major world war between powerful nations. Of course there will be civil wars all over, just like there are today.

            1. Hi Ron,

              I assume a Seneca cliff scenario would imply rapid economic collapse, as a result i think there will be war over resources. Between which countries i don’t know, but i assume U.S will go to war with Russia and or China, via direct war or proxy wars in regions were the countries national security depends on specific resources. So the middle east would as usual be a key area of conflict.

              I believe a Seneca cliff scenario would be a catastrophic one hence the reaction to such a scenario would also be catastrophic.

            2. U.S will go to war with Russia and or China, via direct war or proxy wars in regions were the countries national security depends on specific resources.

              Perhaps! However modern warfare tends to be very energy intensive. It seems to me a rather safe bet that in a post peak oil world, mostly running on renewables, it might be more likely that societies will be trying to conserve their energy resources and not waste it on war.

              But the verdict is not yet in, on whether or not humans are smarter than yeast!

            3. In the past countries that have gone to war with one another usually shared a border or a littoral zone. There was not a lot of energy for power projection. I feel it’s likely that any future resource wars will be fought between opponents in regional areas. China vs Vietnam/India/Taiwan, Iran et al vs KSA et al, USA/Columbia et al vs Venezuela, Egypt vs Libya, Iran/Syria/Lebanon/Hez vs Israel, China vs Russia for Siberia. Maybe a 3rd Congo War. They’re usually a god damned mess. Perhaps USA will fight China in an inter-regional conflict, but I doubt it, because there wouldn’t be much profit in it, and both have more profitable opportunities closer to home. Recent news has Turkey pivoting to Russia for high end weapons contracts, which usually means some level of accompanying security guarantees. Russia showcased really nicely in Syria and sales are hot.

            4. The idea that he US will go to war over oil with the Chinese and Russians is unlikely (IMO) because war is energy intensive, and combating credible foes on other continents is oil intensive, and therefore counter-productive.

              There are much better options for the US: (assuming a bond-villain level madman (as opposed to the “In Like Flint” level madman you have now). Annex Canada, go full-on protectionist with your economy, institute renewables and limit oil use.

              Voila! The US is able to go about a reduced version of it’s business while those who will be it’s real geopolitical foes (Russia, China, the Common Market) have to fight amongst themselves for the scraps. This is how I think the future will play out: globalism dies, old allies are let go or subsumed, and China and the Europeans try to get what’s left of the middle east and Russia’s oil.

            5. Among the possibilities that will never happen are to encourage the Northern Tier of oil using states to join up with Canada – esp when they are blue (from the cold) states such as Washington and Wisconsin.

              That will stretch out the oil that is left without extra political problems.

            6. Even post-peak, there will be plenty of oil on-hand among the major militaries to wage a full-scale war over remaining resources. The energy-intensive nature of such a conflict argument does not hold much weight. It seems like wishful thinking to me. Indeed, if it were a serious factor, it could actually trigger wars before the economic dislocation that is likely to result after an actual Peak Oil event–to take care of things before oil supply became a real problem.

              My read on the situation is that WW-III is most certainly being planned for among the major powers. This does not mean that it will happen, but it is certainly is in the direction of such. World wars do not just happen overnight–they require decades of carful orchestration beforehand, as was the case for both WW-I and WW-II. This includes everything from finding financing to building capital equipment (aircraft carriers are not built in a day) to the propaganda engines required to garner popular support for such battles. My suspicion is that this conflict is being planned for the 2030s, and it looks like it will involve the US, Russia and possibly China, among other players. This war could happen a bit earlier, though error in the forecast timing is more likely to be later.

              Why fight such a war? Difficult to explain in a few words. To put it simply: Those in power do not like to share power, and they will do whatever it takes to preserve what power they have though the Peak Oil crisis. If this requires a major conflict to ensure that x-amount of wealth flows in y direction, then that conflict is likely (but not certain) to occur. In as much as WW-II ended up with a major redistribution of wealth and power, WW-III could also result in the same for the victor, and if the odds are favourable to the right interests, a major conflict could certainly happen.

              Just my $0.02.

              -best

          2. Historically, according to Turchin and Nefedov, resource scarcity first led
            to inter-elite competition and then to civil war. The civil war might weaken
            the country and make it prey to invasion by foreign armies. There have been
            cases in which an autocratic ruler has attacked a neighboring country to
            avoid insurrection within their own country. There are already conflicts in
            the Middle East which one might relate to financial stress caused by peak
            oil.

            I am actually optimistic that a large scale war can be avoided. See my
            comment in response to Dennis below.

        2. Schinzy,

          Interesting paper, I would need to delve into several papers to understand fully. Neoclassical economic theory has plenty of problems, especially when it tries to explain macroeconomics, for an individual business I think it works pretty well, for the macro economy ridiculous conventions such as the auctioneer need to be invented to arrive at an optimal set of prices. Clearly there is no such method which determines an optimal set of prices in the real world.

          As to your conclusion that a shortage of exergy will lead to falling prices for exergy, this seems unlikely. Keep in mind that a shortage only exists if their is more ability for consumption (with both the desire and the money to fulfill those desires) than available product.

          So when one gets a counterintuitive result, one needs to look very carefully at the underlying theory. No doubt you have done so.

          Can you explain how a “shortage” of exergy might lead to falling prices for exergy?

          From page 3 of your paper:

          It is tempting to believe that in the case of shortage of an essential item in the economy the price of that item will rise. This is disputed in Illig and Schindler (2017) and Schindler and Schindler (2018) where it is clearly not indicated by the dynamic production function equations. Indeed the authors speculate that as exergy goes into decline,
          ∂p/ ∂E ≥ 0, (2.1)
          so that price actually declines with production.

          A problem might be how you have defined exergy (this is not well measured so undoubtedly you chose something as a proxy).

          There is a huge amount of waste in current energy systems, but over time the exergy per unit energy consumed has been increasing and will continue to do so as the percentage of fossil fuel utilized falls.

          Email me if you are interested in discussing. You may not want to pursue in a public forum.

          Another thought. Oil is not the only source of exergy, there is coal, natural gas, nuclear, hydro, geothermal, wind, solar, and biofuels.

          So there might not be a peak in exergy per capita as wind, solar, hydro, geothermal, and biofuels substitute for fossil fuels, it seems a mistake to reduce exergy to fossil fuel use.

          I absolutely agree that fossil fuel production is an economic phenomenon and especially in might tight oil model only consider that a barrel of oil will be produced if it is profitable to do so.

          For my conventional and extra heavy oil shock models there is no economic input to the models, it is assumed in those models that there is always adequate demand such that oil prices rise to a level where the marginal barrel is profitable to produce. That is certainly a valid criticism of the oil shock model. One that I should address.

          I also wonder if you assume that exergy causes the economic growth, you may have the causation arrow reversed. In any case when two things are correlated causation could go either way or both ways or neither way (spurious correlation).

          1. Dennis

            We could have a deflationary cycle such as in the Great Depression.

            https://www.frbsf.org/economic-research/publications/economic-letter/2009/march/risk-deflation/#2

            As an example food prices started falling because there were so many unemployed. Farmers could not sell their goods, so stopped producing.
            Even though supply of food diminished, prices continued to fall.

            http://ramwebs.wcupa.edu/jones/his480/reports/dep-food.htm

            Peak oil could cause very high oil prices which in turn causes a recessionary and deflationary spiral.

            When money can be printed with no account of something tangible, anything can happen.

            1. Hugo,

              If nobody has money to buy food then in economic terms that is a lack of demand. Classical Economics taught that there could be no lack of demand and that markets would be self correcting, Keynes master work showed that the classical economics was a special case of a more General Theory of Macroeconomics. As long as economists understand this theory another Great Depression is not very likely. Friedman and Swartz’s work on Monetary theory will also help, there needs to be adequate money supply and when there is a lack of aggregate demand the government needs to step in with fiscal stimulus.

              This knowledge is the reason the Great Financial Crisis did not become Great Depression 2, though European fiscal policy prolonged the crisis in Europe as much of Europe seems to be unfamiliar with Keynesian Theory or chose to ignore it in favor of neoclassical macroeconomic nonsense.

              If all nations in the World follow the European response to another financial crisis then a deflationary death spiral may be assured.
              We can only hope Europe and the World has learned from the European catastrophe that was the economic policy response to the GFC.

            2. Dennis

              All economic theory has it’s limits, they all work up to a point or in certain situations.

              Including your economic belief system.

              Your belief that limitless money supply will prevent another financial disaster is wrong.

              The reason being, finances are reliant on goods and this is a finite world. If raw materials were unlimited then your beliefs would hold true. Unlimited money meets unlimited raw materials. BINGO

              How will unlimited money repair this?

              https://www.weforum.org/agenda/2018/07/fish-stocks-are-used-up-fisheries-subsidies-must-stop/

              It is actually too much money that is destroying all the fish in the world.

              How will unlimited money fix this?

              https://www.theguardian.com/environment/2017/sep/12/third-of-earths-soil-acutely-degraded-due-to-agriculture-study

              Perhaps you think that the money another billion people will make will fix soil erosion?

              https://news.nationalgeographic.com/2016/12/groundwater-depletion-global-food-supply/

              Our fish are trawled to extinction for money, our forests destroyed for money. Vast amounts or chemicals are poured onto crops to make more money.

              And you really think money will fix what it has destroyed.

              https://www.theguardian.com/australia-news/2019/jan/24/darling-river-crisis-the-farms-without-safe-drinking-or-washing-water

              When limitless money meets limited natural world.
              I have absolutely no doubt which will win out.
              Economics will be seen for what it is, the exploiter of our natural world.

            3. Hugo,

              Yes monetary policy has limits, that is why fiscal policy is needed as well in an economic crisis.

              Where did I say limitless money solves any problem?

              In some cases a lack of money does indeed cause problems, that is why a deflationary spiral is so damaging. Any debts become larger in this situation and many loans are defaulted on, this causes an unwillingness to lend as well as a lack of demand because all financing dries up.
              With an inadequate supply of money the wheels of commerce grind to a halt as a barter economy is not very efficient (which is the reason money exists). You may not have studied a lot of economics, but this is all pretty standard stuff.

              Economics is just the study of how humans allocate scarce resources to provide for human needs. It is humans that exploit the natural world, economics is just the study of how we do it.

              Don’t blame economics, blame humans. Capitalism should be regulated properly to reduce negative externalities. The problems you point to is a failure of governments to properly regulate those negative externalities.

              Capitalism is far from perfect, but when properly regulated and with a tax structure that is highly progressive, including high estate taxes with all loopholes closed (this might include a 50% tax on money moved to offshore accounts in tax havens), it is a better system than any other devised so far.

              (I am thinking of the progressive nations in Europe, rather than the poor implementation of capitalism in the US where the wealthy have managed to capture government to increase their share of income and wealth.)

            4. Dennis

              You cannot regulate over consumption.
              People are inherently greedy, rich people build big houses that use up huge amounts of limited resources.
              Rich progressive Europe uses 3 times as much oil as India.
              Plentiful energy and money has enabled farmers to plough vast areas of land and deplete the aquifers.
              There are no regulations which will feed another billion people and prevent ecological destruction. 8 billion poor people could live on earth. 8 billion middle class people will destroy it.

            5. You can tax consumption and that will reduce it. For the wealthy we can tax income at 50% they will accumulate less and consume less. Regulations can be put in place to require businesses to take back worn out goods and pay for their recycling or disposal. This will change the way things are made so there is less cheap throwaway items. There can also be regulations on farming and other economic activity to reduce environmental impact.
              Note also that middle and higher income nations have lower total fertility ratios and as the world develops birth rates will fall and population will decline. That will probably be the biggest factor that will reduce environmental impact.

          2. Dennis,

            Let me first say first that my world view has been fundamentally modified in the
            last 14 years. The first tremors began when I started following the peak oil
            debate in 2005. The second major tremor began when my daughter introduced me
            to the culture of permaculture in 2009.

            I was astonished to learn in 2009 that many neoclassical economists
            discounted the importance of energy in economic production because of the so
            called “Cost Share Theorem” from neoclassical economics. Richard Feynman
            said: “If your theory is not compatible with empirical results, it’s wrong.
            It doesn’t matter who you are nor how smart you are.”

            In the above referenced paper, I am aiming at posthumous fame by assuming
            that exergy production, more commonly called energy production produces
            economic growth rather than the contrary. We make that assumption and reason
            from there. Our conclusions are different from those of neoclassical
            economists. We will see what happens, if we are wrong, well then we are
            wrong and our theory can be thrown out. If we are right, we might attain
            posthumous fame one day. That’s exciting!

            Take Venezuela as an example. There is a lot of oil in Venezuela, but
            production is crashing. Venezuela neglected its oil infrastructure for
            almost 20 years. Nationalisations lost money for foreign investors so they
            stopped investing. Inflation is very high. Workers in the oil industry are
            quitting because their salaries are too low to feed their families. Without
            foreign help, the feedback cycle has gone into reverse. The economy is
            collapsing with oil production. Could this happen elsewhere? I think so. I
            have a list of countries which I consider candidates to be the next
            Venezuela. I look for neglect of oil producing infrastructure and things
            that can scare away foreign investors: wars, corruption, theft, lawlessness,
            sanctions, etc.

            The reason I think large scale war can be avoided is ecoagriculture.
            Ecoagriculture is a strict subset of organic agriculture. Most organic
            agriculture is not ecoagriculture. Industrial agriculture fights against
            nature. Ecoagricultural techniques are like surfing the waves while
            industrial agriculture is riding a jet ski against the current. The more one
            learns about how plants grow naturally, the more one wonders how industrial
            agriculture works at all. In fact, the reason industrial agriculture works
            is cheap oil (and gas). That’s why between 3 and 5% of North Korea’s
            population starved to death in the 1990s after the Soviet Union halted
            deliveries of subsidised oil to the country. The Soviet Union also halted
            deliveries to Cuba. The Cubans did not starve because they brought in
            Australian experts in ecoagricultural techniques to show them how to grow
            food without oil.

            Ecoagriculture produces more food per hectare than industrial agriculture
            but labor inputs are higher. After peak oil, we will be obliged to switch to
            ecoagricultural techniques if we are to feed the world. If we switch to
            ecoagricultural techniques before peak oil, there are big advantages with
            respect to climate change. Ecoagriculture improves soil quality. The best
            indicator of good soil is its carbon content. There is 3 to 4 times as much
            carbon in the soil as there is in the atmosphere. Industrial agriculture
            vents this carbon into the atmosphere. That’s why agriculture is responsible
            for 24% of global greenhouse gas emissions while all of transportation
            produces only 17%. That’s why Toensmeier wrote The Carbon Farming Solution.
            The amount of carbon we can sequester in the soil by improving its quality
            through different land use can be found
            here: http://carbonfarmingsolution.com/carbon-sequestration-rates-and-stocks.
            By switching to ecoagriculture rather than being a source of green house gas
            emissions, agriculture could become a sink.

            Note that Venezuela is experiencing tremendous food insecurity. This food
            scarcity is not benefiting farmers. The government is forcing them to sell
            food below cost to limit the number of people who starve to death.

            But ecoagriculture is more than just a different way of farming. Those
            practicing it are introducing a whole different culture with different
            values. It is a bottom up phenomenon, not a top down phenomenon. Rather than
            fighting for scarce resources, they value better use the resources we have.
            I think it will fundamentally change our economy.

            But I have run on for far to long.

            1. I think of the economy as requiring a variety of inputs and if any was missing in the proper proportion economic growth would be lower, the idea of picking one of many inputs as the master input responsible for all growth seems silly from my perspective, one could choose almost any important input and focus only on that.

              As to changes in agricultural practices, I am out of my depth there.
              Seems it would be a difficult transition, labor is a very expensive input and farming is hard work that most people don’t want to do.

              In you Venezuela example, it is a classic case of mismanagement of an economy by a socialist regime, market economies are far from perfect, but they are a better solution than a top down administration of the economy by the government.

            2. “Seems it would be a difficult transition, labor is a very expensive input and farming is hard work that most people don’t want to do.”

              It seems to me that both “labour” and oil are “inputs”. Energy inputs.

              Of course the less expensive “input” will be chosen.

              In general people will avoid hard work. i.e. they will avoid providing their labour if at all possible. The gas mower will be preferred over the push mower.

              However, energy is required to mow the lawn regardless.

              And that is he reason that I don’t believe:

              “the idea of picking one of many inputs as the master input responsible for all growth seems silly from my perspective”

              Energy is the master input. Without energy nothing happens. Period. Economics seems to assume that “labour” is somehow always available. But without energy for food that is a false assumption.

              Economics seems totally blind to the realities of physics.

              Paul Isaacs

            3. >Energy is the master input

              I’d say information is the master input, but I work in the information business, not the energy business.

              One way or another, most energy is wasted, so current levels of consumption are nowhere close to being a reasonable benchmark of what the world economy needs. Your comment isn’t very useful without a proper benchmark of how much is actually needed.

            4. My comment was that the amount of energy needed is greater than zero and that the basic assumption of economics is that labour is available without any need for energy at all.

              That is simply not true in the universe that we inhabit. No bench mark is needed.

              Paul Isaacs

            5. Paul,

              No economics asumes there are a set of inputs for any production process, in every case both skilled labor, and energy are required inputs.

            6. Building and maintaining information networks requires energy. Building and maintaining a skilled population requires…

              to free up enough people to have either of those structures (info or skill) at the levels we are currently used to requires more energy than human labor can provide.

            7. Paul,

              I disagree. In most cases any production process requires a variety of inputs. Despite the fact that mass can be coverted to energy, generally this only occurs in stars. So setting aside Einstein’s brilliant physical insights, both matter and energy are needed for any physical process.

              And labor is more than simply energy expenditure, a doctor provides labor, but it is likely that something more than simply energy is provided.

              I disagree that energy has some special importance, it is simply a necessay input just like many others.

            8. Ecoagriculture fits in here because the “Green Revolution” of the sixties that brought the industrial idea of exploiting resources to farming. It was very successful in a lot of areas, not in all areas. It doesn’t work very well in arid regions, which suffer from lack of water rather than lack of fertilizer. That’s why dry northern India stayed poorer than wet southern and eastern India.

              But industrial agriculture also dries out the land. High nitrogen content coincides with high carbon content in natural soil. But the carbon rich materials absorb water as well. Nitrogen fertilizer allows farmers to neglect soil ecology, which leads to falling carbon content and dry hard soil. There is also a connection to the carbon cycle.

              Instead of seeing water, nitrogen and soil quality as three separate components, and dealing with each separately by exploiting outside resources, eco-farming attempts to manage a field in a holisitic way as a self sustaining system with minimum reliance on outside inputs. So it attempts to catch rainwater instead of pumping groundwater for irrigation. Reducing runoff reduces the need for water and keeps water absorbing soil from being eroded, so terracing is important. It re-establishes the connection between nitrogen rich soil and carbon rich soil.

              Other ideas including using chickens to improved land grazed by cattle, and cattle to improve grassland with rapid rotation through small paddocks. The chickens follow a few days later, spread the manure and eat the bovine parasites, reducing the need for chemical worming and improving the soil, while providing eggs. Reduced worming is good for soil ecology and cuts costs. And so on.

              In the sixties and seventies a lot of money was invested in East African development schemes involving maize bred for high performance. But they didn’t work well. Farmers preferred local drought resistant strains to avoid starvation in bad years, even if they produced less in good years. Imported fertilizer was too expensive. Imported diesel pumps for pumping water for irrigation often fell out of repair, due to ownership issues and fuel costs. A lot of development aid people despaired.

              A more modern approach focuses on sustainabilty instead of outside fixes. I’m already straying pretty far from oil production, but the point is that drilling oil and using it to provide energy inputs is far from being the only solution to economic problems.

            9. “I have a list of countries which I consider candidates to be the next
              Venezuela.” – Schinzy

              Care to share?

            10. OK, this list is very preliminary. In alphabetical order followed by the reasons they are on the list:

              Algeria: decreasing production, political problems, corruption.

              Angola: remarks by George Kaplan, financial problems, high decline rates, reports of under investment.

              Brazil: not immediate but, Petrobras high debt levels, corruption, spike in local fuel prices in 2018.

              Iran: sanctions, infrastructure in decline, local inflation.

              Libya: war, erratic production.

              Mexico: declining production, theft (of oil), increasing inter drug cartel violence (inter elite competition).

              Nigeria: political problems, theft, infrastructure in decline.

            11. Thanks for the info. FWIW I don’t feel too hopeful for U.K.
              There’s a writer/podcaster named James Howard Kunstler who had expressed a belief that Japan might be an early candidate for collapse/rapid contraction… you know, an island nation importing all it’s food and fuel etc, but I feel U.K. looks like more of a red flag. The Royals should make full transition to American reality tv celebrities before it’s too late.

      4. The US has not operated in a vacuum. During times of decreasing production, the US ultimately cold import oil to keep things running, allowing for brief periods with restricted supply (e.g. the 1970s oil shocks). It is a mistake to use the US analogy for the whole world. The Earth *is* in a vacuum (approximately speaking). My expectation is that there will be no oil imports from other planets to help out the “world” post peak. Under this circumstance, the probability that the global economy will suffer a major dislocation (e.g. the “Grand Depression”) goes up considerably. Under this situation, oil production could crash in spectacular fashion–i.e. shark-fin curve. This is in part due to a heightened likelihood for geopolitical feedback loops with negative consequences–from what I have seen, this an hugely under-considered aspect of the situation here–and any loss of oil production due to such events can act to exasperate an already desperate situation.

        1. Graywulffe,

          I actually agree with parts of your comment, keep in mind for the World there was substantially lower output over the 1979 to 1982 period and though difficult, the World handled it. The peak (if there is no major war in the middle east of the magnitude of the Iran Iraq war) will see a far slower decline in output by comparison. Oil prices will rise and the World economy will attempt to adjust.

          Where I agree is that I expect within 5 years of the peak that the stress on the World economy caused by peak oil may lead to GFC2. If the governments of most nations in the World respond with proper monetary and fiscal policy (more like China and the US and less like the European response to the GFC), then the recession may be short. In addition there is the potential for EV demand to accelerate in response to higher oil prices and this may temper the spike in oil prices as oil demand eventually wanes.

          Interesting times for sure, any scenarios of the future will certainly be wrong as 1/infinity=0.

            1. Graywulff,

              Thanks. One aspect in that case was that it was only temporary, but the decline in output was quite steep, the World reacted with greater efficiency and switched away from using oil to produce electricity, used more natural gas and propane for heating instead of oil, and fuel efficiency for vehicles improved dramatically. I had a 1980 Toyota Tercel that got close to 40 MPG (and it had a carburetor rather than fuel injection). This was a big step up from my 1968 Pontiac Catalina that got about 15 MPG on the highway and probably 12 MPG in the city.

              Also keep in mind that World C+C output was pretty flat from about 2004 to 2011 and conventional crude (excludes extra heavy and tight oil) was flat from 2004 to 2014, so the World can deal with relatively flat output and possibly a slow decline (1 to 2% per year) as well.

    1. Kuwait yearly average peaked in 2013. Their oil rig count for that year was 24. Their oil rig averaged 42 in 2017. I think Kuwait is past peak if you don’t count the neutral zone. But if the neutral zone comes online, they have a few years to go before peak.

  10. London finance…interesting as not NYC.. seems British commonwealth still owns Saudi…

    Terary recovery methods past 180G barrels with current American technologies? CO2, sololuminescence, Pyramid recover (lower water surface tension, easier extraction), other?

    Why British..British own Chinese markets and Yuan…? They print at leisure as locals get no pay.

  11. World demand is currently over 100 mb/day, while production is at about 99 mb/day. Does that mean we are using up the already produced reserves?

    1. German Guy,

      It simply means we are using oil that is being stored, the so-called oil stocks, eventually as these are reduced, oil prices start to rise and demand (consumption) decreases while supply (production) increases in response to the change in oil price.

  12. It’s “coup de grâce.”

    A great article that offers a more realistic view of the very old giant oil fields. It is very obvious that what they are doing to maintain production will result in a more rapid decline in the future. When that happens KSA will be in a lot of hurt, and the world will have an abrupt awakening.

  13. So my simple math says: 256 URR was to last 53 years, 74 URR at the same production rate will last 15 years. Seneca with a vengeance! Rite? EOLAWKI here we come!

    …add to that the usual woes of increasing internal oil consumption (3 mbd and rising fast) and the need to try and build their way out of their demise (requiring more oil and money), and the usual predictions of the ‘export land model’ look very reasonable, and disastrous for the House of Saud. There will be a tapered end, but the potential for acute instability in production and the in political and social environments of the country within the next decade is real.

    1. Adam,

      Note that Jean Laherrere’s estimate for the end of 2017 for 2P reserves is between 189 and 239 Gb for Saudi Arabia. The increased internal consumption could easily be handled by giving a credit card that grants a certain number of gallons of fuel to each citizen for free, these credits can be sold to the highest bidder on an open market which will quickly bid up the price to the World price of gasoline, the high price will mean people will use the oil more efficiently as they will see its worth, if they save a gallon of gas they pocket the money they can get by selling it. In such a system higher oil prices may make consumption decrease, just as it does throughout the World.

      In addition higher oil prices will help the Saudi Economy, especially if the profits are invested wisely.

  14. Nice summary, Ron. Brought to mind the old Oil Drum days. Thanks for taking the time to provide this information. Given the admittedly not high-confidence prognostications in Saudi/world oil production, it looks to me like the global economy may be in for at least one serious oil shock in the 2020s. Yet another titanic wave on the Peak Oil ocean.

    -best

  15. Ron thanks for the wonderful summary and analysis. I believe you are spot on.

    I don’t think many people understand what Maximum reservoir contact wells are to the massive carbonate fields like Ghawar, but I believe it will be evident to all in a few more years.

    1. dclonghorn,

      Between an economist’s estimate of 72 Gb and a petroleum engineer’s (Jean Laherrere) estimate of 214 Gb, I will take the engineer’s estimate every time, guess that’s just me.

      1. Dennis, this was all based on Jean’s HL calculations. You have been extremely critical of Hubbert Linearization in the past. Why the sudden love affair with it?

        1. Ron,

          If anything HL tends to underestimate URR, so I often use it to give a “low estimate” for URR. For example an HL of World C+C-XH suggests a URR of about 2500 Gb so this is my low estimate for conventional oil. Likewise for KSA I would expect URR to be at least as high as the HL estimate. Laherrere also uses a creaming curve method to estimate URR and this is consistent with the HL estimate. I have never claimed that HL tends to give too high an estimate.

          In many cases people have given estimates of URR based on HL, they have tended to be too low in almost every case, that is my criticism.

            1. Frugal,

              The actual shape of the curve used is hyperbolic, so early estimates tend to be too low, the problem with the method is that the logistic function is a special case which in most cases is not met by actual production so we are fitting a line to a curve, that is continually flattening. At some point economic constraints end production independent of the shape of the curve.

              In the case of Saudi Arabia, a fall in oil demand as EVs ramp up could indeed cause a Hubbert linearization estimate to be too large, so yes there are cases where it could overestimate output.
              For the World my hope is that this is exactly what occurs and oil stops being produced because nobody wants it at the cost needed to produce it at a profit, probably won’t happen for KSA crude, but may be the case for most deep water, oil sands, and tight oil, after 2035 or so.

          1. Ron,

            One criticism I have made about Hubbert Linearization (HL) estimates is that if they are done too early in the life of the field the estimate will be a gross underestimate. This applies to Jean Laherrere’s estimates of the Bakken/Three Forks of North Dakota where the field is not depleted enough to give an accurate estimate of URR. This can be illustrated using Saudi data from 1973 to 2005 in chart below where the early HL from 1973 to 1985 results in a very low URR estimate (64 Gb) and a later HL (1991-2005) results in a 185 Gb URR estimate. An even later estimate using 2006-2017 data suggests a URR of 440 Gb.

            Note that earlier I was using 111 Gb of cumulative production which mistakenly is only from 1980 to 2017, total KSA cumulative production up to 2017 is 149 Gb, so with the Laherrere estimate of 350 Gb for URR, remaining 2P reserves would be 201 Gb for C+C. For the 440 Gb URR estimate from 2006-2017 remaining reserves would be 290 Gb.
            This illustrates another problem with HL is its instability, where choice of endpoints for data included changes the estimate by a lot.

            1. If applying Hubbert Linearization too early in the life of a field leads to an underestimate of the field size, then applying it too late in the life of a field may lead to an overestimate of the field size.

              As shown in your graph, the line gets flatter as oil is extracted but this can’t continue indefinitely because the field is finite in size. At some point the line will start pointing downward at an increasing rate and if you apply HL at this point, you will get an overestimate.

            2. As far as I know HL works with the “classical” depletion curve of an conventional oil field.

              With extended infill drilling, creaming, water/Co2 flooding to hold production constant it can’t work. It’s simply the wrong method.

              You need hard geological data at this point to guess the size of the reservoir – or at least the numbers when infill started, water, CO2 and an experirienced oil expert who can tell you “at this stage, we have 60% depletion”.

              HL statistics works only when you have the typical decline curve. You can’t fit a horizontal line into a depletion model – it will get infinite resources.

              This is general a problem in science, especially non-mathematic science: Often wrong statistically models are used to fit something. Every model needs the data to behave in a certain distribution – and when you chose the wrong model you get nonsense. I’ve seen that often enough in publications.

            3. Eulenspiegel,

              All modern methods of production were applied in the US from 1976-2017, if we look at HL for US for L48 onshore conventional production (Alaska, Gulf of Mexico, and tight oil excluded) we get the HL below. Perhaps it won’t work for KSA, it is certainly not ideal in that case.

            4. SA has most production from a hand full of giant fields, where these enhanced recovery is done. Most started the same time and have similar technic.

              USA conventional has wide spread oil with 100.000nds of wells with many sub fields.

              And independend owners who make all their own thing, so you get a statistic.
              And the real modern recovery methods have been introduced after the peak so far I know.

              For example:
              If you have in extreme only 1 field, keep it up with any means, you’ll get no statistic only a sudden decline at one day.

              When you have 100 fields, started in different times, you’ll get a statistic.

              Additional, choking their fields to keep reserve capacity makes prediction from production curves even more difficult – the HL was developed in Texas where everybody pumps full out, as in most oil countries.

              Let us conclude: We don’t know really much.

              I personally think: When they would have 200 GB, all tapped, they would have a reserve production capacity of 5mbpd or even more, simply to the vast size of the resources. When russia can produce 11mbpd with 90GB of ressources, 200 in a few giant field with compact infrastructure would be a power house.
              Perhaps they would have to add a few pipelines – but they could alone shock and awe by filling their tanks fast.

            5. Eulenspiegel,

              Quite a large portion of US output comes from larger fields and in many cases secondary and tertiary production methods are applied in those large fields, Not all of the Saudi fields started producing at the same time and each field has hundreds of wells which started producing at different times, it is the sum of the output from each of these wells which gives us national output. Certainly in the US there are many more producing wells.

              In 2000 for the US there were 735,000 oil and gas wells and the highest 6% of producing wells (48,000 wells) produced 68% of total output. In Saudi Arabia only about 3000 producing wells, so indeed there is a big difference in total number of wells. The top 2% of wells produce 50% of US output (12,780 wells).

              Probably looking at North Sea data would be a better analog.

          2. Ron,

            If we add 2018 Saudi production data for C+C from the EIA and use 2006-2018 for the HL, the URR is 447 Gb and remaining 2P reserves would be 294 Gb (proved reserves would be 184 Gb). I do agree however that the HL estimates should be taken with a large grain of salt, this estimate does strike me as being too high, but the 350 Gb URR estimate by Laherrere seems more reasonable. Note that a 2005 to 2018 HL estimate suggests a URR of 368 Gb.

      2. Hello Dennis. Have you ever really thought about why the Saudi’s would keep their production info as a state secret? I think it has much less to do about quotas than maintaining the status quo of a country and society much different than our western norms.

        I have guessed their remaining reserves around 80 gb before, and still believe its in that area. Of course ANYONE without actual production and reservoir info is also guessing whether they are economists, engineers, geologists, or whoever.

        If my guess is correct, we will see KSA production declining on a accelerating rate within a few years. Kuwait will not be far behind. North American shale will likely be topped out by then. Gee, that might be post peak.

        I hope they have more recoverable oil than my guess, because its going to be a difficult transition.

        1. dclonghorn,

          We can only guess why they keep such information secret, seems this is fairly standard among OPEC nations. Is your 80 Gb guess proved or 2P reserves?
          Have you ever looked closely at US reserve data, the US reserve estimates increased at an average rate of about 2% per year from 1980 to 2005.
          We have Saudi estimates of 2P reserves before nationalization, about 177.5 Gb at the end of 1978, assume Saudi reserve growth matches US reserve growth from 1980 to 2005, it explains the “magic oil”, which exists wherever petroleum engineers revise earlier estimates as more knowledge is gained.

          1. Hi Dennis. Why do you think the progression of USA reserve data would be analogous to the progression of KSA reserves. We both know that oil production in the USA has come from a large number of fields with around a million wells spread over a large continent. Much of that reserve growth has been finding more small fields, secondary recovery, tertiary recovery, and most recently fracking technology which allows source rock or non-reservoir production.

            Oil production in the KSA is primarily from the four super giants supplemented by several additional giants, all contained in a relatively small region. In most areas they have produced their reservoirs by using peripheral water injection to provide pressure support and to sweep the oil toward the producers. So in effect they are doing primary and secondary production at the same time. They have tested tertiary production schemes but it does not appear to have widespread application to their fields yet. It also does not appear that shale or fracking technology will have widespread application to these giant fields. So how are their reserves to have grown so much since 1980? Comparing US fields with KSA is like comparing mice to elephants.

            They haven’t discovered a new giant in around fifty years, and they have searched. Shaybah was discovered in 1968 and was not successfully developed until horizontal drilling with Max reservoir contact wells technology enabled it beginning around 1999.

            Shaybah is the new giant with productive capacity of about 1 million bpd according to the Saudi bond info Ron highlighted above. Shaybah has a reserve to production of 37:1 in the table above. Shaybah just began its development in 1999, and likely has been produced at a normal rate for less than 15 years. One of the problems developing Shaybah was how to produce the oil while leaving the massive gas cap to maintain pressure. They solved the problem with accurately placed (geosteered) wells about 150 feet below the gas cap and 60 feet above the oil water contact. They designed these wells with intelligent connections which allow them to determine if a lateral is showing signs of watering out and to respond by reducing or cutting off the flow from that lateral. What happens after a lateral or well waters out or goes to gas. I suppose they can put in a new well a little higher or lower, with laterals between the old and get a bit more oil, but it is going to start getting both difficult and expensive.

            The table above shows Ghawar with a reserve to production index of 38:1. The northern parts of the field have always been thought to be the best due to the wonderful super k permeability and high porosity. The north has been heavily produced since the 1950’s. They have produced the field with massive peripheral water injection to provide an effective sweep, and they redrilled parts with Max reservoir contact wells to get what was left in the 2000’s. As shown by Euan Mearns projection above, it appears the north areas of Ain Dar and Uthmaniyah are mostly gone now. The 38:1 reserve to production for Ghawar seems absurd to me.

            1. DC Longhorn,

              The new field discoveries are not part of the reserve growth, and I ended the analysis in 2005 to avoid most of the tight oil reserves.

              My understanding is older fields are probably well studied and reserve growth would be less likely and most of the large fields in the US (where most of the reserve growth occurs) are quite a bit older than Saudi Fields. In short I would expect reserve growth over the 1980-2005 period to be lower in the US than in Saudi Arabia rather than the reverse. In any case we can speculate, but we will probably never know.

              Is your 80 Gb estimate proved or 2P reserves? I ask because if it is proved and if 2P/1P=1.6, then your 2P estimate would be 128 Gb, add 153 cumulative production through the end of 2018 and we have a URR of 281 Gb, not far from Laherrere’s 300 Gb estimate.

            2. dclonghorn,

              Note that I don’t necessarily think Saudi Reserve growth will be the same as the US, I just have easy access to US reserve data from 1980 to 2017 and use only 1980-2005 to avoid tight oil. I imagine there has been some Saudi reserve growth since 1979, no idea if it is more or less than US.

              Note that if we make the simple assumption that Saudi reserves grow by 2% per year from 1980 to 2005 and in no other year before or after (we have a 1979 estimate from Twilight in the Desert), we end up with a URR estimate of 320 Gb for C+C, pretty close to Mr. Laherrere’s estimate from August 2018.

  16. what is really all that implausible about a higher recovery factor in the greatest oilfield in the world? better computational mapping exists. Better directional drilling to skimp along a contact, the ability to close off parts of that horizontal when water intrusion comes, and probably a dozen other things

  17. Westexas has projected that Saudi Arabia will run out of exportable oil by 2030. It looks like he is spot on.
    Great post.

  18. Jean Laherrere seems to be at the heart of the discussions. Why not invite him to chime in?

    1. Skeboo,

      His estimates for Saudi Arabia can be found starting on page 98 in the paper below from August 2018:

      https://aspofrance.files.wordpress.com/2018/08/35cooilforecast.pdf

      Mr. Laherrere is always welcome to join the discussion. He has two estimates for Saudi Arabia’s URR 300 Gb and 350 Gb. If we use 325 Gb and cumulative production of 153 Gb through the end of 2018, remaining reserves would be 172 Gb+/-25Gb (this would be 2P estimate of reserves) the range would be 147 to 197 Gb. My main point is that this is very different from a 72 Gb estimate. Note also that if the 72 Gb estimate is for proved reserves, the 2P estimate would be about 115 Gb (typically 2P/1P = 1.6). So the difference between Laherrere’s lower estimate of 147 Gb and 115 Gb would be only 32 Gb, I agree with Laherrere that 2P reserves are the more useful estimate as that is the engineering best estimate. If one considers the proved reserve estimate more useful then the 72 Gb estimate would be compared to 92 Gb, which would be the Laherrere low estimate for remaining proved reserves if 2P/1P=1.6.

      So the average of the estimates (72 and 92 for proved and 115 and 147 for 2P reserves) would be 82 Gb for proved reserves and 131 Gb for 2P reserves at the end of 2018. For me the Laherrere estimate carries more weight. In any case we don’t have enough information to know.

      1. Great Dennis thanks, appreciate the long answer… I do check that section of the ASPO website once in a while. Let’s wait and see what he has to say about this…

        1. Skeboo,

          Ron wrote to Mr. Laherrere, he confirmed that his URR estimate for Saudi Arabia is 350 Gb (possibly as low as 300 Gb), I used 325 Gb, taking the average of his two estimates, my guess is the 350 Gb is better, he did not say which he preferred so let’s guess this may be the range that he believes is realistic (300 to 350 Gb).

          The paper is from October 2018 not August 2018 as I said earlier I either remembered incorrectly or there may have been revisions to the paper that were finalized in October 2018.

  19. Mr. Patterson, thanks for the article. You have defended it quite well, this in spite of Dennis Coyne’s constant interjections.

    Estimating remaining reserves from mature fields is not difficult from an engineering standpoint and how one tinkers with known reservoirs in that field (stuffing gas back into them, HZ laterals above O/W contacts, etc.) does not magically create “new” reserves, it simply speeds up the rate of extraction (arrests natural decline rates). The Saudis lie about their sovereign wealth and it’s their right to lie, I suppose; all we can do is try to outsmart them, as you have. America cannot control the Saudi’s, regardless of tweets.

    We can, however, demand reserve transparency in our own country and that we are NOT getting. In essence the lies being said about “economically” recoverable shale oil reserves in America are way bigger whoppers than any lies the Middle East has ever told.

    1. Mike, thanks for the kind words. I am quite used to Dennis’ interjections. They don’t bother me. In fact, I enjoy the dialogue with him. It keeps me on my toes.

      I can feel the tide turning concerning peak oil. I think OPEC peaked in 2016, politically suppressed production notwithstanding. However, the bigger surprise may be right here in the good old USA. The shale bubble could be bursting a lot sooner than a lot of people think.

      Shale Jobs In Jeopardy Despite Oil Price Rally

      U.S. shale drillers have run into a series of problems that have resulted in increased scrutiny on their operations. The difficulties span their operations – production issues, poor financials and less love from Wall Street.

      Even as WTI has moved solidly above $60 per barrel, the U.S. shale industry is trying to find ways to right the ship. As Reuters reports, a series of drillers, even prominent ones, are laying off workers. Pioneer Natural Resources – often held up as one of the better of the bunch – and Laredo Petroleum announced just this week that they will be cutting staff. As Jennifer Hiller of Reuters points out, Pioneer has not laid off workers since 1998.

      In March, Devon Energy eliminated 200 jobs.

      According to a report from Tudor, Pickering, Holt & Co., the recent layoffs may not be the end of the story. Everyone should expect more job cuts “over the coming quarters as companies address right-sizing the corporate cost structures,” the firm said in its report.

      Nevertheless, the EIA still expects the boom to continue for years and years. We shall see.

      1. “They don’t bother me. In fact, I enjoy the dialogue with him. It keeps me on my toes.”

        I can see why: Dennis has a very good attitude, I think, and tone.

        Not that I know whom to agree with at this point…

        1. Michael B,

          It is all guesses, I don’t think our expectations for Saudi output are very different in the near term (to 2030), in fact Euan Mearns model has been good so far for Ghawar and that may continue, as for the rest of the Saudi fields it seems we have very limited information and the HL method is really not very good (and in many cases for both World and Saudi cases has given underestimates in the past in my opinion. There are good analytical reasons why we would expect as much (basically the output curve rarely follows a logistic function).

          1. “It is all guesses.”

            Indeed. And for me, that makes it all the more tragic.

            1. Data is not transparent, and that is too bad, we do the best we can with data that is available.

      2. Ron,

        The EIA’s outlook for tight oil is pretty conservative, there will be a decrease in tight oil output, but unless oil prices crater growth will slow a bit, but output is unlikely to decrease until 2026 (considering 12 month average output for US tight oil).

        Note that I keep thinking new well EUR will decrease and so far I have been wrong every year since 2012 (every year I predict the following January), eventually I will be right. 🙂

        Right now I guess that new well EUR will decrease in ND Bakken and Eagle Ford in Jan 2019, for Niobrara and other US LTO Jan 2022 and for the Permian Basin Jan 2023. If the past repeats I will be revising these to later years in the future, if so my current US tight oil scenario is likely too low. Time tells all.

      3. I don’t think the EIA estimates account for access to capital at all. The simple assumption looks like market forces = current production environment, which simply is not true. Most of current US LTO is a loss subsidized by investors. That’s what a project of finite length that never gets cash flow positive is. This ain’t tech stocks. There is no “well in ten years UberMars will be huge.” In ten years all current and much of the to be drilled LTO wells will be depleted. Hell, in five years everything current is materially depleted. Or three?

        Unsurprisingly the stock prices for the public frackers are all in the toilet. Market says “this is not economic.”

    2. Hi Mike,

      Yes Mike he has. Note that without my comments there would be nothing to defend. It would be, nice job thanks. An echo chamber is not really all that interesting. I also prefer it when there are challenges to what I write, as it often improves the analysis. Seems relevant that Mr. Laherrere’s estimate at 350 Gb is substantially different from a 225 Gb URR estimate, though if we assume 2P reserves are 60% more than proved reserves, the Salameh URR estimate increases to 268 Gb.

      The Saudis claim 201 Gb of C+C proved reserves which would be 320 Gb of 2P reserves and implies a URR of 474 Gb, I would certainly agree that is too high, but Laherrere’s 350 Gb seems reasonable.

      Over time the URR as determined by the Hubbert Linearization method keeps rising and indicates that it might not be reliable in this case.

      I imagine the engineers at Aramco know the answer, as you have said with the data it is easy to determine, we do not have that data.

  20. EIA’s projections can be taken with a grain of salt. What is happening in the US shale is becoming more apparent. Exxon and Chevron plan to gear up to supply the new additions that they will supply to their new refinery additions that will accept LTO. However, I do not see them in a massive growth campaign that will increase exports. That leaves the independents who are very much under the gun to fix financials per investors, investments firms, and the press. I read EOG’s fourth quarter discussion with the public, which was cut short due to repetitive questions on whether EOG will increase dividends. Prices will probably rise, but I don’t expect much growth, this year, from the majority of the producers, which are the independents. At least, for this year. As the years go by, more will be gobbled up by the majors, thus providing more limits in growth.

    1. Guym,

      Glad you are back. The STEO (to which I believe you refer) has L48 excluding GOM increasing by about 900 Kb/b from Dec 2018 to Dec 2020. Seems a fairly reasonable projection to me. Mike Shellman has pointed out that Chevron’s average NRI (net revenue interest) in the Permian basin is 0.95 so they can be profitable at lower oil prices. Perhaps output from independents will be flat, but I imagine output from majors will grow to some degree at current oil price levels.

      1. The majors will grow. Gearing up enough to increase exports would be like shooting their feet off. They are spending billions for LTO refining. They need it to last in the US. I give them credit for that much, but who knows?

        1. The majors will grow their production by gobbling up debt-ridden low share price independents (goodbye Anadarko):

          https://www.reuters.com/article/us-anadarko-petrol-m-a-chevron/chevron-to-buy-anadarko-for-33-billion-in-shale-push-idUSKCN1RO143

          Once the majors control the majority of Permian production the growth rate will moderate and then stabilize as the remaining unprofitable independents with poor acreage go belly up – production will probably not be more than 1M/day higher than today but have a longer tail. The wild west days of increase shale no matter if there are profits seem to be coming to an end. At least that’s my wag.

  21. So, do we have a global peak in 2025, or did it happen in Nov of 2018?
    Inquiring minds want to know——-

    1. Hightrekker,

      Note that I track the 12 month average of C+C rather than single months. By my measure using the trailing 12 month average of World C+C output the peak so far was Dec 2018 (average for Jan to Dec 2018) at 82.85 Mb/d. My expectation is a peak in 2024 at 87 Mb/d. Check back in about 6 years to see how far off I was. 🙂 Note that a recent analysis on light vehicle demand (assuming very rapid EV ramp up, so not a very realistic scenario) suggests a peak in light vehicle oil demand in 2021, if that proves correct (and I am skeptical) the peak might be 2021 at 86 Mb/d, let’s say 2023+/-2 for my revised guess. If we assume 800 kb/d growth in C+C demand (1982-2018 average), then in 2021 output would be 84.6 Mb/d, in 2023 it would be 86.3 Mb/d, and in 2025 it would be 87.9 Mb/d. That projection assumes no BEV sales growth, a conservative projection.

    2. So, do we have a global peak in 2025, or did it happen in Nov of 2018?

      The chart below is the EIA’s estimate of non-OPEC total liquids. Everything to the right of the line, January 2019, is the EIA’s projection, what they believe will happen. If this chart is correct then the peak will not be before 2022, and could well be 2025.

      However, if this future projection by the EIA is Short-Term Energy Outlook is bullshit, and I believe it is, then the peak will likely be 2018.

      You may find this interesting. The EIA predicts, Dec. 2018 to Dec 2020
      Non-OPEC Liquids +3.25 million bpd
      OPEC Liquids………-1.25 million bpd
      Total Increase…….+2.00 million bpd

        1. I prefer to look at the AEO which has World C+C projections rather than total liquids. The projection looks pretty reasonable through about 2025, after that I think it may be incorrect as tight oil output will start to fall.

          1. Survivalist,

            George Kaplan’s projection assumed about 2500 Gb URR.

            If that URR projection is correct, then Ron’s guess for peak would be correct.

            My guess is based on past history of URR estimates based on HL being mostly too low. So Laherrere has about 2500 Gb for World conventional C+C, I use 2800 Gb. With a lower URR estimate peak is obviously sooner.

            1. Thanks for the info Dennis, I’m not certain I accurately remember your prediction, so to speak, perhaps you had said world peak around 2024 ish? Anyway, I figure if Ron and George say 2018 and you say 2024, well from where I stand that’s pretty much splitting hairs.

            2. I agree, Laherrere, agrees with Ron I think on 2018 peak, I just think 2025+/-3 is a better guess, and I am rarely correct, so we will wait and see.

          2. Scenario below matches Mr. Laherrere’s URR estimate from his August 2018 paper. Conventional URR (excluding tight oil and extra heavy oil from Orinoco and Canada’s Oil sands) is 2500 Gb, XH=193 Gb, tight oil=86 Gb. Peak in 2018.

            I think this URR estimate is a bit low and think a 2025 peak is more likely if my 3100 Gb URR estimate is correct (2800 Gb conventional URR), I also could be wrong, URR could be higher (peak in 2030) or lower with a 2018 peak possible. Note that I had to reduce extraction rate to create a 2018 peak, with a constant extraction rate after 2018 and a 2800 Gb URR (for all C+C, 2500 Gb conventional URR), the peak is 2022.

            1. Thanks again Dennis. I really appreciate it. I’m very very interested to see how this all shakes out over the next several years. I’d like to thank all the great oil commentators here for ‘the heads up’, so to speak.

          3. Here is the scenario for World C+C URR of 2800 Gb, with extraction rate held constant at the 2018 level, peak in 2022 at 84.2 Mb/d.

          4. And another scenario with URR=2800 Gb, where extraction rate continues to rise at the average rate of increase from 2013 to 2018 until 2026 and is held constant at the 2026 rate after that. Peak in 2024 at 86.9 Mb/d.

            1. Dennis
              How do you define extraction rate ? My first guess was
              (yearly production)/(remaining reserves)
              but probably I am wrong, as it implies small remaining reserves,
              about half a trillion barrels.

            2. As the descending exponential for production goes to half in 27 years:
              40Mbl/d in 2057 vs. 80Mbl/d in 2030 ,
              it implies a reduction of production of 2.6% per year,
              and this would be the “extraction rate” in my understanding.

            3. Alex,

              Chart below is for scenario with 2800 Gb conventional C+C URR (total C+C URR of 3100 Gb). Each year as oil fields are developed “new producing reserves” are added to the stock of “producing reserves” while the stock of producing reserves are reduced by the oil extracted from the oil fields of the World (the C+C-XH-LTO dotted line). The extraction rate in my scenarios is for conventional resources only which I define as C+C minus extra heavy (XH) oil and light tight oil (LTO). The extra heavy oil is from Venezuela and Canadian oil sands.

      1. You can run ‘fast’ and jump ‘high’ or run ‘slow’ and jump ‘long’.. all depends upon GNP…China printing…

  22. Some international inventories week/week changes (million barrels)
    Light Distillates: -9.68
    Middle Distillates: +1.36
    Heavy Distillates: +1.94
    Total Distillates: -6.39 (shown on chart)
    https://pbs.twimg.com/media/D341fUUW0AAhBDd.png
    Chart for just light & middle https://pbs.twimg.com/media/D3410irW0AAp5Pk.png

    Crude Oil: +4.21
    Total (Crude + Distillates): -2.19 (shown on chart)
    https://pbs.twimg.com/media/D342MWtXsAMXJpT.png

    US inventories week/week changes (million barrels)
    Crude Oil: +7.03
    Light Distillates: -7.71
    Middle Distillates: +1.30
    Heavy Distillates: -0.14
    Total (Crude + Distillates): 0.48 (shown on chart)
    Propane & NGPLs: +4.42 (not on chart)
    SPR: flat
    https://pbs.twimg.com/media/D342uXDWAAIKheb.png

  23. 2019-04-11 (Reuters) U.S. super-light oil output rise roils Texas, Oklahoma markets
    Super-light oil now makes up nearly 15 percent of current Permian production of about 4.2 million barrels per day (bpd), market sources said.
    Crude lines typically have a common stream to blend shippers’ crude together, but that is changing. Plains All American, which runs the Basin line to Cushing, recently required shippers to segregate WTL (Light) in order to “maintain the integrity of the common stream,” adding that it could reject shipments otherwise.
    Crude volumes on that pipeline’s segment from Wichita Falls to Cushing fell by about 65,000 bpd in March from February, Genscape said, a signal of “batching issues,” said Ryan Saxton, Genscape’s manager of oil transport.
    https://www.reuters.com/article/us-usa-oil-cushing/u-s-super-light-oil-output-rise-roils-texas-oklahoma-markets-idUSKCN1RN2NV
    Bloomberg chart for Midland-Cushing price spread https://pbs.twimg.com/media/D34yCzrWkAYfslj.png

    1. EnergyNews,

      Just a general thank you for your posts here. They’re one of my daily checks.

      1. Hello, I’m glad to hear that people find my posts helpful. I’m sure that this website needs some sort of news summary, especially for people who don’t have much spare time and people who are new to the subject 🙂

    2. Looked up the definition of super light oil. I did not find any. But I did notice that wikipedia defines WTI as API 39.6.

      Hasn’t been that in years.

  24. On a micro level, there is a definite drop of interest in drilling district one in Texas. Both from the completion side, and from the permit side up to today’s postings by RRC. Obviously, that lack of interest is not due to the price of oil. That is the bread and butter of Texas production, considering all the problems in the Permian. Glad they are completing four more of ours, because it looks like the last for awhile. I’d say, the investor complaints will have a SIGNIFICANT impact on independent drillers for a good while.

    If shale production was flat, or worse, for 2019, it would not surprise me, at all.

    1. The thing is – the investors are right, completely right.

      If everyone holds back a bit, much more money for everyone. 10 or 20$ more WTI price, less pipeline fees – and a more or less profitless hole gets into a money fountain earning a few millions.

      1. Of course they are right. Ballooning production with little or no net income is a stupid investment. And from a royalty standpoint, one would much rather have less production at a higher price. It lasts longer, and produces a lot more money.

    2. GuyM,

      Texas Permian new drill oil completions are down quite a bit in Feb and March to 295 and 209 from an average in 2018 of 379 and Feb and March 2018 were 410 and 371 completions. In short, I agree tight oil completions are falling and flat to decreasing production is quite possible in the coming months.

      For the past 6 months Permian Basin output has increased at an annual rate of 970 kb/d. The next 10 months will be a smaller rate of increase, maybe 500+/-100 kb/d.

      1. That’s a huge decline in completions Dennis. Considering that even with the higher rate of completions, legacy decline ate up about 75% of new oil produced, I think your annual increase of 500 kb/d is a bit optimistic. That is if completions stay that low.

        1. Hi Ron,

          Perhaps you are correct, I doubt that the completion rate will remain as low as March, and we do not have New Mexico completion data. Through Feb 2019 Permian output has continued to increase, I expect the rate of increase will slow to half of the rate of the past 6 months, but doubt output will be flat.

          Difficult to predict future completion rates and not that the reported RRC completions are both vertical and horizontal completions, we don’t know the mix (or I do not, GuyM knows the RRC data better than me.)

          1. I think they will trend lower. April is not looking any better, so far it’s lower, both in completions and permits. Oil price is going up. Pioneer and some other big producers have stated completions will be down to appease investors. EOG hasn’t publicly cratered, but I see a definite downtrend after being hammered at the fourth quarter meeting. Exxon and Chevron will go up, but if you look at the size of their land holdings, it’s at a fairly low rate. This is going into the second quarter, and is unlikely to change much, no matter what the price of oil is. They danced to the music, so it’s time to pay the piper.

            I do not think production will change much for a good while. Either up, nor down (at least nothing substantial). They will be let out of the penalty box, at some time, probably when it is accepted that demand is five scores ahead of supply in the last time period. We know how that usually winds up. In the meantime the bigger sharks will be gobbling up the smaller fish, and the big sharks will only produce what they need.

            The two million barrel a day Permian pipelines look like a loser, at this point.

            1. GuyM,

              It will be interesting to watch, there are a bunch of DUCs that could be completed and the continued increases in Permian output through Feb 2019 are kind of surprising given the low level of completions. If they remain at Feb/March average levels output may indeed be flat as you suggest, at some point I would expect a rise in oil prices might affect completion rates, but it might take WTI at $75/b or more to do it, difficult to know. WTI currently around $63/b, no idea what wellhead prices are like in Permian.

            2. “the continued increases in Permian output through Feb 2019 are kind of surprising given the low level of completions.”

              According to EIA DPR, the amount of completion in Feb was the highest since March 2018.

              The Permian has a huge amount of DUCs. I’m not really surprised that the Permian can still increase output. This will continue when the pipeline capacity increase and/or the price of crude increase.

  25. Are any of you guys that keep close track of numbers willing to hazard a guess as to which countries are the next ones to flip from net exports to net imports, and about how long you expect it to take?

    You can bet that not many men and women on the street will notice this change…… but savvy people who run businesses in such countries will notice, and so will lots of business people in other countries. Such people will be making some efforts to plan ahead, as best they can, for the time when oil is going to cost them a LOT more.

    I just can’t see oil staying cheap, because even as cars and light trucks and some heavier trucks and so forth are electrified, more and more legacy oil fields will be approaching the end, and it seems very unlikely that any new giant fields that are cheap to produce will be found.

    Whatever is done, or not done , at the government level in various countries will have a lot to do with how fast prices go up in the event of a supply crunch, and how fast prices fall in the event of a sharp decline in demand.

  26. Chevron buying Anadarko [in line with GuyM predictions, as I understand it].

    1. Yup. Bubba hungry. With Anadarko’s 240k acres, Chevron is slightly larger than Exxon at close to 2 million acres. Exxon at 1.8. Feeding time isn’t over yet. Bubba hungry.

      1. Oddly, Occidental was beat out by Chevron on the deal to buy Anadarko. Occidental has the largest acreage in the Permian, but is pursuing a very controlled growth.
        Adding up Occidental, Chevron, Exxon and Conoco leaves a lot smaller area for the independents:
        https://seekingalpha.com/article/4084347-competitive-landscape-permian-basin

        The chances of the huge production increases predicted in the Permian is diminishing rapidly. I don’t think they are interesting in gobbling up Apache, yet, and getting a bad case of gas.

        One has to imagine that there is some re-thinking going on, concerning the 2 million barrel a day pipelines that are planned on coming online within the next year.

  27. Director’s Cut for February just released.

    Output was down about 70k bbld (1.33 million bbld), completions and producing wells down appreciably.
    ATW pricing continues to strengthen significantly.

    For anyone unfamiliar with the Bakken’s operations, the latest presentation (April 2?) can be downloaded right from the ‘Information’ tab (left side) on the DMR home page website.

    Gives a fairly concise overview on what is going on hydrocarbon wise in the Great State of North Dakota.

    1. Hi Coffee, That was certainly a large and surprising drop, about 4.9 % M/M for oil and about 3.3% for gas. I’m sure a big part of that is due to lower completions in February, but I also wonder if part of it could be due to increasing GORs, declining formation pressure, and declining location quality. I watch the rig count there and it seems to be very stable. Any ideas?

      1. DC

        Producers dropped from 15,409 to 15,090 … over 300 wells taken offline.
        Completions went from 113 to 92 to 59 for Dec/Jan/Feb … another big drop which is not surprising for ND winter time.

        ATW pricing 38/46/48/52 bucks for Jan/Feb/Mar/today
        These operators hedge, but they also try to anticipate future pricing to maximize their financial positions which might have tempered their output some.

        Their gas capture issues have been fairly well discussed, but – I believe – 2 or 3 more processing plants are coming online shortly which should greatly alleviate the flaring along with ending the inhibiting of oil production.

        As far as GOR, formation pressure, location quality … I would strongly suggest you download that short presentation and give it a gander at your leisure.

        Since the 2008/2009 time frame I have been keenly following the Bakken ‘story’ and the wealth of info and projections from the DMR folks in that pdf jives pretty closely with my own views.

        The outstanding graphic on page 3 shows the entire Bakken AND Three Forks areal extant with ALL the 60 day IPs in color coded increments.
        The aerial growth of the yellow dashes (500 to 1,000 bpd) continues to expand over the years right up to the Canadian border where it is called the Torquay.
        That graphic is an expanse twice the size of New Jersey.

        As that presentation sez, DC, output will be around 1,500,000 barrels a day for decades … not including EOR potential.

        1. Primary production will be around 1.5 million for decades?

          Sounds like the Dennis Gartman quote from 2016, “WTI will never be above $44 in my lifetime.” Mr. Gartman is still living.

          In 2009 no one had any clue that US would be pushing 12 million BOPD. The same outfit (NDPA) predicted in 12/10 that ND, SD and Eastern MT would be producing between 550-800 BOPD by 2015-2020. They can’t predict accurately into the future.

          So we should bank on oil production in the Bakken being around 1.5 million BOPD for decades? Come on coffee. You buying that? That would be like me saying oil will average $65 WTI for the next few decades.

          I have no clue where the price will be in one month. It could be $30. It could be $80.

          Between the ridiculous volatility and the ever more stringent government regulation of the industry (by people who have zero industry experience in many cases) you might see why we will likely soon be bowing out of something we have been invested in for about 40 years.

          1. Shallow

            Just wrote a long reply and lost it.
            Won’t repeat.

            Nutshell … the April 2 DMR presentation projects over 1,400,000 bbld thru 2050 in pessimistic scenario.
            Better case runs 1,600,000 to over 2,00,000 bbld.

            I have no doubt whatsoever it is doable

            March aogr.com article on Engineered Completions explains part of reasons why.

            WAY, WAY more effective stimulation is now occurring in way more precisely controlled fashion.

            The earlier 3/5 percent OOIP recovery is now over 20% and rising.

            1. When I look at the top 2 producers in Bakken, Continental and Whiting, they are getting worse wells now.

              Their best year was round about 2017, now they have to drill more to get the same.

              The effect is still small, but factoring in better technic significant.

            2. Eulenspeigel

              I took a quick look at Continental and Whiting’s 2017 and 2018 well profiles on Enno’s site.

              Don’t know if that is the source for your observation.
              If so, I suggest you go to the ‘monthly’ production profile – May and June Whiting 2018 are good examples – and see just how fluid these monthly numbers can be.
              Primary reason is shut in time for operational reasons, most commonly nearby fracturing.

              The wells are unquestionably improving on a days-online metric, something Enno’s calendar-based depictions can somewhat distort.
              (Additional changes occur related to the amount of drilling being done in Tier 2 rock. Numerous reasons for that to happen).

            3. Coffeeguyzz,

              These companies operate for 12 months a year, so we can cherry pick like in an investor presentation, but the financial results are based on all the months good and bad.

              Continental seems to have turned things around of late and is making money (2017 and 2018). Whiting though profitable in 2018, if we consider the past 4 years, they have been terrible, if we just take the last 2 years, they have not been profitable (net income for the 2 years is -896 million).

              Often things improve when these companies focus on their best areas problem is the best areas will run out of space for new wells and profits will decrease as they move to less productive areas.

            4. Nutshell … the April 2 DMR presentation projects over 1,400,000 bbld thru 2050 in pessimistic scenario.

              Wait a minute! That’s what they produced in December and January. Are they saying that the Bakken may have already peaked? That they just expect that December January level to hold for the next 32 years?

              Better case runs 1,600,000 to over 2,00,000 bbld.

              I have no doubt whatsoever it is doable.

              Thanks, Coffeeguyzz, best belly laugh I have had in weeks. 1.6 to 2 million barrels per day? That’s about 20 billion barrels produced between now and 2050. And in 2050 they will be pumping at 1.6 to 2 million barrels per day.

              Move over Dennis, your Bakken predictions have been put to shame.

            5. My latest Bakken scenario, peak around 1600 kb/d, but it does not last very long if AEO ref oil price scenario is correct.

            6. Note how the model is below actual output through Sept 2018, in Feb 2019 output (1282 kb/d) falls below model output (1330 kb/d). My guess for the well completion rate is pretty conservative at a maximum of 155 by June 2020, in the past the trailing average 12 month completion rate was as high as 185 new wells completed per month (March 2015) and was above 155 new wells per month from July 2013 to August 2015 (trailing 12 month average well completion rate).

              I agree however the scenario is unlikely to be exactly right. It might be higher or lower than this guess.

            7. Mr. Patterson

              The ND pipeline people have indeed postulated about 1,400,000 bbld plateau based on their ‘Case 1’ scenario … 90 to 120 wells per month for decades.
              ‘Case 2’ calls for 120 to 160 wells per month with corresponding production from 1.6 to over 2 million bpd.

              An earlier presentation projected about 500,000 bbld by the year 2090 at these rates.

              The 2013 USGS Bakken/Three Forks assessment of 7.4 billion barrels TRR included a primary recovery rate of about 5%.
              Not only is that now in the 20% range, the productive footprint has expanded significantly as that AOGR article clearly described regarding work in the lower tier Elkhorn field.

              A quadrupling of the recovery rate would bring an assessment into the 30 billion barrel range.

              No doubt it will be achieved.

            8. You said:

              I have no doubt whatsoever it is doable.

              That was concerning the “Better case runs 1,600,000 to over 2,00,000 bbld.” …(Until 2050.) I don’t think you meant that as a joke but I laughed anyway.

              Then you said, concerning 30 billion barrels ultimate recovery from the Bakken:

              No doubt it will be achieved.

              Then I laughed even harder.

              just one more point. You wrote:

              Not only is that now in the 20% range…

              When and where did the recovery rate in the Bakken jump from 5% to 20%. Please post that link.

            9. Coffeeguyzz,

              The USGS mean estimate corresponds with about an 11 Gb TRR as cumulative output up to 2013 and 2012 year end reserves need to be added to the undiscovered TRR estimate of 7.4 Gb.

              The NDIC projection uses both an unrealistic new well EUR and also assumes there is no heterogeneity to the productivity of different areas of the North Dakota Bakken. Poor assumptions will lead to poor projections.

            10. Hi Coffee,

              That’s why at looked at the real production data of the top companies with the most money, and there is no magic wonder to see.

              Going from 5 to 20% would mean quadrupple output, additional to double well length compared with older years eight-fold output should be possible.

              So instead of 200-300k per short well (with 5%) from 2012 1.6 -2.4 million barrels should be possible(with long wells and more proppant and magic feary dust instead of fracking sand).

              Even with tier 2 rock it should be good over 1 million barrels per well – in average!

              Nothing to see here in the hard data, at least until December 2018.

              They are holding good, but no wonders to see.

            11. The claim of 20% recovery is unsubstantiated. OOIP is very wide from 300 to 500 Gb, If we assume all of Bakken/Three Forks (ND and Montana) has a TRR of about 14 Gb, then recovery would be 3 to 5%. Note that at $8.5 million per well and only about 400,000 barrels of oil recovered for the average well. The 80 Gb implied by the supposed 20% recovery factor would require about 200,000 wells to be drilled (more if average EUR drops over time which is very likely), total cost would be $1.7 trillion (2017$) at least.

              Bottom line, the 20% recovery factor is bunk. For the entire play it will be about 2.5%, a bit higher in the sweet spots and much lower in most of the play. Total wells completed will be closer to 30,000 than to 50,000 unless we see sustained oil prices at $150/b0 in 2017$, we might temporarily hit that (for a 12 month period in 2023 to 2024), but EV sales will go through the roof, bringing demand down, oil prices down and reducing completion rates in tight oil plays due to lack of profits as new well EUR gradually decreases.

            12. I just wanted to show people to look at the hard data. This clears such claims very fast.

              Even when a company has a new trick to squeeze 20% more out, it’ll show in the data.

              And there was nothing to see for the top companies (who have the most money for new production toys).

          2. Shallow

            Forgive me for bringing this up but some time ago a rather pompous poster advised you to sell on the next spike and see the pyramids. If I recall correctly.

            1. I should make it clear this is not coffees prediction, it is the North Dakota Pipeline Authorities’ prediction.

              It is all well and good to predict things. But I think we need to all understand that the probabilities are very high that predictions will be wrong, especially more than 2-3 years out.

              NDPA undershot on its prediction in 2010, as I stated above.

              NDPA is predicting that there will be 60,000 wells producing in the Bakken in 2050 and those will be producing 1.5 +/- million BOPD.

              That is 31 years from now. 31 years ago was 1988. I wonder what the predictions were for 2019 in 1988?

              I seem to recall West Texas (former poster) frequently referring to a 1998 Economist article that there was too much easy to produce oil and predicting $5 per barrel oil prices to infinity. Since that time we have sold oil from $8 to $140 per barrel.

              This predicting stuff is fun to do I am sure.

              I think NDPA is predicting 100K upstream industry jobs in 2050, more than double at present. Could that be a motivation for the forecast?

            2. Lightsout.

              Yes, we will probably take that advice. The next generation has seen the wild volatility and increased regulatory burden and currently seem to have zero interest in taking things over.

              In fact, ask any producer what the number 1 problem they face is. It is not the tougher rules nor the price volatility. Lack of labor is number 1.

              The average age of our small workforce is 54. Several young people working in the field here were laid off in 2015-16. They quickly found jobs in other industries and won’t be coming back. Smart move IMO.

    1. The February drop in production was extremely predictable just based on the abnormally cold temperatures the Bakken region experienced, not to mention the abnormally high amount of snow, too.

      http://peakoilbarrel.com/eias-data-for-world-and-non-opec-oil-production/#comment-668222

      Anticipate a notable drop in Bakken production for the month of February when the numbers are released. February 2019 was the 2nd coldest February on record in Williston, North Dakota and the coldest month recorded there in 36 years. Average temperature was -4.5 °F, with 13 nights below -15 °F (preventing diesel from gelling becomes increasingly difficult at those temperatures).

      1. Thanks to all who commented on the cause of the North Dakota drop. I had seen Bob’s prediction but wasn’t thinking of it when the data came out. Looks like the jury is still out on whether N Dakota has room to run or has peaked, we will probably know more after a few more months data come out.

      2. Still – the fact you have one off month and production plummets 5% says something. Continued increases in shale require everything to go perfectly or the treadmill shoots you back at rapid speed. I’m thinking chutes and ladders with only chutes and no ladders.

  28. Charging infrastructure.

    Some people casually say; as charging infrastructure gets built out, more people will be tempted to buy electric cars.
    Looking at this typical street.

    https://www.thisismoney.co.uk/money/cars/article-3401389/Drivers-avoid-using-car-don-t-lose-spot-street.html

    1 resident considers buying an electric car, so he asks the council to install an electric charging point outside his home. This requires digging up a section of the road and connecting it to the mains electricity supply.
    The council charges £3,000 to dig up the road install the charger and paint in the parking space with a sign saying resident of number 3 only. An annual parking fee of £150 which includes the maintenance of the charger. The charger can only be used via a security pin code and a key. The owner obviously only pays for the electricity he uses.

    Carparks would be more difficult, charging places would have to charge a fee to park in that place in order to stop electric vehicles that do not need charging parking there anyway and blocking an electric vehicle that is low on charge. One can see fights happening in carparks with too few charging meters.

    Who would pay for the charging meters and repair? At the moment carpark owners would lose money on every single charger installed.

    http://this-is-bingham.co.uk/thursday-market-day-parking-in-bingham/

    How do we get from practically no charging meters to a charging meter in every single parking bay in every single car park and on every single street.

    At the moment most people fill up and park for free. With electric cars this can no longer be the case. In order to prevent just anyone taking a valuable charging space there will have to be a charge on the space per hour as well as a charge on the electricity used.

    A rough calculation. It would cost the UK about £240 Billion, yes that is Billion to install all the chargers for an electrically powered society.

    1. In the US there is a company called charge point. They have the software so you can have people pay for the charging, easy to recoup cost and make a profit, very low maintenance. Do you need to do work very often on your electrical system at home? In my home for the past 25 years maintenance cost for electrical system has been zero. Outside lines taken care of by cost of electricity.

      1. Dennis

        What a stupid response to a huge problem of installing millions of charging points down every single road and car park space.
        Software does not charge a car, chargers need to be installed in there millions by the curbside on every single road with houses, so people can charge their cars over night. You obviously live in planet rich kid where everyone has a big drive and big garage.
        Most people I know do not have driveways they park on the road and often in the next road because there are no spaces.

        You obviously do not want to walk through the problems of sorting out where people can park.

        1. hugo- “What a stupid response to a huge problem of installing millions of charging points down every single road and car park space.
          Software does not charge a car, chargers need to be installed in there millions by the curbside on every single road with houses, so people can charge their cars over night.”

          I took the reply to this over to the other non-oil thread

        2. Hugo.

          It can be done over a long period of time but will need to be heavily subsidized.

          Kansas and Oklahoma median household incomes are just above 50K annually. In the rural counties that drops into the 20’s and 30’s.

          I assume that is part of the cost of the Green New Deal.

          I think this should be moved to the other thread, but thought I would throw that in this discussion.

          1. Shallow sand,

            In rural areas, there is a place to park, no doubt. People can install their own chargers, it is not a difficult prospect, costs about $300 to $500, all that is needed is a 240 Volt 40 amp outlet, not a big deal for a home owner.

            1. The charging isn’t the number one issue rural. It is vehicle cost that is the issue in rural areas. Secondary would be range and proximity to service centers.

              Also, there are the economic arguments which I commonly hear particular to where I am located. Without ethanol and biofuels the current low corn and soybean prices would be so low that the farm economy would be in a 1980’s “Farm Aid” situation. $2 corn and $6 beans would be like $30 WTI.

              Then there are the refineries. Many are rural. Many provide up to 60% of local schools budget by way of property and sales taxes, not to mention the hundreds permanent workers at them who are also taxpayers, or the up to 3,000 who may come to communities during refinery maintenance (turnarounds).

              Then, in many rural areas you also have the ICE manufacturers and suppliers, which the US government felt were so essential to the US economy that they were “bailed out” in 2008-2009. Most modern ICE manufacturing facilities have been built in rural areas due to cheap labor and cheap land. One wonders if Musk should have just built a new facility rurally rather than have tried to make due with Fremont, there was a reason he was able to buy it cheap.

              We have discussed this all before and will again, and I see the inevitable headed this way re ICE but am not sure how long, what form etc. I also know there are many uses for Petroleum besides ICE light passenger transport, and substitutes for many of those uses are much further off than replacement of ICE light transport by electric or other fuels.

        3. I live in such a neighborhood…(though I have a driveway and a parking space, as I thought they would be important when I bought 15 years ago).

          What happens in cities like this is that fewer people own cars, or don’t drive them to work. In a city like Toronto, there is also a case to be made for chargers in the garage at the work end of the commute: I am regularly passed by 3 Teslas when I bike to work, and I am pretty sure that one or two charges a week would do them (probably a 15-mile combined daily commute). There is probably a law that can be extrapolated that states a ratio of time to income to transport costs to availability of public transit. Add in the possibility of car sharing and driverless vehicles, and the future you aim for- recreating the gas car paradigm- becomes less likely.

          And Shallow: I think that rural vehicles will continue to be liquid fueled until there is no oil (or they can’t afford to buy it). For the same reason you don’t have subways, you won’t have electric cars.

          1. Lloyd,

            I suppose it depends on how rural you mean. I live in a pretty rural area, the “big city” nearby is only 33,000 and the county which includes Bangor has about 154,000 people and a population density of 45 people per square mile. A Tesla Model 3 with the Long Range Battery (310 miles) is fine in this area. In the middle of Montana, probably not.

        4. Hugo,

          You lack imagination. Just as a parking meter can be installed, so can an outlet.

          You asked how it would be paid for, I answered that question. I will leave it to others to judge your response.

          https://www.chargepoint.com/products/commercial/ct4000/

          No doubt there are European companies that offer similar services. In many areas of the World people own a home and have a driveway where they can park their car, even some rental properties have parking. As EVs become more widespread, landlords may get together to have street chargers installed (something like chargepoint where they can recoup costs) as they will attract more renters who will be willing to pay more for the convenience.

          Some people have more imagination than others.

          What do you envision happens as oil prices increase? Is your expectation that nothing changes? I think that is highly unlikely. The only question is the rate of change and that will be influenced by the rate of increase in oil prices.

          1. As if somebody over at insideevs.com knew that Hugo was going to bring this up, exhibit a:

            Owning An Electric Car Without A Garage May Not Be A Problem

            It’s still possible, though there are challenges.

            Most electric vehicles are charged at home within the secure confines of a garage. But what can you do if you park in a carport or on a driveway, instead? What if you live in a condominium or an apartment building and at best have an assigned parking space?

            While either of these situations can be challenging to EV ownership, as you’ll find out they don’t necessarily have to be a deterrent.

            1. I drive by two different homes where I regularly see Volts charging on the driveway out front. They have been doing that for at least the last two years. Rain, snow, or shine, I still see them.

    2. Worrying about charging infrastructure as a limitation to the spread of EVs is what software people call “premature optimization”. You are trying to solve a problem which doesn’t exist yet.

      There are more homeowners who want EVs than there are EVs, and the can charge at home. Furthermore, a lot of early EV sales will go to taxis and other fleets vehicles like delivery vans, which can be charged at central locations. The reason is that fleet owners are better at calculating operating cost than private car owners are, and the advantage of EVs is primarily in operating costs.

      As a result, there is still plenty of time to install charging infrastructure without worrying about it slowing down sales growth.

  29. Russia – it says here that oil production in Russia over the next three years could continue at a high level due to projects that have already received investment… primarily as a result of commissioning new fields including Srednebotuobinskoye, Tagulskoye, Kuyumbinskoye and Russkoye.
    As we know, Russian oil companies are earning more in roubles following devaluation but Russian domestic fuel prices are also a concern…

    1 February 2019 (Petroleum Economist) Brownfield sites curb Russian growth
    Beyond 3 years the outlook for oil production looks less optimistic because of rapid depletion of the existing fields: by 2030 production at the brownfields is likely to decrease to 5mn bl/d. To maintain current output levels after 2020, Russia will need to use several measures.
    First, the commissioning of conventional greenfields should offset declining production at the existing ones. However there are very few undeveloped new conventional reserves left and geological exploration has to be intensified.
    Second, in-depth development of the conventional brownfields would be necessary, using hydraulic fracturing, development and utilisation of tertiary recovery methods.
    Third, taking into account the deteriorating resource base and the increasing proportion of hard-to-recover-reserves, Russia will have to develop technologies and equipment for unconventional and hard-to-recover oil fields.
    Read 2 articles for free -> https://www.petroleum-economist.com/articles/upstream/exploration-production/2019/brownfield-sites-curb-russian-growth

    1. These new projects sound like the ones that have been left until last. A number of issues including infrastructure constraints and geological difficulties. A strange example of that – the oil here might be radioactive…

      Srednebotuobinskoye oil field
      MOSCOW, 2013 Oct 25 (Reuters) – A series of underground nuclear blasts was carried out in the 1970s and 1980s at an oilfield in Siberia that state firm Rosneft has agreed to develop with China.
      At least seven “peaceful” nuclear detonations were performed at the Srednebotuobinskoye oilfield, according to a report published by the environment ministry of the Republic of Sakha, a remote region in Eastern Siberia also known as Yakutia.
      Blasts at the field were intended to increase flows from oil-bearing rock and, in one case, create a storage reservoir.
      The Srednebotuobinskoye field holds oil and gas condensate reserves of more than 134 million tonnes and over 155 billion cubic metres of gas. Output from the field started this month (2013).
      https://www.reuters.com/article/russia-china-nuclear-idUSL5N0IE26B20131025

      1. Kool! Glow in the dark oil! We could mix it with our useless SPR, and sell for a huge discount. And you had to cut and paste to say the field name twice in the post?

    2. Thanks, Energy News. That’s about what I was expecting out of Russia. That is they can hold this high level for two or three years because of new fields then things start to decline. The EIA expects a slight increase in Russian production starting in January 2020, then leveling out.

      1. As you previously noted, that’s well within margin of error. North Dakota at a little under a tenth of the size just dropped as much from bad weather.

        The requirement for them to offset declines after that to stay stable on the other hand in that article…That projection of brownfields dropping to 5 million would be they lose more than half their production within a decade unless they find and quickly open multiple giant fields. Arctic offshore even if it’s there won’t happen on that timeline so the question is where else IS that oil going to happen?

        1. unless they find and quickly open multiple giant fields.

          No one finds giant fields anymore. The age of giant fields is over. There may still be lots of tiny fields out there, but they produce little and decline very fast.

          Average daily production for the current OPEC 14, in 2005, was 30,769,000 barrels per day. Average for the first three months of 2019 was 30,458,000 barrels per day. OPEC very likely peaked in 2016. And even the experts are now predicting that Russia is at, or very near, her peak. Southeast Asia is in steep decline.

          All future increases in production must come from the USA, Canada and Brazil. Canada is having serious problems with a sharp dip in the first half of 2019. Brazil is iffy. The USA and that massive shale boom is likely the only near term hope for the cornucopians. I have my doubts about that one.

          One thing I can predict, and I think many will agree with me, is that we are about to see a huge spike in the price of oil. We will have to wait and see how that affects oil production.

          1. Ron,

            “No one finds giant fields anymore. The age of giant fields is over. There may still be lots of tiny fields out there, but they produce little and decline very fast.”

            Except perhaps for the continental margin off the Guyanas, NE South America. ExxonMobil announced large discoveries in the Stabroek block, Guyana, in 2015. There may be more to find along that deepwater coastline.

            Jonathan

          2. Oh I don’t “buy” that they can suddenly find those, not at all. Just commenting on what they would need to find ON LAND to maintain production if a legacy decline of over half a million barrels a year is being forecast for the next decade.

            Here in real life, Russia is going to decline.

    1. Yeah, they have gotten by with this malarkey for years. From here on out, spot prices are in control. Oil prices no longer need astrology. Betting on paper barrels will cause a lot of pain. Especially, if you rely on a Quija board.

    2. Yeah, technical analysis is about as reliable as horoscopes. Actually it seems less reliable, because it you really could use technical analysis to predict the market, then people would do it, and that would change the way the market behaves, invalidating their technical analysis theories. Horoscopes at least have the advantage of being bullshit from on high.

  30. From exporters to importers – the story doesn’t give a list of countries…

    25 March 2019 (The ASEAN Post Team)
    While Southeast Asia used to be a hub for oil exports, most oil producing countries in the region are transitioning to becoming oil importers as opposed to exporters. It is forecasted that oil production in the region will drop by 30 percent by 2040. This is brought about by a number of reasons including dwindling reserves and the lack of new oil fields being discovered.
    https://theaseanpost.com/article/why-fuel-subsidies-matter-southeast-asia

    1. Looks a lot like a Seneca Cliff to me.

      It is forecasted that oil production in the region will drop by 30 percent by 2040.

      Looks like they have dropped 12 to 13% in less than three years. The decline would have to slow down quite a bit to be down only another 30% by 2040.

      1. Down from approx 8 to approx 7 in about 2 years. It would perhaps be interesting to see the production prior to 94. My curiosity is of course future OPEC Middle East production profiles, as well as USA LTO. FWIW I think this is a very very interesting time to be alive.
        I live around a lot of folks who without household electricity would feel as if back in the Stone Age. My grans didn’t get household electricity until the mid 50’s. So really it’s not that bad, but most folks just aren’t prepared to be adaptable.

      2. As the climate crisis darkens the horizon, and as our earth wobbles ever more violently on its axis, the Barbie doll of consumer culture, eyes slack and grey, inclines her face to the heavens. Am I alone? peals her cry. (You are not.) Will more save me? (It will not.) Are we okay? (We are not.)

    2. That is a very interesting graph. Covers a lot of big user countries.

      As big oil takes over US production, we should see a shift away from trying to insanely trying to increase US exports, leaving mostly OPEC as the main exporters. They couldn’t possibly keep up.

    3. And none of these countries is in a failed state status, or under any kind of sanction that would limit their production.
      Its simply depletion.
      It would be interesting to see this chart paired with one of crude oil consumption for these countries over the same timeframe.

      btw- this group makes up 1/2 the worlds population

      1. Myanmar has had a history of continuous civil war since late 40’s, and has been under sanctions I believe, however I feel that is irrelevant to the data. I doubt the civil war prevented any meaningful access to oil, or any other resources. Even a hot mess like Pakistan doesn’t keep anything of importance of the world market.

    4. Looks like 800K bpd decline. Bible says 500K of that is China.

      Indonesia rose. India pretty flat. Vietnam 100Kish decline. The other countries are small potatoes.

      It’s all China. It’s always been China as the cause for wars upcoming.

    1. Bakken Crude oil production Dec 2014 1,165,000bpd
      Producing Wells 8948

      Bakken Crude oil production Feb 2019 1,283,000bpd
      Producing Wells 12,664

      Increase in wells 3716 (Increase of 42%)
      Increased production from Dec 2014 to Feb 2019(4 years 3 months) is 118,000bpd (10%)

      1. Guess in 2014 most of the wells in bakken was vertical , than gradualy they changed to much longer and horizontal latherals. There is no doubt for every feet well compleated a lot less oil comes up in 2019 than in 2014 or in other words for every dollar spent less oil each day from each feet well to pay their bills and obligations. Think this gives a good picture of increased decline rates if they need out of sweet spots or wells spacing to tight. Same pattern will be in Permian it is just a matter of time. Seems like investors, banks eager to get back their investments….

        1. No, the only vertical wells in the Bakken in 2014 were the old conventional wells, producing very little oil. Fracked wells were always horizontal. They did not change gradually, they changed suddenly when the fracking boom began a few years earlier.

          The Bakken does have an anticline, with reservoir rock. That’s where the old vertical wells were drilled. The tight source rock requires horizontal fracked wells to recover the oil.

  31. Hi,
    Could anyone please help me with numbers for the area occupied by the wells in Bakken? Both on the surface to understand the environmental impact and underground to understand how much of the available drilling area is used.
    Thanks!

    BTW: The EIA drilling productivity report is out. Very high legacy declines. I doubt if US shale will grow much the next 6 months, also as the number of drilling rigs have declined recently.

  32. Russian oil companies are saying that $70 Brent is high enough for them, just like they said in 2018.

    2019-04-16 (Reuters) Gazprom Neft, the oil arm of Russian gas giant Gazprom, expects the global oil deal between OPEC and its allies to end in the first half of the year, a company official said on Tuesday.
    https://www.reuters.com/article/us-global-oil/oil-steadies-as-market-focuses-on-supply-risks-idUSKCN1RS04B

    2019-04-08 Russia’s Lukoil says that it is too early to say if the OPEC+ cut deal should be extended, the price range of USD $60 to $75 per bbl suits everyone (producers & consumers).

  33. Blurb just hit the headlines, a #MeToo attack on Anadarko’s shale ops. “Women were treated as playthings”

    This has all the makings of an exit for CVX from the deal.

  34. Kashagan upgrade & maintenance has started, I guess they must have stored oil for export…
    Chart for daily oil production: https://pbs.twimg.com/media/D4V7Mv7WsAA4OGQ.png

    Source: OPEC MOMR March: Kazakhstan, operators have announced temporary major oil field production shutdowns for maintenance. Oil production will be halted in the Kashagan field for 45 days from 14 April, in Tangiz from 1 Aug for 42 days and in Karachaganak for 28 days from 15 Sept.

    1. From the top of my (empty) head. Kazakhstan overproduced compared to their OPEC+ quota during Q1 2019 and will under produce in Q2 due to the maintenance shut down. On average this will even out. This has been communicated to the market. I think their export will decline accordingly starting in May (?).

Comments are closed.