All data below, unless otherwise specified are from the latest OPEC Monthly Oil Market Report. All data is through July and is thousand barrels per day.
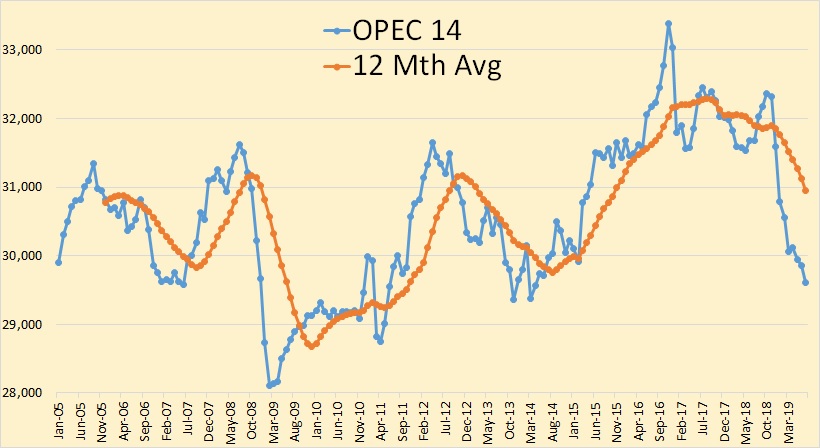
OPEC crude oil production was down 246,000 barrels per day in July’
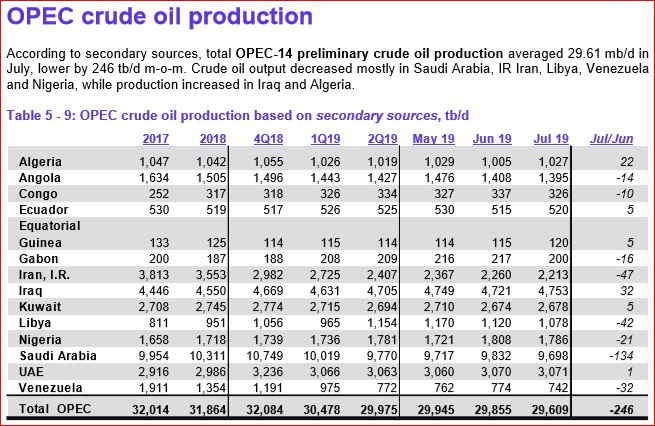
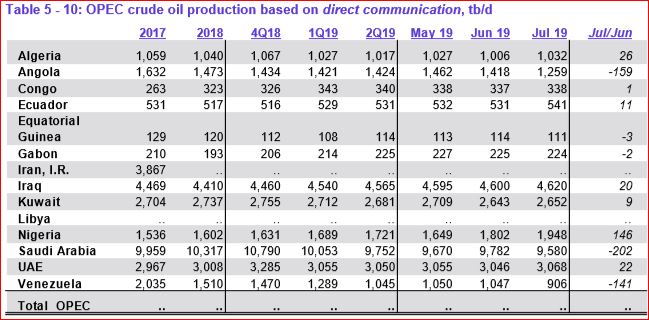
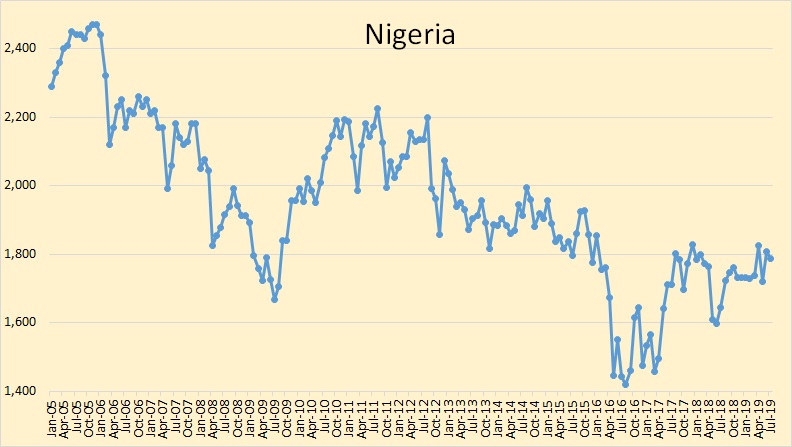
There is often a difference between what secondary sources say OPEC produces and what the countries themselves say they produced. Nigeria said they were up 146,000 bpd while secondary sources said they were down 21,000 bpd. Similar differences can be found in the Saudi and Venezuela data.
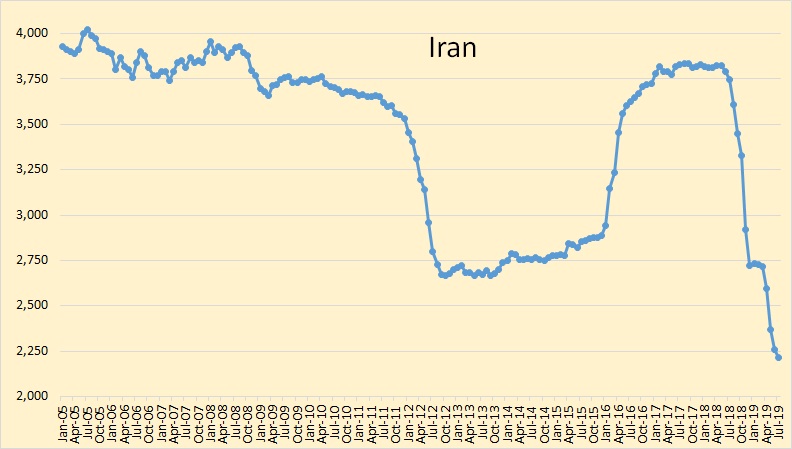
Iran’s decline, due to sanctions, has slowed slightly but they were still down 47,000 bpd in July.
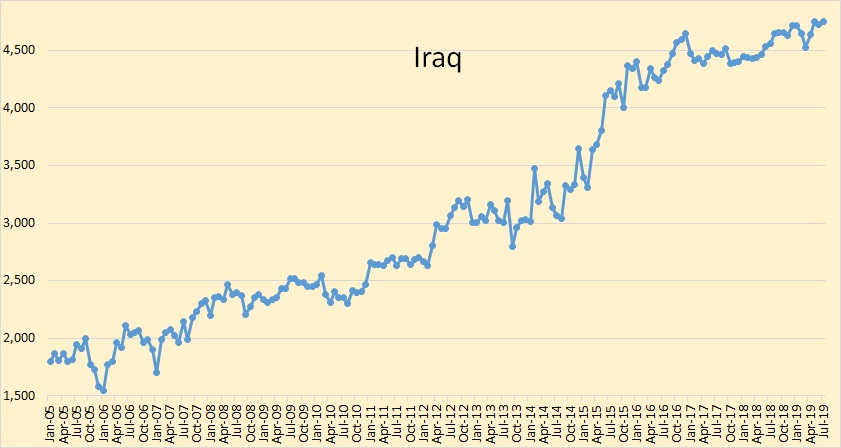
Iraq’s crude oil production was up 32,000 bpd in July. That is a new all-time high for them. They are totally ignoring their OPEC quota request.
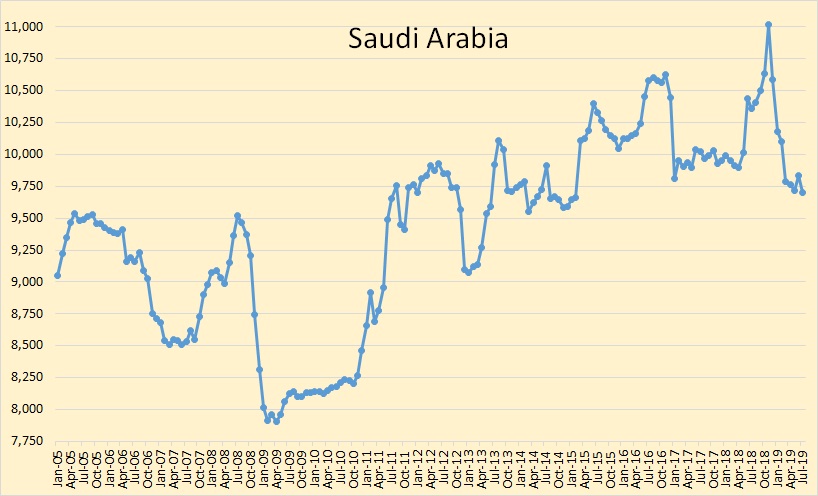
Saudi crude oil production was down 134,000 bpd in July.
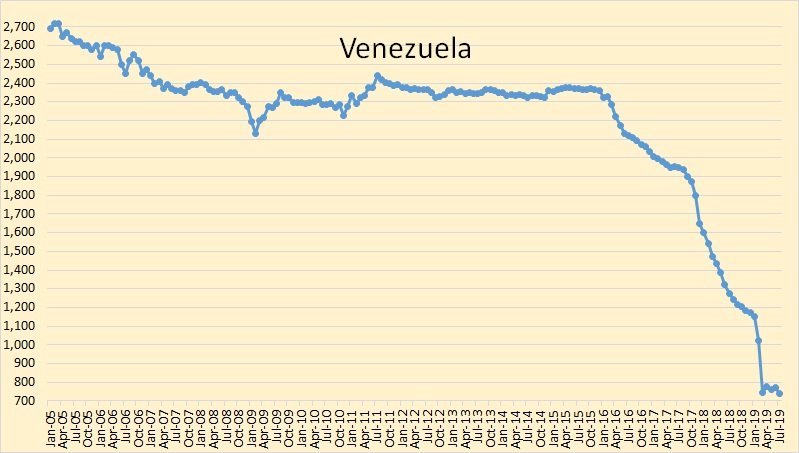
Venezuela’s crude oil production decline appears to have reached a bottom.
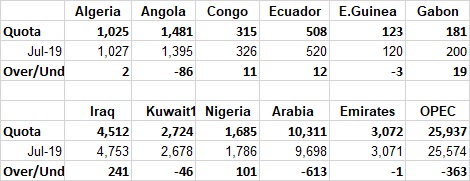
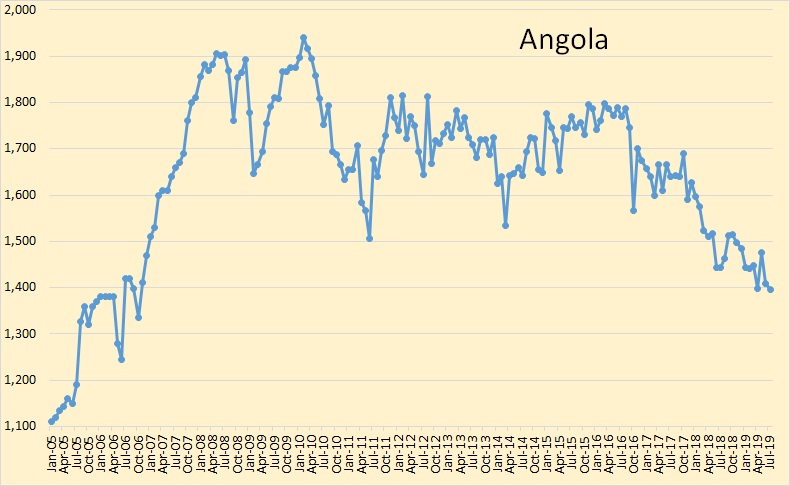
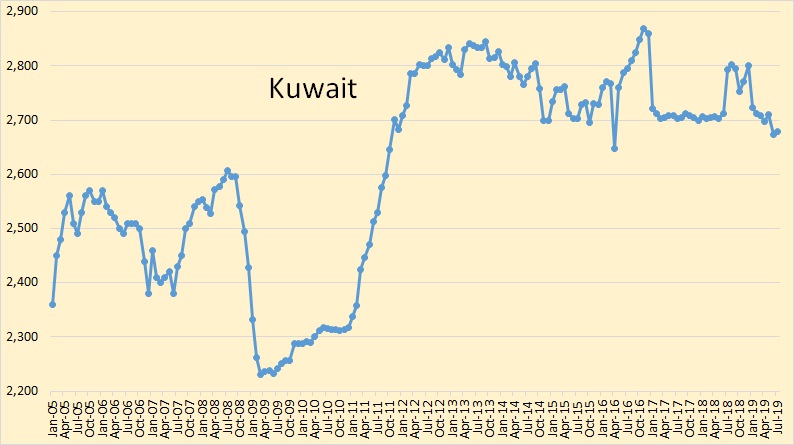
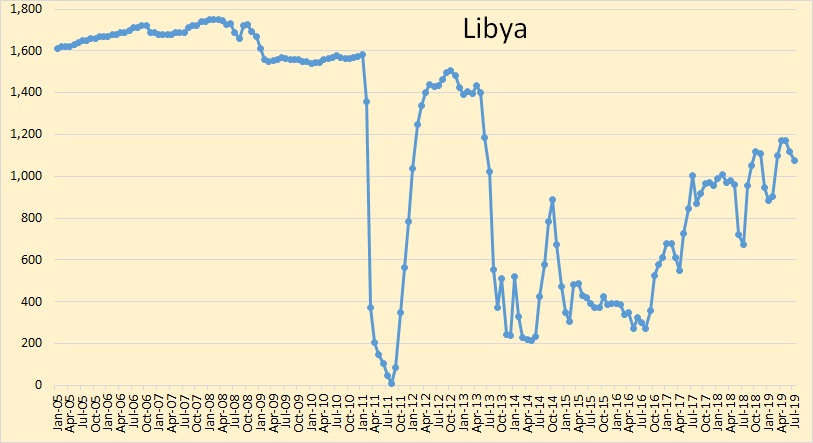
Libya, Iran, and Venezuela are exempt from OPEC quotas. Iraq is totally ignoring their quota as they are producing 241,000 barrels per day above their quota. I believe Nigeria and Angola are both producing flat out. Angola is producing 86,000 bpd below their quota while Nigeria is producing 101,000 bpd above their quota. Kuwait may be producing flat out as well as they are 46,000 bpd below their quota.
Saudi Arabia is the big question. Are they choosing to produce 613,000 barrels per day below their quota? Or perhaps there is another reason?
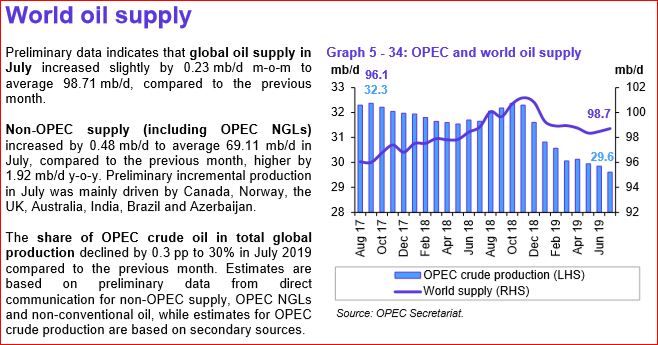
I am a bit skeptical of OPEC’s estimate of World total liquids supply of 98.7 mb/d. Also, their statement that OPEC crude share of global production is just not correct. OPEC production, crude only, has averaged 39% of world C+C. OPEC does not publish C+C data but if they did their C+C data would be well over 40% of all C+C production.
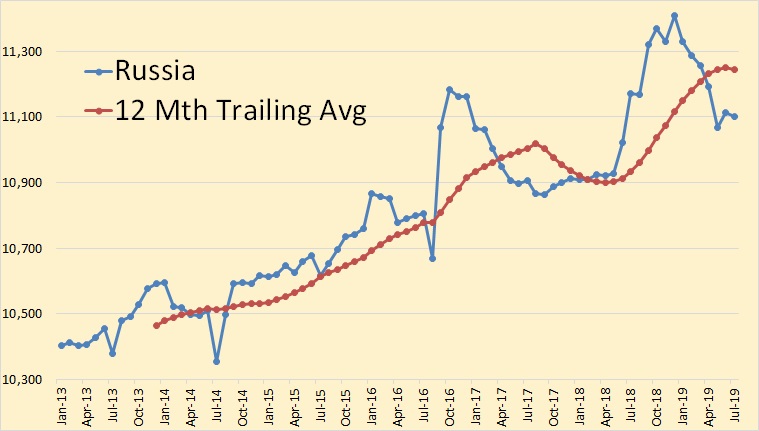
Russian C+C production was down 11,000 bpd in July according to the Russian Minister of Energy.
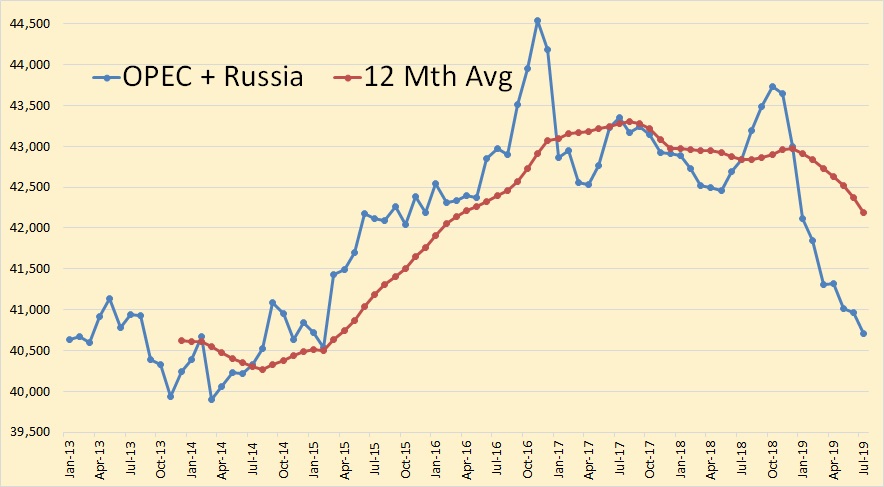
OPEC plus Russia C+C production averages over 55% of total world production.
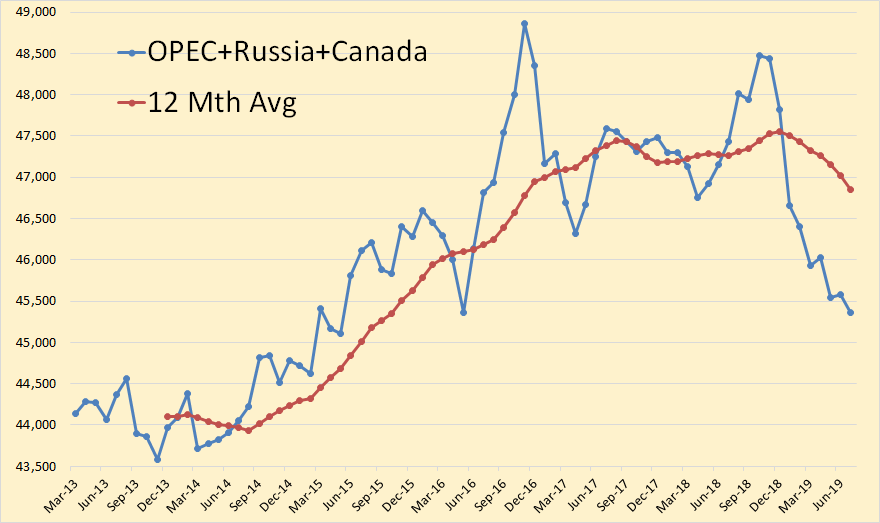
OPEC + Russia + Canada, over 58% of world oil production, through July.
409 responses to “OPEC July Production Data”
About one third of the world production (non OPEC, USA, Can, Rus) entered what looks like terminal decline in late 2015. OPEC+Russia (about half of the world production) appears to have entered decline in late 2018. USA+Can cannot compensate and even appears to be peaking.
Peak Oil is here. Consumption keeps growing over 1% every year. Production grows less than 1% every year. The powers that be have only one way to handle the situation. Consumption needs to grow less and that means economical slowdown. For some countries recession is coming.
Carlos
Last year the United States alone increased production more than global demand increased. Therefore OPEC + cut production to support prices.
The United States will increase production this year by more than global demand requires. That is why prices are so low.
Oil demand and production are still increasing, so we have not hit peak oil.
Keep watching the monthly EIA 914 reports. It won’t come close. And, latest reports indicate a larger than norm hurricane season.
Year to date.
10.8 to 12.3. which is 1.5 million barrels per day increase in C&C which is more than global demand increase. This is why OPEC + are making cuts.
https://www.aljazeera.com/ajimpact/opec-oil-production-cuts-2020-190701153530944.html
Hugo, I don’t think you are looking at this correctly.
Look at the OPEC+Russia chart in this page. It is down to 40.5 kbpd, its 2014 level, with a loss of 2.5 kbpd from their peak.
Then look at the Non-(OPEC/Russia/USA/Canada) or rest of the world chart here:
http://peakoilbarrel.com/usa-and-world-oil-production-3/
It is down to 24 kbpd, a loss of over 1.5 kbpd since 2015.
Canada+USA is about 16.5 kbpd as seen here:
http://peakoilbarrel.com/world-oil-production-as-of-march-2019/
So what we have is that OPEC+Rusia and “rest of the world” have lost about 4 kbpd from their respective peaks and their combined production is now lower than it was in early 2015. That’s 80% of C+C oil world production that has peaked and is declining.
Canada+USA account for 20% C+C oil world production. The US fracking industry has lost hundreds of billions of dollars already and somehow you think they will continue expanding to cover for production loses from the rest of the 80% world production plus a >1% yearly increase. We don’t even know if that expansion is possible even if money is not an issue.
Although oil production could increase from Iran, Libya, and Venezuela if things change for the better, it is doubtful that it will happen before oil production enters terminal decline as we are hit by the effect of low capital investment in new projects. Peak Oil is an immediate reality and we will suffer its effects long before the cause is clearly identified by most people.
Peak Oil was avoided in 2005 by fracking of shale oil, and was avoided again in 2015 by the shale oil industry continuing operation despite being profoundly uneconomical, thanks to central banks zirp and monetary expansion. Third time in 2019 is probably the charm.
I mean mbpd not kbpd.
Carlos
OPEC plus have not lost oil production, they have made production cuts in order to try and prop up prices. I can assure you Saudi Arabia does not have a natural decline rate of 15% per year. It has made these cuts.
Iran could produce another 1.5mmbd, but the sanctions means it cannot sell that oil to anyone.
If we were at peak oil and China, India, Japan, Europe etc were struggling to buy the oil they needed. Then oil prices would be over $100 and more. At the moment they cannot give it away.
We are at least 3 years away from peak oil and more likely 5.
Hugo,
The cuts are imaginary. They tried the cuts in the 1980s and it was a disaster in terms of lost market share to them. So this time they have fake cuts to move the markets. The drop in production is quite similar to the drop in production from Iran and Venezuela, so it looks like they are losing production from some nations with the rest unable/unwilling to compensate and selling it as voluntary cuts.
World oil production is at the same level as a year ago
http://peakoilbarrel.com/wp-content/uploads/2019/06/World.jpg
So there hasn’t been any increase in production, while demand has increased. Curiously prices are going down and inventories up. We can’t trust the inventory data as it is an easy way to manipulate prices. The solution must be that a slowing in demand is anticipated from further economic deterioration.
In 5 years we might not be able to return to peak production even if we try. Depletion and lack of investment will play against.
Carlos
Do you believe US oil production figures?
I have no reason to doubt them.
Do you believe US production will continue to increase over the next years enough to compensate other nations decline? If not who do you think will increase its production enough to continue increasing world production?
Good, therefore you can see US production has increased more than global demand required. That is why oil prices fell under $30 at one point.
OPEC + then decided to cut production, you can see it in the graph above, from late 2018.
Anyway if you do not want to believe the obvious facts, I will not stop you believing what you want.
For first time in history heavy oil from norwegian field catches premium over Brent….the world is short of heavy oil
USA production isn’t remotely sustainable, nevermind a continuous offsetting increase of other people’s terminal decline. Besides the structural unprofitablity, its implausible that the resources in place are as large as the EIA estimates. No one on the ground believes that. They keep going back to the same almost saturated sweet spots despite the spacing issues. The supermajors don’t believe it either as their interest in buying lower tier acreage or companies that mostly have that left is nonexistent. They need new production but they don’t want this stuff.
Russia, KSA and a few others are deliberately restricting their production levels in order to support prices. Also, Iran & Iraq can massively increase from their current production levels if (when) the need arises. There is no Peak Oil and there won’t be any during the next several decades at the very least.
It appears that the US (25% of global oil consumption/waste?) has but 3 choices. 1. Become Trading partners with Russia and Iran. 2. Get serious on Energy Transition execution. 3. War, Terror and more regime change 4. Deploy the Alan Parsons Project.
https://youtu.be/Ei_GZnrr1nw?t=23
What say You?
Usually 1 and 3 are combined in the resource rich country aren’t they? Then it goes wrong some way down the road when the new regime ‘turn’, and things get worse than before
3. seems to fit the history. I don’t blame anyone not patient enough to scroll down to the bottom.
https://en.wikipedia.org/wiki/List_of_wars_involving_the_United_States
RRC data. Dennis gives no value to RRC completion data, and I don’t blame him. However, the permit info in the report is real time. Wells won’t be drilled without permits. Time from permit to completion is, usually, six to nine months. If they are lucky, five months. Problem is, the well type (horizontal vs verticals or directional) is not broken out. It can be used for trends, however.
From January to July, these are the totals for total oil, or oil and gas wells for Texas:
1035, 843, 1003, 786, 893, 853, 749
This is the same for the EF:
201, 192, 218, 150, 164, 176, 112
For the Permian:
711, 546, 612, 476, 577, 554, 479
Trend is down. Gate to new pipelines now open. If, they expected to drill more to fill it up, permits would reflect that. They don’t. As some reference, there were 183 approved vertical permits for the Permian for July. That’s a little higher than average, which the report I pulled for the year, puts them at an average of 104. Texas production will not be up much for this year. Nor, does it look promising for the first of next year.
GuyM,
Trend may be down a bit. Seems there are often an excess number of permits so there may be plenty of permits issued waiting for drilling or completion. So far tight oil production has continued to increase, though the rate of increase is slower than 2018.
Yes. Peak oil is now.
Oh for God’s sake.
Here you go, chew on this. The day there are the initial 2 mile long lines at gasoline stations, not just in the US but all over the world . . . that day we will still see announcements of record oil production globally.
This is species killing stuff. Wall Street popular saying . . . no one rings a bell at the top. Well, no one is going to give you any warning whatsoever that oil scarcity deaths start that month. You will know nothing of it. You will be told it is all from some temporary factor that will soon be fixed.
So if you see something now that looks like a warning sign, it’s probably not legit.
We had peak oil, conventionally, already. Just caused lower consumption due to the higher price. That will come first, again.
I doubt peak oil is now, I would say 2023 at the earliest and 2027 at the latest, best guess remains 2025.
Could be. Depends on the survival rate of independents. I dont think the majors would get their price, and we may wind up with some extended chapter 11s.
I doubt peak oil is now also. World oil production is about 2 million barrels per day below what it was in November 2018. Down 2 million barrels per day is definitely not a peak.
Ron, do I read some irony between your lines?
Perhaps. OPEC is producing at 2011 levels. The world is kept at bay from peak oil only by US shale production. And US shale production is on shaky legs, just trying to stay ahead of the red queen.
I just don’t see this blind optimism that US shale will continue upward for the next 5 to 6 years.
I well remember when it was said that: “When Saudi Arabia peaks, the world peaks”. That was just not correct. But now it is obvious that when the US of A peaks, the world peaks.
Ron,
I agree US peak will likely be close to World peak (perhaps one year before.)
OPEC/NOPEC has cut output to support oil prices, if they rise, the cuts will end. US output will continue to increase at least until 2024 in my opinion.
OPEC output varies based on the price of oil, this has mostly been true since 1988, and is likely to continue until 2030.
Dennis, OPEC produced more oil per day in 2005 than they are producing today. OPEC peaked in 2016. End of story.
OPEC will not save the world from peak oil.
Hi Ron,
I guess I thought we were talking about the World peak, the question is can OPEC increase output, I maintain that they can and will choose to do so when oil prices rise.
It is the combination of rising US output and the increase in OPEC output that will keep the trailing 12 month average of World C+C output rising until 2025.
Dennis, OPEC average daily production in 2016 was 32,113,000 barrels per day. In 2018 every OPEC nation was producing flat out, no cuts, no quotas. In 2018 they produced 31,857,000 barrels per day. In 2019 they are averaging 30,134,000 barrels per day. And that is still with most OPEC nations producing flat out.
Nuff said.
But 2 opec countries are under sanction. Thats 3 to 4 mbod without question. Then there is the ability of at least iran and iraq to achieve 10mbod each over time and sustain that for 20 or more years.
. Thats 3 to 4 mbod without question.
Sanctions are not affecting Venezuela’s oil production. It is collapsing for another reason. And it will take them a decade or more to recover when they finally settle their economic problems.
But there will always be political problems. They are likely to get worse, not better.
Peak oil will be when the most oil is produced, not what could be produced if there were no political problems anywhere in the world.
Ron,
In 2019 all except Iran and Saudi Arabia look like they are producing flat out, higher oil prices in the future will likely end OPEC cuts and OPEC output will increase by 600 kb/d at minimum. If the US settles its dispute with Iran, Iranian output could increase by 1300 kb/d. I imagine high oil prices might lead Trump to change course on Iranian sanctions.
Ron Wrote:
“Peak oil will be when the most oil is produced, not what could be produced if there were no political problems anywhere in the world.”
🙂
Dennis, Maybe that’s D Trump’s strategy before the next US President election, to settle the dispute with Iran and lower the oil prices and take the credit for doing so.
Tom,
That is a possibility, hopefully many citizens will see that it is BS, Trump is full of it, but fools enough voters to get elected, he may pull it off in 2020, incumbency is surely an advantage.
Opec will not save the world and neither will USA . The problem is that all the increase in the last few years is from shale or LTO ,call it what you will . Problem is that this is mostly + 45 API so poor in middle distillates . In reality peak oil is when the^ black goo^ peaks . NGL’s ,NGPL,s ,bio fuels, LTO and the term ^all liquids^ are used as a fig leaf to hide the real peak of the ^black goo ^ . We are past peak as far as the ^black goo^ is concerned .
The nature of the liquid is a big deal.
The bigger deal is this believing of numbers that come from people with agendas.
You’re not going to get any warning. No one has any incentive to give anyone correct data.
“The problem is that all the increase in the last few years is from shale or LTO ,call it what you will . Problem is that this is mostly + 45 API so poor in middle distillates . “
In 2005 (!) on Bloomberg tv channel someone said, in other words, that the most valuable oil to make kerosene of is increasingly difficult to get. I guess that kerosene is a middle distillate.
The shale oil boom might last for many decades, for what it is worth
The shale oil boom might last for many decades, for what it is worth.
Shale production may continue for a decade, or a bit longer, but not decades. However, that is not the point. The point is, how long can shale continue to increase production.
The legacy decline for shale varies between 5% and 6% per month! The EIA’s Drilling Productivity Report says US Shale production will increase by 85,000 barrels per day in September. Probably not, but that is not the point. To get an increase of 85,000 barrels per day, they had to have new well production of 649,000 barrels per day. That is because they had 564,000 barrels per day of legacy decline. For every one barrel per day of increased production, they had to produce 7.64 barrels per day of new oil because they had 6.64 barrels per day of legacy decline.
The more they produce the more they have to produce just to stay even.
For every one barrel per day of increased production, they had to produce 7.64 barrels per day of new oil.
This is the key point regarding shale oil production. The higher the production, the more new production is needed to increase production. It’s essentially an exponential function. Shale oil production will not increase for much longer because it’s not physically possible to drill/frack at a sustained exponential rate.
This is the key
Frugal, damn, why is that so hard for some people to understand?
I don’t see this exponential problem in shale.
Shale production is not oil production, it’s mining.
You need 3 drilling teams, 4 fracking teams and get over long time a constant production. When you want to increase (say you have enough acres, as enough ore in a iron mine) you hire 2 new teams, as in mining employing a new excavator and conveyor belts.
So, like in a mine, when you fire a team production drops almost immediately.
The big ones (XON) in the Permian do Shale oil mining exactly like this – they have own drilling and fracking team, working constantly.
The same thing as mining is when you have to drill your b-class acres. As in a mine when the ore veins run out in thickness.
So either close your mine, hire more teams to maintain production or life with decreasing production at constant costs when the qulity is declining.
I’ve left out technical progress. This is just a cost reducer (need less drilling / fracking teams to do the same output).
Eulenspiegel, your mining example is not a good comparison at all. That is because new mines don’t decline in production by 6% per month.
Here is the exponential function of shale oil. They must produce new oil at the decline rate just to stay even. Growth in production is only accomplished if they produce more oil than declined that month.
But if they do produce more oil than the decline rate, then the decline will be even higher the next month. That is, if they had to produce 649,000 barrels of new oil in September to grow production by 85,000 barrels, then to grow oil by a like amount in October, they will have to produce more than 649,000 barrels. The more they increase production each month, then the more they will have to produce the next month just to stay even.
When production increases, the monthly loss through legacy decline also increases. Therefore just producing the same increase as they did last month will not do. They must always continue to increase by more than they did last month just to stay even.
As always: The greatest shortcoming of the human race is our inability to understand the exponential function
Ron, in my opinion it is a better model than conventional oil.
In conventional oil, you can pump 20 years after drilling. For 50 you’ll have to do more things like water flooding etc. So increasing production is just drilling a few more holes (and install the additional infrastructure).
In mining, you have a decline rate of 100% / day.
You send a team in, they mine 100 tons of ore in their shift, move out and production after their shift is 0.
When you want more ore, you have to send in a team next day again.
Having 1 minint team gives you constant ore / day. Firing them gives you sudden production of 0.
So with LTO you send a fracking team in to create 1 well, produce oil for a few months (I’m exaggerating) and then you have 0 production again.
So you have to send in the team again. And again.
If you use 1 team drillling constantly new holes. you’ll have nearly constant production (after the first ramp up time of overlaying declining productions, in reality a few years).
Increasing production means more teams constantly drilling new holes (as in mining: drill hole, fill with explosives, boom, carry away ore, repeat).
The big question for the peak shale oil is here: How many drilling/fracking teams can be payed and supplied with anything they need for working efficient. It’s not just hiring teams.
To employ more teams they need more road capacity, sand capacity, water transport, take away pipelines, more stuff … you know better than me.
As in deep mining: The elevator capacity / tunnel train capacity limits the maximum possible production. For increasing production, you have to increase everything, and then hire new teams.
So the question is: How much money do they invest to stretch all these capacities.
Frugal,
I model the production that will occur. An exponential increase in completion rate is not needed, a linear increase will do. In fact the completion rate can be constant and if that constant is high enough, the output will increase for quite a while (though the rate of increase will gradually slow.) A key factor is that eventually the EUR of the average completed well will decrease as sweet spots get saturated with wells. It is difficult to predict exactly when this will occur. My guess is that it will be 2020 for Eagle ford and Bakken and perhaps 2023 for the Permian Basin and Niobrara. For the Permian Basin if the completion rate matches the average completion rate for the first 6 months of 2019 from July 2019 to June 2037, then output increases from 3530 kb/d in June 2019 to 5368 kb/d in June 2029 (5200 kb/d in July 2025 and 5000 kb/d in Jan 2024). No exponential increases needed, just a constant completion rate is enough.
If oil prices increase at some point, it is likely that the completion rate will increase gradually and output is likely to increase faster than this exceedingly conservative scenario.
According to Dennis,
For the Permian Basin if the completion rate matches the average completion rate for the first 6 months of 2019 from July 2019 to June 2037, then output increases from 3530 kb/d in June 2019 to 5368 kb/d in June 2029 (5200 kb/d in July 2025 and 5000 kb/d in Jan 2024).
And according to Ron:
To get an increase of 85,000 barrels per day, they had to have new well production of 649,000 barrels per day. That is because they had 564,000 barrels per day of legacy decline.
Now if the ratios stay the same up to January 2029:
Legacy decline in 2029 = 5368/3530 x 564,000 = 858,000 barrels/day/month
But the average completion rate for the first 6 months of 2019 produces only 649,000 barrels/day/month of new oil.
This gives an initial production decline in June 2029 of 858,000 – 649,000 = 209,000 barrels/day/month.
Frugal, of course. How simple is that? If monthly production increases. Then legacy decline also increases. Therefore, assuming production per new well stays the same, then completions must increase every month to compensate for the increased legacy decline.
Ron, monthly completions can stay constant to produce at the same level, they can even slow somewhat.
When a region drills 100 holes / month (all same quality), the first year they will get much growth, the second year round about 20% ( since the wells from last year declined 80%), the third year 4% and after this it’s nearly constant. Not exactly right, but that’s the direction.
The wells from year 2 deliver exact as much in their first year than the wells from year 1. So total production is adds year 1 production 100% + year 2 production from the first batch of wells (20%).
In year 3 it’s 100% + 20% + 4% from a years production.
And so on until the wells are closed.
And they have to continue drilling theses holes, month after month or decline.
But production will never decline when drilling the same amount of same quality wells.
When they want to grow, they have to increase to for example 120/month – and stay there. So more $$$ each month, not just a growth spurt. When they go back to 100, they’ll decline after a adjusting time.
Worse quality of new holes has to be directly compensated by drilling more holes, for more $$$ and even worse cashflow.
With the same quality, you’ll never drop production while drilling the same number of new holes. Sinking production by constant drilling activity indicates other problems: Frack hits, running out of good acres, wrong length or spacing or other calamities.
That’s a warning sign to look for. And a sign that this basin has seen it best days.
Frugal,
I was looking at Permian basin only and Ron was looking at all US tight oil so you cant really use these two estimates. The fact is the legacy decline does not increase very much if the completion rate remains constant.
For July 2019 Permian legacy decline was 264 kb/d according to DPR.
The estimate from my model is in chart below with constant completion rate (no increase or decrease in completions per month) from July 2019 to July 2035.
click on chart for larger view.
Ron, monthly completions can stay constant to produce at the same level, they can even slow somewhat.
Eulenspiegel, please try to understand the argument Dennis is making. He is not talking about production staying at the level, he is talking about output increasing from 3530 kb/d in June 2019 to 5368 kb/d in June 2029…..with no increase in completion rate. That is, the completion rate remains the same.
Dennis wrote:
The fact is the legacy decline does not increase very much if the completion rate remains constant.
No, of course, it doesn’t. It doesn’t because production does not increase either.
I have posted below a chart of Permian legacy decline rate since 2013. Legacy decline rate for the Permian is currently around 6% per month.
Hi Ron,
To be clear, my model has no increase in completion rate for the Permian basin, it is held at the average rate for the first 6 months of 2019 which I estimate (based on my model and the EIA tight oil production estimate by play) at 456 completions per month on average from Jan 2019 to June 2019.
Bottom line there are a lot of completions (5472 per year on average from July 2019 to June 2029) or a total of 54,720 new wells completed over that period.
Not quite “no increase in completions”, which suggests no wells are completed after June 2019. That would be a very different scenario. 🙂
Not quite “no increase in completions”, which suggests no wells are completed after June 2019. That would be a very different scenario. ?
I thought the meaning was quite clear. At any rate I have added “rate” to the sentence to clear things up.
Shale decline curves are hyperbolic.
Fernando said:
“Shale decline curves are hyperbolic.”
In terms of math it’s considered hyperbolic, but in terms of physics it’s diffusional. There’s a huge diffusional spike initially followed by a low-rate fat-tail, which gives it that hyperbolic (non-exponential) shape. The tail may be fat, but low enough as to be of arguable value.
If the diffusion shows any limiting factor, then the model is Ornstein-Uhlenbeck, and the fat-tail essentially disappears and it damps quickly.
Bottom-line, Dennis does indeed apply a hyperbolic model in that chart.
Hi Ron,
The scenario shows that output does indeed increase for a time, so your assumption that there is no output growth when completion rate remains fixed is incorrect.
Ron Wrote:
“When Saudi Arabia peaks, the world peaks”…But now it is obvious that when the US of A peaks, the world peaks.
So who gets to ride the camel, Me or my son?
“My father rode a camel. I drive a car. My son flies a jet airplane. His son will ride a camel.”
Well the world’s conventional oil production certainly peaked a while ago. Even if one treats Venezuela and Canada as conventional because their production was usually in forecasts, the USA fracking has to be considered a separate thing. The industry cycle is different, the grade produced is different, the economics are “different.” The tail is *very* different as without new drilling the entire patch would disappear in less than three years. Blap, gone to stripper wells.
Hi Ron,
I judge the peak by 12 month trailing averages. For the World C+C trailing 12 month average peak is April 2019 at 82925 kb/d based on EIA data. We will have to wait to see what the June 2019 12 month trailing average will be, as so far the data for May and June 2019 for the World is incomplete.
I somehow feel the truth lays somewhere between Ron and Dennis. Reality is much more chaotic than Dennis’s predictions, albeit there could be more oil in the ground than assumed by Ron: Probably some undulating chaos lies ahead of us where the peak, especially if it doesn’t refer to a 12-month-average, could appear at any place along the timeline of the next five years.
Dennis, 2018 oil production is the average for January through December production. Ditto for 2019 production. The peak year will be the peak year.
Dennis, this ain’t rocket science. And this ain’t April, it’s August.
Not so fast Ron
This is the age of Trump. I know for us simpletons it makes sense the average would be production. I’m not sure how Trump would do it, but I’ll bet the tangerine could make 2019 peak the best ever. A world depression followed by war.
Peace
Ron,
You can do as you choose, I look at rolling 12 month averages. Yes it is august, but we only have World C+C data through April 2019, so the trailing 12 month average for World C+C output in April is the maximum to date for the data we have. Yes not rocket science, quite simple.
So you can go by peak year, I will continue to focus on the peak 12 month period instead. No right answer, just a different approach.
Hi Ron,
Do you have data for World C+C output from May, June, July, and August of 2019? Latest data from the EIA is April 2019.
No, but OPEC + Russia + Canada, about 58% of world oil production, is down 667,000 barrels per day, April to July. I doubt that the other 42% of world oil production is up anywhere near that amount.
The 2019 7 month average for OPEC + Russia + Canada is 1,629,000 barrels per day below their 2018 average.
I have posted that chart up top, just below OPEC+ Russia.
US tight oil up 351 kb/d from April to July, so if condensate output from OPEC was unchanged, and the rest of the World saw no change in output the World would be down by 316 kb/d. US tight oil average output for the first 7 months of 2019 is 944 kb/d higher than the 2018 average, so 2019 is lower than 2018 so far (assuming other areas have remained at 2018 levels.) OPEC and Russian output can probably increase if oil prices rise. Currently they are trying to cut supply to raise oil prices. This may result in lower output in 2019 compared to 2018.
Yemen rebel drone attack targets remote Saudi oil field
https://www.miamiherald.com/news/business/article234108062.html
Things are getting even more interesting.
This attack was 750 miles from Houthi territory.
Round trip would be 1,500 miles.
A Predator has a published range of 1,150 miles.
My guess is they are infiltrating Saudi Arabia, attacking from much closer than 750 miles out and maybe sacrificing the drone. Sort of like the Jimmy Doolittle raid on Tokyo in WWII, for similar purpose. With a similar result. Message sent, message received.
You know more than I do.
Sounds reasonable.
It’s a one way trip. The drones used by houthis don’t fire a missile and then fly home, they are the missile. The drone is mounted with a 30kg warhead and it is flown into the target, usually in a swarm attack.
https://www.defensenews.com/unmanned/2019/05/21/how-yemens-rebels-increasingly-deploy-drones/
https://en.m.wikipedia.org/wiki/HESA_Ababil
Thats was my understanding also—
For those interested, Houthis have been using drones to attack the radar components of Patriot surface-to-air missile systems for a few years now.
‘Kamikaze’ drones used by Houthi forces to attack Coalition missile defence systems
https://www.conflictarm.com/download-file/?report_id=2465&file_id=2467
Thanks for the information. That’s fascinating. The ability of small groups to project force seems to keep growing.
Inventory draws should begin to pick up for the US soon. 1 million in pipeline from the Permian to the coast. Exports to increase, Cushing to decrease, and production mostly flat. A lot of the Permian production has been going to Cushing as an outlet. Depends on how much can be loaded on to ships, now, and how much lite oil can be sold. Pipelines are going to be losers for awhile. Additional pipelines need to take note.
There are two, sure fire, statistics and reports that will define where we are going. You can argue them, but you will lose. One is the EIA monthly 914 report, the other is the Texas RRC permits. There’s some DUCs, but by this time, I consider them as normal DUCs between drilling and completion as is norm. And the 914 May show it up a little for June, but I don’t see it going up further. Or, much more.
Guy
Attached is the latest LTO data from the monthly EIA 914 page. The main difference that I can see is the drop in the monthly production growth from 2018 to 2019. 2018 production growth averaged 153 kb/d/mth. 2019 production growth over the first seven months has dropped to an average of 97 kb/d/mth. The total July increase over June was 107 kb/d/mth. The biggest increases for July came from Sprayberry (33 kb/d) and Wolfcamp (46 kb/d).
Not sure what that is. This is what I was referring to:
https://www.eia.gov/petroleum/production/
Any estimates past this point in time are totally meaningless.
GuyM,
Tight oil is not broken out in monthly report.
Data is likely from “tight oil production estimates by play”, just search on google.
Or go to link below then click on excel file under tight oil production estimates by play
https://www.eia.gov/petroleum/data.php#crude
EIA estimate based on drilling info data is 7534 kb/d in May, 7637 kb/d in June and 7744 kb/d in July 2019.
Fairly sure this is what Ovi used.
Almost all of the tight oil increase from Dec 2018 to July 2018 is from the Permian basin, 405 kb/d for Permian vs 429 kb/d for US tight oil increased output over the past 7 months. For first 5 months of 2019 Permian output increased by 237 kb/d with US tight oil increase of only 219 kb/d.
Guy/Dennis
That is the data I used. I summed the production from all of the plays and separated the data into 2018 and 2019 to see if there was a difference in the growth. Below are the charts for the 9 plays. As you can see the two biggest growth plays are Spraberry and Wolfcamp. Bonespring and Niobrara still showing slow growth.
Second chart
Thanks Ovi,
Your second trendline on your first chart suggests a recent trend of 97 kb/d for monthly increase or an annual increase of 1164 kb/d. If the trend were followed from Feb 2019 to Dec 2019 it would suggest about an 870 kb/d increase in US tight oil output from Dec 2018 to Dec 2019. I think there might be a slowdown the last half of 2019 so would estimate something like a 650 kb/d increase over the Dec 2018 to Dec 2019 period for US tight oil output. That estimate is pretty conservative if the July EIA estimate is correct as we have already seen a 429 kb/d increase in tight oil output from Dec 2018 to July 2019, so my estimate suggests only an average monthly increase in tight oil output of only 44 kb/d for the last 5 months of the year.
Dennis
My plan is to leave the line the same and track the updated data to see if production starts to fall away and begins to roll over. Unfortunately, the latest data indicates an increasing trend. Here are a few of the latest monthly growth numbers. I wonder if the March increase was a result of info errors (missing data) in the January and February data.
Growth
March 209 kb/mth
April 60
May 81
June 103
July 107
Yeah, but it is but estimate guesses. There more likely scenario is that Bakken, EF and Okla. are already starting to go down by June/July. But, time will tell.
Guy
Bakken appears to be plateauing. However its production was up by 30.8 kb/d (Only Bakken) in June to 1.367 Mb/d.
Ok, bad choice of words, again. By down, I meant little or no growth. And, that’s what I expect from the rest of this year, net.
GuyM,
Yes so far for US LTO in 2019, if we exclude the Permian basin there has been almost no growth in output, so I agree with your guess for everything except the Permian basin, there I expect the growth is likely to continue, but at a somewhat slower rate than the first half of the year.
Thanks for valuable informstion Guy, in my mind from what I have read the shail oil have change some caracter espesialy in 2019. It have become more light that means lower quality. If quality goes down this will mean less profit if any at all to drill new wells after all exspensives, loan balones are payed. The good thing is it seems now low sulfur diesel demand increase because new IMO rules and prices, refinery margins in Asia increases. But it might be this will have minor Impact for WTI price as they demand more heavey oil , brent i.e for their marine diesel..
Is Brazil C&C production on a peak plateau?
Source EIA
Entirely possible. All their new production are high investment, high risk, high decline deepwater projects. Making that all go right on cue is difficult.
To me the interesting graph here is Saudi Arabia. Ignoring the spike in 2018 where they were likely pulling from storage to increase their rates for bargaining clout prior to the OPEC+ cuts, there is a clear trend line from middle 2017 to now of a gradual 1.5-2% decline in production. With little left to bring online and Ghawar apparently in decline, I wouldn’t be surprised if this trend line is their maximum production.
Is Saudi Arabia post peak C&C?
Source EIA
Tony, from this graph it can’t be concluded. Since the year 1997 one could have asked the same question at least seven times. The same number of small dips have occurred since then.
Time will tell what happens with world production when oilprices rise. Could be that quite some countries have spare capacity. However, depletion never sleeps: a phrase that will never lose its meaning. Maybe within 3-4 years from now more countries are past peak, which could be bad news for total oil exports.
A reason to go long on NG? US consumption rate is mind-boggling. NG is now banned for new construction in some regions.
https://www.zerohedge.com/news/2019-08-15/americas-chernobyl-three-mile-island-set-finally-close-its-doors
https://blog.ucsusa.org/mark-specht/why-berkeley-banned-natural-gas-in-new-buildings
“A reason to go long on NG? US consumption rate is mind-boggling. NG is now banned for new construction in some regions.”
Should get interesting when NG prices start rising considering that Power companies have been shutting down lots of coal and nuclear plants & replacing then with NG plants. It would not surprise me to see power prices soaring to 35 to 50 cents per kwh in the US. I would imagine lots of people that use NG or Propane for heating also find it difficult to heat their homes in the winter.
My advice is to relocate someplace with moderate weather: Not too cold (heating) or not too hot (air conditioning) as energy prices rise. Either build new or retrofit your home to be extremely energy efficient. My guess is that probably 50% of US home are not going to be livable without affordable heating & cooling. During the bubble years lots of poor quality homes need cheap energy. Not sure if many of them could be retrofitted because of poor layouts & construction.
Also a good idea not to relocate near any major urban regions. I would imagine high unemployment, uncomfortable living conditions is going to make a lot of unhappy & desperate campers: ie lots of violence, riots, general despair.
Or, move to Texas. Unlimited NG and has its own energy grid.
Unless you have 25,000 gal Buried Propane tank to last you a Lifetime, I’d consider lightly populated areas of the Ozarks, IMO Need to be above 1500 feet elevation and have ancient water. I’ve been buying remote land with and without grid access for decades. If anyone wants to share strategies email me at my handle at gmail. Texas Energy much too Fragile and Centralized. Solar 2.0 will allow abundant battery-optional energy. You can light a mansion with a handful of 18650’s, so you really don’t need much in that way of eChem Storage. Note that Li Batteries are on the Sept 1st Tariff List. So if you been thinking of a BattleBorn LFP (Lithium Phosphate) Battery for your RV or UPS, now may be the best time for a while.
GuyM
“move to Texas. Unlimited NG and has its own energy grid.”
Not for me. TX is morphing into Southern California. I doubt TX has unlimited NG. I recall TX already has a few NG shortages about a decade ago when some cold snaps happened. I suspect a lot of NG is tied with Shale production. If the shale drillers go bust, NG prices will rise in TX just like everywhere else.
More recently:
“Power Blows Past $9,000 Cap in Texas as Heat Triggers Emergency”
https://www.bloomberg.com/news/articles/2019-08-13/texas-power-prices-briefly-surpass-9-000-amid-searing-heat
That’s ok. Sure we won’t miss you. Nah, only Austin is resembling SC. Rest is pretty normal.
Austin is the only place in Texas I would even consider living in and even the blues can only sustain you for so long.
Austin is at least 1/2 hour from Texas.
“It would not surprise me to see power prices soaring to 35 to 50 cents per kwh in the US.”
Over what sort of time frame? Maybe for short periods in the short term but, prices like that would result in massive surges of capacity growth for wind and solar. LCOE for solar and wind are now under 2c per kWh in some locations and I suspect at some point in the next decade they will both have an LCOE of under a cent per kWh. 35 to 50 cents? Please!
IslandBoy Wrote:
“Maybe for short periods in the short term but, prices like that would result in massive surges of capacity growth for wind and solar.”
I doubt it. Electric prices in Germany are about 35 to 40 cents per kwh, and they have a lot of solar & wind which is backed by cheap Polish Coal fired power plants. Issue with both Solar & wind is intermittent generation. Every watt produced by solar & wind in the US is backed by NG fired plants. There is no massive storage system to back Solar & wind production. The only reason why Solar & Wind works is due to the very low cost of NG prices & the fast ramp up/ramp down of NG fired turbines which can change output in just a minute or two.
US power companies are borrowing billions to replace old coal fired & nuclear plants with new NG plants. That debt isn’t going disappear even if NG prices go through the roof. The US also has an grid that is showing its age likely needing $300B to $500B in investment for updates and to replace worn out equipment and distribution lines over the next 25 years. We also have to pay a huge cost in decommission shutdown Nuclear power plants (currently shutting down between 2 & 4 Nuke plants per year).
The USA is dead broke with $23T in national debt, and about $70T in unfunded pensions & entitlements. Currently the only way the US economy can function is with ultra low interest rates so it can continue to borrow trillions to keep its doors open. Sooner or later the USA is going to run out road to kick the can, and my guess is that all comes apart in the 2020s.
The US lacks a skilled workforce for the electrical grid as there are few young workers in the industry. Most of the US power companies are in panic mode because their boomer workers are retiring & they cannot find replacements:
https://www.tdworld.com/safety-and-training/trends-report-power-companies-facing-labor-shortage-and-skills-gap
Plus NG is the #1 resource in the US for home heating and Domestic hot water. So even if somehow NG is completely eliminated (very improbable) from power generation it does nothing to solve heating needs.
I can only respond by saying I think Watcher is on to something with regards to money. US Politicians are unlikely to let a lack of money get between their voters and the voters’ energy needs. If money is what is needed, it will be borrowed or “quantitatively eased” or whatever (created out of thin air!). That applies to tight oil now and will probably apply to renewables any time they are seen as a viable substitute for FF. I follow developments in the solar PV, EV and battery space very closely. You might be surprised at some of the stuff that is coming down the pike!
Polish coal is not cheap anymore. Besides lignite, average shaft depth in Silesia (main coal region) is now 1 km (1000m!). Poland actually imports coal from Russia.
After problems with surges of German wind power, there is no direct power exchange between Poland and Germany too, the former mainly importing power from Sweden and Ukraine.
German power generation is mainly a mixture of wind, gas and lignite. They are opening new lignite places. Nuclear is on the way out there.
“The only reason why Solar & Wind works is due to the very low cost of NG prices & the fast ramp up/ramp down of NG fired turbines which can change output in just a minute or two.”
Not quite.
Wind and solar power do work in large part BECAUSE NG turbine plants can ramp up and down fast. TRUE.Fast ramping gas plants mean we don’t need to waste much fuel on so called ” hot spinning reserve” back up capacity.
BUT…….
The HIGHER NG prices and coal prices go, THE BETTER, as far as the wind and solar power industries are concerned.
And of course regardless of the prices of gas and coal, the more wind and solar power we use, the less gas and coal we have to buy to generate electricity.
Long term, that’s good for everybody except the owners of the coal and gas industries. Short term, the transition to using more wind and solar power may result in the price of electricity going up, for a while, to help pay for the new infrastructure.
If one wanted to buy a futures contract on the NYMEX for December, 2024 Henry Hub mmbtu price is $2.82.
Most expensive contract price between now and then is February, 2024 at $2.86.
(Prompt month is $2.20).
When can we expect US peak gas…? 2020? 2025? 2030?
OneofEU,
My guess is 2025 to 2030, I have not delved very deeply into US natural gas projections, I expect higher natural gas prices in the future may lead to better profits and continued drilling. In the past I have tended to underestimate, so perhaps 2030 is the better guess.
One of EU
Currently, the three state region of Pennsylvania, Ohio, and West Virginia are on track to exceed 11 Trillion cubic feet for 2019 production.
(To put 11 Tcf in context, one can scan recent years’ announcements regarding the size of ‘monster’ new finds, particularly in the eastern Mediterranean).
The US Department of Energy projects this region to continue to increase production with a ~20 Tcf annual output 30 years out … 2050.
The massive (check out USGS estimates) Mancos and Barnett plays are barely worked due, primarily, to the extraordinary abundance of both associated production as well as Appalachian Basin output.
The recent announcement of EQT’s new CEO – Toby Rice – that he is positioning his company, the largest natgas producer in the USA, to be viable at $2/mmbtu HH should be sending shock waves throughout the global energy market.
Peak US gas production is way too far out to remotely predict its timing, at this point.
Coffeeguyzz- thanks for the info.
I’m familiar with irrigation piping, but have no idea how nat gas gets from the well to the centralized processing facilities. How big are the pipes, how far do they generally run, how much flow is required to make collection and piping feasible? Seems like it would be difficult to make things work on a small scale.
Anybody have link to a site or article that explains this?, at a level that someone without industry experience would be able to digest, would be appreciated.
Hickory
Those are all great questions that I do not have ready answers to.
My understanding is that the gathering lines can run anywhere from the 4 inch all the way up to 16/20 inch size the closer they get to the processing plants. (Something like a couple dozen processing/fractionating plants on either side of, and within, the northern West Virginia panhandle).
Small independent companies along with the upstream operators are engaged in this activity.
The Appalachian Basin is an extremely difficult environment to emplace gathering lines for several reasons.
Some factors – not all – include the absence of pre set Drilling Units like most western states have.
Rugged, hilly, forested terrain.
Extreme pressure differential from Utica (5 to 8 thousand + psi) to the 2 1/2 – 4 thousand psi in the Marcellus.
(Upper Devonians are even lower).
Huge variance in “wetness” of the gas plays a role in where gas goes.
Some of the pads coming online have absolutely crazy high production numbers of well over 100 MMcfd for several months which plays a big role in the size/pressure specs of the gathering system.
It’s not sending shockwaves through the global energy market because it isn’t true.
EQT share price hasn’t been this low since 2003.
This smacks of EOG’s claim of being able to achieve attractive returns at $30 WTI, which also was not true.
When you are desperate you will say about anything.
These shale stocks won’t recover without higher oil and gas prices. 2017 hype is long gone.
I sold the two shale stocks I owned. I am strongly considering getting out of COP and XOM too. In particular XOM, which seems hell bent on losing money in the Permian Basin.
Just look at the 10Q. Terrible results.
Upstream has absolutely stunk up the place while the averages have risen to all time highs. I cannot think of a poorer managed industry than US shale. It’s embarrassing.
Shallow
If you followed the operational particulars of what Toby Rice is setting out to achieve, you might pause in your evaluation.
As I have said umpteen times over the years, a BIG problem in the upstream industry is the sheer quantity of product coming to market.
This is the main reason why, the very day AFTER EQT announced the stupendous 72 MM cf 24 Hr IP of its legendary Scotts Run, EQT’s stock DROPPED over 7%.
The awareness that, underlying the Mighty Marcellus, lurked a Big Brother of even more prodigious potential … a combined resource so vast that natgas would be available for generations to come … naturally diminished its value as a ‘scarce resource’.
If EQT cannot operate profitably at $2/mmbtu HH (a goal I think unattainable, BTW), then $2.20/$2.50 should still send shudders throughout the industry as I most definitely believe it can and will be done.
How?
As per Rice’s somewhat contrarian approach …
Hold lateral lengths to the 10k/12k range.
This faster drilling, shorter length will unleash the “cookie cutter” approach that Harold Hamm so successfully implemented in the early Bakken years.
Increase well spacing to the 1,000 horizontal range.
Superficial observers will quickly suspect lost interwell recovery. In actuality, while employing the latest targeting/completion techniques (especially Extreme Limited Entry), MORE hydrocarbon recovery will be had using FEWER wells.
Biggest tactic will be the successful implementation of massive, choreographed drilling/fracturing of thousands of wells located relatively close by … which was the primary reason the Rice’s sold to EQT in the first place.
At <$800/1,000 foot drill/completion cost, a 12,000 foot lateral will cost under $10 million.
At 20 Billion cubic feet EUR , @$2/mmbtu, $40 million gross revenue will be generated … a significant amount in the first 3 years.
The ripple effect of inexpensive hydrocarbons in gaseous form is still in the early stages of global impact.
When tiny Benin and New Caledonia are setting up electricity generation using LNG available via FSRUs, when the massive
Sergipe project in Brazil (the first of 3 Brazilian plants) is coming online, when BHGE is committed to providing 60 mtpa in modular LNG hardware (within shouting distance of Qatar's current production), it should be apparent that a huge shift is underway in the global energy world.
Coffee. It’s all talk and we all know that until gas prices rise, these companies aren’t worth investing in.
I don’t know what your motives are, but it seems that every company you tout in this space winds up broke.
I recall you making a big deal about a well called Purple Hayes drilled by Eclipse a couple years ago and how the technique would revolutionize the industry.
Care to let us know what happened to Eclipse?
I can’t think of an industry that has performed worse financially in my lifetime than US shale.
I defy you to go over every single post I’ve made on this site over several years and identify a single one where I have “touted” a single company.
Ever.
Conversely, should you care to check, you would find how I’ve always stressed my keen interest in the operational aspects of this industry … most especially cutting edge efforts.
The Purple Hayes well?
The one with the then-world-record of ~20,000 foot lateral, drilled in one trip in (IIRC) 13 days?
It had only been Ohio’s best oil producing oil well for several quarters running last I checked.
It has since been exceeded by a few others (Outlaw and Crawford).
Speaking of the now defunct Eclipse, their Painter 2H well in Tioga county is absolutely tearing up at almost 6 Bcf in less than 9 months online … targeting the Utica, no less.
Eclipse is gone … bye bye … folded into a new privately owned outfit called Montage which itself is the latest iteration of the long gone Magnum Hunter.
You are in the business end of hydrocarbon production, severely impacted by both the glut in supply and low price.
If you want some supporting “Those SOB shale guys” tripe you’ll not get it from me.
Continued, high US hydrocarbon production is Gar. Own. Teed. for several decades to come.
Natgas … a century’s worth.
Whether people wish for it or not … that’s the way it is.
coffeeguyzzzzzzz sezzzz:
Didn’t realize that Ohio was the new Bakken LOL
How can the fact that the shale companies are financial failures not be relevant?
I hope you aren’t one of these far left socialists that have recently come on the scene in the US.
I doubt you are, but yet, you do seem to be very capable of completely ignoring the financial aspects of the shale business.
Also, I do think the company that Eclipse merged into is a public company, with a stock price after a reverse stock split of under $3.
A $10,000 investment in Eclipse IPO is worth $77 today, just 5 years later.
How can that not be relevant to the discussion on this board??
The only way for producing companies to make profit in a commodity sector that is ‘oversupplied’ [as reflected in low price], be it potatoes, nat gas, or crude oil, is to restrict the supply so that price rises to a level where an efficient, low cost producer can be in the black financially.
In this economic scenario, you can buck the market forces in several ways- unsustainably low interest rates or other direct subsidies to the producers, artificial price support, or some sort of tariff/rebate/ tax scheme targeted to the industry.
Short of those kind of government interventionist measures, it is the business failure of the producers that will reduce the supply until the product is able to garner a higher price in the market.
The only other pathway to higher prices is depletion of the product, which it seems many in the oil producing business are hoping for.
Understandable.
But coffeguyzz point about abundant nat gas is clear. And the ramifications are huge, especially for coal producers. Nat gas has taken coal to the woodshed and the battle is over, just a matter of time til its all played out. First round knockout.
But also a big effect for wind and solar industry. These domestic generators would be booming much faster if not for the low nat gas prices. Very stiff competition for power purchase agreement prices.
Its become a very tough sector for everyone selling energy.
For the moment, its a buyers market.
All from fracturing.
Coffeeguyzz,
EIA estimates for both tight oil and shale gas tend to be too optimistic especially after 2030. Associated gas output will fall as LTO reaches peak in 2022-2025 (depending upon oil and natural gas prices.) Perhaps higher natural gas prices might delay the natural gas peak to 2035, I have not looked closely at USGS estimates for shale gas lately. The estimates from investor presentations are often very optimistic and the EIA seems to base their analysis on these types of estimates, leading to poor estimates.
Coffeeguyzz,
He asked about conventional natural gas.
Dennis
I do not too closely track conventional gas, but I try to keep an eye out for what is considered noteworthy developments.
To that end, the ~180 Trillion cubic foot resource off Mozambique along with the ongoing eastern Mediterranean and Siberian discoveries may offer some interesting perspectives.
Mozambique will host one of the anticipated 4 new FLNG structures planned in the coming years. (There are currently 4 FLNGs operating globally).
While the targeted resource sizes for some of these floaters may not be especially large, it is significant that new, proven technology and hardware has expanded viable hydrocarbon recovery into areas heretofore deemed not feasible.
The numbers out of Russia/Mediterranean are particularly relevant, perhaps, to both your reference to conventionals and my initial comments about Toby Rice’s ambitious goals of operating at extraordinarily low gas prices.
Specifically, 17 Tcf recoverable just touted off Yamal, the 50 Tcf range for Zohr and Leviathan is only a few years’ output from the Appalachian Basin (current annual production ~11 Tcf and rising).
Multi decade output of cheap, unconventional gas will strongly affect global energy markets.
Nowhere is this impact more apt to arise than in other shale plays around the world.
China, Mexico, Argentina, the UK, Australia, Russia contain HUGE amounts of gas in shale with topside factors (political, logistical, economic, ideological), being the main brakes for more robust development.
The arcane fact that Argentina is now slated to get 2 so called Super spec rigs is one example of this.
These rigs will now reduce the cost per well in the Dead Cow, although many, many other constraints remain.
As the pace setting US unconventional industry steams ahead with ongoing improvements, global players will benefit from the ever improving operating templates as EQT is poised to show.
Somewhat related to this abundant, cheap fuel – natgas – is the evolving hardware relating to LNG.
If people do not learn of the mid scale, small scale, even micro scale LNG universe of events, they will be stunned at what is to be 5 years out.
Right this very moment, there is Argentinian hardware liquefying NEPA natgas and having it trucked to a Rhode Island utility.
New world rapidly dawning.
Coffeeguyzz,
Two problems for natural gas. At low prices (as in US today), nobody makes money and the losses will not continue forever because investors don’t really like losing money. At high natural gas prices where producers make a decent return on investment, solar and wind are cheaper and demand for natural gas will not be robust.
In addition there is a lot of associated gas from tight oil production and that is likely to wane as producers are forced by geology to move to tier 2 and higher leases where again lack of profits will shut down most producers.
Perhaps natural gas doesn’t peak until 2040, but it may suffer the same problem that coal has before long as cheaper wind and solar reduce demand for natural gas.
Grace 1
https://www.marinetraffic.com/fi/ais/home/shipid:416354/zoom:14
moving
Goes very slowly. Maybe undecided.
Tries to stay in international waters. Could be boarded near Lampedusa (ironically, since it does not want to stay there unlike many others) by Italians. Narrow pass there.
Lebanon, Turkey, could be destinations.
Lebanon does not have much to lose from US sanctions.
Entering Sicilian Strait. An Empty area around the ship. No escort.
https://www.zerohedge.com/news/2019-08-16/report-bankruptcy-filings-rise-among-us-energy-producers
“Natural Gas Intelligence believes a bankruptcy wave for the upstream sector could be nearing. This is because operators across the country have been scaling back since oil crashed -44% in 4Q18. Producers have been faced with margin compression, high debt loads, and oversupplied markets so far this year.
Haynes and Boone recorded 192 E&P bankruptcies since 2015 totaling $106.8 billion in debt and recorded 185 OFS bankruptcies involving $65 billion of debt over the same time.
And with SocGen’s Albert Edwards warning about a deflationary bust, it seems that the inflation downturn could force commodity prices much lower, could kick off the tidal wave of energy bankruptcies during the 2020 election year.”
[Seems likely the Shale Revolution is about to come to an abrupt end].
“[Seems likely the Shale Revolution is about to come to an abrupt end].”
OPEC: Yes we can
All it needs is a batch of new investors buying the companies after filing.
With new money then there is a new round – until this money is consumed again.
A blurb of note. India’s oil imports have not grown at the same rate they did last year.
There are all sorts of explanations floating around, and none of them seem to point at a lowered desire to consume.
The first seems to be some disruption among refiners as replacement for Iranian oil proved to be a scramble. Refineries cannot accept just any oil. It would need to be oil closely approximating Iran’s oil. And so, an explanation.
Another explanation notes that import of coal also has been weak, and so fingers are pointed at weak GDP growth.
Lastly, there is contradictory talk about India’s fields surprising to the upside. Obviously if you get domestic production, you don’t have to import.
Watcher , India is FUBAR . Some interesting facts . 500000 cars in factory inventories , 375000 two wheeler’s lying at the factories . No buyers .218 car dealerships closed . 350000 workers fired . Almost all showrooms have fired the sales staff . There is no traffic . Next in line are the mechanics and tech staff . Tata trucks that were priced at about $ 50000 a piece are NOT selling at $39ooo . There is no trust between traders in all field because of a liquidity crisis bought about by demonetisation in late 2016 . The govt has used all the pool of domestic savings and now pondering on overseas borrowing. The present administration touched 52 % of the budgeted deficit in the first 4 mths (Apr -Jul) . How will they meet the expenditure for the next 8 mths only heaven knows . No there is no increase in output due to ^ reserve growth^ . The fields are old and tired . Iranian oil was a disruption and was taken care off since they had advance notice . The India growth story is over so to expect an increase unwarranted . The situation is not bad , it is a disaster which is on the road to a catastrophe coupled with climate change . The trio of India, Bangladesh , Sri Lanka are second on the list for problems relating to climate change after Australia .
By the way in India the financial year is April –March . This was designed keeping in view the monsoon season on which Indian agriculture is 70% dependent .
I suppose this means oil consumption growth will be 4% rather than 5.9%.
Watcher ,the answer is I don’t know . There is so much of wastage . A month or so ago the city of Chennai ran out of drinking water. That means zero,nada ,null ,nulla . The water suppliers were trucking water from deep groundwater wells as far as 150 Km away from Chennai . A round trip of 300 Km . At peak summer 32000 vehicles which includes trucks, light trucks ,tuck tuck ,two wheeler etc were running around the clock to fill in the demand . They have now started a ^water express^ which brings 10 million litres of water per day from a reservoir 350-400 km away . Of course it runs on diesel . So 10 million litres per day for a city with a population of 9 million . That is 1.1 lit per person per day . Holy lord , I waste that while I shave .
150 km water pipeline should be not such a great problem to build?!
Trucking it all is horrible inefficiency. Maybe even moving population would be more efficient.
But if situation is so dire, India has nothing to lose by buying Iranian oil.
It is only a matter of time when someone will realize that he has more to lose than to gain by refusing to buy Iranian oil.
Amigo ,it is evident you are ignorant about India . The issue is not technical but legal ,political and financial . I could write a thesis on this ,but that would be a waste of cyberspace . Just to inform you that a super fast train between Mumbai and Ahmadabad with Japanese know how and virtually 0% interest loan funding was inaugurated in 2014 . The project is stalled because the railways cannot acquire the land for the rail lines . Things are very complicated .
As to moving 10 million people idea , what brand of pot are you smoking ? That is the total population of Belgium . Chennai is a city more than 200 years old . Where do you replicate all that was an incremental increase in infrastructure over the 200 years . A terrible idea . Can you build a new Rome or London or Amsterdam which are as old as Chennai ?
As to Iranian oil , it was a small disruption but taken care off since there was a six month advance warning on the sanctions . India cannot afford to be on the wrong side of USA . It’s credit rating is one notch above junk . It will take a call from the treasury or White House to the rating agencies to push it junk . Don’t believe this can happen ,then see what happened to Turkey because they purchased the missile system from Russia .
I am an European in Europe, have never visited India, so may be a bit ignorant about Dekkan, yes. What problems I heard of India had, looked like typical problems of a loose federal country.
Didn’t know Chennai is 10 milion people. However, my ignorance pales in the comparision to the ignorance of the goverment of that city, who certainly knows the number. And did nothing. In a normal country it would be a case for riots. Indians must be very docile.
India has a pro-Soviet past (it was Pakistan that was always pro-US), so it could join Russia now. Started to buy Russian oil already. But Russia is far away, and Iran is close.
India is a direct competitor of China, the relations have never been really good, so it is interest of China to weaken India, unfortunately for Indians.
If US wants to weaken China, it may want to prop up India.
The Indian advantege is a relatively positive picture in the West: a land of colourful spirituality housing China-persecuted Tibetans. Nothing of threatening efficiency of the Chinese ant-like society.
Kashmir.
You have a point, but Pakistan is more disliked than India.
China has a stake in Kashmir too, so maybe the recent Indian action is indirectly directed at China.
https://thediplomat.com/2019/08/what-the-bifurcation-of-jammu-kashmir-tells-us-about-indias-china-strategy/
Maybe a crucial statement of the article:
‘By displaying the political will to change existing paradigms, could there be more hawkish engagement with China as well?’
I can understand that you are not fully informed about the conditions on the ground . Yes, Indians are very docile and too god fearing . It is their belief that everything is predestined that is keeping the riots away . As to being China’s competitor ,it is no match .The US tried to prop it as a counterweight to China but failed . India’s economy is $ 2.7 trillion,China is $ 15.5 trillion . China’s armed forces are twice as large as India . The US has now given up and only pays lip service . As to Kashmir ,the move was done to win upcoming elections in some states . The new buzzword is ^nationalism^ . Kashmir is the new Palestine ,Kurdistan . The only difference is that where in Palestine all of the middle east was subdued by US thru military or financial bribes here Pakistan and China are not going to be subdued . Trump is on the verge of moving out of Afghanistan . The Taliban and the Jihadi’s will move to Kashmir . This sore will bleed New Delhi . This at a time when the economy is on the verge of collapse . As to India’s advantage as a peace loving, spiritual country in the West ,well that is not important in geopolitics . What is important is whether you are a financial power or a military power . Unfortunately India is neither .
OPEC prediction
https://www.bloomberg.com/news/articles/2019-07-11/opec-sees-new-oil-surplus-in-2020-as-u-s-shale-keeps-surging
I guess you have to decide who knows more about what oil production will be next year.
Hundreds of researchers and geologists who have access to the best data and expensive research sites.. or Ron who claimed peak oil in 2015 and every year since.
https://oilprice.com/Energy/Crude-Oil/2015-Could-Be-The-Year-Of-Peak-Oil.html
Has Ron’s knowledge or pattern of thinking changed?
I would say not. It is not reasonable to think that all good production news is false or hyped up. It is not reasonable to think that everything that can go wrong will.
nor is it reasonable to think everything will go right.
That is why, when you look at every country and exploration potentials, it is reasonable to take a middle ground.
If every country suddenly had no corruption, there was peace in Libya, Nigeria, Sudan. Free democratic governments in Iran, Iraq, Venezuela, Russia etc. Then oil production could increase up to 2035.
However this is as unreasonable as those who claimed peak in 2008 of 2015. Neither of which proved correct.
Taking into account political factors in every country, which is very difficult. A peak in oil production between 2022 and 2026 is reasonable.
Hugo, let’s hear your prediction. When is Peak Oil going to happen?
Frugal
I just wrote 2022 to 2026
Hugo,
You’re dreaming and guessing. Build your own model and make your own predictions. Also, state your assumptions.
I’m not sure that you have the mathematical skills to build your own model. However, you do have skills to criticize others, including Ron who tirelessly volunteers his time to inform others about the world’s energy situation. Ron also provides a forum for open communication including your critical useless statements.
Tony
Tony
What mathematical model do you suggest to determine if sanctions continue against Iran in 2022 or 2023?
What mathematical formula can you suggest as to how stable Iraq will be over the next 10 years.
What mathematical calculation could have predicted Muammar Gaddafi being overthrown. and if Libya is stable enough to achieve this?
https://oilprice.com/Energy/Crude-Oil/Libyas-60-Billion-Push-To-Double-Oil-Production.html
Once you have answered these questions, answer another.
https://oilprice.com/Energy/Crude-Oil/2015-Could-Be-The-Year-Of-Peak-Oil.html#
What information did Ron Provide here that was informative?
Hugo, you are a bullshit artist. Hundreds of researchers and geologists disagree just as much as the folks on this blog. Have you read Robert Rapier’s predictions lately? To my knowledge he has made no world peak predictions but he has published several articles stating that US shale production is toast. And I have not predicted peak oil every year.
If every country suddenly had no corruption, there was peace in Libya, Nigeria, Sudan. Free democratic governments in Iran, Iraq, Venezuela, Russia etc. Then oil production could increase up to 2035.
My dad used to say: “If every man was honest, wouldn’t it be a wonderful world.” But “if” is not an option. The world is what it is and we must live in the world as is, not postulate “if” at every bad turn of events.
So if you have a prediction, not an “if”, then make your prediction, or quote your favorite predictor. Else shut the fuck up.
What can you do to predict the future?
You only can do models – and here it’s super complicated.
Not only oil price, technic, available capital – but also politics.
And politics plays the main role – Trump just executing 2mbd in Iran. Perhaps Democrats enabling them again and paying Iran compensations to boost further production. Not predictable.
Ron
You said Quote
“I am betting that when the June data finally comes in that it will show crude oil production in the US has seriously declined since December 2014. ”
“I am now more convinced than ever that 2015 will see the peak in world crude oil production. I have very closely studied the charts of every producing nation and my prognosis is based on that study.”
“I see many nations in steep decline and most every other nation peaking now, or in the last couple of years, or very near their peak today. These include the world’s three largest producers, Russia, Saudi Arabia and the USA.”
Ron all of these statements were wrong in 2015 and wrong today. United States is production 3 million barrels per day more and is not near peak and prices have been crushed by over production.
https://www.iea.org/newsroom/news/2019/january/could-tight-oil-go-global.html
Russia is producing a million barrels per day more and has large potential and if Europe needed the oil enough they will break sanctions to help Russia get that oil.
https://www.chathamhouse.org/expert/comment/russia-s-untapped-arctic-potential#
Saudi Arabia is not near peak and are increasing potential by 1 million barrels per day.
Saudi Arabia have produced what they said they would despite all the naysayers.
Hugo, say what you wish about Saudi or Russia, or any country and their oil production, just leave my name out of it. I will not continue to put up with this constant harassment from you.
Ron
Are you seriously saying people are not allowed to provide evidence which shows you have been wrong in the past and why they feel you are wrong now.
Hugo, Hugo (sigh)! I disagree sometimes with many, Ron and Dennis can attest to that. However, I do try to do it in a respectful way. Almost all posters on this board deserve that. If you think your comments were respectful, then what can I say?
I remember the time that he posted that. Prior to the Permian. He did not call it peak. He raised the question that many of us were thinking at the time. And, Peak may not be yet, but the assumptions are not out of bounds either in Ron’s or Dennis guesses. Either guess has its bias. Dennis in math, and Ron’s is it’s gotta happen sometime soon. I’m biased close to Ron’s. But bias usually does not have close accuracy. So, who knows, but if you can’t keep a level discussion, then no one wins.
Hugo I find your comments useful and insightful and are not disrespectful at all. Peak has been called too often, especially by Ron. You and Dennis have a good chance of being right that peak is still maybe five years out. But also like you said there are many things we can’t know or predict, especially political ones. Many people like the Saudis and shale oil folks have an incentive to lie and obfuscate. I think there’s a good chance there’s a black swan out there that will bring peak forward but it is likely to be economic or politically in nature.
I’ve been reading this for many years, and I have not seen Ron call it once during these years since recently. On the cusp a couple of times, but he argued with me when I first called it for 2018. He and I may still be wrong, but yours is not an argument, it is an attack. You give the impression that he is flakey, and that is far from my impression. Guy hosts an open forum, and you guys roast him, while he pays for your rights to speech. There was nothing respectful in the attack. And, attack is the only way you could consider it. The guy has more oil experience than anyone currently posting. Yuk!
Stephen,
People don’t like to be called on it when they have been incorrect, a better approach might be to have a link to the post and simply quote the post.
There is not much that has been written in the past about future oil output that has been correct years later. Oil output will peak, nobody knows when, I guess 2025, but scenarios can be created with peaks from 2018 to 2040 with the average of 27 scenarios with a plateau from 2021 to 2026, see chart below from earlier Oil Shock Scenarios post.
In the grand scheme the exact date of the peak will matter little with the difference between a 2018 and 2025 peak not amounting to much, especially if there is a plateau in output from 2018 to 2025 (possible, but I expect output will increase to 84 to 86 Mb/d by 2023 to 2026). I have been wrong many times in the past, perhaps on more occasions than others, this is likely to continue in the future.
No disrespect intended. Hey look I did the same thing, telling half the world peak oil was in 2005, 2008 for sure, 2015, etc. I’ve been reading on this subject for two decades now. Ron has thought peak oil was imminent back on the oil drum and here several times, just look at Hugo’s quote above. But who cares? I was wrong, he was wrong, many of us have been wrong, so what? Ron correct me if I’m wrong but I don’t think your skin is so thin that youre losing any sleep over it. But let’s not go and browbeat people who are trying to make intelligent remarks about the subject. There can be a lot of doom mongering about this subject, and some folks are certain they know exactly how things will play out when in fact there’s really no way to know. The truth is we will be lucky to say with any certainty that peak oil has happened even three years after it has.
Hugo,
The only production preventing Oil from peaking as far back as 2013-2014 was US Shale, which can only function by borrowing Billions from gullible investors that will never be paid back. If investors were not so gullible, US production would have peaked years ago. Global Peak Oil is controlled by cheap & easy credit. Take away the credit punch bowl and US Shale production collapses, and global production peaks. PO is no longer dependent of geology, but credit.
FWIW: I suspect Shale drillers are going to have a hard time finding more investors willing to part with their capital, especially when Oil prices are very low. That said its possible that the Federal gov’t (via Fed) will step in and start buying billions of shale debt (via QE or some other financial bailout mechanism) so Shale drilling can continue on. It appears that the US is running into liquidity problems again as Bond markets are showing signs that they are freezing up again.
Banks and investors took away the punch bowl, and second quarter losses reflect that. Third is going to be the same, and too late for any price increases to reflect anything but losses for this year. No positives going into 2020. Their best option is to find adoption. And being a bunch of spoiled brats, that’s going to be somewhat difficult.
Tech
I agree that shale has been the biggest contributor to increase in global oil supply. However it has also distorted the entire industry.
If the shale companies had to make a profit each year, global supply would have been a less and prices much higher.
This in turn would have supported e&p investment around the world. The fall in investment has been due entirely to shale companies that have been allowed to run at a loss for so many years.
https://www.iea.org/oil2018/
A fall from $800 billion to $400 billion will have a detrimental knock on effect in the mid 2020s
https://www.iea.org/newsroom/news/2018/november/crunching-the-numbers-are-we-heading-for-an-oil-supply-shock.html
I don’t think we would see a massive rebound in E&P if US shale was eliminated. Shell, Exxon, BP and other started pulling back on Megaprojects back in 2012-2013, since it was doubtful that it would be economical. Basically megaprojects (deepwater & arctic) required $120 to $150 (in 2013 dollars) per bbl to be economically. I don’t believe those prices would be sustainable as it would result in demand destruction as consumers would cut back on consumption. The fact that Oil majors were looking at Arctic and deepwater back in 2010-2013 indicates they are reaching the bottom of the barrel for production. There was a long term trend of declining exploration finds even when exploration budgets increased.
At this point any major rebound isn’t going to make a difference, if a Oil major started on a new megaproject it would be between 5 and 7 years before new oil reaches the market, and very unlikely to offset declines from existing production (5% to 7% annual declines). We are already behind the curve on gains from any new projects to offset ongoing declines with out shale growth). Perhaps a some of the declines in existing fields could be offset some with higher oil prices. Still reaching to scrap the bottom by trying to extract trapped oil in fields in terminal decline. With all of the supergiants in terminal decline (with the exception of Kazakhstan), its going to be very difficult to expand production further.
Personally I am guessing that global production has already peaked or within the next 18 months if we are lucky). Its difficult to pinpoint an exact period since their are way to many variables to gage effectively. That said I cannot say my record for guessing peak production is any better than winning a lottery, but as the window narrows due to depletion and a shrinking supply of future projects the guessing gets a lot easier.
Tech
Did the majors start cutting back because having knowledge of the geology of the shale plays they realised their potential?
https://www.eia.gov/todayinenergy/detail.php?id=38372
Shale had already taken off by then and predictions of possible productions were being made and importantly have come true.
The majors would have realised there would be too much oil in the short to medium term, so they sensibly postponed more expensive drilling.
How this mess with heavy indebted shale companies and years of under investment plays out I am not sure.
Probably a lower and sooner peak oil than would otherwise have been.
Hugo,
Not sure anyone has said US has peaked, the point is that US tight oil growth will slow and it is not apparent that any other nations are increasing output in 2019, so far the drop by OPEC/NOPEC has been greater than any US increase in 2019 and it is looking like 2019 output will be lower than 2018 if current trends continue. When we get to the point that oil prices rise to $80/b, I expect OPEC/NOPEC will increase output, but we do not know when that will be and it is certainly possible that US output might be falling at a faster rate than the rest of the World’s rise in output so the net might be a plateau or decline.
Note also that my “medium URR” estimates might be too optimistic, if my “low URR scenarios” prove correct, the peak is likely to be earlier (2022/2023), and if there is a fast transition to EVs, more public transport, etc perhaps the peak in World C+C output could be earlier still. I doubt this will be the case, but in the past I doubted that World C+C output would exceed 80 Mb/d, I was wrong then and I may be wrong now.
Hugo,
If you look at predictions by EIA and IEA from the past they have mostly overestimated C+C output.
Though most of these predictions are for “all liquids” and they usually do not break out crude plus condensate, so they are difficult to assess as far as C+C output.
I have tended to underestimate output, especially when I started posting in 2012 see
https://oilpeakclimate.blogspot.com/2012/07/an-early-scenario-for-world-crude-oil.html
https://oilpeakclimate.blogspot.com/2012/07/further-modeling-for-world-crude-plus.html
https://oilpeakclimate.blogspot.com/2012/08/i-noticed-that-compared-to-model-by.html
Note that the BP Outlook from 2012 predicted about 78 Mb/d of C+C output in 2020, about 4 Mb/d lower than 2018 output, in 2030 BP expected 81 Mb/d.
Not many expected the surge in tight oil output that we have seen from 2012 to 2018, I certainly did not expect it in 2012.
My early tendency was to be too pessimistic about future C+C output (back in 2012).
It is certainly possible that my attempt to adjust for this early tendency may have led me to become overly optimistic about future C+C output.
For that reason an earlier comment suggesting reality may fall between Ron’s assessment of a 2018 peak and my assessment of a 2025 peak might be correct. This would suggest that the low end of my “realistic” estimate of 2023 to 2027 for World peak might be a better guess. If we take the average of Ron’s estimate and my own it points to 2021/2022 as the peak. My recent “peak oil scenarios” post suggested roughly a 2023 peak for the medium average of averages, but there is a great deal of uncertainty. Link to that post is below.
http://peakoilbarrel.com/oil-shock-model-scenarios-2/
Hugo, something peaked in 2011, so I’d say the peak oil gang is onto something worth listening to. Perhaps you disagree. The graph is a bit dated, but you get the point I’m sure.
I’d say calling peak oil to be in 2018/2019, vs to be within 2022 to 2026 time frame, is pretty much splitting hairs. Perhaps you’re just smarter than everyone else here and don’t tolerate such loose parameters?
How did you come to your prediction, riding on Dennis’ coattails, or do you have any original ideas of your own to contribute?
Survivalist
I did it by reading up on what experts said on individual countries.
Take for example Iraq, opinions vary on what are the reserves but more importantly on things like civil war, political policies, how contracts are drawn up.
https://www.rigzone.com/news/wire/no_oil_majors_win_contracts_in_iraq_exploration_development_auction-26-apr-2018-154404-article/
It does not matter how much oil is in the ground if the oil fields are covered in mines or the contracts are so bad that no one wants to get it out of the ground.
A judgment has to be made on what will happen politically.
Look at Libya’s oil production.
https://www.ceicdata.com/en/indicator/libya/crude-oil-production
What is in the ground is only the start, trying to work out if a country will be fit to produce any of it, is everything.
What Russia will produce is more to do with tax policy and cronyism than what is in the ground.
https://bellona.org/news/arctic/2019-04-for-all-of-russias-talk-about-oil-drilling-in-the-arctic-most-arctic-oil-will-likely-go-untouched
More complex than the area under a graph
So its just guesswork about the policies, wars and such, Hugo.
Understood.
This is one reason I am skeptical that bombs would be used to take over a country for its oil. If you destroy the very asset you want to acquire, it doesn’t do you any good.
There are other ways to take over countries than to bomb them into submission. Smart countries are figuring this out.
The assumptions make all the difference. And no one can accurately predict what will happen the rest of the day, much less tomorrow.
The key to the future, so far, is how the majority of independents will fare. Dennis sees prices improving so that many of them heal up, and production is restored to a norm. Ron sees them as totally messed up, which is more my take.
And I am also betting on the majors. They don’t lay out hundreds of billions of dollars for downstream without a big plan in mind. And, that plan could not call for those investments to be totally useless in ten years. It wouldn’t surprise me to see the skies over the shale areas filled with golden parachutes.
Ten years, or less, based on EOGs quarterly tell sheet. Do you opt for the golden parachute soon, or use your own just before the plane crashes?
GuyM,
Actually I do see a lot of independents failing in the future, but believe the best assets will be bought by the better performing independents and the majors, as prices improve there will (after a 6 month lag) be an increase in completion activity.
I also agree that nobody knows if this will occur and certainly not when it will occur (if it does). Only guesses can be made about the next seconds, minutes, hours, days, …. in short, the future is not known.
Yeah, we are on the same page. Que sera, sera. If the buyers are the majors, we probably will be seeing slowing output. If it’s another independent (which would completely surprise me) it will be business as usual.
What gets me, is that no one is looking at the longevity of this event. If I’m the independent, I see 7 to 8 years of banging my head against the wall. Then it’s done, over, kaput. Or, I could sell out to the major, who obviously has a longer lifespan. Is there really a choice? The only ones that have one, are Oxy and EOG, and they are far from stupid. In contrast to some of the others, who are so stupid, they are not considered normal.
Interesting. I would think the better run independents may be closer to the majors in how they would develop things. Isn’t there a significant difference between EOG and some of the more poorly run independents? I would think part of this would be developing reserves in a more sustainable manner using mostly cash flow rather than mostly debt, but I have not dug into the financials that deeply to guess at why some independents are doing much better financially than others.
Your beginning to get the point, but not quite. Lets say EOG continues on its, now, successful course. When it gets to the end, everyone who owns stock loses. There is still administrative bullshit, unexpired depreciation, plugging costs, yadda, yadda, yadda, which represents expense. There will not be enough income to take care of this. Shareholders, and executives will suffer. The plane has crashed. Better option, is to jump out with the golden parachute long before it crashes.
The majors know this. And, they will operate it at a level that will fit their needs, which does not include exporting most of it. Making the tail a lot longer. Eventually, it will catch up, anyway, but the majors may be able to hide it with EV charging station charges.
There may be some exceptions, Pioneer may be one. It’s kinda tough firing 25% of your workforce, and expecting any loyalty, but it could happen. Then, they would be in the same position as EOG. Actually, everyone would get a sigh of relief from a major buying them out. Get my drift?
You are an employee, or an investor in a sick company. Would you be happier with Chevron, or Exxon buying you, or live in purgatory?
We won’t see much of this happening until the fourth quarters are filed. Then it will be a landslide.
I will venture one wild eyed guess. Most of the above is pretty much beyond question. Was there an effort to keep prices at a stupid level? The wild eyed guess is the majors.
GuyM,
Enno Peters has North Dakota Bakken/TF completions in June 2019 at 135 up from 110 in May and 104 in April. So a little life left in the Bakken during summer weather. For some reason this data comes through a bit quicker in North Dakota than in Texas, maybe because they have a lot less oil and gas wells to keep track of (maybe one tenth or less than the total in Texas).
Probably. Yeah, I don’t expect a downturn. Just flat for most of 2019. Ok, a little up, but, to me, that’s flat.
GuyM,
We are getting closer. You sometimes say we may see “slowing output” for tight oil, this sometimes gets misinterpreted (at least by me). I think you may mean the rate of growth in output will be slower, but “slowing output” can be understood as a fall in output (at least in my brain.)
I often say stuff that is interpreted differently than I intend, perhaps you sometimes do the same.
Yes, I should stick with the term slowing growth.
Reuters on Texas Oil Completions first 7 month, “Texas well completions drop 12% through July”
https://uk.mobile.reuters.com/article/amp/idUKL2N25C0VI?
More importantly, permits have dropped about 15%.
Not sure permits in current month tell us much about current completion rate, though it may tell us something about the future, we would have to look at past permit numbers and output to get a feel for that.
Yes, I posted from January above.
The latest oil production data from Trading Economics
Ron,
Probably better to look at the same months for all countries as we have at EIA through April 2019.
Ron puts it dead in the ten ring sometimes.
“My dad used to say: “If every man was honest, wouldn’t it be a wonderful world.” But “if” is not an option. The world is what it is and we must live in the world as is, not postulate “if” at every bad turn of events.”
Personally I think it’s reasonable to assume that corruption is more or less a steady factor, more a constant than a variable, except when once in a while we have a Saddam Hussein or what’s his name like the one in Venezuela who upsets the apple cart.
Wars get started sometimes for the most trivial of reasons.
I’m guessing the risk for a hot little war involving oil to the point that it will result in reduced supplies and a sharp price spike is not less than five percent and maybe as high as ten of fifteen percent annually.
I’m interesting in hearing other folks opinion as to the annual odds of such a war breaking out.
Near term oil price hinges a lot on how dovish the FED is at the Jackson Hole meeting this week. If they don’t get dovish and give the market what it wants. Equites are going to crash and so is price of oil. Treasury yields are also going to fall closer to zero if they don’t get dovish immediately. It’s not clear that them getting dovish immediately is going to happen.
With all the up and coming debt issuance. FED might just be forcing treasury yields lower (by not acting) at the expense of equities and the price of oil. All they really have to do is restart QE and oil price goes back up and treasury yields fall anyway and equities also go up. So if getting dovish and more QE is a win for US treasuries, a win for shale oil and gas and a win for equity markets. Why wouldn’t they just do it?
People need to stop pretending that we live in the same world we did before 2008-2009. There is no road back . There can’t be any normalization on interest rates and monetary policy. Matter of fact they will have to go lower with the interest rates and larger with the QE than they did in previous cycles in order to keep the illusion going.
They must restart QE.
When they don’t they’ll crash oil and stocks. Plus credit. And this will lead to fuel lines.
It’s not like in the last oil price crash when at 30$ there was still plenty of credit for shale companies so they could continue pumping – at 20$ oil they’ll be forced to shut down even older wells when they can’t pay their bills maintaining them. Fresh credit will dry completly up.
Only the mayors can continue drilling unprofitable wells then.
And this will lead to fuel lines. And yellow vests.
But this won’t happen because there will be fresh money. I don’t think the USA will shoot in it’s own foot and don’t print money when all others are printing. The EU is already warming up the printing machines, the chinese ones are already rotating.
“Fresh credit will dry completely up.”
Hotel California? Has this ever happened in History?
There was a Book called Bankruptcy 1984 that made the case the US will not be able to meet it’s obligations around 1984. Perhaps did not account for the Petro-Dollar. Then Greenspan came to the Rescue and dropped Interest Rates.
Whats up with Turkey? https://www.zerohedge.com/news/2019-08-19/us-treasury-bull-market-has-barely-started
Whats up with Turkey?
Runaway inflation.
Turkey Inflation Rate
Plus yields belong to US and its close allies, minus Turkey. It looks like circling the wagons. May be an attempt to bring dollars back to home.
Anyway, someone has to be in minus so someone else can be in plus.
Nevertheless, it all looks like politics (especially Italian -0,01 %, and Norway plus, and yet Swiss minus). It is quite astonishing that PIIGS have negative yields. How much Germany pays for that? If it were to go on and on, they could finally even deflate their debt.
So to summarise, Denis assumes completions will continue in Permian at a steady rate while Guym/ Ron assume a drop in completions.
I’m astonished that completions are continuing almost regardless of the oil price but they have been.
Is there a tipping point where oil companies suspend/ reduce drilling in the Permian until it is profitable again?
I guess only time will resolve that question.
My guess is that some companies will review their q3 operations, possibly seriously affecting production growth but what do i know?
Some companies, all shale, will be fine. Examples are majors, ConocoPhillips, EOG, Oxy, and some others like smaller players just into the game. Most others are toast. In total, I expect all players and shale plays to break even, at least, for this year, as far as US output goes, if not a little more.
Regardless of price increases, I expect a lot more headwind going into 2020.
Sean,
Note that I am assuming no increase in the completion rate, from Dec 2017 to June 2019 the 12 month average completion rate increased by 65% in the Permian basin. So this assumption of no increase in completion rate is a big change from the past 18 months from a 65% increase to a 0% increase.
Hi Denis,
I respect immensely the modelling you have done.
However, a spate of bankruptcies or even logical economics could result in significantly less completions and a massive divergence from the trend, i. e. the model for pompei agricultural output would have diverged significantly when vesuvius erupted.
Sean,
Thank you.
Absolutely correct, I have assumed no catastrophic increase in volcanic eruptions. 🙂
I have assumed a big change in the trend in my analysis from a 65% increase over 18 months to no increase in completion rate. The trend in the annual rate of increase in completion rate from Jan 2017 to Jun 2019 was 115 per year. From July 2019 to Dec 2031 the rate of increase in the completion rate for my conservative scenario is zero.
Note that I lay out the economic assumptions pretty clearly. When a company goes bankrupt there is a process for selling assets if an agreement is not reached with creditors, this is an ongoing process in a capitalist economy, it happens all the time.
The $70/b scenario is shown below, oil price remains about $70/b through 2066.
There are mathematical tools that can be used to estimate the probability of
sanctions, conflicts, political upheaval, etc. That’s what Peter Turchin and
his followers are attempting to do
at https://escholarship.org/uc/irows_cliodynamics.
What is missing in my opinion is coupling these techniques with energy
production (where energy production includes food production).
In my opinion the probability of political upheaval, war, and economic
disruption increases towards the end of the stagflation period. I believe
that stagflation in oil production began in the 1970s with a tangible uptick
(well downtick might be more appropriate) around 2005.
To keep the discussion civil some assertions can be predicated with
probabilities. For example when OPEC production drops there are several
possibilities the two most likely being that either OPEC is voluntarily
limiting production to support prices or that OPEC production is peaking.
It could be a combination of both depending on the country. Personally I
put probabilities on these explanations and wait for further data to
confirm either one or the other explanation. I think extremely likely that
OPEC as a whole is not cutting production to support prices but is
producing flat out to pay bills. OPEC has a history of cheating on
production quotas. In fact, the oil industry as a whole has a history of
producing flat out limiting production only when investors or some
regulatory agency forces it into cuts (Texas RRC or OPEC). One country that
has had a history of supporting prices is Saudi Arabia. The big question
for me is why Saudi Arabia is producing so far below its quota.
Hooray for mathematical tools.
One notices that they tend to provide a range for results.
For example, “oil production will be xxxx plus or minus yyyy on zzzz date.”
If you then inform the mathematical tool that it will be fined several million dollars for being wrong, you will find that yyyy number explodes. If you inform the mathematical tool that it will be rewarded several million dollars for being right, you will find that yyyy number also explodes.
How very useful.
Schinzy,
Saudi Arabia is either restricting output to bring oil prices up, or cannot produce any more than its current level of output. We won’t really know until either oil prices rise or OPEC decides to increase market share and they increase output no matter the price (as they did in 2015 and 2016).
I can only agree with your cool voice of reason Dennis.
Schinzy,
Despite the criticisms that I voice about your work, I mostly agree with it. I have a little less confidence in economic models, though part of my model relies on mainstream neoclassical economic theory and I would agree there are problems with that theory as it reduces human behavior to profit maximization on the business side and maximizing utility for individuals on the consumer side. Walrasian theory is mathematically very elegant, but it uses the magic of the auctioneer to arrive a set of equilibrium prices to arrive at an efficient solution. A simple critique is that there is no auctioneer determining a set of market clearing prices. Furthermore reducing human behavior to profit and utility maximization misses a lot of pieces to the puzzle of how society works.
I am not familiar with Turchin’s work, is there a seminal paper that would give one a flavor of his contibutions? You give a link, but maybe you could point us to the best introductory work to read, as I don’t want to read it all.
I’m not sure what his seminal work might be, but he maintains a blog, of sorts, here.
http://peterturchin.com/
http://peterturchin.com/books/
I read Turchin and Nefedov’s book Secular Cycles. Most of it was a collection of the evidence supporting their theory. What I like about Turchin is that he is data driven.
Sir Francis Bacon stated in the 17th century that one should never found a discipline on false hypotheses. I think that neoclassic economists have made that mistake. They produced theory first, then they try to make the theory fit the evidence which renders the theory completely useless.
A few years ago Turchin was trying to use signal processing tools (Fourier analysis) to analyze the occurrence of violence in U.S. society. I was more impressed with the method than the results. The correct order is to look at empirical data, then you try to find a theory to fit the data. Then you compute what the theory means and try to find empirical evidence that either supports or disproves it.
Schinzy,
In my view data and theory are equally important, both are needed for an understanding of the world.
For social science our understanding of the world changes the social structure by altering our understanding of how the World works. So theory interacts with reality and changes that reality (the social structure). We are trying to understand something that is a constant state of flux. Much more challenging than simple physical laws. Repeatable experiments are not possible so testing a theory is quite difficult. Econometrics attempts to analyze the data statistically and adjust for changes in the data over time, but then one needs a theory for why the data changed over time and testing that theory is problematic.
Isaac Newton was very much influenced by Bacon’s ideas. Throughout his work he wrote: “I make no hypotheses, I only explain data.”
Economists have always done a lot of empirical work. In the last few years, these economists have increasingly been recognized for their work as the predictions of the theorists have fallen flat.
From time to time you have to throw out your theory and start over again. For example Newton completely threw out Aristotelian physics and developed a new theory that fit the data. Newton’s physics did not last as long as Aristotle’s physics, but it had a tremendous influence today’s science.
Schinzy,
Despite what Newton thought he was doing, he formulated a theory that matched the data. Neither takes precedence in my opinion a theory without data is useless, but data with out a theory is equally useless, no more than random numbers on a page when there is no theory with which to make sense of it.
It is peak oil in the Saudi realm. It seems that at the moment Saudis are preparing/stockpiling for a war. Recently they have LOWERED their grain standards, which means they want to buy more (unless they are really short of money and want only cheap stuff from now on; that, in itself, would reinforce the Saudi peak oil scenario too). You need to put yourself in the Saudi place – the end of which shipment would be a tragedy for Saudis? Not oil, oil they have. But in case of a war – they need food even more than we need oil, as they are producing null themselves.
Also, the ARAMCO bond sale as well as incessant rumours abot ARAMCO entering stock market – it makes a sense if they want to get more money, and/or expect a war in future (you don’t get much for ruins). However, a good, tried idea how to earn more money would be to produce more oil, especially as a surge in production would surely help a sale of ARAMCO shares.
But they are producing much less than their quota. Consistently producing under the quota does not help the Saudi case, as it raises a lot of uncomfortable questions.
However, it seems that Saudis themselves are surprised by the situation, as they made an effort to gain higher quota numbers, probably knowing about coming Iran sanctions. But well, who knows the Allah ways.
What Saudis need to do in order to prove that they have “spare capacity” are fast and large swings in production. We haven’t seen them a long time already. It is possible that they have some spare capacity of last resort, just to feel better, to feel that they can do “something”, but I bet it does not exceed 1 mbd.
Saudi Arabia must have its war. Otherwise, how could they explain that they are going to produce 5 mbd in 2030? “Houthis bombed Shaybah” ?
Saudis, Kuwait are approchaing their Seneca cliffs. Their plateaus are already too long to be natural. Only UAE and Iraq seem to be yet at the rising side of the curve. Curiously, UAE is not being attacked by Houthis, in spite of it being the part of “Coalition”. No need? So, maybe the war is one big conspiracy to cover Saudis decline?!
Welcome to the world where Houthis are market movers. I suppose it is called “globalization”. Morale: be careful what you wish for, Henry Kissinger.
Saudis are in the trap now:
1) in case of the extraordinary step of adjusting down their quota NOW, this very fact itself would put their spare capacity in doubt.
2) since the only credible way to adjust quota down is to do that during regular OPEC session, they must pray now for low oil price, which would justify that. But what if the prices are higher?! The higher oil prices are the danger…. this is why we hear now from OPEC the rhetoric of ‘glut’ and ‘oversupply’. They need to believe that.
So, the Saudis are now in the trap between their wish of high oil prices, and their credibility (ability to deliver).
Anyway, was any time in the past when Saudis were consistently producing so much under the quota?
They’ve done it befor – to regulate oil price. 500k less, but 5$ more pays out for them by a big time.
Long constant plateaus for them can also mean they have that big reserves so they don’t have to pump the maximum for getting the typical hubbert curve.
They realized early that pumping everything that goes doesn’t result in the maximum possible money.
The discussion about their reserves was here, too – but since everything is opaque and foggy nothing possible to say about them. Revealing too big reserves can lead to price crashes, too – and that’s not in their interest.
Perhaps they are filling some deep tanks now, so they can simulate spare capacity the next time ;).
Revealing too big reserves can lead to price crashes, too – and that’s not in their interest.
Surely you jest. Saudi greatly exaggerates their reserves. And they never go down. Every barrel they pump out of the ground is just magically replaced by another barrel. They have magic oil.
SA is bad – but Russia is ridiculous.
2006 the EIA estimated them of 80 GB reserves(wiki). They produced round about 50 GB since then, and still manage to grow even when small.
Their numbers are complete BS – you can’t produce more than 10 mb/d conventionel out ouf reserves that small.
That’s just my opinion – most things there smoke and mirrors.
Can be (much) less, can be (much) more.
Russia said its oil output will go down starting 2022, and expects to produce just 5mbd in 2030. 2030 is also the year the Druzhba pipeline is to be closed. Sounds right, Russia own use is 3,5 mbd, Druzhba flow is 1,5 mbd. In 2016 (could be wrong about the date) Medviediev said they have oil for 27 years. For Russia, not for you ;(
This is why, I suppose, Russia is in MENA. The fight for MENA is a must for a future leader of the world.
Yet if Simmons was right, Saudis may produce just that, 5mbd in 2030. Should they start losing 0,5 mbd every year from now…. 5 mbd at the end.
Simmons was very pessimistic. More than 10 years ago he wrote that a very cold winter in Europe could confront Russia with Peak gas.
Regarding PO for Russia: It seems unlikely that within 10 years they go down that much, even if they say it. But even going down to 7 mbd within 10 years would be bad news, except for climate change. There is a lot of guessing and rapidly changing opinions…Rapier lately about US shale oil production
After having recognized Saudi lies, Simmons might have started being suspicious towards everyone. Maybe he was justified; the circumstances of his death were rather strange.
But only on Saudi Arabia he did make a serious research, AFAIK.
I wonder if this is the same OneofEU who posts idiot things on other blogs?
Fernando?
What other blogs???!
About financing of oil.
The world has finally caught up and tables are starting to get printed showing just how much of the world borrows money at a negative interest rate. I’ve done a recent search, repeating a previous one, from Moody’s and Fitch concerning the credit rating of shale companies. There’s nothing clear, but there is a sense that the ratings are improving, not from performance but from lowering prevailing rates.
Germany has for some years now been the poster child of negative interest rates. It’s useful to note that Germany is currently in its year 5 of budget surplus. 11B Euros on a budget of 346B in 2019, the 5th consecutive such.
Europe is crying out for Germany to increase spending (for some reason not reduce taxes) as a fiscal stimulus. As if it’s any of Europe’s business when so many EU countries are above the EU regulatory max deficit. There is also no particular explanation of how higher interest rates would be favorable for Germany. Those folks are not too concerned with what Germany could do for Germany.
Mostly, the cries for fiscal stimulus are sourced in a subtle desire to get rates non-negative, because every day they stay that way another person realizes what money really means (not much). This is not an attitude the wealthy want encouraged and so they would like that surplus to go away on the presumption this would cause rates to rise. And, of course, they very aggressively keep their eyes averted from Japan, who run negative interest rates with a huge annual deficit.
Imagine the nirvana of EOG borrowing money at negative rates. Debt would become a profit center. Oil production would be a hobby.
Germany would like to spend, but is unable to spend fast enough. Germans would like to have more rail, but are unable to build and electrify it fast enough. The cargo railways are unable to take all orders due to lack of capacity, it has to go by trucks. Everybody wants to build cars in Germany, and no one needs them anymore really. The car industry is the biggest German industry. This is the tragedy.
It seems that German engineering somehow got stuck during Coal and Oil Kondratiev waves… no EV tech here, and also unable to renovate a sailing ship ‘Gorch Fock’, pre-coal really. The ship was build in 1958 in 6 months (!) as a replica of a ship build in 1933. Since 2015 the ship is being renovated, the costs as of yet 135 milions euro, yet it was build 7 times cheaper (inflation indexed).
API reports 3.45!m draw. Be interesting to see exports per EIA tomorrow. One million pipeline to Corpus added by last week, probably less than that flowing. How fast can they move these small tankers?
GuyM,
If you haven´t read this you may find it interesting. Ir confirm your view on Cushing being drained and prices going up:
“Because of new pipelines flowing out of the Permian basin, the biggest U.S. shale field, to the Gulf Coast, shipments to Cushing, Oklahoma, the delivery point for U.S. crude futures, are expected to dry up. Inventories have already dropped for seven straight weeks at the vital storage hub – at a faster-than-expected rate, traders said.”
https://www.reuters.com/article/us-usa-oil-options/traders-exit-complex-bearish-u-s-oil-options-as-cushing-supplies-tighten-idUSKCN1VC0C5
Thanks! Good info.
The latest from the SRSorcco Report:
Shale Oil Next Victims: Major Oil Companies
It’s a 15-minute video that I found very interesting.
Interesting , but I wonder if the conclusions are correct since he only analyzed the performance in a snapshot manner [2005/2019].
Assuming the analysis is correct, then why wouldn’t the majors he discussed just scale it down rapidly now? It looks like a losing game.
The downstream capex additions over the next one to five years more than make up for the production plans. Which comes first, the chicken or the egg? They have decided production should be first. And, I think increasing exports will have a short life span, because the majors will increase their footprint. Resistance is futile. Few have any long term plans.
In the meantime, they will continue to expand their plays in the energy markets.
Tick tock
https://oilprice.com/Energy/Energy-General/Shale-Bleeds-Cash-Despite-Best-Quarter-In-Years.html
It appears that list pretty well covers most of Texas and North Dakota production.
Thanks Ron for shearing this highly informative video.
Atmospheric vapor deficit causing worldwide loss of vegetation
https://desdemonadespair.net/2019/08/atmospheric-vapor-deficit-causing-worldwide-loss-of-vegetation.html
Dealers are stuck with an excess of 2018 vehicles.
https://www.nytimes.com/2019/07/23/business/were-full-car-dealers-say-as-auto-sales-slow-after-a-long-boom.html?searchResultPosition=5
And RV sales are down.
https://www.wndu.com/content/news/Economist-RV-industry-sales-could-indicate-recession-555119541.html
And heavy duty truck sales are down.
https://www.thedetroitbureau.com/2019/08/heavy-duty-truck-sales-off-81-in-july-to-lowest-level-since-2010/
I guess “Boomer” doesn’t stand for the Trump economy
How Much Crude Oil Has The World Really Consumed?
All told, from 1969 to 2018, a fifty-year span, the world has consumed 1.306 trillion barrels of oil.
Saudi Arabia reduces oil exports to support prices
World’s top oil exporter shipped 6.72 million barrels per day in June, down from 6.94 million bpd in May, official data show
Frugal,
It depends on what one calls “oil”. Using C+C data I get 1169 Gb or 1.169 trillion barrels of oil from 1969 to 2018 using EIA data for World C+C output. The extra 137 billion barrels may be NGL and/or biofuel.
Yes 1.3 trillion barrels looks a bit high for 1969 – 2018, but on the other hand, it’s probably around what the World has consumed since the start of the oil age. If we assume that this number is about half of the World’s URR of conventional oil, then it’s reasonable to assume that we’ve reached peak conventional oil.
Frugal,
Likewise if we assume it is less than half, then peak oil would be later, if we also assume peak oil occurs at 50% of URR. Note that either (or both)of these assumptions could be incorrect. Jean Laherrere recently estimated 215 Gb of extra heavy oil URR and at least 2600 Gb for C+C less extra heavy oil, so about 2815 Gb. Your 50% URR assumption for the peak would suggest cumulative output of roughly 1400 Gb for the peak, if Jean Laherrere is correct (in the past his estimates were too pessimistic). Note also he has an alternative C+C less extra heavy estimate of 3000 Gb and in the past has used 500 Gb for his extra heavy oil estimate. The 50% URR peak assumption suggests 1750 Gb of cumulative output for that case. Cumulative C+C output through 2018 has been 1365 Gb, so 385 Gb less than this high case peak, in 2018 C+C output was about 30 Gb, let’s assume output rises to 32 Gb, so maybe average output of 31 Gb from now to peak, that suggests about 12 years to peak or peak in 2030, the low case suggests a peak in 2020, take the average of these two estimates and we arrive at a peak in 2025+/-5 years.
Frugal,
May be correct on peak conventional, I missed the “conventional” in your previous comment. My guess is 2800 Gb for conventional URR pus or minus 200 Gb. If we are at the low end we might be near the peak or even past the peak, though a long plateau from 2016 to 2030 is possible. So far 2016 was the peak in conventional, but only a 300 kb/d decline over 2016 to 2018 period and OPEC was trying to prop up oil prices over that period. Under reasonable assumptions and a 2800 Gb URR we could see a secondary peak from 2025 to 2030 with higher extraction rates (though still well below the high extraction rate in 1973 at 12%, that scenario with peak conventional in 2030 has extraction rate rise from 5.6% in 2018 to 6% in 2030 with most of the increase from 2025 to 2030, extraction rate remains below 5.6% from 2019 to 2024 in this scenario).
The extraction rate is from producing reserves which start at 477 Gb in 2018 and fall to 446 Gb by 2030 in my medium (2800 Gb) scenario for conventional oil. Output equals extraction rate times producing reserves in Gb per year.
My guess is 2800 Gb for conventional URR pus or minus 200 Gb.
That’s almost twice world proven reserves according to OPEC. They have world total reserves at 1498 GB.
Ron,
Take it up with Mr. Laherrere, his latest estimate (August 2018) for C+C less extra heavy oil is 2600 to 3000 Gb. The average would be 2800 Gb.
Chart below is from page 16 of Extrapolation of oil past production to forecast future production in barrels published August 31, 2018.
No, no, I am not taking it up with Mr. Laherrere. I am taking it up with you. You have, in the past, championed Saudi’s claim of their claimed proven reserves, and OPEC’s claimed reserves. Those claimed reserves are pure bullshit. That is my claim. Yet, you claim that world proven reserves are far greater than OPEC claims.
I believe that OPEC’s claimed reserves are greatly overestimated and Non-OPEC proven reserves are underestimated, though not to the extent that OPEC reserves are overestimated.
Jean Laherrere has nothing to do with this debate. Well, that is unless he is your only source of world oil proven reserves.
Don’t get me wrong, I am a great admirer of Dr. Laherrere, but in this case, I simply think he is wrong. But I think OPEC is even more wrong. Their proven reserves are a joke. And yours are slightly less a joke. 😉
Actually my opinion is that so-called proven reserves estimates are meaningless. We can only look at production. We actually have no idea how much oil is left in the ground, or how much of it can be economically recovered. So just forget reserves and concentrate on production.
Read that last night. The writer points out that there are a lot of estimates of usage to date. Pre 1950 production is used as the metric for consumption for the very clever reason that you can’t consume more than produced and producers won’t produce what isn’t bought and consumed. How very quaint.
Maybe the most powerful item to understand is that peak consumption isn’t even remotely important, assuming it can exist with a growing population. If it plateaued, as it is popular to say about oil output, then you get the same mass deaths as you get with rising consumption as soon as production declines through that consumption line on the graph.
Scarcity kills. Scarcity occurs when the lines touch on the way down. That’s the point where there is desperation to consume but you don’t have it to consume it. So you go get it, and since you can’t get it underground you get it above ground.
US on the way to shake off Danish tyranny from Greenland. Preparations for operation “Inuit freedom” has started. Anyway, it seems that both Greenland and Antarctica are areas unexplored by oil and gas industry…?! Could it that really be so?
https://www.rigzone.com/news/us_fracking_sector_disappoints_in_2q-21-aug-2019-159611-article/
This article from rigzone highlight the fact that only 11 of 29 oil ang gas fracking Companies in US manage to deliver positive cash flow in 2Q 2019. It means 68 persents was loosing money or had zero profit.
Liabilities / loan ballons, invedtment in new equipment and other like dividend should for a healthy Company in US shale mean 15-20% profit after tax and all fees are payed. Seems like few or any at all are able to survive in long term with WTI in 50-60 usd range.
Gasoline consumption is hitting new records in the US.
Here’s the former high from before the GFC and the new high (thousand bbl/day).
8/17/07 – 9,762
8/09/19 – 9,932
(Source = https://www.eia.gov/dnav/pet/hist/LeafHandler.ashx?n=PET&s=WGFUPUS2&f=W)
I guess Peak Oil Demand(tm) is going to have to wait?
Lol. No, peak demand will occur the same time as peak oil. Whenever that is. Guesses, here, range from 2018 to 2024. Six or seven years, what does it matter what it is? We are here. The best I see is a gradually increasing plateau between 2018, and 2024. But, probably sooner than if we wait for the mythical peak demand.
As Ron so succinctly points out, we are producing 2 million barrels a day less in 2019 than 2018. Will it recover? Stay tuned.
My opinion? It’s the calm before the storm. Locally, exports did not move this week. It’s not something I would anticipate for the future, and we still had a respectful draw, because gasoline demand hit a new apex. And, if we can’t move another 400k barrels a day out of Corpus, the new pipelines are doomed from the get go. That translates into an additional 2 to 3 mb additional drop per week, for a long time. Anything close to that proximity will have OECD inventories dropping like a rock. All from the USA, because Europe is in tatters. Long live the positive interest rate.
And WTI will not stay anything close to $55.
Demand’s not too important. Consumption is all important.
When production is insufficient, then consumption will have a lower number than demand. That number will grow. The more desperate the desire for it, the more likely tankers are seized to get it.
Watcher, I think you see demand as what the market wants but often does not get. Well, there is just no way to measure that. So what people want but do not get has no number.
Aggregate demand is the total demand for all the goods and services already existing in the economy which is constantly changing as the number of goods and services change. Demand is a consumer’s desire and willingness to pay a price for a specific good or service.
If the price gets too high for a product, then the consumer’s willingness to pay drops. Demand falls, consumption falls. Demand and consumption are one and the same thing.
Nah of course not. We’ve already covered this. You can measure demand in feet.
How many feet long the line of cars is at the gas station that has no gas.
The concept of demand equal to consumption (they are two different words after all) derives from a presumption that the universe does not allow another word — scarcity. It presumes that a high enough price will create existence of some substance and ensure that consumption can equal demand. It’s a presumption of economics obviously already proven wrong any time there has ever existed a queue to buy something and having the purchaser walk away with less than he wanted. There’s another word that exists in the universe. Rationing. It defines consumption different from demand.
Something is only scarce the day you want it, but can’t get it. Consumption declines that day. Demand does not.
Watcher, your definition of demand is certainly different from your definition of consumption. But the market doesn’t use your definitions. Nowhere can we find demand figures published according to your definition.
So you go right on assuming demand according to how long lines at the gas station are and the rest of the world will go right on publishing demand figures according to what people actually buy and consume.
My point is there are no demand data published other than data gathered from actual sales of goods and services, your definition notwithstanding.
Demand and consumption are synonyms as long as prices are allowed to adjust so that supply goes to the highest bidder. There are lots of synonyms.
Long gas lines only result when stupid policy is followed, such as fixing prices. Nixon tried that it was dumb then and we might be smarter now.
Allow price to adjust and lines disappear.
Price was locked to one value in WW II. And gas was rationed. People wanted more. They could not get it. Price was irrelevant.
A city under siege has lots of people inside the walls. They want more food. They can’t get it. They can consume only the distribution defined by government no matter how much they demand of the government.
Y’all just have no leg to stand on. When you have a theory and it is shown incorrect just one time, that’s it. Done. You need a new theory.
Nope,
The theory is for a situation where there are free markets, not applicable elsewhere when markets do not operate.
“No, peak demand will occur the same time as peak oil. Whenever that is. ”
That’s my view too.
I developed it by the super rigorous method of observing the traffic wherever I go.
Lima, Shanghai, London, Munich, Hong Kong, Miami, …etc…it’s always the same story.
Gridlock for many hours each day, and 99%+ of the cars and trucks are ICE.
It was recently announced that a record number of daily flight were recorded. So I see the same thing in air travel. It almost looks…exponential…
Robert Rapier is mentioned up thread.
Does anybody here know what he has had to say RECENTLY about wind and solar power, a transition to electric vehicles, etc?
I used to read his blog religiously. He didn’t have much to say in favor about the practical aspects of electric car ownership back then. He was meticulously honest, I’m not disputing that, or his professional qualifications, etc.
Of course back then I believed myself that peak oil would just about dead sure result in the world wide economy crashing and burning. I’ve changed my mind about that. I still believe the cards could fall that way, but that the odds are now at least fair to good, or maybe even excellent, that we can successfully deal with peak oil without going back to steam engines burning wood and coal, lol.
The actual outcome probably depends mostly on luck and on how long the oil production plateau lasts. Given ten years or so, with production holding up ok, but the price of oil steadily rising, car and truck dealership lots will be mostly stocked with electric vehicles, etc.
OFM. My employment at times requires visits to metro areas.
I recently commented on my 3,000 mile + driving vacation earlier this summer, and seeing just 6 Tesla’s.
My most recent trip for work resulted in me seeing the most Tesla’s I have seen on a trip to date. 15 in four days.
This was in a major midwestern city. 3 were at charging stations in parking garages. 12 were being driven.
Noteworthy 11 of the 12 I noticed were in a high income, urban area. The other I saw on the interstate about 10 miles from that area. I drove several hours each way on interstates to get to and from, and didn’t see any Tesla’s. I also left the city during rush hour, unfortunately. My route took me primarily through middle class neighborhoods. During that over one hour of heavy traffic, I didn’t see a Tesla.
Admittedly, I am not good at spotting Nissan Leaf’s, although this state has a distinct plate for EV, so hopefully I might notice them. Didn’t see any.
Dennis repeatedly says that the costs of EV will drop. I agree if this happens, many more urban drivers will likely purchase them.
Also, the parking garages will need more than 1% or less of the stalls to be equipped with chargers.
Almost every time I ventured out, I saw at least one Tesla. No doubt they are selling.
Hi Shallow Sand,
I didn’t believe ten years ago that electric cars would ever be price competitive with conventional cars, at least not within my own working lifetime.
Now I do.
And I believe that they will continue to drop in cost to the point that they are going to be the norm rather than the exception, bought new, within ten years or so, because I do know as much as any hillbilly NEEDS to know about oil. I know that it comes out of holes in the ground, and that it DOES NOT grow back…… not in less than a few tens of millions of years anyway, lol.
The number of human rats in the oil corncrib is increasing every day. ‘Nuf said, oil is on it’s way out, within your lifetime and mine.
I also believe that your personal investment in the oil industry is safe for another twenty years at least, and probably even longer,if your wells will produce longer than that.
We aren’t ABOUT to give up oil altogether in less than half a century at the earliest.
Nobody is going to be replacing big diesel engines with batteries anytime soon, period, except when such batteries can be kept in more or less continuous use to justify their costs.
All the legacy equipment around twenty years from now will still be used until it’s worn out, so long as diesel fuel can be bought at anything like an affordable price, say the equivalent of ten bucks a gallon in today’s money.
I only use my backhoe once in a while, ONE my tractors maybe an hour or two once a week, sometimes not at all for three months. Dump trucks generally sit around more days than they are used unless they are less than five or six years old, etc. Old ones ready to go are often used only a day or two a month.
By 2023 vw and ford will be selling all kinds of EV/PHEV vehicles. You will see many more beginning then. Especially if shale peak becomes the common refrain.
There are some common notions among most Americans, regardless of ‘tribe’ affiliation.
The only exception to what I’m going to say is if they are invested in a particular industry, like oil production or engine repair.
1. Most would like to avoid buying imported fuel [exception perhaps from Canada]
2. Most would jump at the chance to cut out middlemen from their purchases, including fuel purchases
3. Most would like to avoid purchasing fuel from the big multi-nationals
4. Most would jump at the chance to protect themselves from any surge in fuel costs, whether it be temporary or long term.
At some point, likely in the coming decade, people will realize that they can get close to these preferred outcomes by getting into an EV/PHEV. And especially so if they have cheap (less than 15 cents/kwhr) utility power, or their own PV panels.
If you think this is incorrect, or ‘wacko’ to borrow the term, I’m always up for an education.
63% of 69,639 unconventional shale oil wells drilled before 2016, in five of America’s largest shale oil basins, now produce less than 30 BOPD, on rod lift.
America’s long term hydrocarbon policies should be based on factual data, not dung heap we hear from the mainstream media, or worse, from data-sell companies like Rystad or Drillinginfo.
https://www.oilystuffblog.com/single-post/2019/08/21/Phenomenon
Mike.
Important info you quote from Enno.
Another one that floored me from Enno Peters and shaleprofile is that about 11,000 of the shale oil wells with first production 2015 and prior are either shut in, T/A or plugged.
Shaleprofile is a great reference, and the free portion keeps getting upgrades.
Parshall in the ND Bakken is considered among the best acreage to date in US shale. Interesting to see how many wells in Parshall are either shut in or under 30 BOPD.
What percentage of the total pre 2015 is that 11,000 number?
27.5%.
That doesn’t sound that bad. They are getting flow from 72% of shale wells after 5 yrs.
Yeah, that pretty much confirms what I have seen looking at on individual wells. Most are toast within 7 to 10 years. Some a lot sooner.
GuyM. I think I have this right, but you can check shaleprofile.com yourself.
58.55% of the wells in the EFS produced less than 25 BOPD in April, 2019.
This confirms what Mike has observed in his trips through the EFS, I believe. He has related that the majority of the wells he sees are not pumping, because they either pump part-time due to low fluid volume, or are shut down.
I believe you. I haven’t believed the hype coming from Drilling info or others for quite some time. I use five year projections for mine. Safer. Though, it appears to go longer than 7 on the first one in 2015.
By my count, per ND DMR, 149 of the 551 wells in Parshall field were shut in, temporarily abandoned or made less than 300 barrels of oil in June, 2019.
Parshall is the field that made EOG in the North Dakota Bakken about 10 years ago. The 551 wells there averaged less than 40 barrels of oil per day each in June, 2019.
shallow sand (and Mike),
Below are scenarios for US tight oil, the higher (100 scenario) assumes a modest increase in completion rate and the 100 oil price scenario in right axis; the lower (70 scenario) has completion rate decreasing to attempt to maintain roughly flat output after 2022. The “oil price” on the right axis is inflation adjusted (2017$) real Brent oil prices based on AEO reference scenario from 2018 up to $100/b or $70/b.
Curious if you have any thoughts. Too low, too high, and yes I know that nobody knows future oil prices, these are guesses, happy to use other guesses, but nobody is bold enough to suggest any.
Note that the $100/b scenario goes no higher than $100/b and decreases from $100/b in Dec 2037 to $88/b in Dec 2050 and remains at that level, so a fairly optimistic oil price scenario with no EV transition.
UK oil production going steady at around 1 Mbpd
https://data-ogauthority.opendata.arcgis.com/pages/production
Alaskan crude under 400k for the first time?
https://www.aoga.org/facts-and-figures
Danish oil production close to a record low of 100k bpd
https://ens.dk/en/our-services/oil-and-gas-related-data/monthly-and-yearly-production
Keep an eye out for Mexican/Pemex oil production for July out soon
https://www.pemex.com/en/investors/publications/Paginas/petroleum-statistics.aspx
Cheers
https://oilprice.com/Energy/Energy-General/Investors-Are-Ditching-High-Yield-Shale-Bonds.html
This year issues of high yield junk bonds are half of 2018 for shale companies. Could be seeing some huge decreases in capex soon.
With current interest rates, “high yield” isn’t anywhere near high enough to justify the risk of structurally unprofitable companies.
Ah, that’s a respectful term. Although, I am thinking zombies may be more descriptive. Buried somewhere in their quarterly tell sheets is the refrain, “I need to eat brain!”.?
I posted this on the non-petroleum thread but it has some relevance here also:
Renewables and geopolitics: ‘There won’t be as much to fight over’
The next wars will be over water and food, particularly where rivers flow through several countries, and countries like China destroy the fish stocks that other rely on.
https://reliefweb.int/report/world/editor-s-pick-10-violent-water-conflicts
Governments will be forced to go to war when a neighboring country takes all the water, without water the is nothing.
http://www.worldwater.org/conflict/list/
and for many people fish is their main source of protein and they will have to fight for it
https://securefisheries.org/focus-areas/fisheries-conflict
https://www.express.co.uk/news/world/1157064/south-china-sea-news-world-war-3-duterte-beijing-philippines-fishing-xi-recto-bank
Permian Legacy Decline Rate per month. As production increases the legacy decline increases. That is because the legacy decline is highest for new production. The legacy decline for the Permian is currently at about 6% per month.
Hi Ron,
For the Permian basin the rate of legacy decline in percentage terms seems pretty steady in 2018.
If you are saying this implies there will be a peak in output, I agree. For the US, I expect between 2022 and 2025 there will be a peak in tight oil output. For the Permian basin the peak will be a bit later in 2028 or 2029, but declines in other plays start earlier than the Permian probably around 2022/2023 for the “rest of US tight oil” (which excludes the Permian basin).
Dennis, yes the decline rate in 2018 was fairly steady, just a tad under 6% per month. But the point you seem to be missing is, as the barrels per day increases, that 6% means more barrels per day of legacy decline also increases.
For instance, the legacy decline in January 2018 was 6.19% and the legacy decline for that month was 177,623 barrels per day. In January 2019 the legacy decline rate had dropped to 5.95% while the legacy decline for that month was 232,577 barrels per day. So while the legacy decline percentage dropped by .24%, the actual legacy decline in barrels per day increased by 54,953 barrels per day. That is because production, from January 2018 to January 2019 increased from 2,870,820 bpd to 3,909,534 bpd, an increase of 1,038,714 bpd.
As production increases, legacy decline increases. Not the rate but the barrels per day. You seem to think I am talking rate when I am really talking barrels per day. So if the rate stays 6% and the number of wells stays constant, production will decline and soon reach zero. You will have to increase completions each month to increase production over the long run.
Hey, you are one of those “math types”. You should be able to figure this out.
Hi Ron,
The rate decreases when completions no longer increase at as high a rate, see 2015 and 2016 especially in Bakken (completion rate was increasing in the Permian throughout this period.) The rate of legacy decline will gradually decline to 5.3% from July 2019 to Feb 2025 when US tight oil peaks and Permian output is 5839 kb/d.
Ron
Below is a different view of the DPR Permian data. The chart compares the gross monthly growth of production and decline. While the gross monthly production growth is erratic, the decline is tending toward linearity. Looking at the last few months the growth in the decline rate is close to 4 kb/d/mth. For May, June and July the gross production growth was steady at close to 300 kb/d/mth. Not sure why the September growth jumps by 339 kb/d. Looking at the July numbers, Growth of 300 kb/d and decline of 260 kb/d. Decline and production will the same 10 mths from now, provided the decline rate continues to grow at close to 4 kb/d/mth and production growth stays steady at close to 300 kb/d/mth. Note that the overall Net monthly growth is the difference between these two curves. For August, the net production growth is 75 kb/d (339-264).
Ovi, growth in production involves only new wells while legacy decline is all wells. So it will naturally be more linear than new production.
We don’t really know that Permian production will jump by 339 kb/d next month. That is just the EIA’s guess. And we don’t know if their August guess is close to being correct either. They don’t have a very good record with their guesses.
Ron
I agree. We will have to wait till next month to get the latest guesses.
Eagle Ford legacy decline is currently about 8.5% per month.
Ron/Dennis/Guy
Attached is the Texas RRC April C + C data. I understand that the latest data is behind and will be updated. I have also added the EIA data for Texas up to May. Do you have any idea if it reasonable to believe that the January gap between Texas and EIA is 400 kb/d.
Do you have any idea if it reasonable to believe that the January gap between Texas and EIA is 400 kb/d.
I think that is totally unreasonable.
Ron,
It is perfectly reasonable. The RRC data is incomplete for 6 to 18 months, the EIA takes a survey of large producers to estimate output and this is far more accurate than the most recent RRC data.
For about three years I used RRC pending data file, production reports to check against the EIA monthlies. Trying to find fault. Never happened. The pending data file toward the end of 2018 was close to 800k. Depends on when they change leases from pending to actual. It can sometimes take awhile. But, you can never tell anything from recent production files by RRC against EIA monthlies. You have to have the pending data file. It was a waste, I quit doing it. The EIA monthly is as close as it gets. RRC pending data file can be purchased from RRC for $10. Just takes a lot of reorganizing files, but there in files easily converted to excel.
I just go with EIA monthlies now. Why reinvent the wheel. They do adjust their monthlies from time to time, but it is minor adjustments. The rest of the stuff out of EIA has little credibility.
The primary source of data, other than to the monthlies is from drilling info. Going back to the third month, drilling info data is ok, but I am pretty sure they have formations confused. Easy to do. Anyway, the last two months of that is primarily estimates, unless they have hard production data. In times of rising production that can be behind. In times of flat or lower production that can be over. What they should be using is Enno’s site, but he doesn’t charge enough.
Guy/Dennis/Ron
Thanks for the input. Sounds like the bottom line is to go with EIA monthly data.
Ovi,
The tight oil production estimates by play are also pretty good, but monthly estimates by EIA are best in my opinion, unfortunately they do not break out tight oil in those reports.
Though focusing on lower 48 excluding GOM output probably gives us a rough idea of changes in tight oil output from month to month. Just take the total and subtract Alaskan and GOM output and that gives us a rough idea of changes in tight oil output.
Niobrara legacy decline rate is currently about 7.2% per month.
Bakken legacy decline rate is currently about 5% per month.
Hi Ron,
So in general we see relatively steady legacy decline rates (in percentage terms) in the various plays with some plays having lower rates (5% in Bakken) and some with higher rates (8 to 9% in Eagle Ford).
As overall output for plays other than the Permian seem to be relatively steady of late (no increase or decrease over the past 7 months in tight oil plays other than the Permian), let’s focus on the Permian basin for simplicity. Lately that has been about 6% (even with rapidly increasing output). In July Permian output was 3689 kb/d, 6% of this is 221 kb/d. If completions were 450 new wells per month, the increase in output would be 300 kb/d, so a net increase in output of about 79 kb/d. My model has gradually decreasing increases in output, eventually reaching zero at the peak.
Note also that US tight oil peaks in 2025 because other plays start to decline around 2022/2023, by 2025 the decreases in other plays are larger than the increases in Permian basin output so the peak for all of US tight oil is reached before the peak in Permian basin output in 2029.
Great mathematical models. Which will not serve the facts of what is happening now, and in the future. Shale belongs to the big boys soon. Their model will serve upstream to downstream. Growth is no longer the big issue.
GuyM,
That is why my flat completion model has very little growth. It is based upon your suppositions about low growth, essentially for the low growth model at $70/b there is 1000 kb/d growth over 4 years, about 250 kb/d increase each year on average over those years for US tight oil. My guess is that the majors want to see some increase in output, it is possible the completion rate will dccrease, but in my opinion this is unlikely prior to 2024.
Don’t we need to get beyond Nov. 2018 first?
We are 2 million barrels behind- and 2019 is not going to exceed that.
Just asking—
Hightrekker,
I look at the trailing 12 month average of World C+C output using EIA data, the peak is currently April 2019 (last data point available from EIA). The data is very noisy, I don’t think a single month data point tells us very much.
OK—-
Permian basin output in 2029.
I googled “When will the Permin Basin peak. I got several replies. The closes was in late 2020. Is Peak Permian Only 3 Years Away? Written in November 2017 in Oilprice.com. There were really no optimistic articles. Everyone put the peak well before 2025. Even the EIA weighed in, according to Robert Rapier:
Peak Tight Oil By 2022? EIA Thinks It’s Possible, Without Even Accounting For This Risk (Written in February 2018)
Conclusions
The latest Annual Energy Outlook from the EIA models the future potential of tight oil production under several scenarios. Some scenarios project tight oil production growth for another three to four years, but these scenarios apparently don’t consider supply risks posed by insufficient infrastructure, oilfield services or manpower. These factors could slow tight oil growth over the next few years, and could potentially shift the timing of peak tight oil.
Of course, this is all tight oil, not just the Permian. But most geologists and researchers are becoming more and more pessimistic toward the Permian as of late. As new data comes in most of them are turning sour toward the Permian.
I find your projection the Permian peaking in 2029, not just optimistic, but wildly out of this world, unbelievably optimistic.
Have a nice evening.
Ron,
Yes you often find my scenarios wildly optimistic. The peak in 2029 assumes Brent reaches $100/b, for a $70/b peak scenario the peak is 2028. There is a plateau from 2027 to 2030 in this “flat completion scenario”. The basis for the scenario is well profile to date from shaleprofile.com and USGS mean TRR estimate. Perhaps the USGS is wildly optimistic, but their estimates from 2000 on have been reasonable in my view.
This is a very interesting graph. It seems that the Permian has already hit peak growth rate in 2018. The flattening in the growth from 2020 onward in remarkable, while it took one year for Permian production to go from 2M to 3M in 2018, it will take three years for Permian production to 4M to 5M. Without the Permian growing at a brisk rate, US annual oil production is going to slowdown materially in the coming decade, and there is no one else to replace US growth.
Ivan,
The “wildly optimistic” (by Mr. Patterson’s account) scenario presented assumes Brent oil prices rise to no more than $70/b in 2017$ and that the completion rate does not increase from the 6 month average from Jan to June 2019. In my view the scenario is “wildly pessimistic”. 🙂
Fixed it. Thanks
Ron,
Here is EIA AEO 2019 reference scenario for US southwest output (essentially the Permian basin). So an alternative assessment from what you have found. Usually I think the EIA is too optimistic, through 2032 their scenario is reasonable.
Hi Ron.
Here is a more recent Robert Rapier article from December 2018:
https://www.forbes.com/sites/rrapier/2018/12/27/why-the-permian-basin-may-become-the-worlds-most-productive-oil-field/#5d6f1485ccb3
An excerpt:
In 2016, the USGS had estimated that the Wolfcamp shale in the Midland Basin portion of the Texas Permian Basin contains a mean of 20 billion barrels of oil, 16 Tcf of associated natural gas, and 1.6 billion barrels of natural gas liquids (NGLs). This estimate was for undiscovered, technically recoverable resources, and was the largest estimated continuous oil accumulation that USGS had ever assessed in the U.S.
In its most recent report, the USGS has included the Wolfcamp shale and Bone Spring Formation of the Delaware Basin portion of the Permian Basin for the first time, and the estimates are eye-popping. The new estimated mean of undiscovered, technically recoverable resources in the Permian basin are 46.3 billion barrels of oil, 281 Tcf of natural gas (17.5 times higher than the 2016 estimate!), and 19.9 billion barrels of NGLs.
It is important to note that these estimates are of technically recoverable resources, as opposed to proved reserves. The difference is that the latter must be economically recoverable at prevailing prices. That may not be the case for a good portion of these resources, but that can change if oil and natural gas prices rise.
Nevertheless, it’s hard to escape the possibility that 1). Given the three million BPD of crude oil production added in the past decade; 2). The huge inventory of DUC wells; and 3). The enormous size of the resource — it isn’t crazy to think that in a few years the Permian could be out-producing Saudi Arabia’s massive Ghawar oilfield. It would have been crazier in 2007 to suggest that the Permian would be closing in on four million BPD at the end of 2018.
Seems Mr. Rapier changed his thinking from Feb 2018 to Dec 2018.
Seems Mr. Rapier changed his thinking from Feb 2018 to Dec 2018.
Yeah, and it seems he changed his mind again in late July, 2019.
The Permian Boom Is On Its Last Leg By Robert Rapier – Jul 28, 2019
But recently a number of reports have highlighted a slowdown in U.S. shale oil growth. In its most recent Drilling Productivity Report, each of the six regions tracked by the Energy Information Administration (EIA) — Anadarko, Appalachia, Bakken, Eagle Ford, Haynesville, Niobrara, and Permian — still showed a year-over-year increased in oil production.
However, if we look at the year-over-year gains over the past few years, there has been a noticeable slowdown in oil production growth. This slowdown is particularly pronounced in the Permian Basin. The most recent estimates in the Permian are that year-over-year production is growing today at just over half the level of a year ago. Production growth there has been in rapid decline since peaking a year ago.
And it from the falling rig count, it looks like that slowdown will continue.
Ron,
My analysis also suggests a slowdown in the rate of growth, consistent with Rapier’s analysis. The chart below has the rate of growth for each month (annualized) for the scenario with a constant completion rate and Brent oil prices of $70/b or less in 2017$. I agree that the rate of growth will be slower which is what Rapier says in his piece. Note that he does not predict when Permian basin growth will end.
Data after June 2019 in chart below is based on a scenario assuming no change in completion rate from July 2019 to July 2029. Through June 2019 the model matches the EIA data closely.
Ron,
As far as rig count, the latest Baker/Hughes data shows the average weekly horizontal oil rig count in the Permian basin in 2018 was 417.6 rigs.
For 2019 through August 23 the average weekly rigcount is also 417.6. Chart below uses data from the North America pivot table at link below:
https://rigcount.bhge.com/na-rig-count
And try this one on for size:
The Permian Blowout Is Coming
Now, when it comes to finding those investment gems in the oil sector, things aren’t as easy as they used to be.
Ten years ago, we could’ve blindly thrown a dart against the wall and hit an easy double-digit winner in the E&P sector.
It’s true, and my longtime readers know precisely how lucrative things were.
Between 2009 and 2010, we were banking profits at a rate of nearly one every two weeks — at a 92% winning rate!
Nearly all of them were double-digit winners, with several paying out as much as four to five times our initial investment.
Ah, but those were the good old days, when the U.S. shale boom was young and the media had only just started to pay attention to the now-famous household plays like the Bakken in North Dakota.
Over the course of a decade, we saw U.S. drillers drive our domestic production higher by an unprecedented 7 million barrels per day!
In fact, crude output in the Permian Basin is poised to surpass our TOTAL PRODUCTION from 2008.
The EIA is projecting that Permian production will average 4.4 million barrels per day next month.
That’s 49 barrels of oil being pumped out of Texas soil every second.
To put a little perspective on that, keep in mind that this prolific oil play — which is officially the largest oil field on the planet right now — accounts for more than one-third of all the crude oil extracted within the United States today.
But here’s the catch: These aren’t the good old days anymore!
We’re more than a decade into the U.S. shale boom, and some investors are starting to get the Permian blues.
Some people have also correctly pointed out the slowdown taking place in the biggest tight oil plays in the U.S.
In the Permian alone, one prominent producer named Concho Resources has had to pull back a bit, admitting to drilling its wells a little too close to each other.
Simply put, investors can’t possibly expect to see the same kind of growth going forward.
It almost makes you wonder whether we’ve hit peak Permian.
And yet there are still those little gems to be found.
Matador Resources is one of them.
Shares of this driller are not only trading at around 10.5 times its trailing earnings, but this company has a knack for churning out profits in the Permian and has exceeded analysts’ earnings consensus 11 out of the last 13 quarters.
After watching Occidental Petroleum shell out an enormous amount of cash to acquire Anadarko recently, you can’t help but wonder who’s next.
I suggest starting your search for that next blockbuster sale right here.
Only the majors are looking past ten years. To be a player for long term, you have to be in the energy business, not oil and gas. To have real value, you have to have some survivability. Marathon and ConocoPhillips have some downstream, but that will only last so long. EOG has drilling in Tobago, wow. But, they are a good example. But, if I was a major, I’d look at them first. Probably expensive, but all the working parts are there. They list how many premium locations they have to drill, and their current annual. Less than ten years, it’s a dead duck. Oxy only has minimal downstream. A lot of pipelines, but they have to hold oil. People will still invest in energy, but they are fed up with limited capability short term oil and gas models. Shale is dead as a growth area. The majors will take over, and drag it out to be worthwhile.
And, I can’t imagine the other independents not seeing this. You’d have to be really slow. And, they have no capability of competing with an energy company. Golden parachute time?
And I think all of this is entirely logical thinking, which can result in nothing.
Of course, I talk about oil, and the response is about gas. There is more gas in Texas than the US can use in centuries. It’s flared because it is useless. Two thirds of the EF is gas . Has not been touched. Probably three quarters of the Permian is gas. There are gas fields galore left in Texas. We get 0 cents per mcf. It’s flared. But, it don’t make gasoline.
It’s not that wide from the coast – why no major is investing big into the LNG business.
With low production costs when they can sell low they can increase the whole LNG market and sell this stuff.
You can turn gas into gasoline by gas-to -liquids process.
GuyM,
The figures I have seen suggest about 6% of the Texas gas produced is flared or vented, though other figures from climate change activists suggest the number is higher. The 6% figure is from the RRC, sometimes their data is not accurate, but the same can be said of data from those with an anti-fossil fuel agenda.
Ron,
For the $100/b and constant completion rate scenario, this is what the legacy decline is each month in kb/d. For the $70/b scenario legacy decline is different after 2031 as completion rate decreases after 2031 in the lower oil price scenario.
Upthread coffee is making a big deal about EQT and how it is going to make major cash at today’s natural gas prices through some revolutionary processes.
Of course, Wall Street disagrees. EQT is at lows not seen since 2003.
Coffee previously touted a company called Eclipse Resources. It is noteworthy that a $10,000 investment in Eclipse at its 2014 IPO would be worth $77 today.
Low price sucks for corporate profitability and viability, but at this point the US nat gas production has not gone down due to corporate suffering. Rather production is at all time highs.
And if prices rose to 3-4$ average, I doubt consumption/demand would be dampened.
Thanks, Mucho for that NG Graph. IIRC The US was a NET NG importer till 2017. WHEN NG price Normalize we expect major growth in LOCAL PV Deployment. Hot water used to be Solar’s domain and it’s the best way to Store Surplus PV Power. Now you talk hot water budgets to anyone it’s “handled” by NG on-demand units. Surplus/Cheap NG/NGL’s has reduced PV Penetration. Is Auga Calantie a Right?
When I look at west Texas and southeast New Mexico (Permian basin) in Goggle Earth, I see large areas that are pin pricked with oil wells. This begs the question where the tens of thousands of new oil wells will be drilled? What areas hasn’t been significantly drilled yet?
The Permian is layered with formations. From shallow to deep. Most of the drilled spots showing are old shallow formations that have been drilled over 50 years.
Energy dominance think is rather Epstein..
https://oilprice.com/Energy/Crude-Oil/US-To-Drown-The-World-In-Oil.html
But doesn’t this go against the predictions that the industry is going to kill itself by running out of money to keep drilling?
Probably worth mentioning that if someone wants the price of oil to go up they might fund stories of the end of shale.
It’s generally a pretty good idea to believe more or less nothing.
Yeah right. It’s all just one big conspiracy by the oil companies, funding lies in an attempt to increase the price of oil. All those stories about shale drillers losing bundles of money and on the verge of bankruptcy is just a big lie. They are all making money hand over fist. /sarc
Haven’t we seen that it doesn’t matter if they are losing money? They haven’t been making a profit for years and years now. So how is that relevant?
The stories I was pointing at were those associated with an alleged difficulty borrowing. Or more directly, an outright decline in production we’ve been hearing is right around the shale corner for years now. Yet the curve is still up.
There hasn’t been a free market since Ben created 23% of GDP from thin air. You have to stop thinking in those terms. In fact, how can you possibly even imagine thinking in those terms when so much debt around the world has negative interest rates.
Just accept it. Capitalism failed and means nothing. Neither does socialism. Only barrels matter.
Global LNG oversupply
https://www.hellenicshippingnews.com/global-gas-market-to-be-oversupplied-to-at-least-mid-2020-rbc/
I remember 15 years ago, certain people were saying that oil and gas would be so expensive by now people would struggle to heat their homes and drives their cars.
The reality is natural gas is so plentiful and cheap that it is being flared off in many places because no one wants to buy it.
Who would have thought the price of coal, oil and gas would have plunged so low.
https://www.quandl.com/data/EIA/COAL-US-Coal-Prices-by-Region
https://www.rigzone.com/news/asia_lng_prices_in_freefall-05-jul-2019-159242-article/
I will not be buying my solar roof just yet
A new market will be Europe when they start the climate change rebuild of the energy sector in earnest.
Germany alone will have to replace round about 30 GW of capacity from coal and nuclear, other may follow. Cheap gas will be an incentive to speed up this.
But Germans want to buy cheap Russian gas, not expensive American LNG. As long as Russians can increase production, there won’t be market except maybe for a few states which dislike Russia, Poland for example, the country which must pay one of the highest prices in Europe for Russian gas.
I have been saying for several years now that peak oil is a low price phenomena, not a high price phenomena. Peak oil is about extraction prices rising faster than market prices.
There are two common responses to peak oil. One response is to think that scarcity of oil will bring about higher prices in which case one should invest in oil. The other response is to make adjustments in ones living style so as to depend less on oil. Once the majority of investors realize that the second response delivers a higher return than the first, peak oil will be history.
Yet your electric bill just keeps going up. Its a miracle I tell you!
SW- ” your electric bill just keeps going up”
Mine is stable, stable like output of the sun.
Thats because my electricity comes from PV panels that I own.
No moving parts, no middle man.
The American way.
Ahh yes, solar energy, the source everyone goes to when they think “stable”.
You guys crack me up.
Niko- I speak only for myself. Not other guys.
And yes, when I think of the
escalating electrical bill that SW mentioned,
I do think of how mine doesn’t do that anymore.
Starting exactly when I put PV into the brilliant sun beating on the roof above.
It is nice to be a miniature power plant owner.
Mine is stable as well. Zero. Every month. Because of solar. It doesn’t make me laugh. But it does make me smile.
Install 2 to 4 panels for when the gas is unavailable
Hey Dennis, could you write a post whether we already had a world peak of CONVENTIONAL gas?
OneofEU,
Data would be hard to come by. If we call “unconventional natural gas”, the shale gas produced in the US (which I have data for from 2000 to 2018) and use BP Statistical Review of World Energy for World Natural Gas output data, so far there is no evidence of a peak in World Natural Gas output.
Currently World conventional cumulative natural gas output is about 4600 trillion cubic feet. If we use a low URR estimate based on a Hubbert linearization from 2015 we would have a URR of 11,000 TCF. If we assume peak is at half of URR that suggests 5500 TCF for cumulative output at peak (this assumption may be incorrect). In 2018 output was about 115 TCF, which would suggest a peak in 8 years, output has been rising at about 1.4% per year from 2000 to 2018 (OLS trend line). If we assume that continues until peak, then the peak is reached in 7 years. Higher URR estimates would result in a later peak, for similar assumptions with a URR of 15000 TCF, the peak would be 2039.
So perhaps 2025 to 2039 for World conventional natural gas peak.
Thanks Dennis!
Yes, I have meant shale gas as uncoventional. It declines 20% per year, doesn’t it?
If it is 2025, it may be too late for a GTL mitigation strategies.
Qatar is not producing as much gas as was expected of them, less than 1/3 of Russia and that having nominally 70% of Russian reserves (could be mistaken here).
Unfortunately, I only have shale gas data from the US, not sure how much is produced in Canada, Mexico, or the rest of the World, so my very cursory analysis is likely not very accurate. We have better data on total natural gas produced. Note also that for oil the Hubbert linearization technique has tended to underestimate URR from 1998 to 2015, the same might be true for natural gas, so the 15,000 trillion cubic feet natural gas URR estimate may be better. It lines up better with the best estimate by Steve Mohr who wrote his PhD dissertation on fossil fuel estimates and updated the analysis in 2015.
Nevertheless, conventional gas may have a peak in 2025 since in Russia the giants, the ‘Ghawars of gas’, are all declining, the new fields are not so big, and around 100 bcm is associated gas from oil production, which is to set into decline after 2022.
EU, Norway, Algieria – in decline too.
So conventional gas growth depends on Qatar and Turkmenistan (Iran is not really a gas exporter). Maybe Australia, too.
Perhaps the peak will be 2025, though if prices increase there might be more development of reserves and the peak could be later, my best guess is 2035+/-5, doubt it will be before 2030.
https://seekingalpha.com/article/4287471-consequences-tighter-u-s-crude-fundamentals
Cushing is dropping like a rock,
Dow 30
25,777.25
-474.99(-1.81%)
Not only Cushing—
Harpo Trump is tweeting his horn, again.
So how long were we to tolerate China’s abuse?
Pick a date. How long?
Yes, there are limits. At some point you just have to pick up that hammer and start hitting yourself over the head with it.
Yes. Weird bouts of insanity are frightening to everyone. Friend and foe.
“Weird bouts of insanity.. ”
Well, atleast he has been consistent over the last 30 years, having these ’bouts’ every time he says anything that is not strictly teleprompted.
Consistency is the only positive attribute I have noticed.
Count me among the proud to be disloyal.
Disloyal? Hardly. The fruitcake has the nuclear suitcase.
With him at the helm, I am absolutely among the disloyal.
“With him at the helm”. One of my ex Navy veteran co-conspirators? He has a lot of resemblance to Captain Bligh.
A scary review of history. By 1938, a far right fruitcake, gained control in Germany. Everyone was afraid to call him a fruitcake. It snowballed. The fear to call him a fruitcake grew. He went totally nuts. He was no longer a fruitcake, but an evil SOB. Trump is a f???cnk fruitcake, and always will be. We are absolute idiots for electing him. End of story.
Orange is the new black
True GuyM.
We’ve got to get a lot better a spotting stupid asses, and would be tyrants. Tyranny can come from the right or left.
The signs were all front and center with this guy.
Incredibly disappointed and embarrassing for this country and the republican party.
Some guys, like McCain and Kasich knew it, and weren’t afraid. They were honorable, and very lonely in their party.
Can’t you guys see it in yourselves? Not one of you gave a date.
Jan 1950. Bit late now.
21 September 1949
For what. For forming an alliance of international trading partners to take on the abuses in a coordinated and sophisticated manner? Or for blowing up everything that smacks of international cooperation in order to cater to a Xenophobic Know Nothing base? Or can’t you see it in yourself?
GuyM.
Notice the large weekly drop in rig count?
Down 16 oil. Down 3 gas.
This will eventually result in lower production.
Shallow, increase has been going down, already. June’s monthly may be up (depending on the EF and the rest of Texas other than the Permian), but the trend has been going down. Review of August completions in Texas tends to confirm that. Rig counts have not finished dropping, yet. Permits tend to confirm that. OPEC, EIA and IEA predictions are way way off. We have entered the looong year of the inventory draw.
We have limitations for guessing where oil production is, based on slow and inaccurate reports by the States (Texas in particular). On the other hand, two months back, the EIA monthlies are as close to accurate as you can get. Where it’s going, is a lot easier. You have permits, and rig counts. Both are real time. And permits come first, rig counts are confirmation. In between, we have the horribly inaccurate completion reports, but they do give a trend. It’s going down. Production may remain flat from the May monthly, but not much more. And this simple theory will come closer to the truth, than any other projection.
And recovering from DUCs is a myth. There is always a number of wells between drilling and completion, these are real DUCs. There are a number of wells drilled, that based on core samples, etc., they do not see as profitable to spend another 70% of the capex to mess with, now. If these are not put into the completion category, they may never be. Dead DUCs. If completion crews are running behind, the usable DUCs go up. But, they are far from running behind now. So many of the DUCs are dead DUCs. And none of the companies own up to “dry holes”. And, technically, they probably are not dry holes, just not worth the extra 7 million to complete them. However, if oil goes to $100 a barrel, some DUCs may start quacking.
Regarding the Wells, Wires, Wheels article. I’ve been thinking about that thread as I am always running behind. At one point Dennis says there has been little actual argument about the model. True. So, okay I’ll bite. Here are some specific issues I have with the model used, particularly with respect to offshore wind. Hesitant to post this in the oil thread, but this was put forward as a rationale for $20/bbl oil so here it is.
The author Lewis chose a capacity factor of 50%. You can look up averages of different wind farms around the world. Most are in the range of 25 – low 40’s. Nationwide avg for UK, if you exclude a few low lyers, is close to 40%. Nowhere does the author state he is using a model of some hypothetical future super site. 50% is overly optimistic and not real world.
The author chooses a price of $1.8B/GW for offshore build out. Nowhere in the world has this ever been achieved. Look up the largest offshore windfarms, many built by an established team – often DONG using Vestas or Siemens turbines – London Array $2.4B for 609MW. Anholt $1.6B for 400MW. Walney, same $1.6B for 369MW. The $1.8B proposed by Lewis is overly optimistic and not real world.
Lewis also adds a “return” for offshore wind of 10%. Of course this is a banking industry product, so there must be a return. This is a one time return, apparently, because it is build into the model by multiplying windfarm cost X 1.1. Return, in regards to investing, is usually an annual return. You wouldn’t require a 10% return “no matter how long it takes.” Yet nowhere in the world has 1 GW of offshore wind ever been built in 1 year.
So the author has proposed a model all the metrics of which have never in the history of the world been seen, and for which there is no evidence that they can be. To show what a more real-world model might look like: use $3B for the cost, and 1.2 for the return factor of 2 years (best case) and you get 70/(3 X 1.2) = 19GW of capacity instead of 35GW. It doesn’t take much to move the needle. You can make other assumptions and it would only get worse.
To those specific comments, I would add that 35 GW of capacity is more than the current combined offshore wind capacity of all the wind farms in UK and Denmark combined, which have been built up over the last 20 years! So all the discussion we have about infill drilling economics in shale, and diminishing sweet spots, will apply to wind.
If the idea is that this will be done elsewhere, off the coast of Africa, or Argentina, or wherever, you will run into all the issues of greenfield development for everything. Building out the transmission infrastructure can cost 25% of the project costs and is not included in the above $3B (or Lewis’ $1.8B). Of course, the projects mentioned above were done, financed by, and ultimately owned for the benefit of the developed west. The standard model has DONG selling off 50% of the project to UK or Danish pension funds. Are the new African projects to be done for the benefit of the west? I sense higher transmission costs 😉 Or are the Danish people benevolent enough to fund the project for the benefit of the people of Lagos? Well, I can hear Lewis saying, let’s not get into those sorts of details.
Without a doubt, building offshore wind with an established team in the established markets with at least some existing infrastructure and knowledge will be the cheaper option. Also regarding capacity factor, larger taller blades improve the capacity. You can read what were the glowing predictions for Hornsea. Such farms will be more expensive to build, not less, than the existing.
So I put the whole thing down to a hypothetical exercise. Certainly it provides window dressing for these projects and their encouragement. And here’s where, in spite of my skepticism around the model, I agree with Fred. It must be done anyway, as quickly as possible, and who really cares what the costs are?
Good points Duane. Offshore wind, especially deep [meaning deep enough to require floating platforms] , is an economic concept that still needs to be proven viable.
Nonetheless, some companies are ramping up the experiment.
I think a big challenge will be reliability out in the salt and huge storms. How long can the equipment hold up?
But some locations have a massive resource to tap, and if it is viable, there will be a big industry build-out at certain port locations. This could be a huge job generator.
Here is a deep water project, that may be the first to get done on the west coast, with good explanation for what they are getting ready to do.
http://castlewind.com/morro-bay-project/
We shall see. I’m guessing it will be a decade before we have a strong sense of the financial viability.
A big part of that will be the price competition from other electricity sources. Strong or weak?
DuaneX,
For new offshore wind a capacity factor of 50% is reasonable. Solar has much room for growth and costs are quite low in good resource areas. The main factor which will lead to the EV transition is the low total cost of ownership of the EV compared to ICE vehicles. EV cost will continue to fall to the point where ICEVs no longer make economic sense. That is the part of the argument that especially rings true. Likewise low cost for wind and solar will keep electricity prices low, if natural gas scarcity causes electricity from natural gas power plants to rise, the transition to wind and solar will accelerate.
The newer huge turbines, like the GE 12 MW Haliade-X
when placed on the big towers in the windy locations, are indeed capable of CF of 50%
I had to erase from my mind the old CF numbers, that have come from smaller units on shorter towers.
https://www.ge.com/renewableenergy/wind-energy/offshore-wind/haliade-x-offshore-turbine
Yeah Dennis & Hickory, 50% is certainly possible, but not for $1.8B for 1 GW. Not on this planet.
I too think this price/GW is ‘optimistic’.
But I’m surely not expert on it.
It is going to be hard competing against Nat Gas, at least for the countries that have plenty of it.
Hi Dennis,
This is a clip from Sky news Australia labelled:
‘No way’ renewables are cheaper than coal.
https://www.youtube.com/watch?v=0dQmaAbr9_M
Please have a listen if you have the chance. Thanks
Efficiency works, conservation works, being frugal works, changing diet works. All those work now.
As yet we have no reduction in GHG or energy from PV and maybe a smll amount from wind turbines, that gain is in the future.
Still, we must proceed with the renewable energy buildup, especially PV and wind due to massive other factors in the near future. However, to do it fast will have a large energy, pollution and ecosystem cost.
Best to do it over a longer period of time and institute all the measures listed in the first sentence. Of course all those measures will decrease BAU and the economy plus fly in the face of legacy industries, so expect resistance.
https://www.rigzone.com/news/a_2019_permian_output_surge_may_impact_oil_prices-23-aug-2019-159607-article/?amp
EIA projections. Someone help me out here. They are projecting a 1.75 increase from the fourth quarter of 2018 to the fourth quarter of 2019. Yet, even by their monthlies, that increase was only slightly over .1 to May. Amazing ?
Their monthlies are as good as gold. Their projections are weird.
Notice Rigzone does not take exception to it, and even questions EIA’s lowering of 2020. None of these companies stand to gain if expectations are lowered. Hence, anything put out by them in the coming months are going to be close to reality.
Prices from here on out are dependent on the EIA bullshit. Until inventories drop. Even that will be hard to measure if UK drops their emergency supply by a half.
Prices from here on out are dependent on Central Bank bullshit and White House bullshit. Last two times FED hasn’t delivered Trump came out within 48 hrs and escalated trade war. This isn’t a coincident. Prices were going to fall on not enough central bank dovishness anyway. They just fell further because of Trump’s tweets.
Without the central bank put under markets oil is going to $20’s But with coordinated easing $70-$100 oil is reality again. Tight supply isn’t going to push oil back to $70-$100 when there is absolute chaos and a US president telling US companies to find somewhere else to do business other than China.
If China can’t sell enough goods to the US and Europe Their current account deficit goes deeply negative. Which really only means they will devalue their currency in a big way. Which means more tariffs more escalation.
Oil scarcity deaths will show up in the form of War before the majority realize we are really fighting over who gets control over what is left.
HHH,
Difficult to predict, but my guess is that a $20/b monthly price for WTI is highly unlikely before 2035. The futures market does not see what you see, basically $50/b and higher (close to $54/b) all the way to Dec 2029. And yes, the futures market usually does not get long term prices right. Tight supply will always win out over political BS in my opinion.
I’d put odds on $70/b or higher by June 2020 at about 66% and $20/b at about 0.1% for monthly average price in June 2020 for WTI crude.
Dennis,
You realize if the central banks of the world don’t put a put under the markets that equities go back to their 2009 lows and just keep falling right? And so does the price of real estate. Without CB intervention oil goes to zero because of deflationary collapse. Global bond market would also implode But they will step in. It’s a matter of when not if. But they might just allow a large correction lower here before going all in again.
I put odds on $20’s before the end of 2020 at about 80% if the FED and other central banks haven’t stepped in an gone large on the QE by that date.
And if they do go large on the QE by June 2020 we should see $80-$100 oil by years end.
We could even see $20 and $80 oil in the same calendar year if the they wait till mid year but go really large with the QE.
Ultimately the FED and other CB’s have no choice. Everything and i mean everything rides on asset prices going higher from here on out. A whole generation retirement counts on bonds retaining their value and equities increasing in value.
I read a figure that the US has 94% of all investment grade bonds in the entire world that still have a positive yield. Wonder what happens when the majority of what is left also goes negative?
Nothing perhaps. But would you invest in a shale oil bond that is not investment grade if it had a negative yield? That is the direction we are headed. Where do pension funds and insurance companies get their yield when the rest of what is left goes negative?
HHH. What happens if the IMF takes up Mark Carney’s idea of going away from the dollar?
Have heard some farm commodity experts say this would be bad for US economy overall but good for commodity producers as dollar would sink and inflation would take off in US.
Trump is very fortunate farmers are generally socially conservative. Has been a lot of talk that Farm economy would be better without him, but there are “way of life attack” worries with many in the Dem field.
IMF is funded mainly by dollars. IMF only has power because it is allowed to have power by those who fund it. Trump or any other acting president can defund it. Meaning no US tax dollars go to supporting the IMF. And no matter what it does. Most of the debt is and will still be denominated in dollars.
Bitcoin and all the other crypto currencies and the Libra used on facebook are dollars exchanged for credits at a certain rate. No different than exchanging dollars for some other currency.
When people exit their trades they get dollars back. Don’t matter if it’s a cryptocurrency or oil and gas. A very, very small amount of stuff gets traded without dollars.
Who in their right mind would want yuan,or euro’s in exchange for oil. What is Russia going to do with all them yuan. They got to exchange them yuan for something else. If not dollars then something else. And that is a fools game. Because if it isn’t something that will hold value then. It’s best Russia not sell it’s oil and gas at all.
When the IMF loans countries like Argentina or Greece money what currency are those loans denominated in? What currency does the IMF expect to be paid back in? That is why these countries would be better off not taking those loans. Because their central bank can’t print the money needed to pay off the loans. Which is also a fools game. Lending money out that you know can’t be paid back just to keep the game going a little longer.
IMF might have the power to print money. But that doesn’t mean that the money they are printing will hold value or even be accepted as payment.
What i’d be most interested in is how the IMF would go about issuing debt in it’s own currency or SDR’s. Would there be bonds sold and if so what would the interest rate be and would these bonds have negative yields on them from the get go or would they offer yield at least for a little while before they go negative. IMF would have to have the power to tax every single nation using it’s currency also.
I don’t see a world currency going over too well. Even though globalist like Mark would love it. Nobody wants to give up control over their money to an outside entity.
My question is what happens if the dollar is no longer the reserve currency.
No idea what replaces it, but it appears the Europeans, Chinese and maybe even the Russians would like to see and end to the dollar reserve currency status.
As the zero hedge article says, not long ago this idea was considered conspiracy theory. Now you have it being seriously spoken about in Jackson Hole.
Its a only matter of time.
Erratic behavior by this countries leadership in its relations with other countries serves to accelerate the process.
The great advantages we have had over other countries since the 1940’s in the USA continue to expire. And the competition from much more highly motivated peoples really pisses us off.
The loss of the dollar as the ‘reserve’ currency will be huge.
HHH,
If there is a financial crisis central banks will act. Much of the uncertainty is due to Trump, we might survive a second Trump term without another financial crisis, but a second term for Trump might be a disaster.
GuyM,
At least for tight oil from 2018Q4 to 2019 Q2 the increase was about 344 kb/d based on EIA’s tight oil production estimates by play through June 2019, if that trend continues we would have only 688 kb/d for the Q4 to Q4 increase from 2018 to 2019 for US tight oil. There might be a bit of an increase in GOM output, I doubt it will be over 1000 kb/d, but perhaps 200 kb/d might be reasonable.
Hi Dennis,
The EIA tight oil estimates are bull like their drilling productivity report. This is easy to show using their own data:
Per EIA monthly info: Dec 18 May 19
US bbl per day (millions) 12.037 12.108
less alaska -0.496 -0.474
less fed offshore(3) -1.906 -1.904
net lower 48 9.635 9.730
less tight per eia tight estimate -7.209 -7.534
net conventional 2.426 2.196
So as per above using EIA nums conventional has declined 10 percent in 5 months, and that didn’t happen. Clearly their nums are wrong somewhere, and to me it looks most likely to be their tally of tight oil. Its either that, or their monthlys are busted.
Monthlies I beat on for over 3 years to find some fault or inconsistency. It ain’t there. They are accurate. The only thing that EIA puts out that has any accuracy. That tight oil estimate is BS. And tight oil is not the only US output, obviously. Dec Texas production from the monthlies is 4896, and May is 4972. NM is up about 70, and ND is down some, Okla not looking so hot. That’s the tight oil real story. And past June it’s not going anywhere. Unless Texas producers take a very risky bet of completing wells before they get permits. That the Permian can still see some growth, I can buy. It’s the other plays that will hold tight oil growth to a crawl. Look at the latest rig counts. And, the July permits indicate the first of the year production in the Permian will see no growth.
DCLonghorn,
There is no doubt that the numbers are not perfect. If we look at L48 onshore conventional it was 2154 kb/d in July 2018, increased to 2330 kb/d by Nov 2018 or by 176 kb/d over 4 months, then output declined by 145 kb/d from Nov 2018 to May 2019 (6 months). Maybe its like gravity (for a baseball), what goes up must come down. These are the only tight oil estimates we have for the US and as I said they may be imperfect.
I get 9622 for L48 onshore (I subtract all Fed offshore, not just GOM) in Dec 2018 and 9719 for May 2019. Tight oil is 7316 in Dec 2018 and 7534 in May 2019. Conventional 2185 in May 2019 and 2306 in Dec 2018.
Could conventional output rise by 176 kb/d in 4 months (7.8%)? If the answer is yes, then a decline of 6.4% over 6 months does not seem unreasonable.
The monthly rates would be roughly 1.3% per month for the rise and 1.1% for the fall in conventional output.
Thanks Dennis, I see that I picked up the Nov 18 num instead of Dec 18 for tight. Oops. Even with the corrected nums it still looks off to me, certainly not as far off.
An annual decline rate of 12.8 for conventional is reasonable?
GuyM,
After an increase of 10% in conventional output a fall in output by a similar percentage when the completion rate drops is reasonable.
The conventional wells also drop more steeply when new as the well profile tends to be hyperbolic rather than exponential.
The decline rate is not constant when there is a sudden drop in drilling and completion rate. When oil prices dropped last November, both the tight and conventional completion rate dropped from the November rates (which were near the peak).
The trend will not continue, my guess. I put US up by 200k by June, and there it slows down to 0 growth through January. Juries still out on after, but I don’t see much regardless of oil price. We diverge 100k to July. It’s after that there is the big difference. You can’t squeeze out more completions than what the RRC has permits for. Unless, you believe in the unicorn of DUCs.
GuyM,
How long is a drilling permit good for? By my estimate there are at least 10,500 oil and oil and gas drilling permits that have been granted from 2013 to 2019, but have not yet been completed. That is more than the total oil completions reported for 2018 (8588). The extra permits that exist make interpreting trends in permits difficult in my opinion. Rig counts are probably more useful, but in that case the well can be drilled, but waiting for frack crews.
You have two years in Texas from permit date to spud date. But that can be amended.
Guy
I think this is from the August STEO and includes C + C and NGPls.
Dec 18: 12.04 + 4.48 = 16.52
Dec 19: 12.95 + 5.27 = 18.22
Increase 1.70
Note that the author is a non-believer in Peak Oil and this is just trying to make his own case. Technology will always find more oil.
And, it is horsehit. It is nowhere close to the monthlies. Big problem for EIA. They give numbers from a variety of horseshit. Take what you think is real. The monthlies are reality, everything else is dog doodie.
EIA and Rystad sees a huge increase in shale from permian L48 as new pipeline will be ready that will send oil to the Gulf and to be shipped. Seems there might be lots of wells ready to be shut in and produced millions of barrels. Than they believe the majours will invest as the shale play can continue as before. I have worked for Conoco Philipps and O very much doubt they will invest huge amount in shale when they already know thoose funds could be invested offshore abd they might get 10 x that profit after 5-10 years. Guyana is a good exsample , there are also others. The best for US shale is to scale down to what is profittable with oil price WTI 75-100 usd bbl. Than profit could be used to pay dividend and also build prosessing plant for gaz that now is burned and create a dirty indistry with high polution factor.I believe the owners of the majours will stop this madness that only destroy values and investors runs away as they dont see any dividend or resonable profit of their investment.
https://oilprice.com/Latest-Energy-News/World-News/US-Imports-Mostly-Heavy-Crude-As-Light-Oil-Production-Booms.html
Mmm! We are using in US production more of the Permian than I thought. 55% of production was equivalent to API of Permian. And, that percentage is likely to improve as Exxon an Chevron complete new downstream projects. That’s why we are exporting a shitpot of lower API from Cushing. Which cant possibly continue as we drain lower APIs. Ok, explain to me again, why the majors are making a mistake in the shale plays? They are all over the place, and the independents are sucking wind.
If, and when, exports pick up, its drain time for inventory. And, none of this would work, if we were not desperately short on oil supplies.
Nobody can see it, anymore. Bullshit is the rule of the day. But, supply/demand still works for necessary commodities. Eventually. Just get past the stupid assed traders. And, they’d are dumber than hell.
In short, inventory drops, plus demand over supply, will equal higher prices. Or, I’m stupider than hell.
Good price for Brent is probably $80. Good price for WTI is probably $75. Eventually they will pay the price. Depending on desperation. Anything less, will only increase the spike to unbelievable proportions.
Latest US crude oil production forecast from IEA OMR Aug 9 page 23
http://www.iea.org/media/omrreports/fullissues/2019-08-09.pdf
IEA is forecasting a 2.0 mbd peak crude production plateau for Gulf of Mexico in 2020.
IEA is forecasting total US crude oil production to increase from 12.1 mbd now to 13.6 mbd at end of 2020. That huge increase of 1.5 mbd is due mainly to increasing shale oil production.
Well, at least IEA is looking at the monthlies. There was a six month increase of .2 to get there. Normal extension would be a .6 to 2020, not 1.5. I personally don’t think it will get to .6, but still reasonable. 1.5 is not reasonable. For the matter of estimates, Dennis estimates are reasonable. I don’t think they will get that high, but they are within reason. Just wish he would quit relying on EIA data. Hate their BS. Keeping prices down unnecessarily low, but it will backfire.
It will all play into OPEC’s hand. When prices go up, Trump will tweet, and OPEC will reply, quite reasonably that it’s all EIAs fault. Not OPEC’s . OPEC always knew trump would use EIA to keep prices down. It will backfire, big time. Prices in limbo, until the third quarter of 2020. I give it that time frame, because by then, even a moron can figure it out. Including traders. By then, Dennis’ projection of $70 for WTI would be wishful thinking.
And by then, will US shale production start increasing at a higher rate? My bet is that not enough independent will survive. Big oil doesn’t give a shit. Upstream to downstream profits, that’s what matters. And, they will make a killing.
And to get to this point, we will need zero demand growth in 2019 and 2020. Which, of course, is not going to happen.
And Trump will lose his re-election bid, because he is dumber than a rock.
If he sounded the alarms, now, then he could stand a chance. Next year, would only highlite how enept he really is. Unless, he fully accords the blame to Perry, which I fully expect. But, he’s the one who appointed him.
All this stuff is political. If you haven’t figured it out by now, what can I say?
There is one other option which may happen. Projected increases in 2019 and 2020 did not happen, yet EIA reports they will still happen for second half 2020. Ok, if the world is that dumb, and buys into it, then they deserve anything that comes after.
GuyM,
To clarify, you don’t think the EIA’s tight oil production estimates by play are accurate?
What do you use to estimate tight oil output, the monthly estimates don’t break out tight oil to my knowledge? I agree those are best, but aside from that we have shaleprofile.com (which is typically several months behind and only covers some of the tight oil plays, data only good through Dec 2018 at this point) and the NDIC. RRC data is relatively useless unless one wants to use 12 to 18 months back in time.
Drilling info data is imperfect, but is the best we have for tight oil.
Can somebody explain to me why China can’t pay for Russian oil by selling Russians Chinese steel,televisions, computers, trucks, construction machinery?
I can’t really see any reason why they can’t trade with each other, using each other’s currency, so long as they have an agreement between themselves, other than that the USA and other countries may create some difficulties for them, to discourage their doing so.
So long as records are kept, not very much actual cash, or money in checking accounts, need change hands. Maybe every few months, you settle up any difference in cash.
I’m not saying money as such isn’t an incredibly useful tool, but rather that like just about any other tool, there are ways of getting the work done other ways.
The Chinese in my estimation see the world in terms of THE BIG PICTURE, and plan on putting China front and center in that picture, long term. I don’t see any reason why they shouldn’t succeed, other than that they simply fail to succeed. As the poet said, “The best laid schemes o’ mice an’ men / Gang aft a-gley.”
They seem to be PROACTIVELY planning and working, to get what they want.
The USA seems to be only re actively planning and working, to just hang onto the status quo.
If your a Russian oligarchy would you want tv’s, cars, trucks or whatever else? Things that you have to sell. or would you rather have cash?
China won’t be succeeding due to resource depletion. And it isn’t just their oil that is depleting. Coal will be a far bigger issue for China. They depend on it way more and i mean way more than they depend on oil. How many solar panels and wind turbines would it take to replace their current use of coal?
Last i seen the Asia Pacific countries consume about 26.7 mb/d of oil more than they produce. What happens when oil no longer flows to certain countries in this area. And they are forced to make due with what they produce? What happens when Russia starts sending what it does have left to say China instead of Europe?
Europe also happens to be a big consumer of Chinese products. If Europe is hurting due to lack oil and gas then Chinese exports are also going to be hurting
It’s going to be a powder keg.
If your and oil producer like Russia or any of the OPEC countries. When your available exports start to trend down. You end up spending the profits you made during the goodtimes.
Hint:
https://en.wikipedia.org/wiki/List_of_countries_by_GDP_(PPP)_per_capita
“If your a Russian oligarchy would you want tv’s, cars, trucks or whatever else? Things that you have to sell. or would you rather have cash?”
If you are the oligarch, and you are as smart as the ones running Russia today, you take the goods, and distribute them among your supporters in particular, and raise the standard of living and the productive capacity of your country as a whole.
The richest emperor in history, two centuries back, would be helpless if attacked by a two bit military modern country such as say oh, Mexico.
Power and prosperity and longevity are best assured by being in charge in a modern, prosperous , powerful country.
There’s a hell of a lot to say for international trade, but in actual fact, any really big country with sufficient material resources can build and operate just about any kind of industry domestically. Personally I believe it’s a HUGE mistake to think any really big and powerful country is NECESSARILY dependent on any other particular country for any thing, in the long term, unless it’s a particular raw material.
We did nearly all our own manufacturing here in the USA until well past the fifties, and were actually more secure, and much less troubled by income inequality, welfare fraud, working class people taking up a life of crime, etc, back then.
“China won’t be succeeding due to resource depletion. And it isn’t just their oil that is depleting. Coal will be a far bigger issue for China. They depend on it way more and i mean way more than they depend on oil. How many solar panels and wind turbines would it take to replace their current use of coal?”
Maybe. Germany is in a worse position, in my opinion, in respect to resources. Do you expect Germany to fail for this reason?
As to their dependence on coal, I don’t think ANYBODY is in a position to force them to give it up, given that they are a nuclear power.
And maybe they will be in a position to pay the Russians more than Europeans, in the future, for oil. They certainly won’t be wasting it the way we Yankees waste it, and they will get more value out of a barrel than Europeans, as likely as not.
And as far as manufacturing solar panels go, I believe they can manufacture them in any quantity, limited only by the actual availability of raw materials, starting within the next decade or so, because the entire operation from mining to distribution is fast becoming ever more mechanized, and they already have engineers, computer programmers and machinists and machine tools by the millions.
I do agree about the powder keg.
And you may be right. I could be all wrong. I’m throwing out ideas as much as advocating any particular position, or predicting any particular outcome.
“There’s a hell of a lot to say for international trade, but in actual fact, any really big country with sufficient material resources can build and operate just about any kind of industry domestically. Personally I believe it’s a HUGE mistake to think any really big and powerful country is NECESSARILY dependent on any other particular country for any thing, in the long term, unless it’s a particular raw material.“
OFM,
With the globalisation that there is nowadays, parts and raw materials from close to everything come from (almost) all continents. Back in the oildrum days there was an article published regarding this matter; even for something simple as bread the ingredients come from several continents. A very complicated situation the world has fall into ! No problems without trade wars and scarcity of whatever is needed.
I agree that no big and powerful country is necessarily dependent on any other country, but China has seized more than 90% of rare earth elements in the world, if what I read more than ten years ago is correct. It seems an exaggeration, but certainly they buy stuff and land wherever they possibly can buy.
“You miss 100% of the shots you don’t take.”
-Wayne Gretzky
And China is trying more than anyone else. For obvious reasons, with population more than 4 times that of the U.S.
Regarding this not very surprising that Trump is kind of desperate and does absurd things like offering to buy Greenland
From a Wall Street Journal op-ed piece. It summarizes why we don’t know what we are doing.
“China has cut its imports from the U.S. but increased its imports from elsewhere. China’s exports to the rest of the world are also growing.
No wonder China isn’t in a hurry to make the major concessions Mr. Trump has demanded. It isn’t even clear what concessions would get the U.S. to settle. One set of Trump administration demands is the ‘shopping list,’ insisting that China purchase more U.S. products like soybeans and Boeing jets. Another set is that China change its economic model, relying less on state-owned enterprises, opening more to foreign direct investment, and honoring intellectual property. A third set, regarding alleged national- security threats from companies like Huawei, has moved in and out of negotiations as the administration has sought bans on Chinese technology.”
How about the set that says the perpetual trade surplus they run with the US stops. How about that one?
No one that matters, that is white males in Wisconsin, Pennsylvania or Michigan, care about point scoring granularity. They take the President seriously, not literally.
End the trade surplus. And stop buying oil with pegged currency while you’re at it. You notice only this president has demanded an end to the currency manipulation? Why is that?
Something wrong, been trying to post something on oil consumption in I n d i a, it’s not appearing, no error message, just nothing appears.
didn’t expect this to appear
If we make Chinese goods expensive enough and we go into a recession, that surplus will likely drop. The outcome might be worse than having the surplus.
Funny thing is if they ended the peg, ended the manipulation. The yuan would probably devalue by 50% to the dollar. Not really what Trump wants is it?
My guess is if your Russia and are accepting yuan as payment you’d also not be too fond of a 50% devaluation of the yuan to the dollar.
Therein lies the danger of accepting any other currency other than dollars for oil.
If you are accepting Euro’s as payment as i understand some middle eastern countries have. What happens to those Euro’s when Italy decides to leave the Eurozone and ultimately all Eurozone countries go back to using the currencies they used before the Euro was created? it’s a fools game accepting any currency besides the dollar.
British pound. is a joke. Might as well put them right behind Mexico on the list for potential failed states going forward as their oil production shrinks all they’ll be able to do is print money and hope someone accepts it. Mark Carney has really got bigger problems on his hands and should be focused on that instead of a replacement for the dollar. They might have financial institutions that Mexico doesn’t have but they won’t be able to save it.
Japanese Yen is not a safe haven. It’s a funding currency due to low yields. I guarantee to you if energy resources stop flowing to Japan their currency has no value. They have to import their energy needs. If for any reason their currency is not convertible to dollars they can’t get what they need to just keep the lights on.
Also, Watcher, if money doesn’t matter, as you have suggested, does a surplus matter?
Hi Han,
I totally agree that any country extensively engaged in international trade in many or even most manufactured goods is STUCK with the status quo due to not having the capacity to produce all the necessary stuff to keep the economy on it’s feet NOW……. BECAUSE of that very same international supply chain.
It’s cheaper, because things can be done on greater scale, and it’s good,at least for most people, in terms of their personal living standards.
It’s a fucking disaster for tens of millions of people who live in richer countries who have seen their jobs exported to places wages and salaries are less. I have numerous neighbors who were making enough to send their kids to university working in furniture and textile plants, enough to build brick houses, enough to buy new cars, etc. They’re RUINED, economically, for the most part. Retraining them for high tech careers isn’t happening, and it isn’t GOING to happen.
If you want to know why TRUMP is the president of the USA today, that’s ONE of the most important discrete reasons. I live in a place where people who were gradually working their way up the economic ladder in furniture and textiles in particular got a hard dry fucking that put them on welfare… by the hundreds of thousands, by the MILLIONS.
Let me tell ya, my friend, they don’t need cheap Chinese toys and appliances even one tenth of one percent as badly as they need back the JOBS they lost, along with the insurance and other bennies that came with those jobs.
Enough of them vote to keep any politician who promises to keep jobs home in office in their states.
Of course lots of international trade is good for keeping the peace as well.
BUT it’s no more NECESSARY to depend on such supply chains, except short to medium term, in a country the size of the USA, China, India, Brazil, etc, than it’s NECESSARY for American farmers to hire imported seasonal laborers, or permanent immigrant labor. We used to build all our own furniture, and make all our own clothes, and our own automobiles, and damned near everything else that really mattered, domestically, here in the USA.
Farmers can and have and are changing their operations to get along fine without imported help. An ABRUPT transition would be a hell of a problem, a gradual transition, no problem at all, and we the PEOPLE of this country would be considerably better off, if we were to make that transition. People at the bottom of the economic ladder would be paid MUCH better, in relation to people WAY better off halfway or farther up that ladder, and income inequality is one of the biggest problems in this country today.
The biggest single cause of it is that we have a shortage of bottom of the ladder jobs, and a surplus of people who need them, enabling employers to pay peanut wages. I KNOW about automation, no lecture needed. Automation is why we don’t REALLY need imported farm labor, medium to long term, automation will enable us to use far fewer people on farms at harvest, etc.
If people making good money pay another dime for chicken by the pound, another nickel for apples by the pound, etc, all the people at the bottom of the heap could be paid twice as well. Of course they won’t be, unless for some reason employers can’t hire enough help at peanut wages. Employers pay as much as they HAVE to, pretty much period.
Of course the imported workers would be worse off, not having that income.
Anybody who actually KNOWS shit from apple butter knows that IF we had the will to do so, we can get along fine in the USA, without importing a DROP of oil, by electrifying our transportation, going to trains, tightening up building codes etc.
Virtually all the better informed regulars here say occasionally that if we had put the treasure, never mind the BLOOD, into energy efficiency and renewable energy that we have spent over the last thirty years or so on protecting our access to oil, we wouldn’t even need half of what we produce domestically, etc.
Have you ever WONDERED why Germans are so gung ho about going renewable? I have had the opportunity to speak to a couple of Germans, personally, and they don’t mind admitting, personally, that they are having a hard time sleeping, knowing they are dependent on imported from Russia gas and oil.
The fact that the Chinese have a near strangle hold on the rare earth supply is NOT due to their having all the ORES from which these elements are obtained.
It’s partly accident, partly pure economic accident, that they get them as by products, because they run other mining operations, but it’s no accident at all that they have been selling them CHEAP ENOUGH to make sure other countries don’t mine and refine their own.
We sure as hell SHOULD be mining and refining such metals, because sure as hell history ain’t over, and there’s a very real possibility we may at some point be wringing our hands because the Chinese simply cut off sales. Allowing any country that’s a potential enemy, or even a good friend, to have near total control over such strategically critical resources, if it can be prevented, is criminally STUPID. As stupid as stupid can get, as stupid as shutting down the Pentagon. ( I believe that the military budget NEEDS a severe pruning, like maybe a tenth, right away, and up to half or more, gradually. )
It’s ALWAYS been a DARWINIAN world, and it’s STILL a DARWINIAN world, and will probably always be a Darwinian world, although there’s some hope that we can learn to live together without fighting another so called WORLD WAR.
Various countries built empires in the past by way of the sword and the gun. Today, the Chinese are building an empire by way of simply buying it, as you mention, taking ownership of farmland, etc, by the tens of thousands of hectares.
This is not apt to end well.
OFM,
That’s a clear report.
Germans having a hard time sleeping: I think the minority still. Guessing 15-20 % although I don’t live there. Have lived in Holland and since 1992 in Curaçao.
Han, Germans sleep very well. Deeply in the corner of their souls they still cherish the idea that they are somehow superhuman and thus immune from catastrophes that others must succumb to. Or, in their own words: ‘Wir können alles außer Türkish’/ We can do everything except speaking Turkish.
I lived once in the Netherlands too.
How is the cost of living and life quality in Curacao now? Was considering living there once. It is still a part of Netherlands? They had a lot of problems with their ABC Antilles…
OneofEU,
Ja, und “Wir schaffen das”.
Cost of living is high, especially healthy food is expensive. Almost everything has to be imported. Life quality is ok for the ones with a job that pays fairly good or for the pensionados that have a good pension. Curaçao became an autonomous country within the Kingdom of the Netherlands on 10/10/2010
No one really needs the Germans ? But they are famous for their innovative and excellent Maschinenbau. For many decades to come they will keep on producing high quality ICE cars too, though less in number.
Where do you live in Germany ?
Heidegger’s city.
Yes, “Wir schaffen das” is the expression of the same mentality (NOT reality).
Innovative? Don’t think so any more. I think Germany is a country in stagnation, in many ways. Siemens ICEs have no competition, and that’s bad, they are a bit unstable (speaking as a passenger), and too loud sometimes. Personally I prefer TGVs, which have a separate engine wagon, even though TGVs are more cramped than ICEs. Here the German article, which could be summed up as ‘Because ICEs are not perfect, airplanes are better’; it is also an interesting example of another facet of German mentality: it demands perfection, and when such is not delivered, it is a reason for ‘Wut’ (rage). Germans can fly into a rage fast.
https://www.faz.net/aktuell/rhein-main/frankfurt/hoellenritt-im-ice-was-auf-zugreisen-schief-gehen-kann-16353170.html
Japanese technics is even better, in my opinion; the Japanese have a knack for constant improvement, and are very good at miniaturization. They were first to develop hybrids, too; Germans are far away in their complacency. It may be a reflection of the fact that Japan must sell in the open market, whereas Germany strategy is to sell within dependency frameworks shaped by politics, EU being a prime example, but Russia too (well, it is the Russian trade strategy as well). Germany, the biggest EU country and the biggest EU industry, really gains from the fact that most of EU projects must be sourced from at least a few EU countries.
Yet the last years brought a series of failures which put into question the famed German devotion to quality and competency: Berlin airport BER, Heckler und Koch guns, VW, “Gorch Fock” unfinished renovation already costing 6 times more than building the ship….
Nevertheless, the myth of German engineer persists; trying to make a German aware of peak oil, I sometimes hear “Aber der deutsche Ingenieur…”
So Curacao status is now something like Greenland in Denmark?
Is living in Curacao more expensive than in Germany? Which language is most used there?
Freiburg !
I wrote ICE, to say the conventional cars, not trains.
High quality cars.
Something like Greenland in Denmark, yes, and with own government.
Most food is much more expensive here. Some things, like labour costs and gasoline/diesel is cheaper.
Yes, I do.
Where does it come this faith in the magical power of Germany? I hope you are not one of those claiming that Germany should win WWII because it allegedly had a best tank, Tiger. Germany’s almost the last resource left is lignite, China likewise (China has more, and rare earths too). Germany’s resource position is tragic: let’s start with basics, the country does not even produce enough food for Germans. Unlike Saudi Arabia, though, it does not produce anything anyone really needs. Thyssen imports both coal and ore for their steel works. The biggest German industry is car industry: who needs that now? Where is lithium if this industry is to change? You always get excited by subsidized German windpower but never mention new lignite projects there. Hambacher forest, anyone visiting?
https://hambachforest.org/
Germany is surrounded by former enemies, which shapes unpleasant dynamics of master-slave relationships, not partner relationships. Everybody is waiting for Italy to jump off the ship and break the now German leash, Euro. In many respects, Germany is like Japan (but Japan, as an island, is easier to ignore), and would be in Japan’s position, had it not captured European markets flows with the help of Euro and EU. As the old saying goes, “Germany is too big for Europe, too small for the world”. There is a deep truth in it: you are a prisoner of geopolitics.
In the world of oil scarcity, which will be the world where EV production surges, it does not make sense to bring lithium to Germany, build there a car, and then take it back to a lithium place. Paraphrasing Tacitus words about the secret discovered in 69 CE, the year of the four emperors, “the secret of empire”, arcanum imperii
(that you can become an emperor not only in Rome; in other words, a rebel may become an emperor too), Germany’s secret is that it does nothing what anyone would really need. No one really needs Germany, and Germany does not need really Europe: the resources it needs are in Russia and Africa, Europe being essentially a burden to be subdued and managed. Both world wars proved that.
Want a clear example of this logic?
WWI ended one month after Bulgaria had capitulated, which had cut off German supply lines to the Black Sea area and Turkey. Prior to that, a sudden switch of Turkey to Central Powers in 1914 (triggered by Churchill’s most clever idea of seizing battleships built for Turkey), prolonged a war by a year or two at least. The Allied strategists really should have seriously (not Gallipoli way) got interested in the south front much earlier. And do not allow Winston there, of course. Well, at least he learnt and in WWII proposed invading Balkans instead of Italy.
It’s very early, but there is a lot of forecasting guidance sending the new tropical storm Dorian into Florida and then possibly into the Gulf. That’s a week out. Could be a real mess to start September.
Ron, Dennis,
When will there be a new open topic thread?
Some of the political and environmental stuff, too much, is here. I’m as much or more guilty as anybody of course.
Iran says it has sold oil from tanker released by Gibraltar
https://www.reuters.com/article/us-mideast-iran-tanker-oil/iran-says-it-has-sold-oil-from-tanker-released-by-gibraltar-idUSKCN1VG0O0
Something is broken. I remain unable to post an item from a state refinery in southwest asia.
No idea why this appears and it does not. Attaching it here:
Indian oil consumption growth: Chief honcho of state oil refinery company says numbers to date (late June this year) suggest consumption growth 4.5% with gasoline and jet fuel increasing 8% and diesel at 3%. LPG up 14%.
He says his estimate has uncertainty in it because there was an election in July and it was expected there would be frantic travel by political parties, but how much he could not know. He called his 4.5% number conservative.
Last year’s consumption growth was 5.9%.
It’s pretty clear that despite talk of weaker economy, growth isn’t going to stop. Population growth rate is over 1%, and their life expectancy is an astonishing 68.5 yrs. As their oil consumption elevates their society further one could expect increases in that 68.5 number, which will increase population (and oil consumption) further.
Just tried to attach it above, finally got an error message. Said marked as SPAM.
Oh wow, the reply above just got deleted.