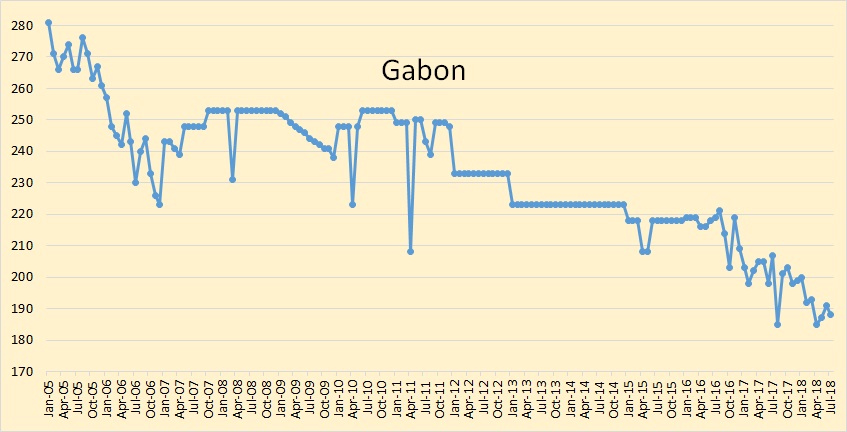
All OPEC data is from the latest OPEC Monthly Oil Market Report and is in thousand barrels per day. All data is through July 2018.
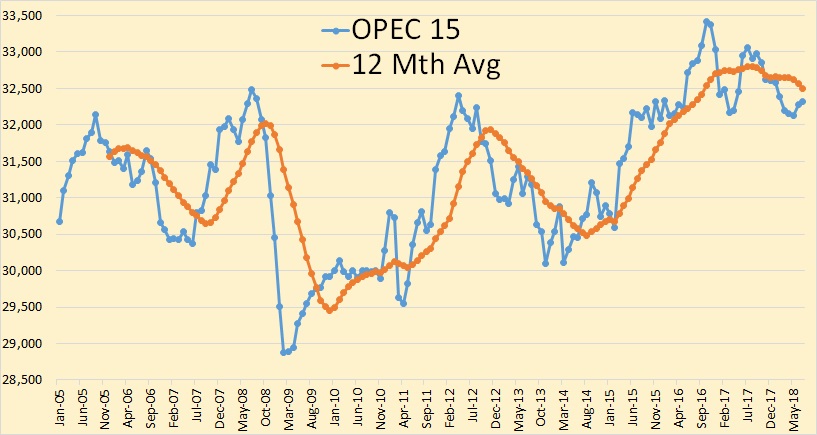
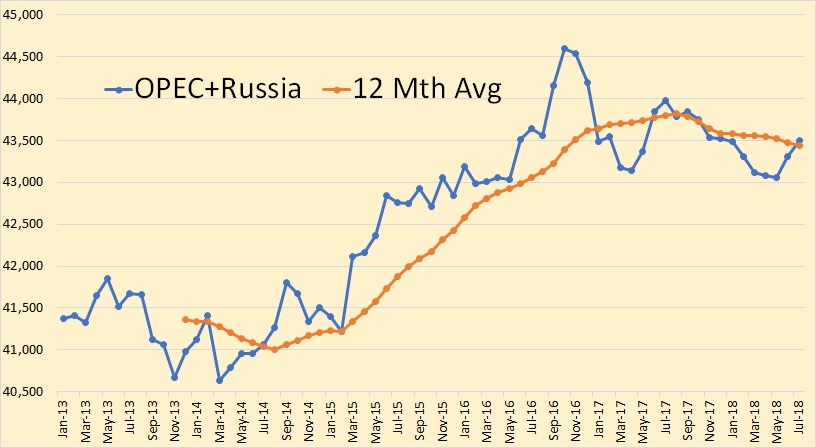
OPEC crude oil production was up 41,000 barrels per day in July but that was after June production was revised down by 43,000 bpd. So OPEC production is actually down 2,000 bpd from what was reported last month.
The big difference here is in what secondary sources says Saudi Arabia produced in July, down 52,800 bpd, and what Saudi says they produced, down 200,5000 bpd. What Venezuela says they produced has no basis in reality.
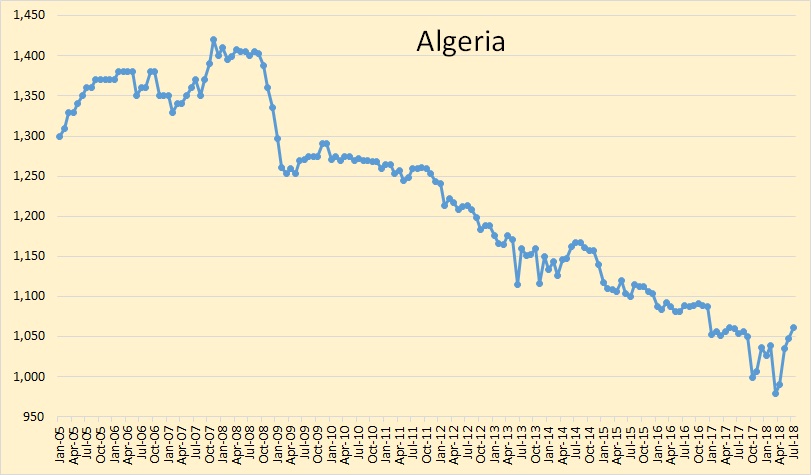
Algeria seems to have halted their decline, at least temporarily.
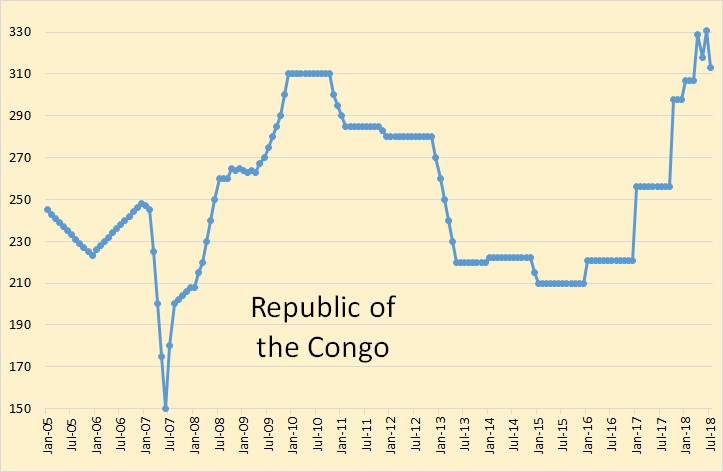
The Congo is new to OPEC but their production is not enough to make much difference.
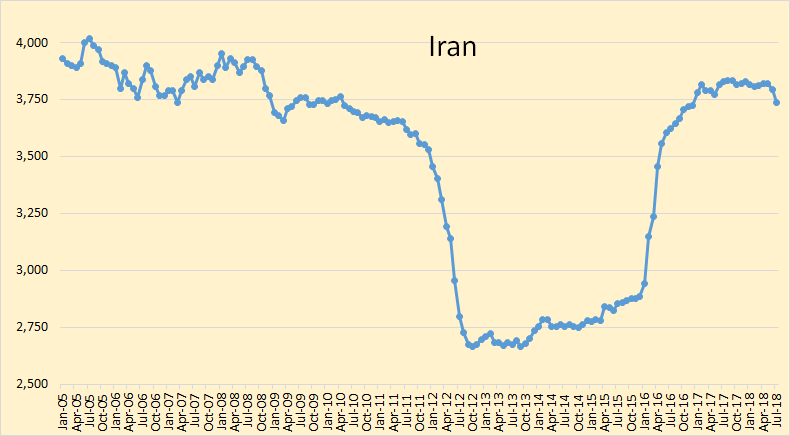
Secondary sources say Iran was down 56,300 barrels per day in July but Iran said they were up 4,000 bpd. Who to believe here?
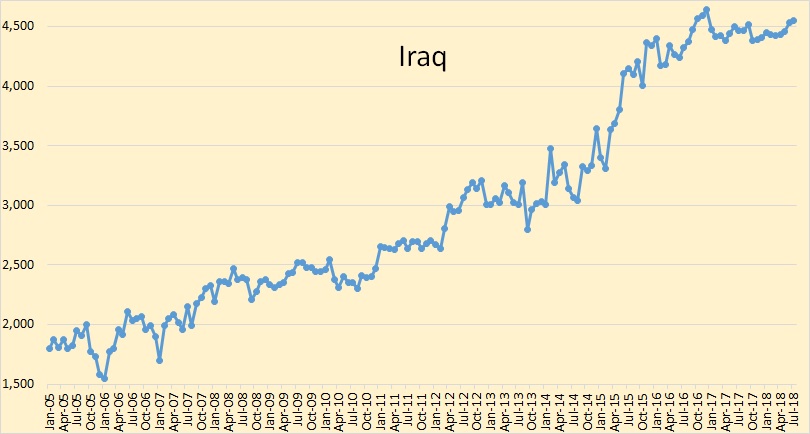
Secondary sources say Iraq was up 24,100 barrels per day. Iraq says they were up 100,000 bpd.
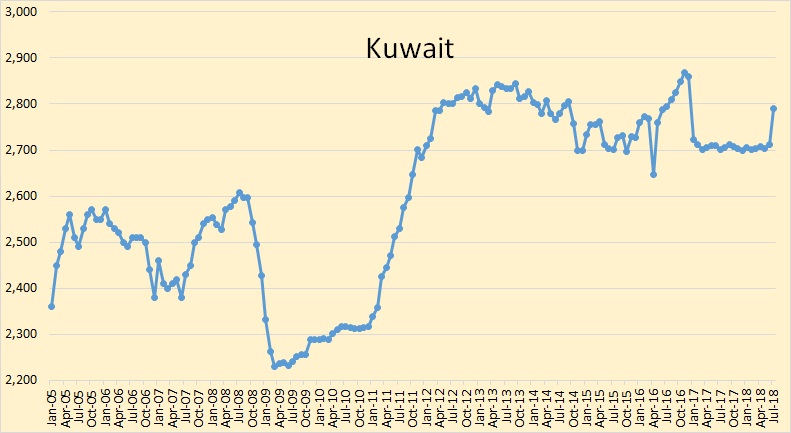
Kuwait was up 78,500 bpd in July.
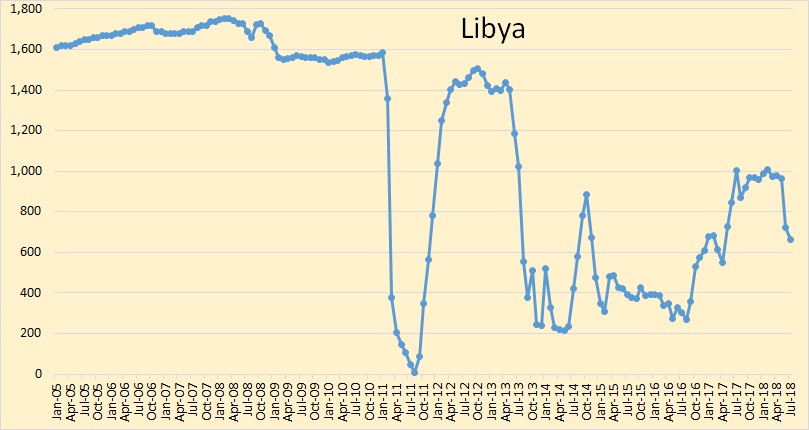
Libya seems to be a long way from solving their political problems.
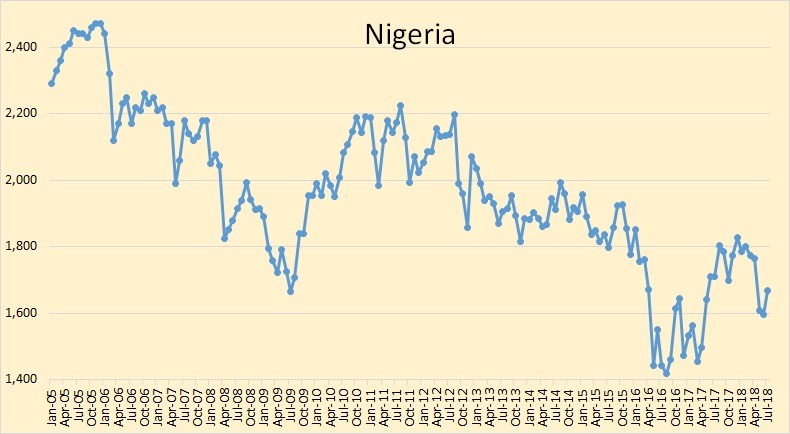
Nigerian production was up 70,500 barrels per day in July but their June production was revised down by 63,000 bpd.
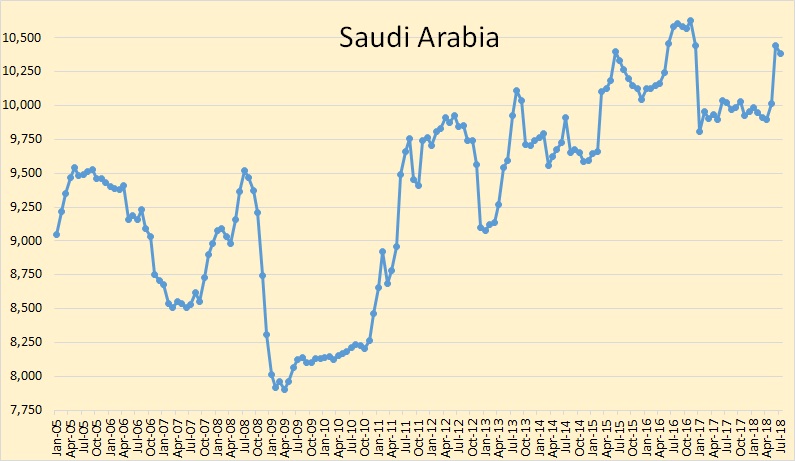
Saudi Arabia was down 52,800 barrels per day in July, they say it was 200,500 bpd. Look for their July production to be revised downward next month.
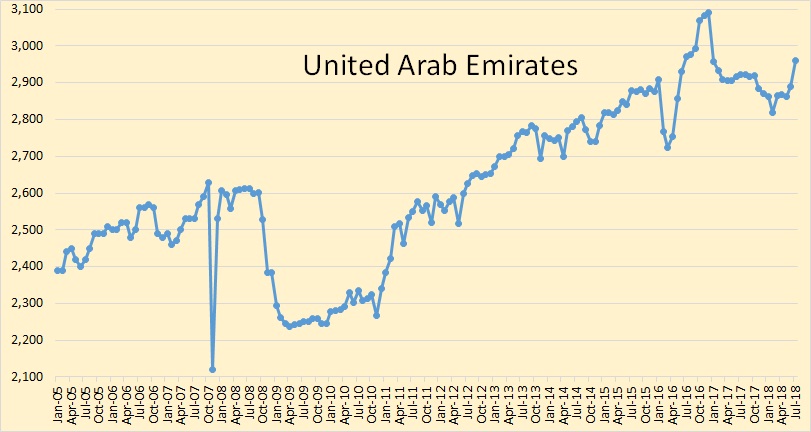
The UAE was up 69,200 barrels per day in July.
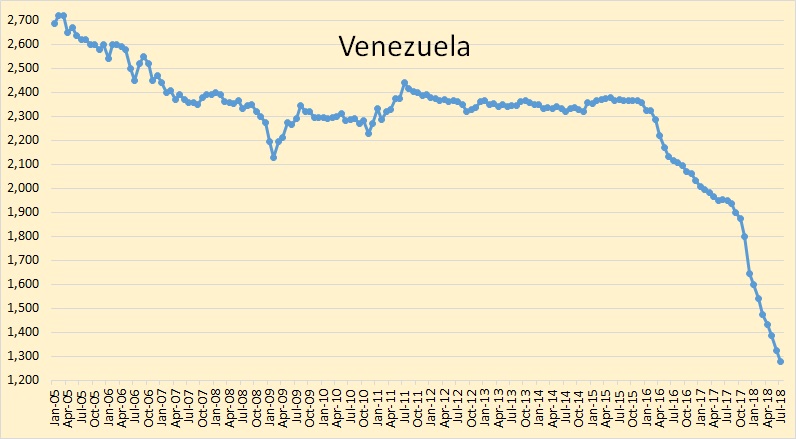
There is just no hope for Venezuela.
Is Venezuelan Oil Production Falling Even Faster Than Expected?
But Venezuela’s oil sector is in shambles, so oil traders are apparently already of the mind that it cannot possibly get any worse. A coup even leaves open the very remote possibility of a rebound, although, as Francisco Monaldi details, growing production by, say, 200,000 bpd per year would require a sustained effort, including investments of around $20 billion per year for a decade. Not to mention a radical change in the political context and a macroeconomic stabilization program. Needless to say, none of that appears to be in the cards anytime soon.
If Venezuela ever does increase production it will be long after peak oil is history.

Here is where all and any increase in OPEC production will come from.
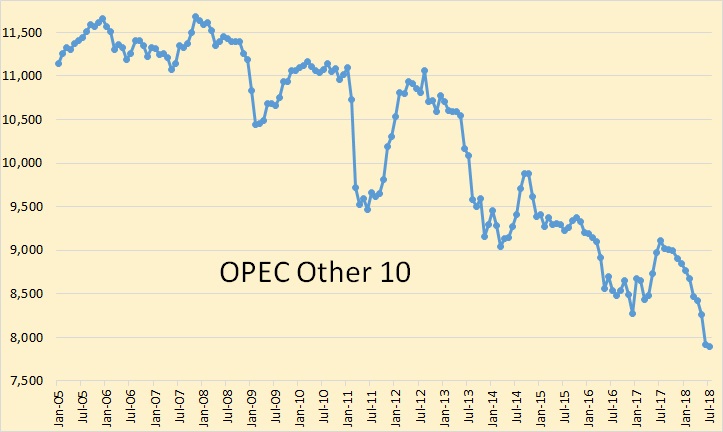
And the big 5 has the burden of increasing production faster than the other 10 decreases production. That will be a challenge.
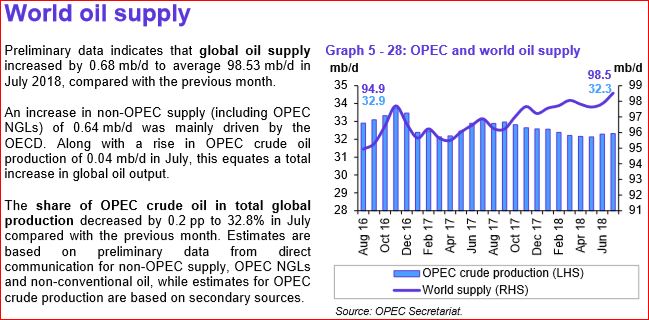
And I just had to add this. This is more than 50% of the world’s crude oil production.
Peak oil year?
I had a look back at world production 12 month trailing average on this post from July 4-
http://peakoilbarrel.com/usa-and-world-oil-production-2/
I feel that peak oil is right about (synchronize watches)… now.
Survivalist – I don’t have that analysis you were asking about. I tend to lump a lot of unrelated things on a single Excel file and I deleted some that I shouldn’t have (all to do with Excel crashes on big files and autosave recovery) and lost a bit of work when my hard drive crashed last year (I have a backup facility but don’t use it as often as I should). If I get a chance I’ll try to reproduce it. As far as I remember the amount for existing developments was based on reported decline rates, and I think those have gone up a bit, which would lead to less recovery, there haven’t been too many additions to the projects in line for development, maybe a bit in Brazil, and discovery rates haven’t really improved, so I don’t think I’ll get much of a different answer. LTO is the thing that is really providing new supply and I didn’t include that I’m (almost) positive.
Thanks for getting back to me on that. I appreciate it. You are correct, you had not included LTO. Your production estimate to 2051 included 23Gb undiscovered, 145Gb undeveloped, 78Gb extra heavy, and 495Gb developed. By 2051 the production estimate was about 10Gb a year. I made a note of it. I’ll see if I can find it in one of your old comments. I thought it was very interesting.
I’d say the 495 is pretty much in line with the ExxonMobil decline rate (around 6%) that was discussed here a couple of posts back. One thing I probably didn’t consider very well would have been condensate as part of the whole mix. And the big unknown, as always, is the real reserves (especially any that are claimed as undeveloped) in the big ME OPEC producers.
Hi George,
The production estimate I was referring to in my earlier question ( http://peakoilbarrel.com/world-natural-gas-2018-2050-world-energy-annual-report-part-3/#comment-648452 ) is that which you posted in this comment from 2017, linked at bottom. Perhaps proud capitalists shall produce some cash flow negative LTO, but I’m not sure it’s addition will mean much in the overall scheme of things, and perhaps neither does Kjell Aleklett- https://aleklett.wordpress.com/2017/04/16/fracking-tight-oil-forskjuter-peak-oil-med-nagra-ar/
http://peakoilbarrel.com/iea-oil-market-report-december-2016/#comment-590653
Thanks again.
A different kind of peak . . .
https://webbreacher.files.wordpress.com/2017/02/picture1.jpg?w=1400&h=9999
For me, “Peak of Mt. Stupid” happened circa 2009. Valley of despair, circa 2015. The “slope of Enlightenment” I experience as a mere plateau, because I never expect to be an expert or “guru.” I’ve excused myself from pretending to know.
Insanity Is Repeating the Same Stupid Cliche Over and Over
So how many times are the peak oilers going to ask your question ? or claim peak oil now ? Have they hit themselves to many times on the head with a 2×4 ?
Here we are after recent 3 years of record surplus, new technical advances, offshore new exploration basically shut down because of surplus, hundreds of billions of dollars of capex pulled back for exploration and new record U.S. production after nearly 50 years from previous peak.
“I know a few people who repeat themselves quite often in conversation. They are doing me no explicit harm, yet I get impatient & sometimes a bit angry. In an effort to be more relaxed about such behavior, I’d like to know more about what drives people to be repetitive, and why it might strike a nerve with recipients such as myself.”
https://ask.metafilter.com/88959/People-who-repeat-themselves
You are much too sanguine. The uncertainties are awful, to any thinking person. Decline happens after things, well, peak–and we simply don’t know when that will happen, much to our detriment, because that means there’s no hope preparing for it.
“You are much too sanguine”
100% of all the peak oilers that have called peak oil now have been wrong in the past and your calling me sanguine
“uncertainties are awful”
Maybe your uncertainties is the lack of education. I listed public facts counter to peak now without dispute from you.
“we simply don’t know when that will happen”
So why call it now ? ignorance ?
HuntingtonBeach
You are correct that many Peakoilers claimed peak in 2005, 2008, 2012 and even 2016 and I argued with them to no avail. You are correct that CAPEX was reduced dramatically due to over production and a collapse in oil price.
https://www.resilience.org/stories/2016-02-10/iea-in-davos-2016-warns-of-higher-oil-prices-in-a-few-years-time/
But the amount spent was still very high in historical terms.
https://www.ogj.com/articles/print/volume-104/issue-37/general-interest/upstream-costs-keeping-pace-with-oil-prices-study-says.html
Despite the oil companies spending 1.5 times more than in 2005, they found less oil in 2015 and 2016 combined then they did in 2005 alone.
The amount of oil found in the last 2 years is terrifyingly bad, bad only a tenth of what we used.
We are rapidly using up the excess found in the 1950s and 60s and replacing it with hardly anything.
https://www.iea.org/newsroom/news/2017/april/global-oil-discoveries-and-new-projects-fell-to-historic-lows-in-2016.html
Does it matter if current peak oil predictions aren’t precise? Some areas have already obviously declined. Other areas are producing more, but the decline rates for individual wells are accelerating. And there are fewer significant new discoveries.
A current glut doesn’t guarantee adequate oil supplies moving forward. Wouldn’t it be prudent to plan for the declines and therefore be more ready when they happen?
“Does it matter if current peak oil predictions aren’t precise?”
“The Boy Who Cried Wolf is one of Aesop’s Fables, numbered 210 in the Perry Index.[1] From it is derived the English idiom “to cry wolf”, defined as “to give a false alarm” in Brewer’s Dictionary of Phrase and Fable[2] and glossed by the Oxford English Dictionary as meaning to make false claims, with the result that subsequent true claims are disbelieved.”
https://en.wikipedia.org/wiki/The_Boy_Who_Cried_Wolf
I just put 10 pounds of shit in a 5 pound bag. Therefore it can’t be a 5 pound bag. It must be an infinity of shit bag. Let shit pile in the magical infinity bag. I’m never running out of room for more shit.
http://peakoilbarrel.com/peak-oil-blibbit-principle/
You read like you have smoked 5 pound of good shit
That isn’t even a pound.
It’s a “magical infinity bag”
I’m more into edibles these days
Previous peak oil claims weren’t deliberately false, they were partly incorrect, mostly through lack of data, but still useful (and fairly correct for conventional oil). It would have been beneficial if the lesson had been learned and better data sought, but I think in some parts the opposite has happened.
The other problem with people using “cry wolf” as a refutation of failed predictions is that in the original story the fucking wolf actually arrives at the end! They are hoist by their own petard.
I quite like this chart. It seems that growth, peak and decline of USA LTO production is not the only factor in defining when world will peak. There is also the matter of the ROW and it’s production trends.
http://crudeoilpeak.info/latest-graphs
That chart seems to show Iraq producing more than SA..?
The chart refers to production increases over base production. While KSA does produce more than Iraq, Iraq has had a larger production increase, over base production, and that is what is reflected in the graph.
Anyhow, that so called oil coming out of the shales aint got the right to be called Texas Tea. It smells like paint, looks like pee and sells like tar.
But most important of all, refineries buy it and turn it into transportation fuel
Also important to recognize that if the mean USGS TRR estimates are correct, US tight oil is likely to peak in 2023 to 2026, best guess is 2024. World peak C+C output is likely to follow in within a year or two, possibly NGL and biofuels might delay the all liquids peak to a couple of years beyond that, best guess for C+C peak is 2025 and all liquids peak(including NGL, biofuel, other liquids and refinery gain) in 2027.
All of these “best guesses” might be 2 years too early or too late as extraction rates, rate of development of resources, oil prices, and political events are all difficult to predict.
A lot of attention has been put on how much tight oil will increase. Very little attention had been put on how much non-OPEC declines will add up to over time. Guesstimating 400k roughly a year, and may pick up over time, but a wag for 400k a year. I use 2018 as the starting year, and by 2022, I see guesses of 2 million from the Permian. Doubt it will get that high, but 5 years of declines will probably see 2 million, or more. Surely if it is graphed, it would be tough to point out exactly where peak is from today. Venezuela decines are semi permanent. Russia and Saudi Arabia look suspiciously on the cusp of decine. Seven years from now, through the looking glass it will be clearer, but not now. But I do think increases after 2022 will be hard pressed to keep up will decines, everywhere. 2018 could be peak, or 2021 to 2022 could be peak. 2019 doesn’t stand a chance of being included. Canada could explode any time during that period, which puts 2020 as a possibility.
Guym,
If we use EIA C+C data and take non-OPEC minus US, Russian and Canadian C+C output, the trend from 2002 to 2017 (using annual output data) is a decline of about 200 kb/d each year, potentially this could accelerate or higher oil prices might lead to a smaller decline rate. If the rate of decline from 2002 to 2017 continues over the next 7 years and the Permian increases by about 2500 kb/d (and we assume all other World output remains relatively flat except non-OPEC minus US, Russia, Canada and Permian basin) then over those 7 years we’d have 2500-1400 or an increase of 1100 kb/d.
Note that my expectation is that US, Russian, Canadian and OPEC output combined will be able to increase by more than 2500 kb/d. I think total World C+C output will increase to about 85 Mb/d by 2025 (an increase of about 3.5 Mb/d over the 2018 to 2025 period).
If World demand for C+C follows the 1982-2017 trend of 800 kb/d more consumption each year, then 5.6 Mb/d of increased C+C output would be needed from 2018 to 2025, so we’d be 2.1 Mb/d short on oil output and I expect oil prices would need to rise to keep consumption in balance with output.
This is the reason that the high oil price scenario ($147/b in 2027 for Brent in 2017$) seems reasonable in my opinion.
Just pointing out, that in the history of the agency, USGS estimates have never been accurate.
They just aren’t equipped with the know how.
“Technically recoverable” is an unverifiable assumption so, to some extent, they can never be wrong, just not particularly useful except in setting an absolute limit which occasionally results in writing off some areas like the California shale. Technically there’s enough reduced carbon in the earth to burn all the oxygen in the atmosphere several times over.
Timthetiny,
Yes the USGS estimates are never perfect, just the best publicly available estimates we have for TRR, ERR is unknown because future cost and revenue are impossible to predict accurately. My method is to use USGS estimates and combine this with a range of reasonable estimates for cost and revenue to create several scenarios to give a range of future possible outcomes, these are only as accurate as the underlying assumptions.
George Kaplan,
The bad estimate for Caliornia tight oil was an EIA estimate, (from a third party that based its estimate on investor hype) not an estimate by the USGS,
I agree the TRR is an upper bound that only would be achieved with high oil prices and low costs, for the Permian TRR estimate of 36 Gb, the ERR is close to the TRR for a high price scenario ($147/b in 2017$ by 2027). If there is no major recession by 2024, this implies a peak in roughly 2024 if new well EUR starts to decrease in Jan 2019 (an underlying assumption of my medium TRR and high oil price scenario). Peak Permian output is approximately 4800 kb/d in that scenario.
Dennis – as far as I can tell nothing you said is in any way relevant to my comment.
Hi George,
The response was in regard to
just not particularly useful except in setting an absolute limit which occasionally results in writing off some areas like the California shale.
I thought because you responded to Timthetiny’s comment which specified the USGS that you were referring to USGS TRR estimates.
If you were just saying that in general TRR cannot be verified, I agree, there is scant data on oil resources, so we take what we have and do the best we can.
Proved reserves will tend to underestimate the resource, TRR will tend to overestimate, in my opinion.
My comment was quite specific in mentioning that the bad estimate for the California shale was from the EIA, your comment seemed to imply that the USGS TRR estimates for the Californian shale were written off. Not the case, it was EIA estimates which were later written off.
Those EIA estimates (July 2011) were not informed by much geophysical analysis.
See
https://www.eia.gov/analysis/studies/usshalegas/
I agree TRR simply sets an upper limit to what might be recovered, though in some cases the assumptions are too conservative and that upper limit proves to be too low.
“your comment seemed to imply that the USGS TRR estimates for the Californian shale were written off” – it did nothing of the kind, it said specifically that the USGS technical recoverable estimates have some use when they are used to write off an area.
Thanks George Kaplan for the clarification.
My apologies for misinterpreting your comment.
I had not remembered that the USGS did a later assessment in 2015, that corrected the poor INTEK assessment from 2011 of 15 Gb of tight oil.
https://www.usgs.gov/news/usgs-estimates-21-million-barrels-oil-and-27-billion-cubic-feet-gas-monterey-formation-san
So I guess you might have meant that the earlier EIA estimate by INTEK for a TRR of 15 Gb was later revised to 21 Mb.
The point I was attempting to make is that the USGS TRR estimates are typically not a factor of 700 too high, as is sometimes the case for EIA estimates.
I am highly skeptical of EIA estimates and only use them when there are no USGS estimates or other publicly available information. The LTO estimates I make combine the USGS TRR and David Hughes estimates from drilling deeper with reasonable economic assumptions gleaned from the comments and blog posts of Rune Likvern, Mike Shellman, and Shallow Sand.
About 400,000 B/d of light oil and condensate is only suitable for plastic bottles, carpet fiber and car bumpers. Thats why so much of it gets exported and why refineries need additional kit to handle it.
Probably 2018. The US increase in production won’t actually come on line due to logistical constraints until long after Venezuela craters another 500k, Iran has sanctions back on and there’s more conventional decline. Mostly because the US is boxed in in the Permian but hey, you have to drill where the oil is.
Libya could be producing more but as Ron says, there’s no short-term prospect of things coming back under control. Again, who else is down by how much by the time that happens?
Russia is the one that concerns me the most. We pretty well *know* why Russia’s production has stayed up and it’s not from exploiting fresh fields (they haven’t found anything new and big since Soviet times) or opening up fracking (cost, tech). They’re just pushing what they’ve got harder and harder. And being a NOC with state controlled media and little love for outside journalists, we won’t know there’s a problem until long after there is one.
A choice by Russia to reduce production need not indicate a failure of geology. The concept of saving it for the grandchildren eventually can undo any imperative to generate export revenue — because they are food self-sufficient and are able to transport that food to the cities, and frankly nothing else matters. Foreign exchange issues that define pieces of paper with ink on them used to purchase iPhones — that really doesn’t matter.
Russia is going to win. They have the surface area. They have the lower population. They have the farmland.
Get used to it.
Russia is going to win. They have the surface area. They have the lower population. They have the farmland.
Bingo!
If they do manage to “win” they will be over run with migrants. Just look at the length of their land borders. They already have an influx of illegal Chinese.
They won’t necessarily win if climate change continues to negatively impact their grain production… Ya, never know, it could happen!
https://www.oxfam.org/en/research/economic-analysis-impact-climate-change-agriculture-russia
Economic Analysis of the Impact of Climate Change in Agriculture in Russia
National and regional aspects
Climate change is already having a negative impact on agricultural production in Russia, especially grain production, the sector most dependent on weather and climate factors.
There was a recent study published in PNAS on how we might already be headed for a hot house earth. Why would anyone think that Russia would somehow be immune to changes in global climate?!
And I ‘d add that if they want to earn some money, or geopolitical allies, that both Germany and Japan/S.Korea are going to need their oil/gas badly. These are very big energy importing countries whose economies are pitiful without that big energy input. I’m assuming that China and India will be getting a lot of the exports available from the Gulf as time rolls on.
I threw the bones into the circle of stones.
Came up with fall equinox 2021. 7 pm Tokyo time.
All pickup truck owners throughout the world stopped and got out.
Lifted a beer towards Ghawar.
Its been a good ride.
I like that estimate haha.. my take is how long can world production stay above 80 mbd..if we have sustained oil prices of $120+ there has to be 2 to 3 mbd of consumption that the world will simply cut out at that point of course there’s a limit to how much people can cut their use. Probably a near decade long plateau between 80-83 mbd of production starting now. Of course that goes out the window if SA and Russia have rapid declines…
Ron,
The OPEC big 5 + Russia account for how much of the global oil export percentage?
I really have no idea as I do not track exports. But they are approximately 40% of world crude oil production and I would guess about 80% of world exports. However, that is just a guess and may be off a bit.
OK. I looked it up, by dollar value anyway, for 2017.
OPEC Big 5 + Russia accounted for 49% of global crude oil export value.
Canada and Nigeria accounted for another 10%
Others just above 3% were Kazakhstan, Angola and Norway.
Okay, so my guess was a bit further off than I thought.
I find the export capacity numbers to be very interesting, since global pricing, economic viability and geopolitics depend so much upon it.
Ditto, but where is Jeffrey reporting his ELM numbers these days?
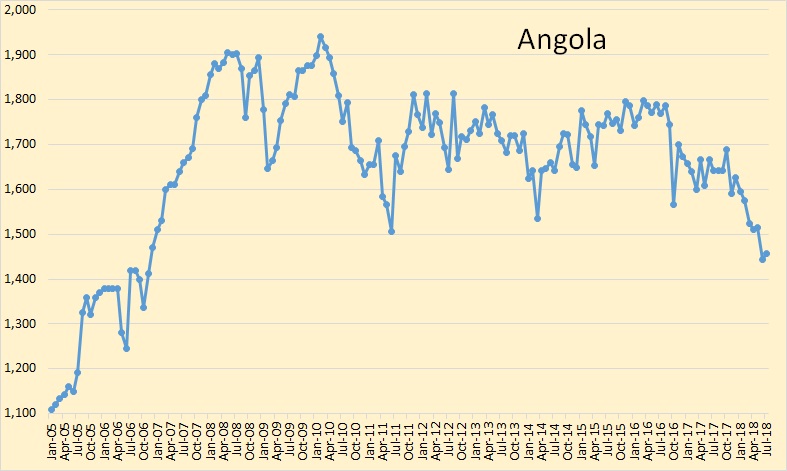
So to repeat myself – Saudi increase was almost certainly Khurais expansion, it will be interesting to see if they follow a decline curve like they had in 2015 until they restart the neutral zone and/or the Safinaya and Zuluf redevelopments have an impact.
UAE increase came from ramp up of Zakum development, Angola probably came from Kaomba. I think Kuwait was the only producer that was holding mature field production offline and has let it back (maybe Qatar, but if so not much). The big Angola and Nigeria FPSOs from around 2005 to 2010 are reaching the noticeable decline stage and new tie backs aren’t as much of an impact as in GoM and North Sea, so it looks like new production is going to be insufficient to compensate for accelerating decline. Two years of 50 kbpd drops wil take Venezuela to zero, but it might be faster because the trend for drilling rigs will reach zero in about 9 months.
Venezuela just had a small black swann: a high voltage line installed in the Maracaibo bridge burned real hot for hours, it melted the asphalt and cut power to Maracaibo and nearby cities, as well as some oil fields. The city has been dark for three days, there are protests, people are getting killed and theres lot of arrests.
Most oil production is routed to the East Coast, Maracaibo is on the West Coast on the channel leading from the lake to the sea. The bridge crosses at that point, and its the only way to get across other than the Machiques Colon road all the way south of the lake.
So all the refrigerated food is either spoiled or eaten, the bridge is closed, there’s no power, the weather is hot and humid, and people are getting incredibly mad. Many oil field supplies are brought into warehouses at the port and taken by truck across the bridge, so i assume that traffic has to be rerouted south of the lake. Plus many oilfield workers live in the Maracaibo area, so they cant get to work. Theres also an oil spill in the lake, and theres no clean up effort.
Theres also the Requesens case. Juan Requesens is a young national deputy who was kidnapped a few days ago. Things got dicey when somebody released a video of Requesens in Maduro’s KGB style torture center known as the Helicoide. Requesens was in boxer shorts covered with feces, and they made him turn around to get a 360 degree look. Requesens’ younger sister was also kidnapped, word came out they were using her as hostage to make Requesens confess to trying to kill Maduro. So it looks like even some within the secret police are leaking stuff to make Maduro look bad.
And this has started protests all over again. Except this time im seeing people who are usually cautious are now writing all sorts of messages and emails they never wrote before. Theres almost no media coverage, but the US embassy issued a security bulletin, and warned us citizens to be off the street today. The only visuals i have are of a group of young men protesting in boxer shorts, and a tiny group of pdvsa employees suposedly out to parade for maduro being told by really poor youngsters (street kids who eat garbage and live from handouts) telling the pdvsa types that maduro had to go.
So i expect oil priduction to dip say at least 100,000 bopd in august. Or much worse.
Shouldn’t be too long before claims of nerve gas attacks on the opposition begin. Should be able to get all of those youngsters to pour water on their heads and run to the hospital for filming. Though it’s not real clear who would be bombed to punish use of chemical weapons, since there are no US funded Syrian opposition groups there to designate targets.
As there is no food in Venezuela, there’s no need to be concerned about how much spoiled in the refrigerators.
The population has been getting frozen sardines and other small fish thats usually ground up to feed shrimp and salmon, and occasionally they get a chicken. South of Maracaibo theres a bit of milk and cheese/butter production. I know of one case where a divorced mother with one 4 year old daughter was getting food aid from a lodal evangelical group. The mother has been sick, theres no medicine, so she had been sending her four year old to pick up a piece of bread with butter and sugar the church had been handing out. Now the church has no butter.
These scenes are repeated endlessly, and it impacts oil field workers, who are seeing their families starve. And this is one reason why they arent showing up to work. Many of them are among the 2 million venezuelans who fled recently.
Eventually this will end up like Cambodia, where the communists murdered over a million, or there will be civil war. I just told a venezuelan friend to expect at least 100,000 killed in the near future, and get ready, because its going to get medieval. It wouldnt surprise me to see Venezuela go the same route as Libya or Syria, with outside parties (Cuba, Nicaragua and intrrnational communist jihadis) fighting against venezuelans and whoever wants to help them.
Hi Fernando
In July Syncrude suffered an instant massive power failure. The cokers used to upgrade the bitumen shut down without proper procedures and the bitumen hardened in there and it will take Suncor about 3 months to restart one coker at a time.
I am wondering if the same situation might occur in Venezuela. Are the oil fields that were affected conventional fields or in the Orinoco belt.
Ovi
George
KSA is probably dropping a big hint here.
https://www.reuters.com/article/us-opec-report/saudi-cuts-oil-output-as-opec-points-to-2019-surplus-idUSKBN1KY162
The drone attack on Maduro is of course part of the story:
https://www.bbc.co.uk/news/world-latin-america-45073385
Peak oil in Venezuela: El Furrial field
http://crudeoilpeak.info/peak-oil-in-venezuela-el-furrial-oil-field
Peak oil in China and the Asia Pacific (part 2)
http://crudeoilpeak.info/peak-oil-in-china-and-the-asia-pacific-part-2
In the South China Sea:
US Poseidon overflying Spratlys gets response from China
https://www.bbc.co.uk/news/av/world-asia-45152525/south-china-sea-leave-immediately-and-keep-far-off
IEA Energy Outlook 2017 (p 4)
” By 2040, around 70% of the world’s oil trade ends up in a port in Asia, as the region’s crude oil imports expand by a massive 9 mb/d. The shifting pattern of risks implies a significant reappraisal of oil security
and how best to achieve it.”
http://www.iea.org/Textbase/npsum/weo2017SUM.pdf
The drone attack was probably fake. I heard a gas stove exploded, and Maduro’s snipers shot at two VTV drones equipped with cameras to video Maduro giving a speech. I saw a bunch of soldiers running away in panic. And the apartment where one could see damage showed smoke damage, not anything like 1 Kg of C4 does. One of the tv channels said “well, theres little damage because the explosives didnt all explode. But 1 kg of c4 doesnt go off partially. And it ought to leave that drone turned into molecules. But the drone was videod on the sidewalk. So i think it was all a fake or made up after the fact.
https://www.nytimes.com/video/world/americas/100000006042079/how-the-drone-attack-on-maduro-unfolded-in-venezuela.html
Cant see it. I noticed most large media are taking the same disjointed videos put out by the dictatorship and using it as if the “drone attack” had been real.
What’s your source?
It is extremely hard to find info on Venez that isn’t severely biased one way or the other.
Most issues have this same problem, but this seems to be among the worse for this, IMHO.
Updated chart for Europe vs USA crude oil closing stocks. Data from the OPEC MOMR
https://pbs.twimg.com/media/Dki062RW4AU6oau.jpg
Updated chart for Chinese crude oil production, down -124 kb/day in July after being up +95 kb/day in June.
https://pbs.twimg.com/media/DkizUg8XoAUhWnS.jpg
Didn’t OPEC just increase China supply forecast based on last month’s uptick?
It does make me wonder, of course the new low could just be an outage? I don’t know much about production there.
OPEC did revise up their 2019 production forecast by +80 kb/day (2018 by +100 kb/day)
https://pbs.twimg.com/media/DkeeaLVX4AIQ_I-.jpg
I was just having a look at the rig count
I had a quick look at China National Offshore Oil Corporation (CNOOC), they have one oil project (peak: 36 kbe/day) and two gas field projects due in 2018 H2
https://pbs.twimg.com/media/DkjsxiSXsAAJkaq.jpg
I think there are a few offshore wellhead platforms with one or two wells (Wenchang, Weizhou) but it seems less start-up activity than in previous years which would tend to suggest an accelerating decline. I don’t think OPEC have much more access to data than what is reported through news releases and in the trade press for such things in China.
2018-08-14 (Clipper Data) European refiners importing record volume of US crude grades in August
Chart on Twitter: https://pbs.twimg.com/media/DkjNCx-X4AAI-yu.jpg
Clipper Data’s tanker tracking https://pbs.twimg.com/media/DkjNfTrXcAEhSD7.jpg
Libya’s oil production is said to be coming back after their recent outages. Their largest oil field El Sharara is returning to full production.
What about investments into the oil fields.
They can just use current infrastructure, turn on the taps and the existing injectors – but do they have the money to invest in this provisory state, doing new infill drills, adding side areas, increase water handling etc. to sustain / increase production from these quite big reserves?
Yes investment usually needs stable politics. Before the recent fighting, Libya’s National Oil Corp. had a target of 1.25 million b/d. If things remain calm then I imagine that the price of Brent over $70 is high enough for them. And they’ve just added 4 oil rigs.
Ron,
You said a few weeks ago you would tell us what your estimate for the World C+C peak is, I may not be remembering correctly, but I thought it was going to be with your next OPEC post.
Maybe I missed it.
Nah, you didn’t miss it. I was just kinda hoping you had forgotten about it. 😉
So here is my prediction… again. 2019, give or take six months.
I make that prediction even though the US and Canada may not have peaked by then, the decline in the rest of the world will more than offset any future gains in US and Canadian production. And I really don’t expect the US and Canada to increase production a lot after 2019.
Another prediction. Most everyone expected peak oil to happen in 2005. That did not happen. However, peak oil will happen when no one expects it.
And, how long after the peak will it take to know it? A year?
There have been several “peaks” in the past that held for a couple of years. I would dare to call peak 4 years after it happened, maybe 3 if the trendline is very clear.
The 2005 peak caused the 2008 oil price shock and the financial crisis. That was the 1st heart attack
We will know it if and when the 2019 peak is breached.
Hickory,
4 years.
Ok, 2019 was not in my expectations of your prediction, but that one is also within my earlier “take 2018 to 2022” and pick it in hindsight prediction. Kuwait and SA will probably have their joint production by then, so yeah, that year is possible too. Forgot about that one.
Ron,
I agree we are not likely to see a peak when we expect.
So one method is to take different expectations and average them.
Ron 2019
Guym 2022
Dennis 2025
Average 2022
Range 2019 to 2025
Doesn’t mean it will be right.
Maybe Doug, Fernando, Mike Shellman, Shallow sand, and other experts can weigh in on peak year for World C+C output.
Ron,don’t you think if 2 or 3 new pipelines are built in Canada (a big “if”), the oil sands producers would increase their production a good amount?
Of course it would. However, there would be a lot of red tape getting permits. That would take years. Then construction would take years after that. By that time we would be way down the downslope of peak oil.
These are things that help to maintain a longer plateau – high prices will cause this investment to happen.
It will be very bad to have peak oil in Texas style – a high peak and a steep decline.
Iraq, Iran, Lybia and Venezuela can help to maintain a long plateau, too. They have big ressources, and when China and USA really want they can force peace and drilling there.
When conventional oil peaked and began plateau in 2005 I naively expected that the more expensive unconventional oil would be used strategically to mitigate decline and avoid chaos.
How wrong was I. Instead all the last resources tight, deep and sludge have been brought online simply to increase the hight of the peak. It’s like drawing from the main and the reserve tank at the same time, clearly it will not end well.
On a side issue I am currently in Japan and am just starting to notice closed rural gas stations. The rest of the infrastructure roads bridges and especially the tunnels are literally falling apart. The majority of new buildings are now care homes for the elderly.
And as of 2015 Japan was importing 95% of net energy consumption. Not a pretty scenario.
Yes but as the population is very ill informed by Japanese media they have very little clue as to what is on the way.
There are some real time events unfolding that may provide some guidance when people project future hydrocarbon production … in the US unconventionals, at least.
Tomorrow afternoon, ND DMR will release the Director’s Cut that should show a new daily production record. This may well continue at the 1,300,000 bbld rate at least through Dcember.
Slide #10 frtom Continental’s recent presentation should partly show why this is the case and it most likely will continue (high output) far off into the future.
Although it has been stated many times by people on this website that operators are poor sources of information, the verified data that is frequently presented in both conference calls and presentations can offer hard numbers with which one can analyze what may be coming down the pike.
Related to the above is the still-being- released June production data from Pennsylvania’s DEP.
There continues to be momentous ‘happenings’ emanating from this region that are flying well under the radar and directly relate to you folks making future production estimates.
Specifically, the Utica has been a cipher in Pennsylvania while Ohio’s Utica has evolved – for the moment – into a prodigious gas play.
To wit, the Deep Utica in Pennsylvania is well on its way to optimal development as operators such as XTO, Shell (Swepi), and CNX seem to have ‘cracked the code’ in maintaining high output for several months running.
The Aikens, Lingle, and Winslow wells seem to indicate this.
Furthermore, the vast expanse of prospective Utica acreage in Central and North Central PA has increased dramatically.
More to the point … page #21 from the updated (June, 2018) NGL Primer report from the DOE (outstanding, educational piece) shows the areal extant of the Utica with SEVERAL wells in the overcooked region … aka they ain’t supposed to be there.
But they ARE, and in a rapidly expanding fashion.
All this is a verbose way of saying to you all that the dynamics in this unconventional realm continue to change at a dizzying pace.
To look at historical production without a broader view may continue to mislead as to what is to come.
Coffeeguyzz,
Most of us don’t consider NGL to be “oil”, so Utica not relavent. Bakken output may increase a bit, probably not to over 1300 kb/d in North Dakota Bakken/Three Forks. Eagle Ford will be relatively flat, DJ may continue to increase a bit and possibly SCOOP/Stack, we dont have good data for scoop/stack.
The “hard data” in investor presentations is highly selective.
They tell us about their best wells and call them “typical”. The real data can be found at shaleprofile.com
It is good that you don’t consider NGLs oil because they are not.
Puzzled why you even brought that up.
The NGL Primer from the DOE that I referenced is an excellent source of Appalachian Basin related info, a great primer – as the title implies – on the world of NGLs, and it also includes an updated map of Utica and Marcellus well locations.
THAT is the primary reason I mentioned slide #21 so you or any interested reader could see with your own eyes, right now, how possibly the largest source of natgas on the planet (or in the top handful), is in the process of being revealed to the world.
Again, all the official sources, upon which you prognosticators understandably rely, are about to be re-evaluted as real time data is showing dramatically different numbers to what was expected as of just a few years back.
This same process is playing out in Oklahoma, Wyoming, Louisiana, and soon to spread to the UK and even western China (which Dr. Li’s presentation seemed not to take into account).
This stuff is changing rapidly, Dennis, and looking in the rear view mirror might not be a prudent approach if one wants to get a sense of what future unconventional production will be.
Coffee I appreciate the optimism and enthusiasm you inject into the discussions here. It helps provide balance to this forum. From the time I spent in the oil biz many years ago, I can tell all here that it is overall a very optimistic group that lead the independent E&Ps. I’ll also say that their optimism is mostly fueled by OPM, and sometimes leads to train wrecks. But, that optimism has undeniably led to much more tight oil production than I ever thought possible, and there is probably more to come.
DC
The upstream boys sure have spent an asston of money, and those investments are now resulting in millions of barrels a day of new oil as well as tens of billions of cubic feet of gas.
Relating back to the idea of ‘how much more?’, ‘for how much longer?’ … This is where an awareness of current practices would strongly indicate that many decades of high output is far more probable than not.
The current status of the Deep Utica being just one example of that.
What is the diesel content of Utica liquids.
Nothing else really matters. Diesel plants food.
Spoken like a true trucker.
What are ya gonna do when the fuzzy heads implement effective pinwheels on top of the cabs to go 70 mph? All downhill, of course.
They are getting a fair amount of both oil and condensate out of several of the Ohio counties, but production never amounted to a whole lot.
The advantage, such as it is, is that there are both refineries and pipelines nearby to somewhat economically handle this product.
Cabot has sparked a great deal of interest by planning on a half dozen wildcats targeting oil-prospective rock well to the north central Ohio in Ashland county.
Many people are keenly awaiting results which may be several months out.
Cabot finally sold out their horrible tier three Eagle Ford acreage in Frio and Atascosa Counties. I followed it pretty closely, as I have mineral rights in Western Atascosa. I watched in awe, as they continued to drill in bad rock expecting different results. If anyone can prove one way or the other, Cabot will, as they must have unlimited funds for capex.
The magical improvements in drilling the Eagle Ford can be broken down to two major improvements. More frac stages, and much longer laterals. You can improve production by over 100%, but you have to use more than twice the area that older wells had. Duh.
I’m not a trucker.
I do eat, though.
Diesel (distillate fuel oil) is exported from the US at the rate of 1.25 million barrels per day. I think we have an excess.
Since 2006 exports have risen by over six hundred percent.
Some more info
https://www.eia.gov/todayinenergy/detail.php?id=33542
Rather a lot of that is imported oil for processing, particularly heavy oil generally only refined by Gulf Coast refineries.
The refinery gain is counted as domestic production. The products exported are from that refining of non domestic crude.
You won’t need numbers to know if there is insufficient diesel in the US.
The world runs on diesel—-
Coffeeguyzz,
Many places lump “all liquids” together such as BP Statistical Review, IEA, OPEC, and even the EIA in the STEO, so your focus on natural gas indicated to me that perhaps you were doing the same.
The current thread is focused on oil.
There may be quite a bit of unconventional natural gas produced, my estimate is about 1200 Gboe for the World (I assume deep sea gas hydrates are not likely to be produced in significant quantities), but the estimate is highly uncertain, my “high” scenario has roughly 2000 Gboe of shale gas.
One can only base future estimates on what has been observed (the past).
For LTO, that’s exactly how I proceed, looking at past production to estimate current well profiles and using geological estimates from the USGS to estimate the number of future wells. Current and assumed future costs and revenue and assumption that oil companies attempt to maximize long term profits allow an estimate of economically recoverable resources (ERR).
Based on current knowledge the US may produce about 50 to 60 Gb of tight oil from 1951 to 2050, after that output is likely to be negligible (5 Gb or less).
For those of us who arn’t knowledgeable on it, oil condensate and NGLiquids are different enough to have different names, but how else do they differ?
Can they be used interchangeably?
Do both go through refining?
Is their export potential, and transport fuel potential similar?
Thanks.
https://rbnenergy.com/through-the-looking-glass-ngl-condensates-and-pentanes-us-vs-world
Hah. I was reading that article and coming to the conclusion that it is amazing how fuzzy the whole terminology and classification system is considering how long the industry has been up and running.
And then the author said the funniest thing- “Now that we’ve cleared up NGLs, we need to turn to the far more convoluted world of condensates,”
NGL are natural gas liquids, so strictly speaking include condensate and NGPL (natural gas plant liquids), but sometimes NGL is used to mean only NGPL. Condensate, or often lease condensate, is liquid that drops out of natural gas at the wellhead, often before the gas is metered. The drop out is mostly just because of phase change as the gas pressure is reduced (it’s the opposite of what happens at atmospheric pressure that we are used to seeing) but sometimes there is added cooling. NGPL are liquids that get taken out at natural gas plants through refrigeration and fractionation (though some fall out in the pipelines), leaving a saleable gas stream with a sufficient low dew point that no more liquids can drop out before use (if they did various domestic appliances would start blowing up).
Condensate, after a bit of processing to remove the volatile gases is like very light oil and can be used as such (it can be burnt directly in some ICEs). It contains mostly pentanes and a few heavier compounds (longer chain paraffins and some aromatics). NGPL is ethane to butane with some pentanes. Sometimes the ethane is left in the gas and sometimes removed into the liquids. It can be used for fuel, including autogas (which is C3s and C4s sometimes called LPG – liquified petroleum gas) but isn’t interchangeable with condensate. NGPLs are not liquids at room temperature and pressure, condensate is. NGPLs are feed stocks to chemical processes, and can go on to produce polymer feedstocks (one word: plastics!). Some of them are used in refinery operations, particularly alkylation, which makes a key component for gasoline (something to do with cetane/octane numbers, maybe anti-knock properties, but I’m not sure exactly).
Thanks. This is one of the reasons I enjoy hanging around here (again).
Hickory
I just deleted most of my response as Mr. Kaplan’s description is a thousand times better than mine.
Will leave some as a supplement.
Any discrepancy, would be better to accept Mr. Kaplan’s response.
Natural Gas Liquids (NGLs) are a completely different animal in that they are always gaseous at ambient temperature/pressure.
Think propane (barbeque stuff, tanks outside buildings for winter heating/cooking), butane (cigarette lighters, chemical feedstock), pentane (basically blending fluid), and ethane which is the biggest component after methane (dry gas).
Ethane can remain in pipelines in manageable amounts (pipeline acceptable btu rate), or used in petrochemical plants.
Most food wrapping/containers, carpets, clothing, the housing for your computer, virtually all plastics, are sourced from ethane, propane, or oil based naptha.
The cost advantage of abundant propane (makes propylene) and ethane (makes ethylene), is why $200 billion has recently been invested in new/upgraded US petchem projects.
There is no transportation use for NGLs outside of a relatively small market of propane fueled vehicles (primarily forklifts).
Down the road, if the vast quantities of dry gas – methane – can be effectively handled in liquid form (LNG) or compressed form (CNG), use in transportation may greatly increase.
This is already occurring in ships, trucks, and trains to a limited degree.
Daily propane/propylene export from US is about a million barrels a day, as per the EIA site.
That DOE NGL Primer pdf is a highly readable, informative intro into the world of NGLs.
Thanks to you guys for much food for thought – I will keep the June 2018 Primer as a ‘bench mark’.
The interesting ratio to my mind in years to come is the overall material prosperity of the USA and any change in prosperity arising from the new ‘injection’ of North American petroleum / NG, bearing in mind the very uneven distribution of current prosperity. The USA as you make clear is not isolated in the world and the profitability of its connections with the wider systems makes for complexity. But, the economic response to the tight oil / NG ‘renaissance’ (to use a Primer word) has been muted for the last 10 years. A ‘gusher’, particularly of oil and liquids on the scale we have seen might have been expected to release a boom in economic activity like that post-WW2. So has it been just a lag time?
Perhaps it is still to come? Perhaps after a 9 – 10 year lag US wage rates are rising and there is a noticeable rise in the number of solid income jobs, new roll-out of productive infrastructure, and etc.? Or perhaps not? Certainly there is an uptick of sorts this last year or so, but will it last?
Beyond Peak Oil (world 2022?) you guess we could wait perhaps another decade for peak North American oil. Bearing in mind the USA – and the complex wider industrial system – might adapt to the remaining NG, serious economic decline might be put off until the 2nd half of the Century. For example, there is enough NG hypothetically to supply synthetic soil-N for farming beyond natural ‘carrying capacity’ in the USA probably for centuries. And the USA is connected heavily with world-food. But prosperity – the peak and undulating plateau the USA appears to have been on for many years – is something else. I guess the world waits to see over the next decade.
best
Phil
Thanks for the explanation guys!
Phil -“A ‘gusher’, particularly of oil and liquids on the scale we have seen might have been expected to release a boom in economic activity like that post-WW2. So has it been just a lag time?”
Well, imagine the scenario without the oil/gas produced from fracking. How high would the cost of these products be now? And money that has flowed to property owners and workers in places like PA,TX,ND wouldn’t be circulating in the economy. Its a bigger effect than is generally acknowledged. I’m pretty sure truck and SUV sales over the past 8 yrs would be a fraction of what they have been for example. The prices for transport and heating/cooling would have been high enough to have kept us in recession the whole time, IMHO.
btw- here is the link to that NGL Primer
https://www.energy.gov/fe/downloads/natural-gas-liquids-primer
Phil,
Expanded US oil production probably hasn’t helped the US economy much. How could that be?
Expanded US oil production reduces US net oil imports. That, in turn, reduces the US trade deficit. That should help the US. But, a lower trade deficit increases the value of the US dollar, which pushes the trade deficit back up. For instance, the dollar is at 1.14 Euros today – that’s way too high for the actual purchasing power parity level.
The fact is that the US is in a unique position as the provider of the world’s primary trading and reserve currency. That means that the US is a big exporter of Treasury bills, which places like China and Norway uses for their money supply and their savings/reserves. In turn, that means that the US isn’t helped by reduced imports or expanded exports. In fact, the US is suffering from a moderately bad case of Dutch disease, in which our manufacturing and other tradeable goods are hurt by an inability to export, due to an excessively strong dollar. Reducing net oil imports only hurts other exporting industries even more.
Venezuela is a great example of terminal Dutch disease, by the way.
It’s another example of how we need to kick the oil habit – the benefits of oil are illusory.
Nick G- I disagree with your idea that the US oil production hasn’t helped the economy much. If we didn’t have the production of oil and gas from fracking, the cost of energy here would be very very high, in fact it would not have come down from the high levels of around 2009. The jolt to the budget of families and businesses would be huge, and still not be digested.
The production has given us time to adapt, which I believe we have generally wasted.
You might not like the idea that we are so dependent on the fossil fuels, and I don’t either. But it is real.
When oil prices rise, consumers pay more and…producers get more income. The Shallow Sands of the world get more income. Texas, N. Dakota and Venezuela get more income, and Maine, Illinois and Greece have less money. Some families lose, and some families gain.
If prices had stayed at their 2009 level we’d have fewer SUVs wasting fuel. We wouldn’t have a presidential administration proposing to stall the increase in vehicle efficiency. The marginal benefits of that extra fuel have been very small, while the costs in pollution and national security have been very large.
We need to kick the oil habit ASAP. Peak Oil would be good for producers, and it would be good for consumers, in the long run.
These are things that you’d prefer to see, or would have liked to have happened differently.
Still doesn’t change what has gone down thus far.
And Fossil is going to burn for a long time to come.
Price jolts probably aren’t too many years off though.
1.14 dollars to the euro seems ok to me. Not too long ago it was 1.05 dollars to the euro. The European Union has serious problems, poor leadership, very poor energy security, and a weird obsession with global warming.
Well, I appreciate the humor. A few thoughts:
You’re at high risk of being misunderstood. Humor is often hard to convey in writing, and Americans seem to have a hard time with irony, and
That pairing of security and climate change is nicely done. Europe does indeed have very poor energy security, and of course wind and solar are pretty much the only energy sources that are domestically produced. So, the solutions for climate change are the same as for improving energy security.
Finally, yes, you’re right – it’s amazing that the Euro has been as weak as 1.05 dollars. Given that it takes roughly 1.35 dollars to buy as much stuff as a Euro, it’s amazing that US exporters can sell anything at all.
A big build this week
U.S. Petroleum Balance Sheet, Week Ending 8/10/2018
Total Stocks (crude oil + products)(including propane) +17.4 million barrels
https://www.eia.gov/petroleum/supply/weekly/
Saxo chart summary
https://pbs.twimg.com/media/Dkpd37dXgAUBZrW.jpg
It looks like a decrease in domestic consumption this week. Yeah net imports are higher, but that only accounts for less than half the build. Production is about 2% higher than norm, too.
I don’t see how that is really physically possible, either from increased local production or changes in import/export. It’s like 1.5 VLCC tankers per day extra. It surely must be a lot of measurement noise.
Yeah, there is more than a tad of hokey numbers in it, beginning with production.
George
A more likely scenario.
https://mobile.twitter.com/TankerTrackers/status/1029739520542093313?p=v
I don’t know if this has anything to do with it but this build brings the API and EIA estimates for crude oil inventories closer together. The gap between them is about average now.
Crude oil +6.8 million barrels
Oil products +3.8 million barrels
Propane + NGPLs +6.6 million barrels
Below is the EIA Inventory balance calculation for today. What is not clear in this data is that last week, “Net Imports” were 6,081 kb/d. This week that number is 1341 kb/d higher than last week and that alone adds 9,387 kb/d to the inventory. If the net imports would have been the same as last week, there would have been a draw of 2.6 M bbls, close to what the market was expecting. This week input to refineries was 383 kb/d higher than last week. This increase in US demand is total masked by the focus on the 6.8 M bbl inventory increase.
There are two questions here.
1) Is this just a catchup in errors from previous weeks?
2) Have some OPEC members sent more crude into the US, knowing that stock builds in the US depress the price of WTI?
The numbers on the left are the line numbers from the EIA rpt
(1) Domestic Production 5 10,900
(4) Net Imports (Including SPR) 7,422
(13) Adjustment6 631
(14) Crude Oil Input to Refineries 17,981
(1) Domestic Prod + (4) Net Imports +18,322
(13) Adjustment6 +631
(14) Crude Oil Input to Refineries -17,981
(10) Stock Change (+/build; -/draw) 972
Stock Build [7 X Line(10)] (Million bbls) 6.8 M bbls
2018-08-15 (Reuters) – Oil companies bid on less than 1 percent of the parcels offered in a sweeping U.S. auction of Gulf of Mexico exploration leases on Wednesday, showing tepid interest in the region for the second time this year.
In all, there were $178 million worth of high bids, the agency said, up from $124 million in the last auction, in March. Companies submitted bids for 144 parcels offered, less than 1 percent of the 14,575 available blocks, and fewer than the spring auction that attracted 148 bids.
Oil companies had lobbied for lower royalty payments for deepwater acreage because of the projects’ high cost and long lead time before production can begin.
https://www.reuters.com/article/us-usa-oil-offshore/oil-companies-make-few-bids-in-u-s-offshore-lease-auction-idUSKBN1L01SY
Is that it for the GoM Leases now? There keep being headlines that they are going to offer all of it, the sale attracts very few bids (I think the last one was almost the same with 1% sold) and a few months later there’s another one with the same headlines (and the same desperate attempts to put lipstick on a pig in the reports afterwards).
To answer my own question it looks like there are two a year planned until 2022, but they might not achieve much judging by the recent trends (chart doesn’t include most recent).
https://oilprice.com/Energy/Crude-Oil/The-Productivity-Problem-In-The-Permian.html
Interesting analysis by Standard Charter of maintaining production in the Permian. In June, 95% of completions were to maintain production, and 5% produced new growth. The larger the treadmill, the more people you have to put on it. Imagining doubling the output, while still maintaining production is hard to do. It’s why I said a two million increase is probably not reality, and maybe why Ron maintains shale production will not increase that much.
Interesting that it is a relatively hard -229k barrel legacy decline in September vs. the EIA “damn the logistics” estimates of adding 263k new production to net 34k increase for the basin. In reality that could easily miss negative.
There just isn’t a very good exploitation phase for shale wells.
10-20 BOPD gross, with a 25% royalty burden, from a 15-20,000’ wellbore with a 5-10,000+ lateral appears to be the norm for years 5-20. Bakken seems to have a better deal on royalty burden.
As I have noted, our wells that cost 1/100 or less have ER in 30 years of 7-20K BO. That would equate to 700K-2 million BO using my 100/1 ratio.
Again, our field is turning 113 years old in less than one month. It is very depleted.
Shale has shocked the world. No one saw it coming in 2008, for example. But it is still very high cost production. Companies are still spending more than they are taking in, using the checkbook method.
Anecdotal. We reactivated a lease with two abandoned wells 12 years ago. Wells drilled 60 years ago. Cumulative 1957 to 1998 was 40K BO. Cumulative last 12 years will be 7K BO by year end.
We reactivated a lease with one abandoned well 5 years ago. Well also drilled 60 years ago. Cumulative 1980-1998 9,000 BO. No record prior to 1980. Cumulative last 5 years 1,500 BO.
Our little family company is clearly scraping the bottom of the barrel. We know that. Yet it appears to me that we are able to get a better return on our CAPEX than the large shale companies.
I do agree our LOE is higher, but even factoring that in, it appears our field competes very well with the shale basins dollar for dollar.
Several new water flood projects were completed here 2006-14. Almost all have a better return, based on my estimate of CAPEX costs, than the shale basins.
Hope I am not boring all with these posts. I just continue to be astonished that shale is now considered, low cost, or at least not high cost. If it isn’t high cost oil production, what is? I always thought we were in a high cost area. The last major left here in the late 1980s.
To add to the discussion, it appears 9060 active hz wells in the Permian Basin as of 5/31/2018 that had first production between 1/1/10 and 12/31/15. 4,175 produced less than 765 BO, or less than 25 BOPD in May, 2018. Wells just 2.5 to 8.5 years old.
When are y’all gonna buy some new land.
No need for that. Enough locations left to drill 2-4 wells for a long time, if we decide to start again.
Do those wells make ANY gas?
Shallow.
As a betting man I would wager your company will still be operating and producing long after the shale companies have ceased to be and the tax payer is footing the bill for all the P&A costs.
Guym,
Permian can probably grow by about 2600 kb/d from Dec 2017 to Dec 2023, under a high oil price scenario, including Permian, North Dakota(ND) Bakken/Three Forks and Eagle Ford under the same high oil price scenario (prices on right hand axis of chart in 2017$/b for Brent crude price), output peaks in 2023 at 7800 kb/d for the PEB model (Permian, Eagle Ford, Bakken(ND only). Economically recoverable resources are 50 Gb from 2005 to 2041.
I know it is theoretically possible. I just have my doubts it will happen.
Guym,
There’s no doubt that a lower oil price scenario would result in lower output. Nobody knows what future oil prices will be.
The medium oil price scenario has a Permian peak in 2023 at 4600 kb/d, this is an increase of about 2500 kb/d from Dec 2017 to Jan 2023, prices rise to $113/b by Jan 2027, the number of completed wells only needs to increase by about 3.5 each month over a 3.5 year period (from 390 to 538 new wells per month). Maximum completion rate is Jan 2022.
Seems doable.
I dunno, read the article I posted above. It is estimated that it takes 415 completions a month, now, just to keep production flat. It will take more than that a year from now with declines. As you increase production, it will take more to cover declines, as the first year decline is always a killer. I don’t think 538 wells a month will get you there. They are fighting GOR problems, now. Plus, a lot of the new wells being drilled are tier two stuff, already. Going to take a lot of activity to get another 2.5 million increase. I tried to figure it out, but ran out of fingers and toes?
Guym,
I ran the numbers, assuming a TRR of 36 Gb for Permian (28 Gb for areas assessed by USGS and another 8 Gb (WAG) for Delaware basin Wolfcamp and Yeso and Glorietta formations in NM Permian). The well profile is based on data from Shaleprofile and I also assume new well EUR decreases starting in Jan 2019 where the rate of EUR decrease depends on number of wells drilled.
Email me if you are interested in looking at the spreadsheet, basically its the same analysis I have presented for the Bakken in the past.
https://peakoilbarrel.com/us-light-tight-oil-lto-update/
https://peakoilbarrel.com/the-future-of-us-light-tight-oil-lto/
https://peakoilbarrel.com/eagle-ford-permian-basin-and-bakken-and-eagle-for-scenarios/
Enno Peters had the post below
https://peakoilbarrel.com/enno-peters-post/
A key post to understanding my “Red Queen” models (first introduced to me by Rune Likvern at the Oil Drum and later explained by Paul Pukite [aka Webhubbletelescope] at the Oil Drum) is at the link below.
https://peakoilbarrel.com/oil-field-models-decline-rates-convolution/
Some of my early work on these models can be found at
http://oilpeakclimate.blogspot.com/2012/
and
http://oilpeakclimate.blogspot.com/2013/
Eno has done a fantastic job, and there is no doubt the oil is there. The only question is the amount of activity that it would take to get to a certain level. I know that in the Eagle Ford it would take two tier two wells to come close to equaling one tier one well. If you point out a particular area in the Eagle Ford, I could usually come close to identifying it as a tier one, two, or three. I’ve looked at it enough. I haven’t done the same in the Permian, but if experts are claiming tier one stuff is close to expiring, your looking at tier two stuff, and some problems with GOR that affects ultimate EUR for a well. To assume that it would take x number of wells to increase production to a certain level, would take analyzing it bit further than looking at what has happened in the recent past. You may be right, and we have sufficient tier one stuff to take us into 2025, but I have my doubts. When we run out of tier one area, it will take twice the completions to maintain production, and even more to increase it. I couldn’t begin to quantify that, because I am not sure of the amount of tier one area left, and exactly how many tier two wells it would take to equal one tier one well. I do know they are already drilling in tier two areas. They did the same damn thing in the Eagle Ford until they finally figured out the rock is not equal everywhere.
Drilling at the same pace in the Eagle Ford, EOG May have ten years of equal production with tier one wells. If they wanted to really gear up production, they could use it up in two to five years. But that would be pretty stupid, no??
Guym,
There is likely to be a gradual transition from low EUR tier 1 wells (just above the cut off from tier 1 to tier 2) to higher level tier 2, just on the other side of the cut line.
The model accounts for this by assuming better prospects are completed first and gradually companies move to lower quality areas.
My guess is that if we look at the statistics there are not a group of x wells that all have an EUR of 300 kb and another group of y wells all with EUR of 150 kb. Typically there is a log normal or parabolic fractal distribution or some other maximum entropy probability distribution of new well EUR.
At this point most tight oil wells have not reached end of production so EUR is very much a guess.
It depends on the economic limit rate. As the population of older wells increases, as long as they kept on production, its easier to sustain production. I tend to agree with you, not only is it hard, its actually less economic because there will be a large overspend on facilities. The best outcone for everybody is to have the TRC raffle permits to keep production and jobs steady, allow infrastructure to match the target rate.
Let’s say the decline rate after 7 years remains fairly stable at 9% per year, and oil prices justify producing wells until 300 barrels per month. If the average for these wells is 30 BOPD, 20 thousand wells will make 600,000 BOPD. When you overlay younger wells it seems to me 3 million BOPD is a decent rate. But i know the TRC is dumb, and the oil companies drilling shales can be double dumb.
The only raffle the State is likely to participate in is the Lotto they use to make money on from the poor people. RRC is also likely to be interested only in the tax on oil.
ALL-TIME LOW SPARE CAPACITY COULD SEND OIL TO $150
https://oilprice.com/Energy/Energy-General/All-Time-Low-Spare-Capacity-Could-Send-Oil-To-150.html
“Our view is that by November 4, we will have lost between 1.3 and 1.4 million barrels [of output] a day. It is a very big number. That’s based on the view that the U.S. will allow a few temporary exception waivers,” Jean-Louis Le Mee, CEO at London-based Westbeck hedge fund told Reuters. “Ultimately, we could see losses from Iran exceed 2 million barrels a day,” Le Mee said.
…
Replying to one of President Trump’s tweets blaming OPEC for the “too high” oil prices, Andurand said in mid-June that “OPEC has the lowest spare capacity ever right now. There is going to be a real issue. Prices will be above $150 in less than 2 years. Eventually higher prices will bring more supply. But right now too little supply coming over the next few years despite US supply growth.”
Mostly that is just advertising for the hedge fund, but there are increasing number of reports like that now. The hedge funds never mention the gathering gloom in the economy that could drive things the other way because that would of course push the hedge funds the other way, at least down to barely $1 billion bonuses, but maybe completely over the edge. Oil traders, however, seem to think demand side risks are controlling (see end of article).
George, don’t know if you follow Steve Kopits. What do you make of his comments on his blog yesterday, re: DOE Week of Aug 10th: Bullish.?
http://www.prienga.com/blog/
Specifically:
Product supplied was weak and gasoline supplied was very weak. More and more, the data suggest that the US consumer has hit a tolerance limit around $65 / barrel WTI.
And
This report does not underpin oil price weakness visible in the last ten days or so. Such weakness is more likely related to global demand, as Trump administration tariffs may be precipitating an economic crisis in the emerging economies. More in the body of the report.
Good luck to the global fossil fuel based economy at $150!
Cheers!
Thanks I read him a bit, I thought he was better when with Douglas Westwood. I think he made a big prediction about an oil price limit for consumers which didn’t pan out, and that tends to colour everything he does since (to justify his error). To me most short term economic predictions are not much more than anecdotal and often are worse than random, but as long as the prognosticators are flashy enough, have shiny teeth and keep saying the same thing nobody cares and they still get paid (the books Signal and Noise, and Superforecasters have a lot of data backing that up). But more important short term is what the speculators and hedgers think, whether correct or not – some quote from Adam Smith (or other) about beauty competitions is relevant I think but I can’t remember exactly what.
The limit ought to be closer to the $130 to $140 per barrel for real crude and stabilized condensate.
That price seems reasonable. When it gets there it will be a boon or the electric vehicle industry, since cost per mile ( and maintenance) will be so much cheaper than a gasoline fueled vehicle. This applies especially for passenger vehicles. Cargo vehicles will likely be versions of hybrid for quite some time.
AFTER $80-BILLION BLOWOUTS, MEGA OIL AND GAS PROJECTS ARE BACK
https://www.worldoil.com/news/2018/8/14/after-80-billion-blowouts-mega-oil-and-gas-projects-are-back
From liquefied natural gas in Mozambique to deep-oil in Guyana, the world’s biggest energy companies are gearing up to sanction the first slate of mega-projects since the price crash in 2014, Wood Mackenzie Ltd. analysts, including Angus Rodger, said in a report. Firms will approve about $300 billion in spending on such ventures in 2019 and 2020, more than in the three years from 2015 to 2017 combined.
That spree will provide the first real test to the capital discipline that energy companies have vowed they adopted after oil’s collapse, when they downsized their ambitions and began to complete projects on time and below budget. Before the crash, the 15 biggest oil and gas projects combined went $80 billion over budget, eating away at investor returns, Rodger said.
$300 billion sounds a lot, but it isn’t. I’d guess more than half is LNG or other major offshore gas. That leaves $75 billion a year for oil, and that only buys around 600,000 to 1000,000 bpd of new production. And yes, there will be huge overruns if they try to fast track all that to fill a growing supply hole using service and supply companies that have suddenly had to rapidly recruit and grow.
https://oilprice.com/Energy/Crude-Oil/Crude-By-Rail-Could-Save-The-Permian-Boom.html
Another oilprice headline mismatch. I kept looking for the meat of the headline in the article. Didn’t find it. Of course, the editor responsible for it may not have realized that the Permian is not in Canada.
This shows recent activity in Bakken as of last month. The black circle is the approximate core of 50 km radius. Most activity is there, though it extends a bit into Williams county to the NW and a small bit to the south, and there is a chunk taken out of the SW. The ring of dry holes (red) still constrains everything, but it does look like things, drilling especially, are moving away from the very centre to the outer edges of the core. Brown is DUCs, blue is active drilling, green open permits and yellow new production wells since September 2016.
A question for the dry wells:
Is this clear after drilling, or do they have to frack the damned thing before realizing it’s dry?
While I am not clear on the source for Mr. Kaplan’s graph, if the time span originates from the year 2000, dry holes would not be surprising.
Currently, the horizontal wells I have seen labeled ‘dry’ are only a couple per year, and I believe that is for technical reasons, as opposed to actually being drilled into hydrocarbon free rock.
The Bakken consists of 3 layers (benches) with the dolomite Middle Bench being the primary target.
It is the thickest of the 3 benches with an average thickness ranging from 50 to 75 feet, although there is great variation throughout the thousands of square miles in the Williston Basin.
The Upper and Lower benches are true shale and the source of all the hydrocarbons.
The Upper is the thinnest at about 20/25 feet thickness with the Lower about double.
Again, variation exists throughout.
The organic content of the shale is especially high at about 10% Total Organic Carbon, with some locations even higher.
The precision of drilling required, the ability to fracture within zone (minimizing water intrusion/handling), are just a few of the circumstances that continue to place the Bakken at the forefront of unconventional developmental innovations.
The underlying Three Forks are a different entity altogether.
Up to 4 benches are present, with some of North Dakota’s best wells coming from the shallower 2 layers.
The small pale red dots are older vertical wells. Most of the larger red diamonds are for wild cats drilled between 2009 and 2013. I don’t know if they fracked them, maybe a bit of both. Very few wild cats are drilled now and they almost all come in dry. The last set that showed good success were in Williams county and I think that is about where there are a few active drilling rigs now. The most productive area (tier 1 I guess) seems pretty well understood and delimited and at current rates I’d say it will be full at 200 acres spacing in around 18 months. There may be a tier 2 area around the edge but if there is it drops off quickly to where the dry hole ring starts. There may be something to be gained from the different strata but I haven’t seen it in the way the drilling rigs and completions are moving.
Shale basins legacy decline by 350,000 barrels per day in one month.
https://oilprice.com/Energy/Crude-Oil/Nothing-To-See-Here-Frackers-Ignore-Rising-Well-Decline-Rates.html
That is a staggering decline rate per month.
What will it be by 2022
I guess each shale has its own oddities. In the Eagle Ford, the gas and oil are more contained. You want a higher gas to oil ratio when it first pumps and for later, as the gas pushes the oil out like a pump. If pressure drops, it frequently needs artificial lift. The wolfcamp is a much thicker, less contained shale. Oil moves around more, from my limited understanding. You still get the gas, but the oil starts going bye, bye.
In the Eagle Ford the problem is inconsistent rock. In the Permian (wolfcamp), it’s going to be chasing the oil.
First year declines are always the worst. That’s why large increases like 2.5 million like they expect out of the Permian will require a huge activity level to get to. It’s theoretically possible, just not reasonable.
I’m sure everyone here has had a look at Enno’s latest update on Permain. If you look close within 12 months of the end of any given years production. That years production falls below the previous years production peak. So at the end of 2018 just 4 1/2 months away the light blue 2017 production will fall below the peak of year 2016 in Orange. If the trend continues. That’s a hell of a lot of legacy decline for just 2017 to overcome.
Have I missed the Bakken monthly report?
Scheduled to be released 3:00 PM local time (CDT),
Oil Production
May 38,636,998 barrels = 1,246,355 barrels/day (final)
June 36,765,297 barrels = 1,225,510 barrels/day (all-time high 1,246,355 barrels per
day May 2018)
Here is the oil production from North Dakota
“Tomorrow afternoon, ND DMR will release the Director’s Cut that should show a new daily production record. This may well continue at the 1,300,000 bbld rate at least through December.”
“This stuff is changing rapidly, Dennis, and looking in the rear view mirror might not be a prudent approach if one wants to get a sense of what future unconventional production will be.”
Indeed, it is changing. Unconventional shale oil wells drilled in America before Jan. 2016 now only account for 27% of total LTO production (shaleprofile.com). Decline rates are now exponentially increasing and a few more years we’ll see the shale term, ‘terminal decline’ be upwards of 15% annually. GOR is increasing in all basins. There is no market for associated gas. Trump is begging OPEC for lower oil prices to save November mid terms and is killing the export market with trade wars. Thus far in August NO American LTO has left the dock for China, https://twitter.com/chris1reuters/status/1029622909525012481. In spite of higher oil prices, lower ‘breakeven’ prices, and much higher well productivity, after equity swaps and asset sales 2Q2018 sucked for the US shale oil industry. Its scrambling now just to tread water and still borrowing money to do that: https://www.oilystuffblog.com/single-post/2018/08/15/Sho-Me-The-Money-
Yes, change the should to could and there would be no issue.
Bigger data point might be the producing wells only increased by 15 … an exceptionally low number.
That, coupled with the completion number dropping in April, May, June from 86, to72, to June’s preliminary 63 would explain why June was lower than May.
For those following, a 19,000+ bbld rate being under new record territory, that is barely a dozen and a half of new wells that are frequently producing 30 to 50 thousand barrels first month online.
Cowboyistan now and fo’evah.
Keep the faith, Coffee; as dysfunctional and un-factual as it may be, people admire you for it, including myself. In fact, I can’t say that I have ever seen anything quite like it, ever.
First time for everything in life, Mr. Roughneck.
Lol. Naw, coffee is just optimistic. Unfactual, and dysfunctional is the description to put on your cartoon characters of EIA and IEA aka Dazed and Confused. Although, IEA is getting a little better. They are giving advance notice that next month they will give an idea what will happen to the jet when it runs out of fuel. They haven’t made a decision, so far, this month.
Coffee
The current decline rate of 350,000 barrrels per day a month is extraordinary.
From a production of 5 million per day the industry has to replace 4 million barrels of production in a year.
Obviously as the best areas become depleted the production from poorer areas will be much less. Wells in poorer areas produce 200 barrels per day rather than a thousand.
http://euanmearns.com/the-efficiency-of-us-shale-oil-drilling-and-production/
If production ever got to say 8 million barrels per day, the industry would have to be drilling up to 200 wells per day rather than 20. That is a lot of water, sand and drilling equipment in just 5 years.
https://www.forbes.com/sites/rrapier/2018/02/20/is-peak-oil-possible-in-four-years/#1b05604852b6
A peak before then is almost certain.
In today’s oily world, production trends only give brief and confusing insight into the future. Admittedly I don’t understand the incessant need to predict a date, or year when oil production is no longer able to meet demand; is there a Nobel prize for that?
The bells and whistles that Coffee likes to dwell on may be entertaining, but offer little insight into the future either. Nor in my opinion do product prices. As long as unconventional shale development remains in the hands of private enterprise in America the only thing that matters is where the money is going to come from to develop it and how much is that capital going to cost private enterprise.
Today there will be dozens of new MSM articles about how US shale oil production will continue to grow, how it will offset declining production rates elsewhere in the world, how America is kicking OPEC’s ass in the big race, that the entire world is horribly intimidated by the frac’ing revolution, that it’s all a miracle of “resilience, technology, and guts.” I challenge anyone to find an article that discusses the role unprofitability and increasing debt will play in the future of hydrocarbons. They simply do not understand that oil and gas in America is a business and that the unconventional side of the business is actually failing, badly. They’ve never balanced an oil wells checkbook in their lives, don’t understand well economics, nor finance. So they conveniently leave all that out of their flowery predictions.
If folks want to predict the future, forget all production/technology/decline/bottlenecks/export bullshit and follow money supply. If debt doesn’t bother you, or it doesn’t bother you because its other people’s debt and you think you won’t be liable for it, then you will continue to be “optimistic” about the role shale will have in your future. Good luck with that.
Conventional oil is dead. Long live conventional oil. We have a limited amount of shale oil to supplement, and whatever is left under the ocean. I recently read an article that stated that undersea development is now under $40 a barrel. Where do they come up with this shit? No doubt it some new bullshit from E&Ps, promoting their stock. Like $40 shale. Only a few companies have made a very small profit at $70, and that’s almost gone. Yeah, right. E&Ps should not lose money on producing oil at a price below its cost. Let them use up the $60 to $70 oil first. Tough love.
Mike,
I have looked at profitability for the Permian basin. If future oil prices are high as in the scenario below (right axis), and real well cost remains about 9.5 million per well in 2017$ for a 2017 average well design, then cumulative net revenue (in constant 2017$) follows the line in the chart below (left axis in billions of 2017$).
Interest on the debt has been included in the calculation.
Chart below is for Permian Basin medium TRR, high oil price scenario. Model starts in 2010 and I assumed well cost was $9.5 million in 2017$ for the entire 2010 to 2030 period, well costs were in fact lower in 2010 to 2016, so debt for that period may be overstated using this simplified assumption.
Hi Dennis, it doesn’t seem realistic to me to have a stable well production price while the oil price is doubling. Lots of fracking is moving huge loads of sand and other heavy equipment that burns a ton of diesel. I remember doing construction work last decade and from 2000 to 2005 the price of sand and gravel doubled -everyone blamed higher oil prices. Also, as the number of wells that needs to be drilled is ever increasing because of red queen and declining sweet spots, congestion and other price inflation like labor in the basin seem all but assured.
Also you say that interest on the debt is included, but under a high price oil environment, the interest rate is likely to be increasing along with general price inflation. Is the interest rate stable in your assumption?
Hi Stephen,
I do things in real dollars so inflation is included automatically. Interest rates have been relatively low since 2000, I assume a fixed annual interest rate of 5%, the prime bank rate has been below this for much of the 2002 to 2018 period (average rate has been 4.43% from Jan 2002 to July 2018 and from Jan 1990 to July 2018 the average rate has been 5.93%).
Generally well costs have risen due to changes in well design (longer laterals, more sand and more frac stages per lateral foot), at some point the well design will become optimized so that these costs will no longer rise, in addition there are optimizations which occur over time that tend to reduce well cost (for an optimized well design). I have assumed the things which tend to raise costs will be balanced by improved efficiency in operations and design resulting in a constant real well cost in constant dollars.
I would assume at least 8% interest. I dont think banks lend for less than that.
Fernando,
Large companies with AAA credit ratings borrow at the prime rate in the US, think XOM, BP, Chevron, Shell, and Total. Some of the well run tight oil focused companies might also be able to borrow at close to the prime rate.
For bond rates for high quality companies see
https://fred.stlouisfed.org/series/HQMCB10YR
Note that in the long run the low quality companies will be driven out of business by the higher quality companies and the rate may converge to the lower High quality borrowing rate.
I also did the model with a 10% interest rate assumption, it changes the outcome very little.
Stephen Hren,
Model below assumes 10% interest rate (instead of 5%), all other assumptions unchanged (oil prices as in previous chart). Still debt gets paid.
As always clicking on chart gives larger image.
Thanks Dennis, I appreciate it. It will be interesting to see how the whole system of drilling in the Permian will function as it gets pushed harder and harder. Will the sand, water, labor, roads etc all be able to ramp up as needed or will other bottlenecks develop like there is with pipelines now? The oil may be there but not everything else to keep expanding as expected in this isolated area.
Stephen Hren,
You’re welcome.
Note that by no means do I expect the model will represent reality, but the model is fairly conservative in that the new well completion rate expands from 390 new wells in June 2018 to 527 wells in June 2021 (36 months) so 137/36=3.8 more wells completed on average each month.
From Jan 2017 to June 2018 the trailing 12 month average well completion rate increased by 160 new wells per month.(from 184 to 344) over 18 months, an average rate of increase of 8.9 new wells per month. In percentage terms, this is an 86% (344/184-1) increase in the completion rate over 18 months vs a 35%(527/390-1) increase in the completion rate over a 36 month period for the model scenario, effectively almost 5 times slower a rate of increase in the well completion rate.
Perhaps not possible, but in Texas they know how to get this oil production stuff done, they’ve been at it a long time.
One could say the same about stripper wells funded nearly entirely on the back of the taxpayer.
Follow the money.
Peter
The legacy decline figure is both large and will continue to increase.
Looking backwards at several years’ history of Red Queen related projections, the pessimistic scenarios have not come to pass.
Kemp’s 2015 piece “Bakken oil wells and Red Queen’s Revenge” is especially instructive if one views those 3 1/2 year old numbers with today’s.
To skip over a bunch of minutia, the ongoing innovations will continue to expand productive acreage in existing plays and entice activity in ‘frontier’ formations … both the US and abroad.
Peter, the following is definitely related and addresses your question in a somewhat oblique fashion …
Just spent some time catching up on the world of Metal Organic Frameworks (MOFs).
Absolutely incredible stuff taking place. Applications ranging from fruit preservation, medical treatments, water capture from the atmosphere (solar powered), fuel cell optimization, CO2 sequestration, on and on.
Leading edge structures now have 10,000 square meters internal surface space per gram … that is, a single gram of the most advanced stuff has the same surface area as 2 football fields.
Whoa.
With over 20,000 different structures already produced, more than 6,000 a year are being unveiled.
Flexible MOFs, Interpenetrated MOFs, Hyybrid Graphene MOFs, to name just a few types.
Fuzzy heads are going wild.
Mass manufacturing processes are being implemented.
Point to all this, Peter, is the potential to economically capture abundant natgas (methane), and store it on vehicles for transportation is right around the corner.
The Iranians just announced the achievement of the Holy Grail in this field with sub 35 bar (500 psi) containers of large volume.
This could ultimately enable homeowners to fuel CNG cars at their natgas-supplied homes.
Big, big changes are ahead of us.
Depletion may never sleep, but innovation never even takes a nap.
I had been thinking about this adsorbed NG storage potential. It could be a big thing if the innovation comes along. For example, perhaps it would become feasible to grab the gas at or near the source and then transport the adsorbed gas, rather than gathering it all towards a pipeline. This could alleviate the stranded gas from small sources. Not sure if this will ever be feasible?
https://en.wikipedia.org/wiki/Natural_gas_vehicle
Here is an example of where this industry is going-
Plugin Hybrid Adsorbed Nat Gas pickup-
http://www.angpinc.com/phangv/
Hickory
This stuff is evolving so rapidly , it is hard to keep up with it.
What you might be describing are so called “virtual pipelines” that are springing up in the New York State/Pennsylvania region whereby truckloads of CNG/LNG load up in PA and truck it to paper mills, municipalities, industrial users in NYS.
There does not seem to be a lot of technical detail available talking about this, but the ongoing innovations surrounding the handling of natgas are global in scope.
Oil products, specifically gasoline and diesel, are in the crosshairs with economics strongly favoring their natgas cousins.
Coffeguyzz,
Natural gas is also finite, just like oil. The higher the rate of use, the quicker the peak will be approached. Innovation is amazing, but eventually we bump up against the laws of physics, these are not easily changed in this universe.
Also state wide flaring was at 83 percent.
They have to have 88 percent flaring in November. There will be some production curtailments because they won’t meet that 88 percent.
Also if the price of oil falls another 5 to 10 dollars there will be at least 10 rigs laid down over that time frame. Kraken and those type of drillers drilling on the tier 2 and tier 3 will have to lay down there rigs that can’t make any money at 50 dollars crude.
‘They will have to have 88 percent flaring in November. There will be some production curtailments because they won’t meet that 88 percent.’
While I do not, as yet at least, follow the full reasoning behind this production ruling, here is a link with some explanation:
http://www.rrc.state.tx.us/media/29135/statewide-rule-32-venting-and-flaring.pdf
and for North Dakota:
https://energyofnorthdakota.com/home-menu/impacts-solutions/flaring/
With an oil production decline of almost 21,000 bopd it looks like May 2018 could be North Dakota’s peak. Consider a declining rig count, lack of Tier 1 locations, growing gas to oil ratio, and declining reservoir pressure. Of course it possible that they frack the heck out of the ducks or much increased oil prices could make that tier 2 acreage economic. At any rate it doesn’t look like they have any potential for a sustained increase from here.
Maybe there’s a non geology explanation.
We’ve watched the Bakken a long time and there have been other sharper declines that turned out not to be indicative of the end.
But those I don’t think occurred in perfect weather.
Bakken usually slows down for winter, yeah. Conditions get unsuitable for completions so new production falls behind.
The big knock on the EIA’s excessive predictions is that they assume far more uniformity in resource quality/extent than actual wells (and company interest…) indicate. THE most expected source of an ultimate cap in Bakken production is that they run out of prime real estate and have to replace last year’s gushers with next year’s not-so-much.
Might be good to take a look at shaleprofile.com and see how recent “non-core” Bakken wells are performing.
For example, take a look at the six CLR wells completed in Divide Co. First production 10/17. Lease name Bratlien. Field name Sadler.
Not sure what these cost, but not looking good. Only one cumulative over 100K BO and 4 of 6 made under 100 BOPD in June.
As far as I understand, the 88% gas capture is a goal, it is not clear there is much enforcement to meet the goal.
http://blogs.edf.org/energyexchange/2018/04/03/north-dakota-has-a-flaring-problem-that-even-industry-recognizes/
Anyone think with recent oil price decline producers might hold back output so they can report lower and in their world get a price rise? Collusion!
Opec used to do that
Increase in oil production for Norway in July but still down on last year and on forecast.
http://www.npd.no/en/news/Production-figures/2018/July-2018/
Oil set for longest losing run since 2015 amid economic fears
Oil headed for the longest run of weekly declines in three years as turbulence in emerging markets and the ongoing trade conflict between the U.S. and China stirred fears that fuel demand may suffer.
Futures added 0.8 percent in New York, and 1.3 percent in London, amid another labor strike at North Sea oil and gas platforms. Yet prices remained lower on the week, poised for their seventh straight loss in New York, as turmoil in Turkey and the continued Chinese-American tariff battle rattled investors. Oil supplies have also appeared more plentiful as U.S. crude inventories expanded by the most since 2017, OPEC raised output in July and Libya recovered some halted production.
Fed’s monetary policy is the largest bear in the room for global oil demand. Fed will be draining $60 billion in liquidity a month in 2019. Central Banks around the globe either tighten their own monetary policy or they get to watch their currencies implode along with their economies. Tighter global monetary policy isn’t very good for global oil demand. And it’s not so much the Fed’s interest rate hikes that are the problem. It’s the unwind of QE that’s causing a dollar shortage globally.
HHH- good points. If the Central banks don’t tighten up in response (and thus slow growth), then their currencies drop. That makes it harder to pay their debts, correct?
Everything is priced in dollars including all other currencies. Strong dollar makes everything cost more including oil, natural gas, coal. Anything that is useful. Doesn’t matter if you pay in Euro’s YEN or YUAN or whatever currency to pay for useful stuff it’s all priced in dollars. So it’s not just their dollar denominated debts that are an issue.
Fed QT amounts to a margin call on the entire global. Only way for other CB to defend their currencies and economies is to follow suit.
Oil consumption growth is largely immune to economics. You have to eat. Oil brings food to your mouth.
We talked about this a few weeks ago. Have a look at oil consumption decline during 2008/2009. Nearly none. The track with population growth is much more aligned.
QE started in late Nov. 2008. Before decline in oil consumption ever really took hold. The situation to today couldn’t be more different. We have never been through the reversal of QE. QT as it is called. 2008/2009 is no indication of what to expect. 2008/2009 was a sharp but short contraction followed by easy money to stop contraction. This is a long drawn out withdrawal. 2008/2009 they filled a half full bathtub back to all the way full. Now they are letting water out of a full bathtub.
Watcher,
I see how you think. But along with the lines of how you think. If you knew a global oil shortage was in the cards 1-2 years out and the only way you could get out in front of it was by raising interest rates and tightening monetary policy. To slow consumption as long as it wasn’t your own consumption that would be slowing. Would you not? It’s either that or wait for the actual shortage to get here and then fight over who gets their orders filled and who don’t.
Over the years it has been speculated upon now and then, not frequently, but now and then that the Fed, or DOD, or more or less any other government entity was making decisions or taking action on the basis of an awareness of oil scarcity. On each occasion, it would be a secret shared by hundreds and yet never hits the headlines — in this case staffers at the New York Fed.
The FED definitely is trying to reduce its balance sheet. There is no indication at all that any of that choice on the part of Powell derives from some compelling awareness of oil scarcity.
One of the beauties of peak oil is that when the geological time comes nothing having to do with price or politics or choice of any sort will have any effect on what’s in the pipelines and what’s in the tanks. Monetary policy is not going to make oil flow when there’s none left to flow.
You are, of course, correct in thinking that an even distribution of consumption is not how reaction to scarcity will manifest itself. Everyone will have their own agenda. China will demand per capita consumption equivalent to the United States per capita consumption. The United States will demand no country be allowed a growth rate of oil consumption higher than that of the United States — which would shut off consumption growth in China, India, East and West Africa, and most of the Middle East countries.
That’s how the argument unfolds. Per capita consumption versus consumption growth rate. Someone at some point will be angry enough to shoot at ships coming close to newly constructed islands over likely oil fields. After the subsequent casualty counts are noted, it will be clear that someone’s consumption growth rate will be a fraction of what it was before the missiles flew.
The US has waged either warfare or economic warfare against the following countries ever since it was realized that the South China Sea really didn’t have that much oil in and around 1997:
Iraq, Venezuela, Iran, Russia
This represented, what, 1/4 of potential oil production in the world.
I don’t know about secret cabal, but I don’t need a conspiracy to tie Cheney to the Neocons to Foreign Policy
If Oil Slick Dick was involved, it was smelly.
The Castro dictatorship has been waging warfare and economic warfare against Venezuela for two decades. Last year the US imposed a set of rules intended to slow down the looting of the country by the Maduro mafia and the cubans. This is supposed to stop US bond firms and investment banks from financing the regime. As it turns out neither the Chinese nor the Russians are willing to loan either, because so much of what they loaned in the past was stolen. Therefore US rules only stop mullets who will lose their money if they lend to Maduro.
Fernando Leanme,
An article in last week’s Economist included the statement that a coup in Venezuela isn’t in the cards because Cuban intelligence forces are on top of things there.
That’s the first time I’ve come across mention in the mainstream media of Cuban intelligence presence in Venezuela, as you’ve pointed to many times.
god you are tedious. my argument was specifically about oil. you are way off topic. you can’t let any comment critical of capitalism / US (?) go without a stab at castro or imaginary communists or whatever. its a sickness. i’m sure you believe your argument which makes it even scarier. despite all your oil knowledge you are a massive weirdo and troll. stick to what you know – because being a whiny victim doesn’t make you right about anything else. and for the record – the tally is incomparable. capitalism has a much much higher death toll. its a failed system that’s ultimately going to destroy the planet. but i guess you knew that – which is why your hysterical rantings are so juvenile and transparent.
i wouldn’t have written this if you didn’t constantly violate board rules – you are the most politically interjection oriented person on the thread – daily – I mean like every day – four to ten posts that are specifically political and just one-grade above Soviet-style propaganda (ironically?). its only your oil knowledge that allows you to get away with and still be respected, but you are abusing the forum.
I am here only to read Fernando’s wisdom.
Fernando is the greatest!
https://oilprice.com/Latest-Energy-News/World-News/Aramco-Ready-To-Invest-To-Meet-Future-Oil-Demand.html
Full of sound and fury. Not much there.
Adding 400-500 kbpd by 2026 will never compensate legacy decline. It seems Saudi will not be able to produce more than in 2016…
300kb is already being used, according to George’s guess. In any case, it’s a pitiful increase to crow about.
I have the same question on all the big 5 OPEC producers news. If they have all these supposed accessible reserves why spend money exploring? If the old reservoirs keep producing according to their reported reserves then return on exploration costs might be fifty years away, assuming something is found – it looks like Saudi is down to new fields of 50 to 100 mmbbls now.
There was another report that the neutral zone production would be limited to 100 kbpd. One problem is that it partly drains from the Safanaya field that is 100% Saudi.
I was thinking the neutral zone was going to produce about 500kbpd. 100k is nothing.
Guym, from your link:
The message: mature oil fields are seeing an increase in declining production rates, and this must be offset by continued investments in the industry if the world is to meet what is thought to be an 1-1.5 million barrel per day annual demand growth rate in coming years.
This is Saudi Arabia admitting that their old supergiant fields are in decline and that decline is increasing. And you say “not much there”? Oh boy, you had better read that one again.
But Saudi says they have 266 billion barrels of reserves. And to think some people really believe that. But then some people will believe anything.
And just one more point. If those old supergiant fields are declining and that decline is increasing, then what the hell happened to “reserve growth”? If those old reserves are really growing, then they should at least be growing enough to stop the acceleration in decline. 😉
There was recently a third party audit confirming those reserves.
Now maybe the auditor lied or was fooled, but either put up direct evidence that you have to the contrary or quit hand waving.
Bullshit!
Saudi Aramco Oil Reserves Being Audited By Western Groups In Preparation For IPO
It’s long been a mystery what the real-world situation is with Saudi Aramco’s oil reserves, as the state-owned firm has been reporting the same 261 billion barrels reserve figure for the last 30 years or — with no changes, despite pumping out large quantities of oil every year.
Decline rates on the firm’s major fields have remained an unknown as well, as has the quality of the reserves.
SNIP
All of that said, given the amount of political and economic influence that Saudi Aramco has, I’m a bit unsure of how serious the eventual audit results should be taken.
Saudi has magic oil. Whenever one barrel is pumped out another barrel magically appears to take its place. Iran, Iraq, Kuwait and the UAE all have magic oil also. Their reserves have not changed in over three decades. In fact Iran and Iraq’s reserves keep rising. Whenever one of the two increases their reserves, with a pencil, then the other rushes into the drawing board, pencils in hand, to increase their reserves also.
In Guym’s link, Saudi admitted that their mature oil fields are seeing an increase in declining production rates. It is not just that their old super-giant fields are in decline, but that these decline rates are accelerating. If you don’t think that says something about their reserves then you have a real problem.
And Timthetiny, you can shut the fuck up about my evidence. I have been following Saudi Arabia for almost 40 years. In fact, I was there from early 1980 to 1985, almost 5 years. And I am in touch with others who are still there. I cannot say who because I will not jeopardize their job. But they work for ARAMCO, as I did.
Ron, I wholeheartedly agree with you that Saudi’s admission that the rate of decline is increasing in their fields is BIG news. While KSA keeps its actual productive capacity as a state secret, anyone watching should be able to see the signs of stress.
Come November, or sooner, it appears that Iran will be forced to reduce exports by around a million BPD. Many think that KSA, Kuwait, UAE, and Iraq will easily bump up production to counter that loss as well as increasing demand. While some of those countries will be able to bump production, I don’t think KSA is going to be able to answer the bell this time, maybe 10.5 or so is likely their sustainable max.
Of course, what happens to the oil markets when KSA is no longer able to be the “swing producer”. Things could change fast.
Hey no problem. Just turn on the Batman spotlight. Sure, they are struggling to make up for the rest of OPEC drop. However, they are not suited up in their costumes. When they are, they can take on the one million drop from Iran and the more than one million that won’t be forthcoming from the US and Canada.?
Predicting peak oil, a cautionary tale.
http://www.theoildrum.com/node/2143
“Similarly, we do not include the Web Hubble Telescope Shock Model (aspo based) as 2005 Supply figures already dismiss its 2003 Peak.”
Webhubbletelescope predicted peak oil in 2003, so the oil drum did not include his shock model. If the oil drum ran the story today they would exclude quite a few more predictions.
Global Crude and condensate production is now pushing at the 82 million barrels per day peak just before the OPEC and Russian cuts. Total liquids will break 100 million barrels next year.
https://oilprice.com/Energy/Energy-General/OPEC-Production-Stagnates-In-April.html
It is undeniable that those who said higher oil prices would allow more expensive processes to extract more oil were correct. None of those on the Oil Drum could have predicted so much oil as to crash the price to $30 a barrel in 2016.
Very few predicted there would be a Saudi attempt to break Iran using an oil price war, or that US producers would find lenders willing to finance so much LTO in South Dakota and Texas.
Ah, fudge, nobody has anything close to an accurate prediction of what will be. Heck, the lower level Pakistani official who predicts a Kuwait size find in the near future may be right, Quien sabe. However, it does appear we will soon be up to our neck in mierda, pretty soon.
Fernando
Saudi Arabia has used it’s oil as a weapon before against it’s enemies. Firstly against Israel and the west with the oil embargo. Then against Russia on Reagan’s asking, in return for weapons.
https://www.quora.com/Did-Saudi-Arabia-collude-with-the-US-to-bankrupt-the-Soviet-Union-by-dumping-oil-prices-in-the-1980s
The collapse of Russian export revenue from oil was the final nail in the rotten coffin for the Soviet Union.
Saudi Arabia was hoping to do the same in Iran and cause a revolution, damaging shale oil at the same time was an added bonus.
It may still work.
https://nypost.com/2018/06/25/protests-in-iran-prove-trump-is-getting-it-right/
https://www.thedailybeast.com/new-bloody-riots-in-iranian-city-of-kazerun-may-be-the-shape-of-things-to-come
Fernando,
I think you mean North Dakota. Pretty close to zero C+C output from South Dakota (3 kb/d in May 2018).
Peter,
There were a wide variety of views at the Oil drum, Webhubbletelescope’s initial oil shock model did not account for reserve growth, future discoveries, oil sands and LTO output.
When these are accounted for we get, for the best guess scenario the chart below, note that this is based on the work of Paul Pukite (Webhubbletelescope) using discovery data gleaned from the work of Jean Laherrere.
It is an update of the post below from 3 years ago.
http://peakoilbarrel.com/oil-shock-models-with-different-ultimately-recoverable-resources-of-crude-plus-condensate-3100-gb-to-3700-gb/
Some earlier work I did with the oil shock model can be found at links below (from July and August 2012)
http://oilpeakclimate.blogspot.com/2012/07/
http://oilpeakclimate.blogspot.com/2012/08/
Dennis
Paul Pukite, did not take into account reserve growth or future discoveries! Just shows how little he really knew.
When I asked him 10 years ago to produce a production graph for Iraq he threw his dummy out of the pram.
I think I remember his graph having Saudi Arabia peak in 2010. God knows what figures he was using for that.
Peter,
The model developed over time, at first he took the commonly cited 2000 Gb of World C+C 2P reserves and showed what the model would look like under an assumption that no more oil would be discovered and reserve growth would be zero (following Jean Laherrere’s assumption).
Later a discovery model was developed (called dispersive discovery) and added to the original oil shock model.
As you may have heard Rome was not built in a day. 🙂
Very easy to criticize other’s modelling efforts. Hindsight is 20/20 as they say.
We didn’t have an accurate estimate of Saudi reserves 10 years ago, the same is true today.
Also in 2003 when the first iteration of the oil shock model was presented, there was not an expectation that oil sands or tight oil would really provide that much oil, so the focus was on conventional oil.
In addition in 2003, most people did not expect that $100/b oil could be sustained by the World economy for more than a few months based on the experience of 1979-1982, this in hindsight was an incorrect assumption based on the experience of 2011-2014. Part of the reason the plateau in conventional output from 2005 to 2012 did not result in a decline in conventional output was the high oil price which led to a lot of investment in deep water projects, more than was expected. It also led to higher rates of exploration and discovery than were expected.
The cornucopians would argue that there will always be enough oil discovered to satisfy demand, but they also argue that so much will be discovered that oil prices will remain at $50/b or less (in constant 2017$) in the long run.
I don’t think both of their assumptions are correct, but the first will always be true as long as oil prices rise to high enough levels to balance supply and demand. Note I define demand as “consumption” and supply as “production”.
I include deep water and artic oil as “conventional” oil.
It may be “conventional”, or maybe not if they add horizontals. There is still true conventional that can be produced fairly cheaply. No doubt, there are still Wilcox sand oil traps to be discovered, along with thousands of other fields. But cheap oil will no longer supply the world needs, probably. More expensive oil is not being produced, because the price is not right. Traders only see oil as, mostly, a single commodity, and don’t give a damn where it came from. E&Ps need to sell this high cost oil to keep afloat. The EIAs, IEAs, and Opecs of the world are compounding the problem by indicating we are probably ok, for now. The CEOs of the E&Ps are compounding this idiocy, with statements like we can make a profit at $40, whether it is a horizontal, or a deep sea well. With a minor caveat that the future may be a problem. Nobody gives a damn about the future. Low price gasoline, now, is much more important. This will continue as long as traders interpret the EIA weekly as representing world inventory. In total, cheaper oil, and much more expensive oil that make up total inventories. But, according to “experts” oil price can go down again to $50. It may, because we are pretty stupid in group think. It can be flushed, but it still floats.
Dennis
People like Dr Colin Campbell were taking into account future discoveries and reserve growth well before Web arrived on the scene.
With regards to hindsight, Webhubbugscope asked me in 2009 when I thought peak oil would occur.
Taking into account deep uncertainties in countries like Iraq, Libya, Venezuela, Nigeria etc. So I put the peak at between 2016 and 2022.
If shale oil did not succeed the 5 million barrels would have been met with OPEC at full stretch and every other country at their limit by now.
Shale oil has made up for declining non-OPEC production, buying us about 6 years of increasing oil production.
However Shale oil has been a double edged sword, it turned up too much too soon and along with Saudi refusal to cut production crashed the price.
So now I believe global oil production will peak between 2022 and 2026.
But then Iran may turn into a Libya or Venezuela and all predictions go to pot.
Peter,
Not clear you are understanding. Campbell and Laherrere also predicted earlier peaks than what occurred, Laherrere believes there is no reserve growth and in 2003 expected discoveries plus reserve growth would be about 2000 Gb for conventional C+C (conventional does not include extra heavy oil by Laherrere’s definition), in 2003 nobody foresaw much output from tight oil.
For an updated oil shock model see
http://www.theoildrum.com/node/3287
See also
http://www.theoildrum.com/node/2376
In this second post much can be learned from the comments.
Keep in mind these posts were in 2007.
I also am mistaken that future discoveries were not included in the original shock model.
The Hubbert linearization analysis that was in vogue in 2003, lead to the expectation that the URR for C+C would be about 2000 Gb, the model thus assumed total discoveries would be 2000 Gb.
In addition the model made the error of trying to match C+C+NGL output with C+C discoveries, this mistake was corrected later.
Another problem with the original model was an assumption that future extraction rates would remain fixed at whatever the most recent level was, future extraction rates are unknown and the best we can do is present a variety of assumptions about what future extraction rates might be.
In addition, Paul Pukite initially suggested that I model extra heavy oil separately from lighter oil, later I decided to model tight oil separately as well. So my “oil shock model”, combines a conventional shock model (C+C less extra heavy and tight oil), with an extra heavy oil shock model and a “Red Queen” tight oil model. The tight oil model for the World assumes that tight oil from the World minus US will have a URR similar to the US (URR about 50 Gb) that will have a somewhat similar shape to the US tight oil profile, but starting maybe 15 years later. Clearly this is a wild guess. World tight oil URR could range from 50 Gb to 150 Gb, my best guess is 100 Gb.
Why can´t I open theoildrum pages? Is it blocked for people outside the US?
Freddyw,
Don’t know.
Here are my Bakken updates. First the 1 months after first production data. It´s down in June but still very high compared to earlier years.
There were 83 new wells in June compared to 106 in May.
Here is production grouped by year. Most years saw a decline in June. 2007 to 2017 together declined by 55 kbpd. 2/3 of it was from the 2017 wells.
Gor is increaseing for almost all years and quite fast too.
That’s a surprise that there is so much communication between wells.
Freddy this IP chart since 2016 seems to have some sort of periodicity. This make any sense?
I goes up and down a lot. Fewer wells cause more noise so it could be just random. But the number of wells has gone up and it´s still noisy, so don´t really explain it. I can see in the data that average number of production days is down a lot in many of the months with lower production. Not sure why that is but could possibly have to do with the wells being much closer to each other. They have to pause production while doing some work on another well.
Any explanation on the GOR increase? All wells!??
There has been much discussion about declining reservoir pressure leading to increasing gor’s, basically the gas flows easier than the oil. Scott Lapierre is a petroleum engineer who has published about this.
https://www.linkedin.com/pulse/bubble-point-death-pxd-oil-mix-challenge-scott-lapierre
Good read, thanks. I have seen pictures of the sprayberry, and it definitely looks like sandstone. The wolfcamp does look like shale, but I understand it really has no containment. The parent child well problems have indicated it has much of the same problem. The Bakken is a fairly new field, yet is exhibiting fieldwide problems in the GOR. Permian has been beat on for over 50 years, so I would expect the problem to grow a lot more in the future. Don’t know if this makes sense to someone who really understands it, but that’s my understanding.
I have a financial background and am not an engineer. So I may have misunderstood, but it was my understanding that the increasing GOR, decreasing reservoir pressure problem applied to all or almost all of these unconventional wells. Some formations may be affected to a greater or lessor degree, but most all of these are likely to see some decline in productivity as they age. If Scott is correct, that decline might be a lot larger than seems to be anticipated.
To your point about the Permian, I worked for a big driller out there in the 70’s, almost all our Permian wells were Sprayberry. Working for a smaller driller later, I believe we did a reentry on a Wolfcamp, and I think I remember a Bone Springs prospect. But it seems that the Wolfcamp and Bone Springs were known, but lightly tested or produced until frac technology progressed to increase their recovery rates. So, they were still pretty fresh when the boom began.
Some of the GOR changes have nothing to do with geology. I think about 30% of the overall increase is just from reduced flaring, which means the primary separators run at lower pressures. There’s also a small seasonal effect, so hotter months mean the separators and flowlines run slightly warmer (June temperatures in ND was high, like the rest of USA, and more than May).
Certainly, a seasonal effect would better explain all wells increasing GOR at the same time. Still, I read another article by him, and it seems pertinent.
https://www.linkedin.com/pulse/bubble-point-death-pxd-oil-mix-challenge-part-2-scott-lapierre/
Yet, I find this concept extremely difficult to apply to the Eagle Ford wells. Traditionally, gas drops first, causing the flow of oil to slow down. Putting them on pumps increases both again. There may be some of this effect towards the end of the production (4 to 5 years), but it would be difficult to tell, as it would be insignificant by then.
Spreyberry, Bone Springs, and most of the rest of the fields in the Permian have pictures that resemble sandstone. Wolf Camp definitely looked like shale. Is the Bakken sandstone, or shale? Ok, I found a picture. It’s definitely shale.
The seasonal effects are small. The long term picture is changes in reservoir pressure and, probably, how the reservoir GOR affects the flow in the fractures (I doubt if that is completely understood). The GOR changes will affect the ultimate recovery, but even without them the EURs are still just a guess at the moment and very few wells have got to end of life yet so there are plenty of other unknowns.
Those papers by Lapierre don’t read as if written by an experienced reservoir engineer, he seems to be stating fairly well known phenomena as if they are something he’s just discovered.
Seems to be promoting his calculation of said GOR effect pretty much. Can you patent a calculation?
One can provide valuable services to lending institutions using models for GOR behavior and how flow regimes transition from one phase to another over the life of a shale well. That is precisely what Lapierre is doing and he makes no claims otherwise. People struggle with how pressure depletion occurs in solution gas driven, nano-fractured rock; based on some comments here, that is obvious.
Lenders need all the help they can get; the shale oil industry has been masterful at lying about its EUR’s and lenders have, and still are, falling for it hook, line and sinker. DCA used to determine type curves in shale oil wells, shortly after the well has had induced frac energy stuffed in it, is a big ‘ol scam. If we were to see a re-appraisal of the value of CLR’s mansion, before re-financing, the mansion would not be worth half of what mortgage is.
Ignoring increasing GOR is not a good idea. Ignoring engineers that don’t agree with each other is always a good idea. Something is causing terminal decline rates to accelerate and flaring of associated gas to increase dramatically; its just Mother Nature doing Her thing.
USA weekly ending stocks of crude oil & products, August 10th
https://pbs.twimg.com/media/Dk4uNz0X4AA9O2d.jpg
Weekly change: https://pbs.twimg.com/media/Dk4vDb2XcAECv63.jpg
Gasoline stocks: https://pbs.twimg.com/media/Dk5X4loX0AA8wAK.jpg
https://oilprice.com/Energy/Natural-Gas/Overlooked-Gas-Project-Could-Be-Biggest-Winner-In-Trade-War.amp.html
Convoluted Exxon Mobil favorable events in Papua New Guinea following a large earthquake blamed on gas drilling. Operative word convoluted.
https://oilprice.com/Energy/Energy-General/Venezuelas-Key-Refineries-At-Risk-Of-Seizure.amp.html
Citgo was not much use to Venezuela any more, anyway.
North Dakota, natural gas production. Chart showing Produced and Flared
https://pbs.twimg.com/media/Dk_FCxTXsAAckBE.jpg
A chart showing the ratio of natural gas produced / crude oil production
https://pbs.twimg.com/media/Dk_XtypXcAEjVFC.jpg
The price of gasoline in India and China, Bloomberg charts…
India: https://pbs.twimg.com/media/Dk9uaxvXoAAZpeL.jpg
China: https://pbs.twimg.com/media/Dk9spHMX4AA3b7p.jpg
Thing with the GOR/reservoir pressure is that there’s no emperical data on what the sort of fracking broadside unleashed in the core of the Bakken results in. Punching that many holes in a conventional field would be criticized as bad management. Is the impact on the sweet spot reservoir supposed to be zero from fracking that way instead? Doesn’t seem like it would be but everyone drills like it can be discarded.
I guess we will see.
This is probably of no use to anyone but if someone was wondering what this data looked like but didn’t have enough time to do a chart then that person might find it interesting???
Can the U.S. Dominate Energy? – Joe Leimkuhler
(TL;DR – Joe Leimkuhler -apparently involved in GOM O&G- thinks it can.)
https://www.youtube.com/watch?v=AR-YWLutOSk
Appollogies if already posted.