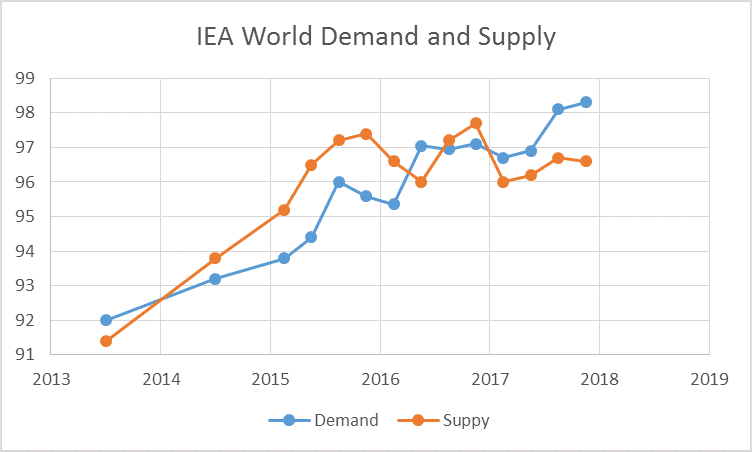
The IEA released highlights for the December Oil Market report in mid December. I have used information from the November report and assumed OPEC crude output will be 32.7 Mb/d and non OPEC output will be 500 kb/d below the November report supply estimate. I have also used the demand estimates from the December highlights.Based on these assumptions World Supply from the first quarter of 2015 to the fourth quarter of 2017 is greater than demand by a total of 280 million barrels. In other words, World crude stocks should be 280 million barrels more than the Dec 2014 level at the end of 2017, if the supply and demand estimate presented is correct.
Also the fourth quarter 2017 demand estimate is 1.7 Mb/d higher than supply. If that draw on stocks continues into 2018 then World crude stocks would fall to zero by mid June 2018. Higher oil prices by 2018 is likely to result in higher FSU and OPEC output. My expectation is World crude plus condensate (C+C) output will remain in an undulating plateau from 2015 to 2020, followed by slow decline in C+C output.
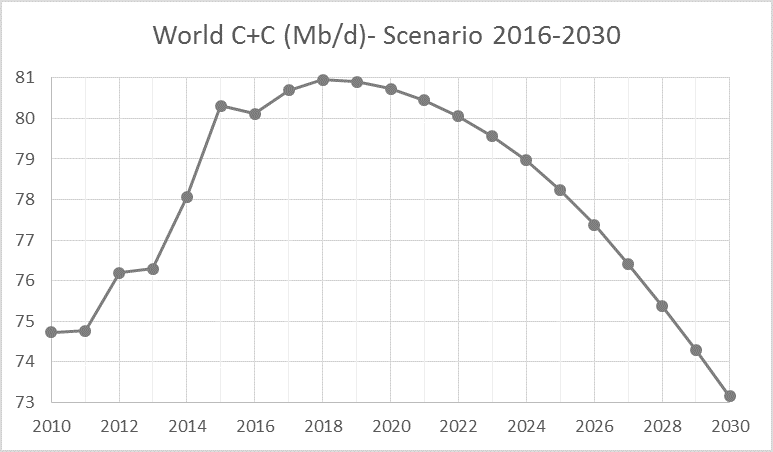
The scenario below is based on 3300 Gb of C+C URR (with 500 Gb of extra heavy oil from Canada and Venezuela combined), using Webhubbletelescope’s Shock Model with a medium URR scenario.
243 responses to “IEA Oil Market Report- December 2016”
In relation to OPEC we’ll no doubt have a close look at their production in the next months. In the 2 following posts, quotas for each country in the November 2016 agreement are shown compared to historic production.
9/12/2016
OPEC’s 2017 production cuts: a confusing numbers game (part 2)
http://crudeoilpeak.info/opecs-2017-production-cuts-a-confusing-numbers-game-part-2
8/12/2016
OPEC’s 2017 production cuts: a confusing numbers game (part 1)
http://crudeoilpeak.info/opecs-2017-production-cuts-a-confusing-numbers-game-part-1
In 2017, it will also be interesting to see how Trump will handle the issues around the South China Sea
28/12/2016
Exxon plans to produce gas close to China’s 9-dash line
http://crudeoilpeak.info/exxon-plans-to-produce-gas-close-to-chinas-9-dash-line-claim
24/12/2016
Peak oil in the South China Sea (part 2)
http://crudeoilpeak.info/peak-oil-in-the-south-china-sea-part-2
I like your posts Matt. Especially the ones on Egypts play by play as it gets flushed down he hopper. Do you have any suggestions as to how Mexico might play out as it hits the cliff?
Mexico is catching a lot of migrants from points south. Honduras, Guatemala and El Salvador are failed states. Mexico is a pressure cooker with no release valve.
http://www.reuters.com/article/us-mexico-immigration-idUSKBN1442Z0?il=0
Hi Dennis, Happy New Year.
Regarding your 2016 to 2030 chart: how fast are you factoring extra heavy Canada and Venezuela resources to come on line to meet that production curve?
After the Jean Laherrere post on global reserves I had a go at predicting a future supply trajectory myself. It is based on 620 Gb developed declining at 4.35% annually; 150 Gb discovered and undeveloped with about 120 identified from identified conventional projects on companies’ books and 30 from shale; and 25 Gb undiscovered represented by a linear decline from current discovery numbers over twenty years. That gives 795 Gb reserves remaining – about what he had.
Note the figures in the legend give the overall production in the years shown on the chart.
Extra heavy oil is given as 30 kbpd coming on stream every year until 2023 representing the drop off in tar sands development and probable falls in Venezuela production, and then 200 kbpd added for every year after. As the projects take about 5 years to complete this would represent about 8 in development at any one time, but also requiring projects for 3 or 4 upgraders, 1 or 2 pipelines and a new refinery to be ongoing in parallel.
For new conventional projects I assumed a one-year ramp up, a ten-year plateau and 10% yearly decline to shut down after 25 years. The numbers coming on line until 2022 I’ve taken from what is currently on the E&Ps books with some probable short-term projects that could be developed in time. After that I just made reasonable guesses, assuming an extra three-year development time from discoveries for ne fields.
The results aren’t very different from Dennis Coyne’s except there isn’t a new peak (in 2018 which he is predicting – I don’t know where that extra production could come from based on current development activity) and there is a big gap in 2019 to 2022 reflecting the capital cuts over the past 3 years.
The biggest issue for me is that, assuming exporter countries maintain the same overall internal demand at about half current production, then net exports would fall by 50% in 2032 and to zero by 2041. There is also a 20% decline in available exports between 2018 and 2023. Things wouldn’t be quite so clear cut as some countries will continue to export while other producers become net importers.
If this is close to reality I don’t see it making transition very easy. Apart from added renewables and nuclear, and increasing efficiencies there will be a turn to gas if there is sufficient easily available, a loss in demand from recession (depression in a lot of places I suspect), and I think also an inevitable turn back to coal maybe with another push to in-situ gasification.
OK, I have to bring in a not-directly-oil-related comment, because it’s related to demand. My non-oil projections for growth of electric cars — which are the key technology displacing oil usage. I believe since they are superior technology, they are essentially production-limited. I believe price issues will be automatically addressed by economies of scale as production increases.
So my production projections see a big increase in electric car sales in 2018 (thanks to models we already know about). I believe the high sales in 2018 cause much, much more capital , which causes much more investment by car companies. This takes 2-5 years to pay off. So I see a huge increase in production (and therefore sales) in the 2020-2023 time range.
Specifically — to get back to oil — I believe sometime in that time range, 2020-2023, is when electric car sales per year become large enough to displace an amount of oil exceeded the natural decline rate of oil fields (I’ve seen different estimates for that rate, but it’s a close enough range that it doesn’t matter for this projection). This is still well before market saturation is reached.
So combine this with your projection out to 2022, along with Laherrere’s and Coyne’s projections out to 2022, all of which are similar. Before sometime in the 2020-2023 range, we can expect petroleum demand to remain solid. But after that, demand will be dropping faster than the natural drop in supply. There will be a *glut* of oil. There will be no new drilling, or at least not profitably.
If a bunch of oil projects are started in the 2016-2023 period which start producing after 2023, they won’t pay off, they’ll be big money-losers and make the glut worse. (With a three-year project time, the glut will remain brutal for three years afterwards as old projects go online.)
At that point, low oil prices become the determining factor in the size of reserves. High-priced producers go bankrupt and shut down. Refineries, now with excess capacity, go bankrupt and shut down. Refineries have to retool to optimize for aircraft kerosene production instead of gasoline production. I think it’s about this time — after a bunch of bankruptcies which leave wells in a derelict state — that the regulators start going after the survivors to cover their environmental liabilities preemptively, making them plug wells properly. I’m not exactly sure how the rest of the shakeout happens, but I’m glad to be totally out of the industry before then.
Thanks George. That’s a fascinating chart. Thanks for breaking out the different production sources. How the world is going to get by on 20% less available exports by 2018 to 2023 is going to be interesting. Zero available exports by 2041! That’s gonna be a damned mess.
Hi George,
When oil prices rise in 2017 and 2018 there will be increased output from Russia and OPEC, in my view.
A lot of output in those nations has relatively short time for development, they just need to develop already discovered reserves, there will also be some increase in US LTO output and Canadian oil sands output with higher oil prices. Possibly the peak will be lower, but I expect a at least a 50% probability that the 2015 peak will be surpassed.
Dennis – can you say what those resources are – i.e. field names, expected production, time to develop. Because I know of nothing like that, and can’t think of anything in the past where 1 or 2 mmbpd has been bought on line from FEED to plateau in 18 months, which is what you seem to be assuming. I can only think of Iran as a possible source – but most of their stuff is gas flood, that needs big compressors to provide the injected gas – it is impossible to go through a design, procurement and start-up cycle on such systems in under 24 months.
Hi George,
There are combined cuts of 1.7 Mb/d. That production from OPEC and Russia can be brought online in June 2017. Also infill drilling will increase in other nations as oil prices increase.. My scenario is pretty conservative relative to IEA and EIA Outlooks.
US lto can ramp up quickly with high oil prices.
Hi George,
I do not have information on specific fields and developments.
The IEA and EIA do have this information and their future outlooks are quite a bit more optimistic than what I have presented. I believe that those estimates are too optimistic and yours may be too pessimistic.
A problem with your analysis is that you seem to assume no reserve growth just as Jean Laherrere does. I believe an assumption of no future reserve growth leads to too pessimistic an outlook.
US reserve growth from 1980 to 2005 was about 63%. I have assumed C+C minus extra heavy reserves will grow by about 300 Gb from 2010 to 2060 or 300/850=35% over 50 years. Perhaps that is too optimistic, time will tell. Also I assume LTO resources in the US are only about 40 to 50 Gb, possibly too optimistic, but less so than the EIA.
Hi Survivalist,
The Extra Heavy (XH) Oil Scenario is in the chart below. Jean Laherrere has a slightly more aggressive scenario with a peak of about 10 Mb/d.
The extra heavy (XH) output scenario above assumes 500 Gb of ultimately recoverable resources from XH oil.
Oil price appears to be shyly creeping up maybe because it’s testing the ceiling at where the economic engine starts sputtering and backfiring?
A little late, but, just-viewed (and recommended)…
The Overnighters
Desperate, broken men chase their dreams and run from their demons in the North Dakota oil fields. A local Pastor risks everything to help them.
Another year; another section of the Russian-roulette rollercoaster ride… (where corkscrews could mean missing rivets…)
A ten percent drop in oil production over 12 years appears quite manageable. All we need is a twenty percent efficiency gain in that time to handle it easily. It will help push EV production.
GF has his head screwed on straight and properly torqued down.
Peak oil is not going to be that big a problem over the next decade or two, assuming Dennis and other guys who think like him are right in predicting a slow gradual decline in production.
I don’t have any problem at all visualizing the American motoring public switching back to high mpg cars and light trucks if gasoline prices go up and stay up. The sale of pure electric cars may not take off as fast as some of us expect, if the price of the battery doesn’t drop as fast as hoped- but hybrids such as the Chevy Volt need a battery way less than half as big as a pure electric 200 mile range car.
If the price of batteries remains considerably higher than expected, and gasoline gets to be REALLY expensive, then plug in hybrids with as little as twenty to thirty mile electric range will probably sell almost as well as ice water in hell.
If you have to go fifty miles per day, and can do half of that on electricity, and get fifty mpg once your battery is flat, half a gallon will do ya, and even at eight bucks, half a gallon is not all that much considering that house prices ( and rents) out in the ‘ burbs usually cost maybe half of what COMPARABLE housing cost in places where you can walk or bike to work.
Somebody who travels a lot will hopefully tell us how much it takes to ride the subways and buses in various big cities these days.
The bright side of high shipping costs is that such costs create a powerful incentive for every body from the producer to the final consumer to produce, distribute, sell and buy lighter and or more durable goods.
I can’t really see any reason we should be drinking beer or bottled water that has been trucked hundreds or thousands of miles. That sort of good can easily and economically be produced locally almost anywhere.
And while I don’t have good figures, I am fairly sure that most consumer goods cost at least double and sometimes three or four times as much at retail as they SELL FOR at the factory loading dock.
This leads to the conclusion that since costs are basically just passed along, in a competitive industry, we would often be better off to pay twice as much to the manufacturer , while seeing the retail price of the product go up by much LESS than half, if distribution and sales are efficient.
What I ‘m saying is that twice the quality for half again more money can be a world class bargain. Really good tools, good furniture, and good clothing LAST. Most of my furniture will cast for centuries, if it’s well cared for. Twice as much good solid oak and chestnut put into this furniture fifty to seventy five years ago has prevented our needing new cheap replacement furniture at least twice and likely three times. ALREADY.
Efficiency and quality can be world class bargains.
Fred Maygar’s another guy with his head on straight, and he keeps us up to date on the disruption news. . He’s right, it’s headed our way fast.
I bought a new automobile radiator over the net a few weeks back for seventy bucks less than I could get it at the local auto parts chain store, but from the SAME COMPANY. By adding a gallon of antifreeze and a quart of special oil to put the total order over a hundred bucks, I got free shipping.
The UPS truck dropped my radiator,antifreeze and oil off the very next morning, saving me a twenty five mile round trip to town. Same warranty, etc. The radiator was not in stock in the store, so I would have had to wait for it to be delivered THERE the next day anyway.
Disruption saved me about fifty bucks in cash, a twenty five mile round trip to town, which takes at best over an hour, the wear and tear on my truck, the gasoline, etc, and for a bonus I got a gallon of antifreeze and a quart of special lube.
This one little bit of biz justified my DSL connection for an entire month.
DISRUPTION.
Get used to it, it’s coming.
The hundred mpg car is coming too, unless batteries get cheap enough fast enough to prevent it from being built and sold. IF it arrives it will be very low, very narrow, very light, with fore and aft seating rather than side by side seating.
Somewhere in my basement is a book, printed in 1995, which advertised the 100 mpg car as being “just around the corner” (Amory Lovins’ hypercar).
Color me unimpressed, I’m still waiting for such a car being available at my local dealership.
But it will never arrive, BEVs will take over long before that.
The Honda Insight arrived in 1999 – it gave 60MPG or better, but it just didn’t sell – there was just no market for a very efficient, inexpensive 2 seater.
Are there ICE’s that get 60 mpg now?
Europe seems to have a lot of efficient small diesel cars.
http://www.autoblog.com/2009/10/02/report-all-of-europes-15-most-fuel-efficient-cars-get-better-t/
A little hypermiling or just gong easy on the throttle helps a lot. Always drive downwind too. 🙂
The 2017 Prius gets a combined 56 MPG, which means that 60 MPG wouldn’t be hard with a little attention to your driving.
Please note that diesel is denser than gasoline (with more CO2 emissions to match) and that European efficiency ratings are far less realistic than EPA ratings.
There is quite a big market for electric vehicles, however. The market is for delivery vans and utility vehicles in big crowded cities with air pollution issues. That is why China and Europe are leading the way.
It’s a mistake to expect a new product to enter a wide market such as passenger cars all at once. Innovation seeps into markets by occupying niches and spreading from there.
That is why Tesla was successful. They figured out that (some) rich people would pay a premium for an high performance electric car.
It was also smart marketing. If EVs are what the rich drive, then those who aspire to being rich will be more inclined to buy them.
If EVs were only seen as something the poor bought, they wouldn’t have the cool factor.
You can see how the concept works with sporting goods. A new technology comes out and at first it is only sold in boutique stores and for a high price.
Then copies turn up in the mid-range stores for mid-range prices.
And eventually similar products turn up in the mass market stores for very little money.
It’s pretty much impossible to put out a low-priced product first and then up-sell it to the luxury market. The rich and trendy want it first and they want the best and they will pay for it to reflect the status they believe they deserve.
Rule of thumb in some consumer products:
C == manufacturer’s cost
2C == manufacturer’s price (wholesaler pays manufacturer)
4C == wholesaler’s price (retailer pays wholesaler)
8C == retailer’s price (consumer pays retailer)
…not all industries have quite such extreme markups. Books did, which is why Amazon was able to kill the brick-and-mortar bookstore market so fast.
I’ve found I’m typically buying either direct-from-manufacturer or from-manufacturer-via-Amazon-or-similar-site online now. Amazon does not take the same cut as the old wholesalers did, they take a smaller cut.
“and a quart of special lube”
For your 13 year old nephew, right ? It must be pretty special, you mentioned it twice.
WOW!
Not my fight so I should just stay out of it, but that’s just too much, so I won’t.
Why am I not surprised that comment came from the left coast?
ROFLMAO
Please no replies, see below.
Hi HB,
PLEASE don’t forget to post at least one personal insult in every thread. The bigger the fool and lowlife you make yourself out to be, the more inclined the reader will be to consider my arguments.
My goal is to make my point about recent and future D party history. You ‘re just a porch dog dog barking in the night. The caravan passes on. The dog continues to bark, convinced he scared it away.
You’re too stupid to understand that you’re making my case for me, that case being that Clinton lost because she was a lousy candidate, and that she got the nomination because ENOUGH big D Democrats lacked brains enough to vote for a BETTER candidate in the primaries.
And for your reward, here’s a little bit of old news about your heroine, and why she lost. She wears flip flops. I suppose they compliment her Chairman Mao pantsuits, but I am no authority on fancy dress of the sort mandatory in Holly Wood.
Now I ‘m fairly sure YOU didn’t even know she flipflopped on this particular issue, but millions of people who either voted for Trump or stayed home knew, and remembered, and based that decision in part on her rather impressive flip flopping record.
xxxx
In 2006, under the George W. Bush administration, Congress passed a bill called the Secure Fence Act, which mandated double-layer fencing from San Diego to the southern tip of Texas. In 2007, through the appropriations process, the language was amended to certify 700 miles of fencing to be required, at the discretion of the Department of Homeland Security.
Twenty-six Senate Democrats voted for the measure, including Chuck Schumer, Dianne Feinstein, Barack Obama, Joe Biden and Hillary Clinton.
“Democrats are solidly behind controlling the border, and we support the border fence,” Ms. Feinstein, California Democrat, told the Los Angeles Daily News at the time. “We have to get tough on the border. There’s no question the border is a sieve.”
In a 2006 speech to the Council on Foreign Relations, Mrs. Clinton said: “There isn’t any sensible approach except to do what we need to do simultaneously: you know, secure our borders with technology and personnel, physical barriers if necessary in some places.”
And in pushing for comprehensive immigration reform in 2009, Mr. Schumer praised the Secure Fence Act for making the U.S.-Mexican border less porous.
Now considering that we have the Atlantic on our east coast, and the Pacific on our west coast, and Canada all the way on our northern border, even an ignorant old farmer can figure out that the fence HRC had in mind would NECESSARILY located on our southern border, although she was careful not to say the word MEXICO or MEXICAN, lol.
It wouldn’t do to insult any potential voters, except of course if they happen to be ordinary working class Americans who by the luck of the parental lottery were born to parents who were born here themselves. It’s perfectly ok to say or imply that they are low life’s, perverts, racists, homophobes, xenophobes, and lets not forget, deplorable too. Unless you LOSE.
So help me Sky Daddy, the anointed and entitled and properly dressed ( PRADA, Italian shoes, English suits ) delegates whose six figure and up pocket money donations paid for the convention would be MORTIFIED, they would DIE of embarrassment, if by some ghastly accident an actual union worker, or truck driver, or farmer or welder or carpenter were to sit down beside them.
YOU lost, LOSER, and you are doing everything within your power to make SURE the D party loses AGAIN, and you’re so stupid you can’t even figure it out.
The MORE insults you aim at me, the more inclined thinking readers will be to consider MY arguments.
The D party as a whole is light years ahead of the R party on the one issue that outweighs all other issues combined- protecting the environment.
If we don’t have a PLACE to live, then we perish. The most precious non human thing in the world, to me, is my little corner of the natural world. I WANT the D party to control Washington. I want the environment protected, not only where I live but every where else as well.
If Trump’s not paying you, HB, it’s because you’re stupid enough to work for him for nothing.Yo are doing the D party far far more harm than good, by casting blame, and feeling sorry for yourself , and encouraging the people of the party to do the same, rather than getting to work, ACCEPTING RESPONSIBILITY, and WINNING NEXT TIME.
I hereby ask Dennis to take delete this remark , so please no replies to make it easy. But I hope he doesn’t get around to it for a few hours.
And I’m sorry I posted my 1/2/ 17 seven pm comment in this thread. It would have been better in the other thread.
I’m just a dumb hillbilly , lol, and I guess I am too much a product of my macho southern mountains environment, an unreconstructed MALE, to suffer insults quietly, but I will drop it when HB does. It’s one six seventeen, nine thirty one pm.
I will copy some of this comment in the non petroleum thread.
Of Interest
http://seekingalpha.com/article/4033542-energy-recap-look-back-2016
Hi Dennis.
OPEC and some non-OPEC nations are promising a production cut. It would appear that you don’t believe a damn word of it. I am skeptical of those cuts myself but I definitely do not see the dramatic increase in production that you are predicting for 2017 and 2018.
But if your production prediction is correct then we are in for a price collapse.That would cause another decline in rigs and a decline production…. wait…. wait…. there is a contradiction there. We can have an increase in price only if we have a decrease in production. But if we have an increase in production then we must have a corresponding decrease in price.
Of course it is possible to have an increase in both price and production. But that would only be possible if we have a dramatic increase in demand. And that would mean all the “renewable” folks are dead wrong. It would mean the internal combustion engine makes a comeback and completely clears out the current glut in supply.
At any rate I would be interested in your price prediction and how you square that with your current production increase in 2017 and 2018.
There is no contradiction. Your missing variable is time! This is why you have market cycles.
t=0 high price, high production
t=1 low price, high production
t=3 low price, low production
t=4 high price, low production
t=5 high price, high production
The delay time from project start to finish is what causes market cycles. I think you know this. (Though I think Dennis needs to look at his projections with an eye to this as well; he’s guilty of omitting the non-equilibrium feedback loop between price and quantity.)
Of course it’s more complicated when you figure in demand. Demand reductions from the substitution effect set a price (the substitution price) where above that price, instead of production increasing, demand decreases permanently.
That can be very mathematically complicated, but in this case it isn’t. The substitution effect occurs at an oil price of ~$20/bbl. However, it is limited by the production capacity of electric cars, which is very low right now. So it basically only becomes visible in the oil markets when the production capacity of electric cars per year is high enough to displace more oil than the natural decline rate of the fields. Nobody knows exactly when that will happen but I am guessing sometime between 2020 and 2023.
Hi Ron,
The cuts will be temporary for the first 6 months of 2017, then output will increase. The scenario is a rough guess. High oil prices will result in greater output after June 2017, eventually by 2018 oil output will peak at 40 kb/d higher than 2015. Not really a big increase, and 2017 output is less than 2015.
2015 80.14 Mb/d
2016 79.95 Mb/d
2017 80.11 Mb/d
2018 80.18 Mb/d
2019 80.00 Mb/d
These guesses might be off by 500 kb/d high or low.
I will refrain from oil price guesses. Supply will increase enough to meet demand at the prevailing market price. Generally these will be higher than today.
The thing which causes the market cycling is that supply increases enough to meet demand at the market price of *two or three years ago*.
Hi Nathanael,
I don’t attempt to predict market cycles, my scenarios can be thought of as 3 year average output enough to smooth out the cycles in the oil industry, the RRC and then OPEC did a lot to reduce the cycles in the oil industry, though wars, recessions, etc often intervened to cause cycles beyond anyone’s control.
Anyone who can successfully predict market cycles in advance would be very wealthy, I am not that person.
Heh. I don’t think there’s any point in averaging out the market cycles… the only interesting thing to me is predicting them…
I do know someone who made money for three decades trading in and out of a single stock whose average price (inflation-adjusted) never changed — because she understood the cycle in that industry, and most investors didn’t. Oil is a particularly tricky industry because of wars, OPEC, etc., but it’s amenable to the same sort of analysis…
In 2010 Charles Maxwell predicted a 2018 peak in world oil production by doing nothing more than adding 50 years to to peak in world oil discovery. Maybe it was just luck, but his prediction seems to have panned out better than most predictions I recall from 2010. On the other hand, his prediction for prices was way off.
“Now the question remains in front of us, has the world peaked in its level of discovery and if so, how long will it take the world, if it has peaked, to reach the peak of oil output? I believe that the peak of discovery fell in the five-year interval between 1965 and 1970. So if you took it at, say, 1968, and then you added 50 years, you would get to 2018.”
“A bind is clearly coming. We think that the peak in production will actually occur in the period 2015 to 2020. And if I had to pick a particular year, I might use 2017 or 2018. That would suggest that around 2015, we will hit a near-plateau of production around the world, and we will hold it for maybe four or five years. On the other side of that plateau, production will begin slowly moving down. By 2020, we should be headed in a downward direction for oil output in the world each year instead of an upward direction, as we are today.”
http://www.forbes.com/2010/09/13/suncor-energy-oil-intelligent-investing-cenovus.html
The main mistake most “peak oil” folks made, which caused them to get the pricing wrong, was ignoring the substitution effect.
If they’d looked at peak anthracite (Hubbert’s inspiration for peak oil) they probably would have spotted it. After a certain point, instead of using anthracite, people used substitutes.
Too many “peak oil” folks had the — odd — belief that there were no substitutes for oil. There are always substitutes.
And substitutes don’t have to be products that do the same thing. The substitutes could be new technologies that accomplish the same goals using different energy sources entirely or lifestyle changes that eliminate energy needs.
People can walk and bike rather than drive. And do it willingly because it is healthier for them.
Already we are seeing how mobile devices have changed socializing among youth. Meeting at a place to hang out is no longer so important to them because they are in touch constantly whether or not they are in the same physical space.
By your way of thinking the famine will be a substitute. Way to put a shine on a turd. Good one!
Famine is bad, but changing how and what we eat could be a plus. Less beef. Less corn syrup. And so on.
Here’s an article from a few years’ ago.
It’s Time to Rethink America’s Corn System – Scientific American: “Although U.S. corn is a highly productive crop, with typical yields between 140 and 160 bushels per acre, the resulting delivery of food by the corn system is far lower. Today’s corn crop is mainly used for biofuels (roughly 40 percent of U.S. corn is used for ethanol) and as animal feed (roughly 36 percent of U.S. corn, plus distillers grains left over from ethanol production, is fed to cattle, pigs and chickens). Much of the rest is exported. Only a tiny fraction of the national corn crop is directly used for food for Americans, much of that for high-fructose corn syrup.”
Here are a couple of more articles on how much waste goes on in the US economy.
The tradition continues: the United States wastes more energy than it uses – Opower : Opower
The Economic and Environmental Costs of Wasted Food – The New York Times: “The United Nations estimates that a third of all the food produced in the world is never consumed, making for a total of about 1.3 billion tons of waste a year. In the United States alone, about 40 percent of all food, worth an estimated $165 billion, is wasted, the Natural Resources Defense Council reported in 2012.”
The best substitute for liquid fuel in America is sensible city planning. It’s coming anyway because the roads are totally overbuilt and there is no money to pay for their upkeep. It won’t be high gas prices that end car culture — it will be a lack of roads.
From this year forward you have demand outstripping supply. In my world that means increasing prices. Increasing fuel prices make the serfs unhappy. Probably should buy pitchfork futures.
SW, just curious but what do you think will cause this turnaround. That is from the current glut to demand outstripping supply. US storage is near its all time high and OECD storage is 300 million barrels above its 5 year average.
IEA Oil Market Report
OECD commercial inventories fell in October for the third month in a row. They have drawn 75 mb since reaching a historical high in July, but remain 300 mb above the five-year average. Product stocks have fallen twice as quickly as crude during that period. Preliminary data show stocks falling further across the OECD in November.
How much confidence do we have on oil storage accounting? According to Art Berman much of it is unaccounted for oil. Looks like a very good way to manipulate oil prices.
My take is that the powers of the world are very much afraid of what a new global recession could do to the shenanigans they have been running at the Central Banks to keep the system from imploding and are very much decided to do everything on their power to prevent a new global recession, and a very important part of it is to keep oil price affordable to prevent the economy from stalling. They cannot control neither production nor demand except by staging a war, but as price is determined by the effect of the production/demand ratio on oil storage, they can control price by rigging the storage reporting. Unaccounted for oil could be the tool to do that.
For most of the world’s oil storage, there is no reporting. We have only the USA and a wild ass guess at OECD storage. We have nothing for Eastern Europe, Africa or Asia.
WTI jumps up and down a few cents when the US storage figures come out each week, but that’s about it. And when that happens the price very quickly reverts to what the actual supply and demand dictates.
If there were actually storage reporting for most of the world’s oil, then your conspiracy theory might hold water. But there is not and it does not.
https://www.energyaspects.com/company/events/amrita-sen-ons-2016-conference-appearance?utm_medium=banner
This is a presentation by Amrita Sen at Energy Aspects a few months ago. At the 4:30 minute mark she discusses worldwide crude draws. She is claiming the only place in the world we are getting builds is in the U.S. Not sure where they are getting their information.
Our post was NOT about conspiracy theories. It has number crunching on the statistical fact that there is a huge discrepancy between US crude oil production, imports, exports and refinery intakes.
8/10/2016
U.S. Storage Filling Up with Unaccounted-For Oil
http://crudeoilpeak.info/u-s-storage-filling-up-with-unaccounted-for-oil
Matt,
I know the article said nothing about intentional overreporting of crude oil stocks. It just occurred to me that if intentional it could have a clear effect on oil prices.
Ron,
That USA is the only one reporting crude oil stocks makes it easier to manipulate them, not harder.
Is the following correct?:
How do we know that there is a huge global excess in crude oil?
We know there is some excess from multiple sources, but we only know that there is a large excess from USA reported oil storage.
Where is that large excess in USA crude oil storage coming from?
We don’t know as 4 out of 5 barrels in USA crude oil storage are from unaccounted-for oil.
I think the situation demands an explanation as large unaccounted-for oil is a new phenomenon that started when oil prices were very high.
“OECD storage is 300 million barrels above its 5 year average.”
When the IEA and all other oil market observers compare current storage levels with 5-year average they miss two important things:
1) Global oil demand continues to increase. Therefore, in relative terms (inventories as % of annual demand) the volume of oil in storage is not as big as if we compare absolute volumes for this year and previous years.
Thus, according to the IEA, global oil demand in 2017 should average 97.51 mb/d. This is 7.94 mb/d higher than in 2011 (89.57 mb/d) and 5.39 mb/d higher than 5-year (2011-2015) average (92.12 mb/d).
7,94 mb/d = 2898 million barrels/year
5.39 mb/d = 1966 million barrels/year
Now compare this with the 300 mbbls surplus in crude inventories vs 5-year average.
2) There are two “market buffers” that were always used as a measure of over/under supply in the oil market.
The first are crude and product inventories. They are indeed above 5-year average.
The second is OPEC spare capacity, which is well below historical averages.
OPEC output cuts will result in decreasing inventories, but spare capacity will increase.
I was simply commenting on the chart at the top of the post. Perhaps I misread it?
http://cdn.exxonmobil.com/~/media/global/files/outlook-for-energy/2017/2017_outlook_for_energy.pdf
buy energy stocks. renewables will only help pick up a “portion” of the increase in demand, efficiency will only offset a portion of the increase in demand. And you “boys” wonder why LTO plays are attracting money….the same reason people rob banks….because that is where the money is?
Except people don’t rob banks anymore because it’s too hard, so they moved on to robbing convenience stores — less profitable, but that’s what’s left. Same for LTO — it’s the equivalent of robbing a convenience store because the more profitable alternative (conventional oil) isn’t there anymore.
But, hey, thanks for the incredibly informative piece from Exxon which includes these shocking insights?
– Energy underpins economic growth. (who knew?)
– Non-OECD countries lead the way for energy demand. (I do believe that’s been known for some time)
– Delivering on the increased demand for energy needs to go hand in hand with finding constructive solutions that mitigate the risk of climate change. (NOTE: mitigate, not reduce or eliminate)
The whole piece is just ridiculous. The flow of logic is basically: the world will need more energy therefore we need to find more energy. Gee. That was easy. But lots of colorful charts and it all make sense.
And maybe the CEO of Exxon sees a bigger future as Secretary of State than staying with Exxon.
This is interesting.
Rex Tillerson: Trump's Cabinet Pick Has a Exxon Stock Problem | Fortune.com
I have bought energy stocks. Massive investment in Tesla, for instance. Also some solar companies.
Only the dumb money invests in fossil stocks now. Even the *Rockefellers* have divested.
(I distinguish investing, which is long-term, from short-term speculation, where you can still make money trading even bankrupt companies like Peabody Coal)
well now my money may be dumb but the good news I have twice as much of it now then I did last feb. One might ask, ” hey tea how did you do that? and I would say by ignoring just about every one on this forum not the least of which was YOU?
I sincerely hope you had them send you your Tesla shares certificates, that way you can burn them and at least heat up a cup of tea?
Oh, you’re what we call a short-term trader. Best of luck with that. You would be wise to get out before the oil business collapses.
I’m a long-termer and I’ve been doing very nicely for myself. But after making money on Tesla’s initial rise, I figured Tesla would probably trade flat for a couple of years until Model 3 came out, so I cleaned up on short-term options trades instead, collecting money from fools who thought Tesla would go bankrupt next week.
Friendly bet: I bet you that by 2030 ExxonMobil will declare bankruptcy. Wanna take the other side of the bet? Go for it, you know you want to. We’ll see who’s right in 2030, assuming you live that long.
buy energy stocks. renewables will only help pick up a “portion” of the increase in demand, efficiency will only offset a portion of the increase in demand.
If by ‘Energy’ you mean Oil, Gas and Coal, then that’s lousy investment advice given that most assets of fossil fuel companies are already classified as stranded by smart money. Renewables such as wind and solar are much better buys going forward. Unless you are doing very short term investing, buying fossil fuel energy is a good way to lose your shirt.
As an example Saudi Arabia will be completely broke in a decade if they stay on the fossil fuel path.
I’d hate to see the resulting social mess if that should happen…
Jochen Wermuth:”Short yourself or collapse!” [paraphrase]
https://www.youtube.com/watch?v=P9QoPWPV8Zo&t=150s
(7 min video clip)
The only sane way forward is to transition away from fossil fuels as fast as possible.
Because Texas Tea keeps touting oil-related stocks, I keep assuming what he is actually trying to do is to sell stocks. Either he is trying to generate investment in companies he owns or represents, or he wants to sell stocks he already owns and is hoping to raise the price before he does.
Generally anyone who urges you to buy stocks in a particular company or industry has an ulterior motive.
in my world one must be right at least every now and then to make a living…you must live in a very different world✋
I know lots of people who buy stocks, commodities, and bonds; who sell stocks, commodities, and bonds; who finance companies, etc. I know how the game is played.
And I have seen quite a few examples of “pump and dump” and selling to the “greater fool.”
“buy energy stocks”
Tea, I seldom agree with you, but this one I think you got right. Oil is going up and with it so will good producing companies that have been bleeding red ink. There are a lot that are undervalued by 50 to 100 percent and some even more.
We are in the winter season and the price is holding up in the mid 50’s. I expect it could make mid 70’s before the driving season is over with a average price in the 60’s for 2017. I really don’t think OPEC wants to see it reach much higher than that. Which would strongly promote alternatives. 2017 will be the best year in oil stocks that you will be able to remember. But you got to be in the game to win.
https://wattsupwiththat.com/2017/01/05/energy-and-society-from-now-until-2040/
long carbon based energy ?Key conclusions of the report:
Developing countries, like China and India are urbanizing and their populations are becoming more affluent, this will increase global energy demand 24% by 2040. This includes the ExxonMobil prediction that energy use efficiency will double (figure 4).
The world population will increase from 7.3 billion today to over 9 billion in 2040, with a much larger middle class population (defined as >$14,600 and <$29,200 yearly for a family of 4) using energy than today. World GDP will effectively double by 2040. Living standards will rise dramatically, especially in the developing world.
Natural gas consumption will increase 54 quadrillion BTUs by 2040. Nuclear and renewables will increase 24 and 20 quadrillion BTUs, respectively. The 2040 energy mix will remain about the same as today (figure 5 and Table 1).
Rising electricity demand will drive the growth in global energy between now and 2040. The increase in the number of homes with electricity, industrialization of the developing world and our increasingly digital and plugged-in lifestyles will drive this growth. Half of global electricity demand is from industrial activity; thus good jobs can be lost if electricity costs are too high. Jobs will move to locations where electricity is cheap, an example is the new Voestalpine steel plant in Corpus Christi, Texas.
Crude oil and natural gas will remain the world’s primary energy source. Even in 2040 oil and natural gas will supply 57% of all energy demand, this is an increase from 56% today. Oil demand will grow 18% through 2040 and natural gas demand will grow 44%. The developing world will account for the largest increases. Unconventional (“fracked”) oil and gas, oil (“tar”) sands, and deep water oil production will account for over 25% of the liquid supply in 2040.
Carbon dioxide emissions will increase, at least until 2030."
Well, at least he includes this at the bottom of that article:
“The author, now retired, worked for Exxon from 1979 until 1985, he also owns stock in the company.”
It appears that Exxon expects the future to be business as usual. But car makers don’t.
Personally I think global economic growth will slow (and maybe even contract), so I think oil consumption will also go down.
FACTBOX-Why the shift to electric cars may surprise oil groups
Thanks for that link. It’s quite spectacular how out of touch the oil execs are — and I tend to think the auto companies are overly conservative!
It’s “oilman” thinking. Most of the Exxon (and Chevron, and so on) execs are just incapable of conceiving, mentally, of a future where oil is not wanted. Mental defect.
There’s something quite wonderful in this Seeking Alpha energy recap:
http://seekingalpha.com/article/4033542-energy-recap-look-back-2016
“2016 could be classified as “the year of energy bankruptcies,” with more than 200 companies filing for protection. Check out the tables below, courtesy of Haynes And Boone, for a detailed list (as of Dec. 14); you can find even more data in the year-end edition of Haynes And Boone’s Energy Bankruptcy Report here.”
Yes, when American auto companies tout EVs over ICEs, you know something has changed.
The End Of The Oil And Gas Bankruptcy Wave | OilPrice.com: “Even as oil prices are rebounding, we are closing out one of the worst years for the oil and gas industry in decades. In 2016, the U.S. oil and gas industry defaulted on $39 billion in high-yield energy debt, more than twice as much as the $15 billion in defaulted debt in 2015, according to Fitch.”
Here’s a slightly different article by the same author on how oil companies and car companies see the future.
Oil firms and carmakers diverge in costly debate | Reuters: “… Simon Redmond, Director, Oil & Gas Corporate Ratings at credit rating agency Standard & Poors said there was a risk that developing countries' adoption of the automobile echoed their experience with telecoms. In that case, consumers largely skipped use of the established technology – fixed land lines – and went straight to the latest technology – mobile phones.
Indeed, some in the auto industry think emerging markets could well outpace some rich countries in adopting EVs.
‘We believe that China is going to lead in the penetration of electric vehicles into the market,’ Mary Barra, General Motors CEO, said in October.”
Iceland is one of the biggest aluminum manufacturers in the world despite importing 100% of the needed bauxite.
Cheap electricity.
The P&G plant that makes Charmin, Bounty, Luvs and other products is located in Wyoming county, PA.
This plant has a couple of Marcellus gas wells right on the property that produce all the heat and electricity needed.
There are currently a couple dozen of the largest, most efficient Combined Cycle gas plants in the world being built/planned in Ohio, PA, WV, and VA.
Cabot is directly supplying the gas to some to bypass pipeline constraints while offering exceptionally economical fuel to these nearby generators.
An industrial renaissance is in the early stages up that way due to the massive supply of hydrocarbons.
“The P&G plant that makes Charmin, Bounty, Luvs and other products is located in Wyoming county, PA.
This plant has a couple of Marcellus gas wells right on the property that produce all the heat and electricity needed.
There are currently a couple dozen of the largest, most efficient Combined Cycle gas plants in the world being built/planned in Ohio, PA, WV, and VA.
Cabot is directly supplying the gas to some to bypass pipeline constraints while offering exceptionally economical fuel to these nearby generators.”
This certainly reinforces the idea that natural gas, not coal, will be the bigger contributor to electricity generation.
Now if it continues to be true that large electricity users move to where the cheapest electricity is, then we should see shifts if solar and wind also contribute to lowering costs.
Boomer
I’ve been tracking that ISOExpress site as the cold front is moving into New England.
Fascinating how the fuel mix changes, as well as electricity pricing, when temperatures drop.
Seems like natgas fueled is flat (diverting for heating?) as both coal and hydro ramp up at the moment.
Late afternoon/early evening is when consumption spikes, so pricing may head up also.
The IEA’s OMR is normally available to non-subscribers two weeks after initial release.
This time it should have been released in free public access site on December 27.
Today is January 2nd, and still no free OMR.
The November issue was also delayed by some 3 days.
That never happened before.
A question for the esteemed panel: Ive heard that Mexico flipped from being a net exporter of petroleum products to a net importer of petroleum products in early 2016. Is this true?
According to the Energy Export Databrowserthey were still exporting about 600,000 bpd in 2015. That year their exports dropped by 21%. It is entirely possible that export dropped past zero in 2016 and they became a net importer.
However I guess we will just have to wait until we have the total 1916 data. But if anyone else has any further data I would love to hear it.
Exact numbers mazama is based on
Mex consumption 1.926 mbpd (0.016 per capita burn) that was down 1% poor economy. But population grows relentlessly (127 million, looks like over 1%/yr) and the economy means less for consumption than pop. Economies fluctuate but without a proper war, pop growth just marches on.
Mex production 2.588 mbpd
662K bpd export.
the mazama graph is compelling on production and consumption will be flat or rise. Agreed, that 660K bpd could be erased.
This is VERY important stuff. Oil flow from Mexico or Canada to the US is hard to interdict, unlike tankers to China. As US import supply gets more vulnerable . . . .
Time for Mexico to start seriously taxing gasoline.
http://www.nytimes.com/aponline/2017/01/04/world/americas/ap-lt-mexico-gasoline-shock.html
Oops
I had read somewhere that the value of imported refined products was near to equaling the value of their exported crude. Sorry I don’t have the link. It would be interesting to compare the money they earn exporting crude to the money they spend importing refined products. Either way, Mexico is on the brink. Just as Indonesia had to fall back on other forms of revenue, like destroying their forests, once oil exports became oil imports, Mexico will have to find something else to lean on once oil doesn’t pay the bills. My guess is it’ll be cocaine and meth. It’ll be interesting once Mexico is a failed state. In fact it may already be so. The President of the country seems to be not much more than the Mayor of the capital. He certainly doesn’t go for drives in the countryside.
Very few people realize that the Pentagon a year or two ago had Mexico pegged as one of the three countries in the world most likely to degenerate to failed state status, unless I am badly mistaken. I haven’t gone back to check.
When I type “Pentagon Mexico” into Google it offers to finish the search term for me by adding “failed state”. It looks like the drug war/civil war back in 2009/2010 was a concern.
Or maybe it just means a lot of Americans are jerking off to the idea.
“I had read somewhere that the value of imported refined products was near to equaling the value of their exported crude.”
Correct.
The drop in Mexico’s net exports of crude oil and refined products was much steeper in value terms than in volume terms. It declined from US$26.2bn in 2011 to U.S.15.6 bn in 2014 and just 400 million in 2016.
Mexico: value of the foreign trade of crude oil and refined products (billion U.S. dollars)
source: PEMEX
“It would be interesting to compare the money they earn exporting crude to the money they spend importing refined products. Either way, Mexico is on the brink. Just as Indonesia had to fall back on other forms of revenue, like destroying their forests, once oil exports became oil imports, Mexico will have to find something else to lean on once oil doesn’t pay the bills.”
A sharp drop in the value of net crude and product exports had a negative impact on Mexico’s foreign trade balance, which deteriorated from virtually zero in 2012 to a deficit of US$14-15 in 2015-2016.
But that’s not critical, as oil and product exports now account for only 5% of Mexico’s total exports, down from 16% in 2011.
Mexico’s foreign trade balance (US$ billion)
source: PEMEX
Mexico: net exports of crude and refined products (kb/d)
Source: Pemex
http://www.pemex.com/en/investors/publications/Paginas/petroleum-statistics.aspx
I think Mexico needs to build a new refinery of modernize existing refining capacity. That would solve the problem of rising product imports.
http://www.zerohedge.com/news/2017-01-02/mysterious-bond-sale-venezuela-issues-5-billion-debt-itself-china-underwriter
Conspiratorial this and that, but it’s all about two things:
1) Oil securing Chinese money
2) Ven owned banks (incl the central bank) buying gov’t bond issuance (sound familiar?). It’s routed through Chinese cash to fuzz it up, but bottom line looks like some kind of a priori debtor in possession QE. When you gotta have DIP money, you gotta have DIP money.
It (QE) looks like it’s just never going to stop, globally.
According to preliminary estimate by CDU TEK, statistical unit of Russia’s Energy Ministry, the country’s C+C production in December was 11.21 mb/d, flat month-on-month and close to post-Soviet record of 11.23 mb/d reached in October. Monthly-average output was more than 400 kb/d (3.7%) higher than in December 2015.
In 2016 in total, output reached 10.96 mb/d, up from 10.71 million in 2015 (+2.3%) and significantly higher that the energy ministry’s initial guidance in the beginning of the year (10.75 mb/d).
Russia has pledged to cut output by 300 kb/d from October reference levels, but the energy ministry has said that the reduction would be gradual as production cannot be cut abruptly due to weather and technological conditions.
According to the ministry’s guidance, output will be reduced by 50-100 kb/d in January. By the end of March it will be 200 kb/d less the October level; and the target of 10.947 mb/d will not be reached until April or May.
It is interesting that actual monthly-average output in October was 11.230 mb/d (using 7.33 barrels/ton conversion factor) rather than 11.247 mb/d stated by the Ministry as the reference level.
On my estimate based on ministry’s guidance, production in 1st half of 2017 should average around 11.06 mb/d, 100 kb/d higher than the average 2016 level, although lower than in the last four months of the year.
OPEC and 11 non-OPEC countries agreed to cut output for a six-months period starting January 1st 2017, and nothing was said if and how this deal will be prolonged for the second half of the year. For 2017 as a whole, the Russian energy ministry is sticking to its oil production forecast of 548-551 million tons, or 11.01-11.07 mb/d, which implies higher output than the target of 10.947 mb/d in 2H2017. According to independent Russian experts, C+C production in 2017 may average 555 million tons, or 11.15 mb/d. According to a quote in Reuters, the IEA also expects Russian oil production to rise in the second half of the year: “While little information on the duration of production cuts has been made public, provisionally we assume that output will rise gradually again during the second half of 2017.”
[ http://www.reuters.com/article/us-russia-oil-output-idUSKBN14M0AZ ].
Important to note, the energy ministry said that Russia’s crude oil exports (that had increased by 4.8% in 2016), will rise again in 2017 despite output cuts.
Russian oil production: actual (2013-2016) and energy ministry’s guidance for 1st half of 2017 (mb/d)
So, 300K bpd “cut”.
Whose order isn’t going to be filled?
Presumably the guy who was buying it with no customer because he has tanks to put it in and that’s where it was to go. Maybe he’s a collector of liquids and never intends to sell. He just has to do without.
Based on the energy ministry’s guidance, the actual reduction in Russia’a output will be less than 300 kb/d, but it will still be a real cut, especially given that Russia was expected to increase oil production by 200-300 kb/d in 2017.
Two other non-OPEC countries where the cuts should be real are Oman and Kazakhstan, as they were also expected to increase output.
In most other non-OPEC countries, including Mexico and Azerbaijan, output reduction will simply match natural declines.
The table below is from the IEA OMR; the numbers include NGLs
“Presumably the guy who was buying it with no customer because he has tanks to put it in and that’s where it was to go. Maybe he’s a collector of liquids and never intends to sell. He just has to do without.”
This is the most awesomely entertaining image of the week, thank you Watcher!
I thought it might be useful/amusing to have a look at a decade old IEA forecast (2006) to see how it panned out
I went back to the Oil Drum
http://www.theoildrum.com/story/2006/6/20/231220/551
and had a look at Stuart Staniford´s graphs
Third graph down
Eyeballing the numbers for 2016
Total liquids – a smidgeon under 100 million barrels a day (over by about 4%)
OPEC about 38-39 million barrels a day – spot on
Unconvential about 8 million barrels a day (and no one was talking about LTO then)
It’s not IEA (International Energy Agency).
It’s EIA (Energy Information Administration) International Energy Outlook, 2006 edition.
There is no numbers for each year, particularly for 2016. But we can compare the EIA’s projections for 2015 made in 2006 with actual numbers for 2015 from the EIA Short-Term Energy Outlook, Dec. 2016.
I would say that at least the aggregate numbers from a forecast issued 10 years ago look surprisingly good:
World liquids supply in 2015: EIA IEO-2006 projections vs. actual (mb/d)
If we take into account supply outages (particularly, in Libya), which were difficult to predict 10 years ago, and the sharp drop in oil prices, which had a negative impact on non-OPEC output, the EIA’s projections made in 2006 look extremely good.
I’m sure, projections made by the TOD contributors 10 years ago were much worse.
Especially funny now looks the comment to the last graph in the article:
“Note the bump in historical US production from the late 1970s on is due to the startup of Alaskan production. Apparently, the EIA has found a domestic oil source significantly better than Alaska, and production from it will be starting soon.”
We now know that this domestic source was LTO, and actual U.S. total liquids (C+C+NGLs+biofuels) production is even higher than shown in the chart below from
Mr. Staniford’s article:
US total oil production: EIA IEO 2006 projections
source:http://www.theoildrum.com/story/2006/6/20/231220/551
The EIA forecast from 2006 must also be viewed in light of their price prediction. They assumed oil price would drop again from 60$/b at the time and hover around 50$ until 2030. What would US and world oil production be now if oil price had stayed at 50$?
Also consider the message they were sending the time when there was a supply crunch imminent, seriously threatening the world economy. Move along, nothing to see here, everything will be back to normal.
This was most definitely not competent forecasting.
What supply crunch was imminent in 2006?
There was a temporary decline in demand during the 2008-09 global recession, and subsequent cut in OPEC supply ( >2 mb/d) in order to support prices. But between 2005 and 2015 global petroleum and other liquids supply increased by 11 mb/d. That’s less than projected by the EIA, but 11 mb/d increase is not a crunch
EIA’s quite good with projecting oil & gas supply.
What they’re *atrocious* at is projecting wind and solar installations. Greenpeace’s projections have been pretty much on the mark, while EIA’s have been ludicrously low every single time.
Were there consumption predictions?
I’ve a new post on the Eagle Ford, here
Great info as always Enno.
Are you getting any inquiries from media. Specifically business media covering these Shale Cos? We are starting to get enough data to start comparing with the EUR’s these companies tout. I would hope they are beginning to compare the ACTUAL production vs the touted production from 4,5 and 6 years ago.
Thanks Reno,
“Are you getting any inquiries from media.”
Not from the media no. Universities that offer Petroleum Engineering courses show more interest in the material I’ve put online.
“I would hope they are beginning to compare the ACTUAL production vs the touted production from 4,5 and 6 years ago.”
Have you seen the comments from Jim Brooker? I think he did a very nice job at comparing claims with actuals for Pioneer, and Bonanza Creek, in the comments section of my last US post.
I hope we see more of these kind of efforts.
I have seen those comments. Good discussions on your site between actual producers and Engineers. At some point the EUR’s have to turn into actual reserves based on actual production.
Has there been a country before in which oil and gas production has stopped? I can’t think of one, but Denmark might be the first in coming years, what with DONG pulling out of fossil fuels, cancellation of an oil project last year (I think the last real prospect for them – I’ve forgotten the name though) and now this:
“Maersk pulls plug on North Sea field”
Paywall (but limited number of articles free): https://www.energyvoice.com/oilandgas/north-sea/127957/maersk-pulls-plug-northsea-field/
“Maersk Oil today confirmed it would cease production on its North Sea Trya field. The operator said it had failed to identify an economically viable solution for the full recovery of the remaining resources in the Denmark’s largest gas field. Maersk Oil COO Martin Rune Pedersen said: “Tyra has since 1984 been the main hub for gas production and processing in the Danish North Sea. The Tyra facilities are approaching the end of their operational life, and together with our partners in DUC we have assessed solutions for safe decommissioning and possible rebuilding of the Tyra facilities.”‘
As I recall the seafloor had been subsiding as the reservoir pressure has been reduced. Jacking up existing facilities or rebuilding would be expensive for the remaining gas resource. I think the hub receives associated gas from some oil fields which will need to be rerouted as part of the decommissioning.
December IEA OMR full public access out today (after a long Xmas break in Paris).
https://www.iea.org/oilmarketreport/omrpublic/currentreport/
Yes, but it seems that in the past these holidays were much shorter. And delays were no more than 1 or 2 days. And there was no 3-day delays in November
Global oil demand growth remains steady, despite all the talk about EVs, renewables and efficiency gains.
According to the IEA estimate, oil demand was up 1.37 mb/d in 2016, 120 kb/d above their previous forecast.
Growth in 2017 is now seen at 1.32 mb/d, 90 kb/d higher than in November’s OMR.
Both numbers are above long-term average annual increase of 1.17 mb/d in 2000-16.
From 2000 to 2017 global demand is projected to increase by 20.4 mb/d
Global oil demand (mb/d)
Sources: IEA Oil Market Report December 2016; Annual Statistical Supplement 2015.
In the past several years, the general trend in short and medium-term global demand forecasts revisions was upward.
The most recent IEA forecast for 2017 (from the Oil Market Report December 2016) is 0.7mb/d higher than in the Medium-Term Oil Market Report issued in February 2016 and almost 2 mb/d higher than in the MTOMR-2012
IEA global oil demand forecasts, 2012 – December 2016 (mb/d)
AlexS. Once again, I very much appreciate your posts, and I am sure many others do as well.
It is interesting to look at these forecasts after the fact.
As for price prediction forecasts, my view is those are simply too difficult given the volatility in oil prices the last 15+ years. Much depends on OPEC policy, as we are once again seeing.
US producers should be very thankful OPEC chose to cut, IMO.
shallow sand,
Oil prices are indeed difficult to forecast. And the EIA had underestimated future oil prices in its International Energy Outlook 2006. But not by much.
Price assumptions in the IEO-2006 are for the average price of imported low-sulfur, light crude oil to U.S. refiners. And these are REAL prices in 2004 dollars.
The EIA provides annual, monthly and weekly-average prices for imported oil both in nominal and real (US CPI-adjusted) terms.
Real prices are in 2016 dollars, but it is easy to re-calculated those numbers in 2004 dollars.
The average for the period 2006-2016 was $63.95 (in 2004 dollars), about $10-12 higher than in the IEO-2006 projections, but not 2 times higher.
U.S. imported crude oil prices (annual average), nominal and real (in 2004 dollars)
AlexS.
Good point, not that far off for a ten year average.
Price risk management through hedging is one of the most important aspects of managing an independent upstream oil and gas company. Also a difficult one. In hindsight this was one of the biggest blunders we made. We maybe are continuing to make it?
I’ve got a perfectly lovely cyclical model of oil prices. It’s great, except that the trouble is that it doesn’t actually tell you how long each phase of the cycle is. 😛 Perfectly nice for after-the-fact fitting, useless for predicting the price in 201X.
Population gain trumps economics, as it were.
Yes, an increased aging population and a shrinking working population is going to impact oil consumption. Those trends are happening in developed countries, so our need for oil will go down. If developing countries adopt EVs for non-vehicle owners who want vehicles, their use of oil may not mirror demand growth that was the pattern in the US with the widespread adoption of ICEs.
Is peak oil demand in sight? | McKinsey & Company: “The global population is aging. By 2050, about 25 percent of the population of developed economies, including China, will be 65 or older—this means a lower proportion of workers in the total population. This relatively shrinking labor force will lead to a global macroeconomic downshift. Assuming current trends continue, with no unexpected uptick in productivity, MGI expects growth in GDP to be 40 percent lower during the next 50 years compared with the previous half century.
Additionally, the structure of GDP growth is shifting toward services. MGI’s latest research suggests that China, today’s second-largest energy consumer, is shifting its economy from heavy industry to services to keep growing. At the same time, the surge of energy-intensive industrialization that we have seen in China during the past decades will likely not be replicated elsewhere. That means a greater share of global GDP will be driven by services, which are less energy intensive.”
In the global demand chart that Alex posted, demand was down in 2008 and 2009, so perhaps as the global economy slows, and even degrows, demand will decrease, too. I believe global economic forces don’t encourage continued growth, and that will decrease demand for oil.
2008-09 was the deepest recession in post-WWII history, with negative global GDP growth. And the drop in global demand was followed by record compensatory growth of 3.2 mb/d in 2010.
I’m not confident that the global economy will continue to grow. I’m expecting more recessions.
So the question might be: Which will come first, the decline in demand or the decline in supply? If everything goes smoothly, they would decline simultaneously, which would cause the least disruption.
BII- “So the question might be: Which will come first, the decline in demand or the decline in supply? If everything goes smoothly, they would decline simultaneously, which would cause the least disruption.”
I put the smooth simultaneous decline scenario at probability at less than 30% (guess). Much more likely to see episodes of big mismatch, with resultant economic chaos here and there.
I’m not optimistic that we’ll have a decline in demand to match a decline in production. We don’t even have people in the fossil fuels industry or policy makers accepting the need for energy transition plans.
So we’ll probably have overproduction until it can’t happen anymore. And the overproduction will keep prices too low to adequately support the industry.
It’s like areas where lumber and fishing once dominated. In many cases they were overworked until those assets declined so much they couldn’t be revitalized.
And it is happening with farming and water.
There seems to be a mentality among those who make money from the land or its by-products that they can exploit it without regard to the future and that any attempts to “conserve” are unwelcome intrusions. There was a time when there was enough land and natural resources that you took everything you could from one area and then relocated. But those unexploited frontiers are mostly gone.
And I would add to your comment about the producers, that the consumers of energy are partying like the its early on Friday eve. People get on a plane to fly for trivial purpose, and drive around a circular track over and over. Crazy stuff.
Side comment- Maybe in the future Artificial Intelligence in the form of robots will ration human access to energy.
Unfortunately, Boomer II, I think you’re right with the overfishing and overlogging analogy. I think we see overproduction, low prices and then a market crash with a switch to substitutes. Thankfully there are readily available substitutes for oil at reasonable prices right now. (Not so much for water: desalinization is very expensive. And for food, really, not at all.)
But hey, OPEC has engineered a supply reduction. So maybe I’m wrong with regards to oil.
If you want oil consumption decline, the easiest way is war that kills a few billion people.
This is somewhat obvious.
Hi Watcher,
Or you substitute other energy sources such as electricity produced with wind, solar, hydro, and nuclear power for oil and consume less oil.
I know you seem to think the war option is best, hopefully those with more sanity will prevail and birth rates and energy consumption will decrease over time making world war less likely. The next world war may be the last world war and might reduce population by much more than 1 billion, maybe 5 or 6 billion. You seem to think this is a good idea, to me that sounds insane.
Not to mention that any war that kills BILLIONS of people will also greatly damage the capacity of this planet to support the survivors. It’s not like war would just neatly remove a few billion humans and leave everything else perfectly untouched.
On Topic Podcast and some History of Oil & Gas in US. Review of the Book ” THE BOOM ”
http://johnbatchelorshow.com/
The BOOM : How fracking ignited the American Energy Revolution and change the world.
by Russel Gold ( WSJ Reporter )
also found
https://www.youtube.com/watch?v=CjkgHnI7hpQ
U.S. independent shale oil and gas producers are now cash flow neutral
From the IEA Oil Market Report:
“So far, the shale and tight oil industry has always been characterized by spending levels exceeding cash flow generated. Benefitting from the improved price environment (including a 50% natural gas price increase over the last six months), increased activity and enhanced cost efficiency, the US shale industry is now closer to being able to fund capex programs within operational cash flows. During 3Q16, for the first time in its history, the sector reached free cash flow neutrality. In other words, after more two years of very difficult times, the US shale business model seems on a much more sustainable path. Nonetheless, it remains to be seen whether companies can remain cash flow positive when the industry scales up activity and capital spending and as upward pressure on costs once again takes hold.”
Free Cash FLow for US Independents* (USD billion)
* / Free Cash Flow has been calculated analyzing balance sheets of about 50 US shale operators, having more than 80% of their revenues coming from shale activities and covering over 60% of US tight oil and shale gas production
What does independent mean?
non vertically-integrated
Is interest expense included in these calculations? I am sure reduction of debt principal is not.
Free cash flow = operating cash flow – capex.
Operating cashflow = net income excluding all non-cash items: depreciation and amortization; asset writedowns; gains and losses on asset sales, etc.
Operating cashflow includes only those interest expenses and taxes that were actually paid during a certain period and differ from “nominal” interest expenses and taxes that are shown in income statement (as interest can be capitalized, tax payments can be delayed, etc.).
In my view, operating cashflow is a better metric of oil and gas companies’ operating results than net income.
Free cashflow shows what is left in a company’s coffer after it has spent part of its cash on organic (non-acquisition) capex.
Negative free cashflow means that the company has to borrow money to cover its expenses.
Positive free cashflow means that the company can pay down part of its debt or keep free cash on its accounts.
Free cash flow after dividends = operating cash flow – capex – dividends.
Unlike oil majors, which tend to spend a significant part of their cash on dividends and repurchase of their own shares, U.S. E&Ps normally do not pay or pay relatively small dividends.
The above chart from the IEA monthly report shows that the group of 50 largest shale companies have finally achieved free cash flow neutrality in 3Q2016, which means their quarterly operating cashflow is roughly equal to the sum of their capex and dividends.
That was due to a sharp reduction in capex and lower costs.
I came to similar conclusions, as the IEA, after looking at 2Q and 3Q results from a few large U.S. shale companies.(Of course, my sample group was much narrower than 50 companies).
The shale oil industry has been in positive cash flow situation since prices got above 40 dollars a barrel. Sorry, this is a meaningless assessment of a meaningless article. Positive cash flow basis to what extent, exactly?
“Free cash flow (two words) shows what is left in a company’s coffer after it has spent part of its cash on organic (non-acquisition) capex.” Negative. This implies that all wells being drilled by the 50 shale oil companies referenced are now being paid for out of positive cash flow. I don’t think so. If so, at the expense of deleveraging, so what?
“Negative free cash flow (two words) means that the company has to borrow money to cover its expenses.” Define expenses, please. Including developmental CAPEX?
“Positive free cash flow (two words) means that the company can pay down part of its debt or keep free cash on its accounts.” Right. Give me a percentage of the total 50 shale companies surveyed that paid down debt in 2016 and to what extent, please. Last I looked even EOG did not have COH to cover this years maturities.
“The above chart from the IEA monthly report shows that the group of 50 largest shale companies have finally achieved free cash flow neutrality in 3Q2016, which means their quarterly operating cash flow (two words) is roughly equal to the sum of their capex and dividends.” How many of these stinking shale oil companies even pay dividends? Come on, Alex. That’s BS and you know it. List the 50 and show their losses for 3Q16.
Shallow is right, positive cash flow fills the coke machine down the hall, for the first time in 25 months, that’s it. If these shale guys are using cash flow to drill more stinking wells, they are doing so at the expense of deleveraging legacy debt. The marginal price per barrel of shale oil is a meaningless metric now. All of these guys are up to their asses in debt. Folks have got to let this ridiculous IEA, EIA, SPCA and NCAA bunk go and get planted on earth about this shale oil stuff. Nothing has changed in the past 5 months except that OPEC added 5 dollars a barrel to the bottom line. Temporarily.
I guess our goal every time we have borrowed money to buy an asset, be it an oil lease or otherwise, was to pay down the loan principal to zero.
Further, we have not borrowed money to drill or work over wells.
Currently, in the commodity spaces I am familiar with, most asset values are still high, despite much lower commodity prices (grains, oil and natural gas).
I assume increasing interest rates may change this, but maybe not?
We looked at a small oil lease recently. It was priced as if the price of oil was a steady $80. It sold for the asking price. In the first quarter of 2016 the lease lost money on an operating basis. It was barely cash flow positive for 2016. Fifteen years ago, the same lease, being also barely cash flow positive in 2001, would have sold for 1/10 of the current sale price, IMO.
Witness record acreage prices paid in the Permian earlier this year.
Farmland is the same. Grain prices are down for the third year, yet land is barely off highs. Net cash rental income, after payment of real estate taxes, is 2.5% or less. This is pre-income tax returns.
I am not smart enough to know what this means, or what one should do in this situation, unfortunately.
I will say, however, I believe few now have the goal of buying assets and paying the debt down to zero. It appears commodity assets are now about leverage, churn and other ways to make money from them, besides from the income produced by the assets themselves.
One area that I think will only get worse is commodity price volatility. I read a long article recently about this with regard to grain prices, written by a large, well respected farm management company. They have really put an emphasis on marketing, they say farmers that don’t aggressively hedge will have a tough time.
This I believe is true for oil and gas too. Unfortunately, the cost to hedge has risen dramatically. I recall buying put options near the market for under a buck a barrel around 12-14 years ago. Those now go for $4+.
AlexS, I do not think operating cash flow is the only metric to look at. If we had paid $150K per barrel in 2013 with borrowed funds, the fact that we have had positive operating cash flow in 2016 would be of little solace.
I contend there is mucho debt in the industry that will continue to be “rolled”, little will be paid through net operating income. However, much may be paid through equity issuance.
I sure hope the upstream oil and gas industry is not a microcosm for the whole economy. I’m not smart enough to know that either.
“I am not smart enough to know what this means, or what one should do in this situation, unfortunately.”
That’s fascinating data, “shallow sand”. This is the sort of information I love to get so that I can analyze it, so I’ll give it a shot. This is first pass.
I think we’re watching a bubble. This smells like bubble.
(1) There is too much money among very rich people chasing too few good investments. Accordingly, the prices of investment products are getting bid up in a bubble.
(2) The bubble in oil, in particular, will burst as they see how terrible the rates of return are.
(3) The middlemen and speculators are of course exacerbating the bubble; they always do.
(4) When the bubble bursts, a lot of wealth will “vanish” overnight. It is best to be out of it before it bursts — sell at the top of the bubble if you can, and switch to something which is selling with less inflated prices.
(5) Farmland might be the same sort of bubble. The other possibility is that it might not have the same bubble behavior: its value might increase — if you get the right farmland, farmland which is likely to continue to do well despite climate change — as there are definitely predictions of droughts and crop failures coming in the next few years.
(6) Because of the excess of investment money, it may be impossible to find anything you’re comfortable with which isn’t selling at inflated prices, sadly. Paying off debt is an option if you have debt. Or insuring yourself against liabilities (are all your well capping and clean-shutdown costs prepaid?). That sort of thing.
Hey SS, I remember some time back having a discussion with you about the possibilities of running stripper well pumps using renewables, solar pv in particular. Something interesting popped up in this article I linked to in the non-petroleum thread that is just as pertinent to this discussion:
How will Rick Perry run the Department of Energy?
So, while it’s not getting anything much from solar yet, apparently the oil industry in Texas is getting access to cheap electricity generated by wind.
With regard to wind in Texas, I have seen discussions on other sites, talking about excess electricity and negative prices, a concept I can’t quite wrap my head around! If such a thing really exists, does that mean that oil producers could actually get paid (receive rebates/credit) for some of the electricity they use to pump the product they sell out of the ground? I don’t know how it works but, how weird would that be?
Islandboy. Thanks for the info!
After labor, electricity is our greatest expense.
The UAE is now consistently running many of their oil pumps with solar panels, apparently. (Means they don’t have to wire them to the grid.)
(By the way, there are an awful lot of these mini solar+battery systems, avoiding the grid connection, popping up. I see them on railroad cars powering the hoppers, and powering the refrigerators cars; I see them on streetlights; they’re used for our new fancy parking meter machines; and so on and so on.)
Zero power prices are caused by excess electricity, and it really is happening fairly often.
Negative electricity prices are caused primarily by the subsidies to various forms of power generation. The power generator can bid negative prices down to the subsidy level and still profit. (Without the subsidies, the bidding war would stop at zero.) They’re also caused by extremely unprofitable nuclear power plants which simply can’t stop putting their power out without blowing up; when the solar farm bids zero, the nuclear plant has to bid negative to keep putting its power into the grid.
Clueless should weigh in. I’ve seen the definition get massaged here and there.
Cash flow is inputs and outputs, and while SS is asking about interest above, that’s not the debt focus. New borrowing can be called a cash influx. I’ve seen it done. New borrowing improves cash flow over a period measured. If you define it that way, you can borrow your way to prosperity.
(Look familiar, OMB?)
Watcher is mostly right. For example, there are only a small minority of companies that use GAAP earnings as their primary earnings measure. They all must report GAAP earnings, but usually tout some other earnings measure as their earnings that “are more useful for investors to understand the company’s financial performance.” The GAAP earnings for the most part are standardized. The “more useful” numbers are based upon each company determining for themselves what they will include/exclude. In many cases, totally self-serving. However, they must provide a reconciliation between GAAP earnings and the “more useful” earnings.
With respect to cash flow, each 10-K (annual) report and 10-Q (quarterly) report includes a GAAP standardized statement of cash flow. You may not be able to glean the information that you seek from that report, but it is the only one that I would trust.
Other statements that a company may make in presentations, discussions, etc about “cash flow” I would not trust without a complete detailed discussion of what they were including/excluding in the calculation.
I used the term for GAAP earnings as being “somewhat” standardized. With respect to oil and gas exploration companies, there are 2 different acceptable GAAP standards: successful efforts and full cost. Successful efforts expenses dry holes. Full cost capitalizes them into the pool of depletable costs and expenses them as the reserves are depleted. [Kind of like a manufacturer. Say that quality control finds one out of every 500 circuit boards to be defective. The company does not immediately expense that circuit board. The total manufacturing costs are allocated to the inventory of 499 circuit boards.] But, in the event of significant oil/gas price plunges, the calculation of the amount of write-downs of capitalized/depletable property is also different, depending on which method is used. That becomes a big deal if prices fully recover, because the write-downs are never reinstated.
Not very busy at this moment, so you got a lot of rambling, which I hope is mostly correct.
Mike, shallow sand
Free cash flow is a widely used measure of a company’s financial performance.
Unlike breakeven price and similar indicators which everyone calculates using its own methodology (and nobody discloses this methodology), free cash flow can be easily calculated using the data from company’s SEC fillings.
Below is a definition of free cash flow from investopedia:
Free cash flow (FCF) is a measure of a company’s financial performance, calculated as operating cash flow minus capital expenditures. FCF represents the cash that a company is able to generate after spending the money required to maintain or expand its asset base.
FCF is an assessment of the amount of cash a company generates after accounting for all capital expenditures. The excess cash is used to expand production, develop new products, make acquisitions, pay dividends and reduce debt.
Some believe that Wall Street focuses only on earnings while ignoring the real cash that a firm generates. Earnings can often be adjusted by various accounting practices, but it’s tougher to fake cash flow. For this reason, some investors believe that FCF gives a much clearer view of a company’s ability to generate cash and profits.
However, it is important to note that negative free cash flow is not bad in itself. If free cash flow is negative, it could be a sign that a company is making large investments. If these investments earn a high return, the strategy has the potential to pay off in the long run. FCF is also better indicator than the P/E ratio.
FCF is a good indicator of the performance of a public company. Many investors base their investment decisions on the free cash generated by a company or its equity price to FCF ratio.
http://www.investopedia.com/terms/f/freecashflow.asp
It may seem strange that shale companies had negative free cash flow when oil prices were around $100, but achieved FCF neutrality in 3Q16 when WTI averaged only about $45.
The explanation is very simple. In 2010-14, shale companies were heavily investing, which helped them to achieve double-digit growth in production and to increase overall U.S. LTO output by ~1 mb/d each year in 2012-14.
While negative FCF is not necessarily negative, in this particular case, shale companies’ strategies proved self-destroying.
1) Negative FCF led to accumulation of very high debt;
2) High demand from shale companies resulted in a sharp increase in unit costs for oil services and other inputs;
3) Rapid growth in LTO production caused the glut in the the global oil market and consequent drop in oil prices.
Lower oil prices led to a sharp reduction in shale companies’ operating cash flows. But these companies even more sharply reduced their capex.
Finally, in 3Q2016 their combined capex was roughly equal to combined operating cash flow.
The above chart from the IEA Oil Market Report shows it very clearly.
AlexS. I do not disagree with you that the metrics you are explaining (very well, I might add) are very important.
However, I assume you agree that balance sheets and estimates of future cash flows are also important to look at.
In reality, all can be reviewed in SEC filings, which are the only numbers that are reliable. Company power point presentations are meant to be promotional material.
shallow sand,
FCF is a good shapshot of a company’s financial performance in a particular period. Of course, it is not sufficient for understanding of this company’s whole financial situation and its future prospects.
FCF neutrality in 3Q2016 means that the group of 50 companies didn’t have to increase their debt, but debt accumulated over the previous years remains on their balance sheets and is a heavy burden for future development.
Furthermore, FCF neutrality was achieved thanks to lower capex which resulted in declining oil production.
Higher oil and gas prices expected for 2017 should improve oil companies’ operating cash flows. A number of shale players have already announced planned increases in capex of 10-50% for next year. That will likely reverse the decline in LTO output. But higher capex will not allow shale companies to achieve significant positive FCF, and hence to start repaying their debt.
At $55-60 they will be able to only slightly increase output by year-end 2017 vs. year-end 2016, while maintaining FCF neutrality. A more aggressive increase in capex would result again in negative FCF and increase in debt.
Furthermore, increase in shale companies’ spending will reverse oil service cost deflation, which was the main contributor to declining unit costs in 2015-16.
In my view, a conservative financial and operational strategy, with gradual and modest increases in capex, should allow a moderate growth in LTO production over the next few years without significant increase in debt levels.
But a return to previous growth rates of 1 mb/d p.a. anticipated by some experts (including Rystad Energy) from 2018, would result in further deterioration of shale companies’ financial situation. And it would have a negative impact on oil prices.
Yeah, something critically important in addition to free cash flow is the growth (or, in *this* industry, decline) trajectory. It’s great to have free cash flow this year, but if your wells all run out in two years and you haven’t drilled more, well, your free cash flow this year and next *is the total value of the company*, because there won’t be any free cash flow in year three.
Well, actually, it’s not even that good: liabilities also have to be considered.
Easier said than done. Look at the latest 10-Q for CLR. It seems to me that there would be a lot of questions about their results, especially when you look at their operating cash flow and notice the large impairment charge that is added back, thereby not affecting cash flow from operations negatively. But they lost that cash almost as surely as if they drilled a dry hole.
clueless. Regarding CLR and SEC filings, I have brought up several times that the company managed to reduce its estimate of future production costs by 60% from 2014 to 2015, while only reducing all categories of proved reserves by just 9% during the same period.
I believe there were some things pulled to keep PV10 above long term debt in 2015 and I expect the same for year end 2016.
CLR was not the only company to do this.
clueless,
the large property impairment charge in CLR accounts for 3Q2016 ( $57 million for 3Q and $203 million for 9 months of 2016) is the result of negative revaluation of their reserves (due to lower oil price). It is reflected in the balance sheet as lower net property and equipment (compared with previous period) and as lower shareholers equity.
It is also shown in the income statement, but added back in cash flow statement as that’s not real cash paid by the company.
It’s a paper loss.
Dry hole cost is very small ( $27 thousands for 3Q and $233 thousands for 9 months of 2016). The cost of drilling wells was already accounted as capex. Then the cost of of successful wells was capitalized (and added to PP&E in the balance sheet) and dry hole costs are expensed and appear in the income statement as expenses. But they are added back in cash flow statement as cash paid for both succesful and dry wells was already included in capex.
Alex, thank you for your detailed explanation of free cash flow. After 40 years of operating oil and gas wells I understand the definition very well. It can indeed be used, as you have said, as a snapshot of financial activity within in a brief period of time. As I have said, and Shallow, I believe, it is of little importance in the grand scheme of things. The shale oil industry is in serious financial trouble and 5 dollars a barrel on the “hope” of OPEC cuts has not changed that.
Its curious to me this intense need for some folks to make predictions about the future. Predicting the role shale oil might play in that future over the next decade, or decades, without understanding the financial condition of those companies extracting it, is a big mistake in my opinion. The shale oil phenomena has not been paid for yet, nevertheless you and others are counting on it decades thirty years from now. I do not understand that, sorry. I really don’t have much to contribute here, it seems.
Hi Mike,
I agree LTO will contribute very little in the grand scheme.
Lots of agencies and companies provide outlooks of the future. The Chart below shows the BP Outlook 2016 for C+C+NGL and my “medium” scenario for C+C+NGL with URR=3600 Gb for 2015 to 2035.
AlexS – I did not do a good job of trying to point out that I think that you have to look at more info.
If you read metric number 3 in this short article, it might be clearer.
http://www.oldschoolvalue.com/blog/investing-perspective/useless-stock-metrics/
clueless,
I don’t know who is the author of that article, but the very first phrase about operating cash flow is a complete nonsense:
“The way Cash Flow from Operations is calculated is by starting with net income (equity earnings) which doesn’t include interest paid to debt holders.”
Of course, net income includes “Interest expense”.
See CLR’s 3Q accounts; income statement.
Net interest expense for the quarter was $82 million.
Is peak oil demand in sight? | McKinsey & Company: “McKinsey’s latest automotive consensus suggests that by 2030, electric vehicles (including hybrids and battery-powered plug-in vehicles) could represent close to 50 percent of new cars sold in China, the European Union, and the United States, and about 30 percent globally. Also, for the first time, our business-as-usual case includes autonomous-vehicle adoption and car sharing. If the market penetration of electric, autonomous, and shared vehicles accelerates, oil demand driven by light vehicles could be approximately 3 million barrels lower in 2035 than assumed in the business-as-usual case.”
http://www.zerohedge.com/news/2017-01-03/crude-crashing
“As the Dollar Index surged post-manufacturing data, WTI Crude began to lose altitude from its overnight ramp. Combined with ongoing concerns over Libya’s production ramp, crude just crashed from over 55.00 to under 53.00 in minutes on heavy volume…
The EIA market and finance report for 3Q2016 is out today.
https://www.eia.gov/finance/review/pdf/financial_q32016.pdf
Oil and gas supply is now falling. The chart below shows pretty clearly why there was a glut: over investment leading to over supply, which is now correcting. Nothing much to do with demand reduction that I can see. One thing I haven’t seen discussed, and can’t find find a lot of analysis on, is how much either direct motor fuel subsidies (e.g. in producer countries and some other developing countries) or high taxes in Europe tend to reduce the impact of prices on demand changes. I’d be interested in any opinions or references.
This is the a boom and bust cycle combined with the end of life in a mature basin looks like (for the UK – only one new field approval this year to September).
And this is why the coming bust in supply might be a bit different from previously – something changed in the oil industry in December 2014 and I don’t think things will play out quite as they have previously, even with rapidly rising prices, given the debt load.
High taxes create a “tax shield”. The price at the pump in Europe is approx. 1/3 oil and refining and 2/3 tax and duty (see http://euanmearns.com/energy-prices-in-europe/). Consumption is therefore less responsive (inelastic) to the international oil market price compared to the USA. Also, Europeans have adapted to this over time and drive smaller and more fuel efficient cars.
Several oil producers have cut back on subsidies during the last couple of years. This should restrict domestic demand increase. Most oil exporters’ oil consumption/capita will probably level off and never come close to the US figure. However, given the level of population growth and demographics (young people) in MENA their domestic consumption is unlikely to reduce significantly (slight increase seems more likely).
“Most oil exporters’ oil consumption/capita will probably level off and never come close to the US figure.”
US per capita consumption 0.061 bpd.
Exporters:
Canada 0.066
KSA 0.135
Kuwait 0.156
Qatar 0.145
UAE 0.09
The only major exporter not there is Russia at 0.02, but President Trump will help them increase.
Not an exporter but FYI Singapore is highest I’ve seen at 0.24.
_most_ oil exporters.
In 2012 (http://www.indexmundi.com/map/?v=91000): Ecuador (0.11), Libya (0.051), Kazakhstan (0.12), Iran (0.23), Iraq (0.22), Venezuela (0.27), Oman (0.46)
mazama says ecuador may drop to imports this year. They don’t list any Libya exports. Kazakhstan and Iran are legit. And the bible doesn’t track Iraq.
“The only major exporter not there is Russia at 0.02, but President Trump will help them increase.”
How? Will he help to increase car fleet in Russia?
KSA and its neighbours use a lot of oil for electricity generation.
Russia uses natural gas, nuclear, hydro and coal.
How? Will he help to increase car fleet in Russia?
Precisely.
Just to add information, in Europe, taxes are split in two parts: excise (typically fixed amount) and VAT (variable amount). For gas in Belgium, excise are about 0.60 per litre or half the price of gas. So price variations due to oil international prices are attenuated. Add to these that taxes decreases when oil price increase and increase when oil price decrease. This is a way to guarantee revenue for the State when oil prices decrease.
“The chart below shows pretty clearly why there was a glut: over investment leading to over supply, which is now correcting. Nothing much to do with demand reduction that I can see.”
But doesn’t the fact that there can be oversupply suggest that there is, if not demand reduction, then at least not demand acceleration. It shows that it is possible to produce more gas and oil than the world needs, so is there any value in politicians saying they want policies that increase production?
Boomer II,
Yes, there is value. The long term predicament has potentially awful implications, and it seems better to prolong the status quo than face the reality that things are changing. Increased production efforts now will result in some additional supply coming online a few years down the road when it will likely be sorely wanted.
Besides, the short term goal is more likely tax reductions and subsidies that can affect balance sheets in the shorter term. In the oil business, the long emergency is now. New production for the long term is less critical than financial survival.
More free money is probably the only thing that will increase production. I can’t see reasoned investment decisions going to E&P in this uncertain business climate, but free money clouds the view of risk, so fools will rush in, if history repeats.
Yes, there is value in political hopium. Keeps the masses from thinking about change.
The politicians won’t do what we think they will anyway, for the most part.
Jim
Indeed, demand reduction for oil won’t kick in visibly for some time.
To a first approximation, all oil demand is land transportation demand and to a first approximation all of that is “light duty vehicles”. In order to see a 1% reduction in oil demand permanently, I think you need to see a shrinkage in the oil-driven car fleet of 1%.
Global light duty vehicle sales per year are about 76.7 million and growing about 5% per year (though it’s been slower so it’s not clear whether this will last). So let’s see the prerequisites here.
Step one is to replace the growth in sales entirely with electric cars. This means electric cars at 5% of the world market. World electric car sales are now 664,000 — doubled in 2 years. Fitting the curve since 2014, the annualized growth rate is 89% per year, so it may have slowed down, but it may just be noise (we had noise on the Swanson’s Law curve for solar too).
So pessimistic estimate for electric cars to replace the ENTIRE new car market 15 years. Optimistic estrimate, 8 years.
We should see an effect on oil demand well before that. 1% of the world fleet is about 12 million cars, or 15% of the new car market. That’s 5 to 9 years from now.
How about 5% of the new car market — the benchmark level where the number of gas powered cars becomes steady so that the oil demand stays flat. (I’m assuming stable vehicle lifetime which I strongly believe is a fair assumption.) That’s 3 to 6 years from now.
The number I’ve been trying to figure out is when the oil price permanently collapses and goes into permanent glut, but this is very tricky. It depends on the decline rate of the oil fields. You have to add the decline rate to the growth of the new car market. So a 6% decline rate + 5% car sales growth = 11% (5 to 8 years). An 11% decline rate + 5% car sales growth = 17% (6 to 10 years). This puts it in the 2021-2026 range. If fracked fields drop off much, much faster, however, then it happens later.
As you can see the first-order influence is the growth rate of electric car sales, which I believe is fundamentally driven by how fast the factories get built, which is mostly driven by China. And so rather hard to predict.
Fracking Follies
http://www.resilience.org/stories/2017-01-04/fracking-follies/
I’ve a new post on the Permian here.
Oil platform fire reported in Gulf of Mexico near Grand Isle
http://www.nola.com/traffic/index.ssf/2017/01/oil_platform_fire_louisiana.html#incart_breaking
Now for the rest of the Story. Russia exports exceed Saudi in 2017 ?
http://www.zerohedge.com/news/2017-01-04/rogue-oil-gas-nation-just-set-slew-output-records
There should be a variety of factors that change the oil demand in the future:
1. Technologies that allow people to use less oil for transportation.
2. Recession, which means fewer people will need to drive to work and fewer will have money for recreational car and plane travel.
3. Aging populations, who don’t need to drive as much.
4. Rising costs of gasoline, which will likely encourage less oil use.
5. Water declines in farming areas, which will likely affect petroleum use in those areas.
These changes could be gradual, or they could happen suddenly, but as supplies decline, demand will also likely decline.
EIA AEO2017 came out yesterday.
http://www.eia.gov/outlooks/aeo/pdf/0383(2017).pdf
Their oil and gas projections are below. Assuming a 5% decline after 2040 I make it they are predicting 240 Gb current available reserve for the high case and 165 Gb for the reference case (those would be equivalent, respectively, to 1.6 and 1.1 million, mostly new, Eagle Ford type wells. I didn’t check but probably a similar order of numbers for the gas projections).
Crude oil production forecast in the AEO is extended to 2050.
Here is a chart comparing U.S. LTO production projections from the AEO issues from 2012 to 2017.
Updated projections anticipate higher output in 2016-2029, but lower in 2030-40 (vs. AEO-2016)
Implied cumulative production in 2010-2015: 81.9 billion barrels
Total U.S. C+C production projections
Quote from the AEO-2017:
Crude oil production in the Reference case increases from current levels, then levels off around 2025 as tight oil development moves into less productive areas.
• Despite rising prices, Reference case U.S. crude oil production levels off between 10 and 11 million barrels per day as tight oil development moves into less productive areas and as well productivity gradually decreases.
• But other types of oil production continue to yield significant volumes
Projections of tight oil and shale gas production are uncertain because large portions of the known formations have relatively little or no production history, and extraction technologies and practices continue to evolve rapidly. Continued high rates of drilling technology improvement could increase well productivity and reduce drilling, completion, and production costs.
Lower 48 Offshore C+C production
Lower 48 onshore C+C production by region
The Southwest and Dakotas/Rocky Mountains regions lead growth in tight oil production in the Reference case—
and the Gulf Coast region remains an important contributor to overall production levels
• Growth in Lower 48 onshore crude oil production is projected to occur mainly in the Southwest, Dakotas/Rocky Mountains, and Gulf Coast regions.
• Growth in crude oil production in the Southwest is supported by increases in the Permian basin, which includes both tight and non-tight formations.
• Growth in the Dakotas/Rocky Mountains crude oil production is driven by increased production from the Bakken play, which is exclusively tight oil.
• Production in the Gulf Coast region, primarily from the Eagle Ford and Austin Chalk plays, increases throughout most of the projection period.
Alex,
I think the only question about the US DOE/EIA projections is how much have they overestimated production rates. In my opinion, it will turn out to be a lot.
Roger,
U.S. LTO production projections by the EIA, IEA and OPEC are actually among the most conservative.
The EIA expects relatively moderate growth over the next 5 years (2018-2022) levelling off thereafter.
Annual growth in U.S. LTO production (mb/d)
source: EIA Annual Energy Outlook 2017
And this is a recent forecast by Rystad Energy.
They are projecting annual growth of more than 1 mb/d from 2018
Global LTO production projections (mb/d)
Non-U.S. LTO production growth accelerates after 2030, with output reaching 3.28 mb/d in 2040
Global liquids supply rises to 121 mb/d in 2040, about 1mb/d lower than in AEO-2016.
Global conventional C+C is not peaking and reaches 86 mb/d in 2040
Bitumen (oil sands) production increase from 2.54 mb/d in 2016 to 3.31 mb/d in 2040.
Oil price projections:
Nominal Brent spot averages $51/bbl in 2017; $66 in 2018; $75 in 2019; and $81 in 2020. Then rises to $128 in 2030; $178 in 2040 and $236 in 2050
In real terms (2016 dollars) Brent rises to $75 in 2020; $95 in 2030; $109 in 2040 and $117 in 2050
For some reasons, the EIA anticipates a significant price differential between Brent and WTI of around $7/bbl from 2018.
AlexS, I was thinking that the graphs you have posted should be painted on 8′ x 12′ canvases and hung in a post modernist art gallery, specializing in abstract absurdist art. They would easily command prices of between six to eight million dollars each if put up for auction at Sotheby’s or Christies’
Cheers! 🙂
If you can find a buyer, we can discuss the price and your commission fee 🙂
It has to be a 3-4-5 triangle. 3×3×4×4=5×5
16:9 for HD, the canvas has to be 9 feet high by 16 feet wide.
Needs to be aesthetically pleasing, more panoramic, easier on the eye.
Always a need for more oil.
Makes for more improvement, more abundance. Always room for more abstract absurdist art.
The population is now close to 7,500,000,000 happy campers here on earth. You need big canvases for abstract absurdist art so everybody can see it.
I have always wanted to project a giant image of the earth into space so you can see the whole earth from earth, better viewing at night, but still could be seen during the day.
Hey people, read this! VERY, VERY IMPORTANT!
Brace for the oil, food and financial crash of 2018
New scientific research suggests that the world faces an imminent oil crunch, which will trigger another financial crisis.
A report by HSBC shows that contrary to industry mythology, even amidst the glut of unconventional oil and gas, the vast bulk of the world’s oil production has already peaked and is now in decline; while European government scientists show that the value of energy produced by oil has declined by half within just the first 15 years of the 21st century.
The upshot? Welcome to a new age of permanent economic recession driven by ongoing dependence on dirty, expensive, difficult oil… unless we choose a fundamentally different path.
The afore mentioned HSBC report: Global Oil Supply
Supply constraints seem a distant prospect in the current oil market, but a return to balance in 2017 will leave the World with severely limited spare capacity.
Meanwhile, near term productivity gains are temporarily masking a steady increase in mature field decline rates which could cut existing capacity by >40mbd (>42%) by 2040e.
We think risks of supply constraints will resurface long before risks of global demand peaking, and a steady tightening in the supply/ demand balance post-2017 is behind our unchanged USD75/b long-term Brent price assumption.
A short 5.5 minute video can be found here:
HSBC Video on oil supply peaking
They are predicting a 5% to 7% decline rate. They also stress the point that I have made for many years, that the measures taken to stall decline rates will only cause decline rates to be much higher once the giant fields do start to decline.
Thanks for the link, Ron.
The HSBC report was written in September 2016; and they have underestimated global demand growth in 2016, which was almost 1.4 mb/d vs. 1.1 mb/d in their forecast.
They expect growth of 0.9 mb/d in 2017, while most current forecasts are around 1.3 mb/d.
HSBC demand projections for 2018-2020 (0.8-0.9 mb/d) are also below other forecasts.
So, if HSBC supply forecast is correct, the market rebalancing and then supply crunch may occur even earlier.
“They expect growth of 0.9 mb/d in 2017, while most current forecasts are around 1.3 mb/d.
HSBC demand projections for 2018-2020 (0.8-0.9 mb/d) are also below other forecasts.
So, if HSBC supply forecast is correct, the market rebalancing and then supply crunch may occur even earlier.”
I’m leaning toward a global recession reducing demand. The US is, by historical standards, overdue for another recession. And I think the recessions we get are getting more severe, so the next one could be substantial.
So what has changed since 2007?
1) Recessions and the business cycle . . . if central banks cooperate because they have embraced a narrative that if anyone falls, everyone falls . . . then why must there be recession or business cycle? Those aren’t rules of nature like gravity. CBs can flood money in to stop any such thing, and if they all do so no one currency is at risk relative to others. So there is no longer an inevitable moderation on oil consumption from recession. The world changed. Bernanke did more harm than he could ever know.
2) When there isn’t enough, someone doesn’t get an order filled. What does that someone do when he doesn’t get the oil he ordered?
3) From Ron’s quote — “while European government scientists show that the value of energy produced by oil has declined by half within just the first 15 years of the 21st century.” It’s not clear what this means as to how, but if they have finally started to understand the relentless march of API rating upwards on liquids flowing, then somewhat finally the eroding energy content of condensate vs, say, API 30 oil is getting its 15 yrs (rather than minutes) of fame.
Oh, another thing. Jeffrey Brown and I had a discussion a year or two ago about terminology of decline rates.
Net vs . . . I guess gross. “Natural decline rates”. What happens if you don’t drill. What happens if something else happens above ground like pipeline damage or whatever.
5-7% is gross or net? About 4 yrs ago I heard an interview with a Lukoil guy who said Russia has a 6% decline rate and the hapless interviewer started talking about Russia’s production technology not being up to snuff so they can’t grow rather than decline. The Lukoil guy blurted out “without drilling” and the reporter was immediately completely lost — but I’ve always suspected the Lukoil guy had said something that moment he wasn’t supposed to.
To get back to Ron’s comment above – “the measures taken to stall decline rates will only cause decline rates to be much higher once the giant fields do start to decline.”
Are the measures that were taken to stall decline rates as simple as infill drilling? And was most of this drilling done in the years when oil prices were $100/barrel or more, and oil companies could justify the large acceleration component of the oil these wells produced? (In other words, these wells, for the most part, just accelerated production while adding very few incremental barrels.)
My suspicion is the answer to the questions above is yes.
SLG – there has been some addition of EOR over the last 10 years as well: e.g. in China, Oman, India, Malaysia. Of these all but Oman are now seeing quite high decline rates, and Oman might soon. Saudi redeveloped their offshore fields and added artificial lift (mostly ESPs) on new wellheads in a lot of cases. From the numbers and some comments I have seen in-fill drilling in Russia, OPEC Middle East (on shore) and China did not drop off as the oil price fell, but might have even increased, although that looks to have reversed in China over the last year.
Hi South LA Geo,
No doubt more investment was required to increase oil output, but World C+C output increased impressively from 2013 to 2015 by about 4 Mb/d. This was unexpected, I agree that it is unlikely to be repeated. It is more likely that an increase in oil prices to $100/b (or higher) might lead to a plateau until 2020, followed by decline and higher oil prices (possibly as high as $150/b by 2030).
Eventually oil will price itself out of the market as battery cost falls and EVs and plugin hybrids start to significantly reduce demand and start to reduce oil prices. This will accelerate decline rates as high cost projects will no longer be viable and most oil production will be onshore Russian and Persian Gulf oil which may deplete quickly as oil prices fall due to lack of demand.
By 2060 there will be very little demand for oil except possibly ships, air transport, and farm use, very little ground transport will use oil by that time in my view.
By 2060 there will be very little demand for oil except possibly ships, air transport, and farm use, very little ground transport will use oil by that time in my view.
There will never be any portable energy transportation source as cheap as oil. Of course coal is cheaper than oil, but you cannot have a coal burning car, or airplane. Batteries will definitely not be cheaper.
If there is little demand for oil by 2060, as Dennis surmises, that will be because there is no oil to be demanded, or because what little oil there is available will be priced so high no one can afford it.
The idea that we will transition, smoothly, to “renewables” is absurd beyond belief. Only in fairy tale land is such absurd things believed.
How comfortable it must be to live in a land where anything you believe strongly enough, can really be achieved. You guys should wake up and smell the coffee. Just believing it just don’t make it so.
“There will never be any portable energy transportation source as cheap as oil.”
Why?
We don’t know what technologies lie ahead. Oil works well for transportation designed to use it. But why will we be tied to those technologies?
I think a transition to renewables will require changes in lifestyles, but saying that nothing can substitute for oil seems myopic.
Hey, I did not say there can be no substitute for oil. I said there will never be a portable transportation fuel as cheap as oil.
Do you actually think batteries will be cheaper than oil? Have you renewable guys drifted so far from reality that you think batteries will be more economical than oil. I just gotta see your first battery powered 18 wheeler. Not that that there will never be one, but if there is you can be dammed sure the operating cost will be many times the cost of diesel.
“Oil consumption is not like smoking, with health warnings printed on packets.
Smoking is a lifestyle choice.
Oil is the choice of life or death. Except that we don’t have a choice. ”
Seems like what is happening currently—
Substitutes will go down in price and oil will go up in price.
When you say there will never be a portable transportation fuel as cheap as oil, what price do you have in mind?
Why couldn’t something like this become cheaper than oil? Wind to create hydrogen to be used in fuel-cell powered vehicles.
NREL: Hydrogen and Fuel Cells Research – Wind-to-Hydrogen Project: “Formed in partnership with Xcel Energy, NREL’s wind-to-hydrogen (Wind2H2) demonstration project links wind turbines and photovoltaic (PV) arrays to electrolyzer stacks, which pass the generated electricity through water to split it into hydrogen and oxygen. The resulting hydrogen is stored for later use at the site’s hydrogen fueling station or converted back to electricity (via a hydrogen internal combustion engine or fuel cell) and fed to the utility grid during peak-demand hours.”
When you say there will never be a portable transportation fuel as cheap as oil, what price do you have in mind?
That question is just a little absurd. Of course if oil goes to $1,000 a barrel then batteries will be cheaper. I was speaking of the price of oil as the price was, and is, in the heyday of oil. Not in some future time when oil is so scarce that its cost is prohibitive.
The problem will be then, as it is now, affordable transportation fuel. If the cost is too high the economy goes into a recession. And if transportation fuel never gets affordable, then the recession becomes a depression and…..
There are a few novelty hydrogen cars around. And that’s all the hydrogen car ever will be, a novelty.
Hi Ron,
Electrified trains will replace 18 wheelers, there is no reason batteries couldn’t replace diesel for short haul, long haul freight will move by rail in the future which can be electric. About half of ground transport fuel is used by personal transportation, it is easily foreseeable that liquid fuel used for personal ground transportation will be replaced by batteries by 2060. It might take longer for trucks, ships, and planes, but higher liquid fuel prices will lead to more rail, nuclear or wind powered ships and new air transport using biofuel, or hydrogen as a fuel.
If you wanted to pick a substance that presented that most challenges in terms of safety, materials and efficiency for storage and transport then hydrogen would be top of the list.
Hi Ron,
The price of EVs will fall rapidly to about the same price as an ICEV by 2025. It is already cheaper to fuel a car with electricity vs gasoline or diesel.
Bottom line, I think you are wrong.
As far as coal and natural gas, those will also be driven from the market by cheaper wind and solar as costs fall.
In 1905, the automobile was a novelty. Most 75 year olds probably thought the idea that horses would be a niche form of transportation by 1950 was absurd.
They were also incorrect.
Fossil fuels will become more expensive as they deplete and they will be replaced by other forms of energy.
I have never said it would be easy.
I have consistently predicted another Great Depression which will start in 2030+/-5 years due to the difficulty transitioning from fossil fuels to other forms of energy.
Once peak fossil fuels is widely recognized as a problem, society will get to work to solve it and there are many solutions with the proper policy in my opinion.
Oh and believing that something will not happen, does not mean that it will not.
Things change over time. Think of all the things that have changed over your lifetime that your grandfather may have thought would never occur.
Cheap oil for transportation gave us a lot of unnecessary transportation. We never needed personal vehicles that got 8 miles to the gallon.
While cheap oil may have given us trucking, it also gave us suburbs and work commutes that haven’t necessarily improved lives.
So I don’t think society will lose so much in terms of transportation if cheap oil is gone.
As for hydrogen powered vehicles, they are definitely doable.
We built a society on the basis of petroleum vehicles, but we didn’t have to do that. And those vehicles can be replaced.
While there is a debate about whether fuel cell cars will become competitive with EVs, there are still some interesting experiments. Here’s one of them.
Flush, then fill up: Japan taps sewage to fuel hydrogen-powered cars – LA Times: “Starting late last year, drivers of vehicles like the Toyota Mirai and Honda Clarity have been able to roll up to the sewage plant and power up their hydrogen fuel cell cars at what you might call the world’s first toilet-to-tank filling station.
The station is working only 12 hours per day but already is making enough hydrogen to fill 65 cars daily — and that could grow to 600 if all the biogas at the plant was harnessed.”
Hey Ron, I know you think I’m in La La land but, here’s the thing, I became aware of Peak Oil in late 2007 – early 2008 and got really alarmed, thinking TEOLAWKI (the end of life as we know it) was near at hand. In a comment on the non-petroleum thread I went into more depth as to how the worst case scenarios for Peak Oil have not happened (yet!) and how, in the meantime pretty remarkable progress is being made on the renewables and EV fronts (wind power up 8x, solar up 100x, ~30 plug-in EVs/HEVs available in CA as opposed to zero, over half a million cumulative plug-ins sold in the US, approaching two million worldwide).
The way I see it, humanity is walking a fossil fuel enabled tightrope across the Peak Oil chasm with the Peak Oil being like a rat gnawing at the rope. If we ignore the rat and take our own sweet time to transition the chasm the rope will break and we are toast. If we move with urgency there is a chance we might make it. I say let’s give it a try.
If we make it across the chasm, we’ve still got to face the climate change dragon that is shaping up to breath fire all over us but, that is another story for another day (thread). 😉
Thanks a lot for the link Ron!
Buckle your chinstrap!
Only conventional oil provide an high net energy return toward economical activities, If you want high EROEI.
Tar sand, Venezuela and Canada, are net energy negative. Or they have and EROEI between 0 and 1. This is why Venezuela is in so much toubles, it cannot sell its oil on international market because it uses all its oil to produce oil.
Conventional oil is now depleting fast and the human specie is now in a dire place. The rate of depletion of conventional oil is what matters because it is the only one contributing energy to get things done.
Natural gas or condensate from shale oil provides also a high net energy return because the refining process ( or purifying of natural gas) is less energy intense then oil. From what I could understand condensate production is also down, with it net energy available to produce economical activaties.
Net energy has to be looked at for all of society’s energy production in order to be useful.
As long as there is a need for liquid fuel, the net energy will matter less than the price of the energy relative to alternatives.
A net energy analysis of the oil industry in isolation only would make sense in a World where the only source of energy was oil. We do not live in such a world.
You obviously don’t have an mechanical engineering background. Net energy and the law of conservation of energy is used into building and designing car engine and diesel.
This site is full of losers like you with no science background, This was my last comment on this loser web site,.
Try to desing a car engine with your outdated money concept.
Hi Mynamett,
I have a bachelors degree in Physics and studied Mechanical engineering for 3 years before switching to physics. I also have a Bachelor’s and Masters in Economics.
Perhaps you didn’t read carefully. The total exergy used by society is what is important.
There is a great deal of energy used in the oil industry provided by electricity which can be produced with other sources besides oil (coal, natural gas, nuclear, wind, solar, and hydro).
The point is simply that a net energy analysis for only oil makes very little sense.
For those who produce oil, the concern is profit not energy. Oil will be produced if it can be done so profitably regardless of net energy.
As long as the net energy of all energy produced by society (oil, natural gas, coal, hydro, wind, solar, and nuclear) is greater than about 3 units of energy out for every unit of energy in, there is no problem.
Of course some forms of energy might allow an even lower ratio, because wind and solar have far lower losses than coal, oil, and natural gas as there are far fewer thermal losses (most combustion is eliminated.)
Hi Ron,
An interesting piece, I doubt however that 2018 will be the date, I think the World economy can take higher oil prices than $60/b as it did from 2011 to 2014. The debt problem is not as big as it was in 2008, there might be a gradual transition to EVs and plugin hybrids from 2018 to 2030 which may take some pressure off of demand for oil. Traditional demand forecasts underestimate the speed that EVs will take market share from ICEV in part because they usually underestimate oil prices.
From 2020 to 2030 oil prices are likely to range from $100 to $150/b (in 2016$), this will lead to a lot of demand for EVs as battery costs continue to fall. I expect EVs and plugin hybrids will be 50% of new car sales volume by 2035. By 2040 100% of new car sales will be EVs and Plugin hybrids and after 2050 about 95% of all personal ground transportation will be plugin. Goods transport will have switched to electrified rail with plugin hybrid trucks moving goods from rail to stores. Local busses will be electrified and long distance travel will be by rail or use rapid charging for vehicles (like Tesla Supercharger network). Note that this transition creates jobs building and upgrading railways and building plugin vehicles along with wind, solar and hydro and an updated HVDC grid.
Lots of jobs upgrading buildings as well to make them more energy efficient. In addition EVs, rail, light rail, wind, solar, and hydro are more efficient so less energy is wasted as heat.
Very surprised that the HSBC projections are for USD75/b long term price, given the continued growth in demand and the big prod declines that they foresee. It appears to me that they got these trends right on, except why wouldn’t the price then escalate far above 100/b?
Also, sounds like they acknowledge we are in ‘post-peak’ era currently.
In Belgium, in the Walloon region (South part of Belgium), they are progressively planning to allow new house building or house transformations and renovations only for “zero energy” houses. The latest step being planned for 2021. So houses are progressively transformed to use less and less energy for heating (via solar panels and heat pump), and use PV for electricity.
The most striking chart to me in the report showed the sudden decline in exploration success since 2010. For all the technology we have gone from finding oil once in five wells to once in twenty. That there was a decline was obvious – more money was spent on exploration than ever in 2011 to 2014 and discoveries kept falling until they hit multi-decade lows, but the actual numbers are much worse than I expected.
It seems to indicate that decline in prospective locations was matched by technology advances (in seismic, new generation rigs, computer models, core analysis) for the last 20 or more years, but now we’ve simply run out of locations. What the chart doesn’t show is the cost – a rise from a million or (today’s money) for a vertical onshore well to over $100 million now for deep water offshore (or several billion in the Arctic). There was one new frontier success this year in the Dead Sea, but a few high profile. The response this year has been to gradually withdraw from frontier areas and concentrate on near field locations – there are only so many of them though. failures. As prices rise will drilling return? If it does I can’t see it lasting more than ten years unless it is areas currently under moratoria (and for all the talk many of those are actually more gas prone – e.g. Arctic, BC Canada, Atlantic Coast USA).
It will be interesting to see the results for this year. I think oil will be about the same as last year in quantity, but maybe with smaller average fields. Gas is likely to be down compared with recent years.
5% success rate is indeed extremely low.
Would be interesting to see estimates from other sources.
Richmond EP have indicated 6% on frontier areas for the last couple of years and they probably have the best exploration database. I think it cost over $4 billion in wells before the Liza discovery was made in that formation, which is probably around one in 30 or 40 (and the next well was then a dud as well, although appraisal on the Liza field has been good. I think Richmond’s annual report is free after a few months as long as you register – I might have a try.
That should be Black Sea (not Dead)
offshore Romania?
Bulgaria – Total Oil; they haven’t announced any resource figures though.
The latest edition of the AAPG (American Association of Petroleum Geologists) Explorer just came out, and they provide a preliminary list of the largest discoveries of 2016, as seen by IHS. Only 7 of them have estimated recoverable reserves over 200 mmboe. These include: Caulus Energy’s Alaska North Slope discovery (1.8 Gb oil and 1.8 tcf gas), Kosmos Energy’s offshore Senegal discovery (5 tcf gas), 2 offshore Angola discoveries by Cobalt (2 tcf +condensate in one, and 200 mmbo and 290 bcf in the other), an offshore Myanmar discovery by Woodside/etal (1.5 tcf), a discovery by Gazprom in the Sakhalin area (1.2 tcf + condensate) and Chevron’s GOM Gibson discovery in the Guadalupe area (190 mmbo + associated gas).
Don’t know why Exxon’s Nigeria discovery was not included. They also did not include the Permian Wolfcamp.
In the northern GOM, a fair number of smaller discoveries were made, but all, if developed, are likely to be tiebacks to existing facilities. LLOG probably had the largest number of these discoveries.
One play that I think industry will pursue in the northern deepwater GOM is an extension of the established Wilcox trend both to the north and west, where the petroleum systems are likely to be more gassy. Both BHP and Chevron, and perhaps others, have fairly significant leaseholds in these areas.
I have some doubts about that Alaska find. They are a private company and don’t have to follow quite the same reporting rules as SEC require. They didn’t flow test the well. It was a redrill in an area that another company (maybe Shell?) had already looked at and decided not to pursue. It’s an area known to be likely heavily faulted and difficult to drill.
But on the other side there’s the ExxonMobil Nigeria oil not shown, also I think there was about 500 mmbo in Kuwait announced and something in Russia – maybe they were confirmation of existing discoveries and would be backdated.
Wolfcamp has been developed for decades.
It’s not a discovery.
There was a new estimate of technically recoverable resources by USGS, which some of the media sources called “discovery”.
Hi All,
On my chart at the top of the post, I underestimated 2015 World C+C output by about 200 kb/d. In the chart below I compare my medium scenario (with corrected 2015 data) and slightly modified extraction rates from 2015 to 2020. The secondary peak in 2018 is about 10 kb/d lower than the 2015 peak in this scenario. By the EIA estimate for Sept 2016, World output is only 180 kb/d below 2015 average C+C output and 340 kb/d below the peak 12 month average output.
For comparison, the BP outlook predicts about 84 Mb/d in 2020, or about 4.1 Mb/d higher than my “medium” scenario (3300 Gb C+C URR).
In addition, the BP Outlook 2016 predicts about 93 Mb/d for C+C output in 2035, my medium scenario (3300 Gb C+C URR) by contrast predicts about 66 Mb/d of C+C output in 2035, a difference of 27 Mb/d.
tra la tra la Consumption Consumption Consumption
In his 2011 State of the Union address, President Barack Obama set the goal for the U.S. to become the first country to have one million electric vehicles on the road by 2015.[193][194]
. . .
Considering that actual plug-in car sales were lower than initially expected, as of early 2013, several industry observers have concluded that Obama’s one million goal by 2015 was unattainable.[196][197][198] (note 2013 was before oil price decline)
. . .
With only about 400,000 plug-in electric cars sold in the United States by the end of December 2015, Secretary of Energy, Ernest Moniz, said in January 2016 that the one million goal may not be reached until 2020. haha jerk
. . .
U.S. cumulative plug-in sales since 2008 achieved the 500,000 unit milestone in August 2016. haha 1/2 a year later
. . .
The American Recovery and Reinvestment Act of 2009 (ARRA) also authorized federal tax credits for converted plug-ins, though the credit is lower than for new PEVs.[204] The 2009 ACES also has extensive provisions for electric cars.
. . .
The new qualified plug-in electric vehicle credit phases out for a PEV manufacturer over the one-year period beginning with the second calendar quarter after the calendar quarter in which at least 200,000 qualifying vehicles from that manufacturer have been sold for use in the United States. haha subsidies are dying and Pres Trump ain’t gonna give them mouth to mouth
How much subsidy? The tax credit for new plug-in electric vehicles is worth $2,500 plus $417 for each kilowatt-hour of battery capacity over 4 kwh, and the portion of the credit determined by battery capacity cannot exceed $5,000. Therefore, the maximum amount of the credit allowed for a new PEV is $7,500.[203] Both the Nissan Leaf electric vehicle and the Chevrolet Volt plug-in hybrid, launched in December 2010, are eligible for the maximum $7,500 tax credit.[206] The Toyota Prius Plug-in Hybrid, released in January 2012, is eligible for a $2,500 tax credit due to its smaller battery capacity of 5.2 kWh.[207] All Tesla Motors cars are eligible for the 7,500 tax credit.
. . .
A 2016 study conducted by researchers from the University of California, Davis found that the federal tax credit was the reason behind more than 30% of the plug-in electric sales. The impact of the federal tax incentive is higher among owners of the Nissan Leaf, with up to 49% of sales attributable to the federal incentive.
These bozos live or die at the govt trough. Die would be so much better.
BTW that’s just the feds, http://watchdog.org/244308/subsidies-electric-car/
“With only about 400,000 plug-in electric cars sold in the United States by the end of December 2015, Secretary of Energy, Ernest Moniz, said in January 2016 that the one million goal may not be reached until 2020. haha jerk
. . .
U.S. cumulative plug-in sales since 2008 achieved the 500,000 unit milestone in August 2016. haha 1/2 a year later”
I wouldn’t laugh too hard. half the targeted amount eight months past the target is definitely a miss but, considering that when the million unit target was announced, only 345 plug in cars were known to have been sold in December 2010 the first month of sales, 326 Chevy Volts and 19 Nissan Leafs. IIRC GM had said they could make 30,000 units the first year. Actual number sold 7,671. The Nissan actually sold more at 9,674. (see http://insideevs.com/monthly-plug-in-sales-scorecard/ )
The thing is, the administration was basically alone on this target. The auto manufacturers were not on board. In the six years since the target was announced, only one manufacturer has had a battery electric vehicle with a range greater than 200 miles available. If you dropped that range to 150 miles it would still be only on, at least up the end of 2015. Many of the vehicles on offer were compliance cars, sold to satisfy CARB zero emissions mandates and just enough were sold to satisfy the requirements.
It is Tesla that has basically creamed the premium sedan segment (>$70,000) and is promising to stir up some trouble in the >$35,000 segment, that is dragging the establishment, kicking and screaming, into the EV space. IMO Tesla is the reason GM brought the BEV Bolt to market late last month but, now that it’s here, it’s gonna be very interesting from now on. Another interesting one to watch is going to be the Mitsubishi Outlander PHEV, the worlds fourth most popular plug in vehicle to go on sale in the US some time this year (Mitsubishi Again Promises Outlander PHEV Will Launch In U.S. Soon, Or By March 2018 At The Latest).
Hi Watcher,
I am as much of a free market guy as you are apt to find outside the Republican party, but I try to mix a little common sense in with my thinking about abstractions, such as free markets, socialism, democracy, etc.
You name any abstraction that’s important, and I will show you some reasons why leaving it to the beavers of the laissez-faire type is almost always a MISTAKE.
You will have reason to forget you ever uttered such words one of these days if you need radiation therapy, because without government funded research and support, that tech would still be in it’s infancy, if it existed AT ALL.
You eat the results of going on two centuries now of publicly funded research that has a hell of a lot to do with allowing one guy to produce food enough for a hundred or more. Damned near all the infrastructure that allows you to eat California grown fresh fruits and vegetables all thru the winter was built with tax money.
I have half a dozen neighbors who have nice lakes on their property that were built mostly with flood control money. The folks who live fifteen miles downstream are grateful that the river that runs thru their small city seldom floods these days, although some biologist types aren’t so happy about it.
The big auto companies got their start , nearly all of them, fifty to a hundred years ago, when things were easier, in terms of doing as you please, dumping waste, getting permits, you name it. Now things are tougher, for people trying to break into such industries, and new competition needs some HELP if there is to BE any new competition, on a timely basis.
Nearly every member of this forum will agree that at some point, we are going to have do deal with the exhaustion of nature’s one time gift, or curse, of fossil fuels, and most of us believe that day is not more than a generation or two down the road. Judging by your comments here, I think maybe you believe the same.
I haven’t been able yet to locate any predictions made by professional economists as to how much the price of oil will be depressed due to the adoption of electric vehicles, but we know that if they start selling by the millions annually, they will depress the demand for oil by quite a bit.
And any fool knows that when you reduce the sale of a commodity good, except by withholding it from the market via a monopoly or cartel, the price of it falls. Nobody knows yet how far the price of oil will fall, EVERYTHING ELSE HELD EQUAL, but the price WILL fall quite a long way , in my personal opinion, from what it would OTHERWISE be, absent electric vehicles, a few years down the road.
That will mean the diesel fuel I use to grow YOUR food will be cheaper, and since my industry is a VICIOUSLY competitive industry, every dime I save as a producer, long term, is passed on as a saving to you, as a consumer.
My personal guess, for what it is worth, is that EVERY DIME we spend NOW on subsidizing renewable energy, electric vehicles, energy efficiency, conservation of energy and materials, etc, will return us a HANDSOME profit, over the next few decades, by way of depressing the price of fossil fuels and other depleting resources such as iron, aluminum, phosphate rock, a hundred more………
I will be VERY grateful , and thanks in advance, if any forum member runs across any QUANTITATIVE data, produced by economists, about the effects of renewable energy on the price of fossil fuels, OTHER r than just current stuff about the price of electricity falling to zero at times because wind and or solar power are subsidized using current day schemes. (These schemes will HAVE to be modified to take into account the higher rates fossil fuel operators will HAVE TO HAVE in order to STAY IN BUSINESS, short to medium term, because we sure as hell aren’t going all renewable on electricity in less than a couple of generations.
The subsidy question IS one that really does have two equally defensible sides, depending on the good or service in question.
A little political nuance is in order.
So called conservatives are generally big supporters of free markets, and most of them, the working type, are sincere in their beliefs and support for the concept.
But the rich ones are mostly just a bunch of damned old hypocrites, who are VERY glad for any and every obstacle the government throws in the path of any new competitor, or any product that might displace their own product.
And REAL conservatives, meaning ones who are INTELLECTUALLY HONEST, rather than partisan liars and hypocrites, who happen to have a certain minimum level of understanding of the actual workings of the economy, and of the BIG PICTURE , understand VERY well that government interventions into the economy are absolutely necessary to prevent totally hard core free market types from fucking up the environment , and damned near everything else as well, beyond any hope of fixing it.
I’m such a conservative , and possess a sufficient knowledge of the physical sciences, and of the economy, to understand that WE NEED the EPA, etc, and that only a fool would disregard the precautionary principle when it comes to such super heavy weight issues as the climate .
Unfortunately the typical man or woman on the street, redneck Republican, or nose in the air holier than thou big D Democrat , lol, doesn’t really know doo doo from apple butter about physical realities. Only very minor fraction of the people of this country know enough basic science to understand why you can’t use water as fuel.
You really can get a doctorate in dozens of important fields without ever taking even ONE real course in just ONE hard science. Millions of people have done so, and many thousands more do so every year.
Anybody who doesn’t believe me, say so , and I will post links proving it. The average economist, political scientist, lawyer, accountant, etc, probably doesn’t know as much real science as an average high school educated working farmer, who has to learn SOME science in order to stay in business.
OK, you wanted to know. I’m not going to dig up the quantitative data, because it’s *expensive* to get access to the minute-by-minute power market bidding data. But it does exist and others have analyzed.
There’s something you seem to have missed about the power markets. We’re talking about the ones with minute-to-minute pricing markets here; not all places have these.
Solar and wind power will continue to cause the minute-by-minute wholesale price of power to drop to zero intermittently, *without* subsidies. The reason is fundamentally very simple: solar and wind power are 100% capital cost, 0% operating cost. With 0 operating cost, they lose nothing by bidding their energy in at 0 price. If they can bid slightly above that, they make an incremental profit.
Once they’re built, whenever they are producing, solar, wind, and hydro (all with near-zero operating cost) will always underbid any non-solar competitors in the minute-to-minute market.
If the grid operator has merit-order dispatching, they’ll buy the cheapest electricity, which will always be solar, wind, and hydro, up to its capacity; then they’ll buy more expensive fossil electricity until they fully meet (projected) demand. Due to the way the bidding works, the solar, wind, and hydro will bid *just under* the cheapest of the fossil fuel plants.
When there is a surplus of energy — such as at high noon with lots of fossil fuel plants still operating — this drives the price to just above zero (as it should when there’s a surplus). When there isn’t a surplus, it doesn’t go to zero.
The subsidies allow some solar and wind plants to bid *below* zero, which has been happening in subsidized markets; they can bid down to just above the negative of the value of the subsidies and still make money.
Obviously more stable pricing can be gained in long-term contracts. Solar and wind farms can afford to make any long term contract above their LCOE. With near-zero operating costs, and capital costs known in advance, if you have a long-term contract the solar farm becomes an *extremely* safe investment — almost as safe as T-bills. This means that equity investors don’t demand particularly high rates of return on it (and remember, the rate of return is known the day the farm is finished if the Power Purchase agreement is signed). Likewise, bond investors don’t ask for particularly high rates of return either (comparable to mortgage rates — but less risky!).
So what’s the effect of the long-term contracts on fossil fuels? Well, the buyers will obviously buy PPAs with absolutely rock-solid pricing from a solar farm in preference to unstable fossil-fuel electricity prices — they’ll pay a premium for the stability. In actual fact the solar PPAs are starting to come in *below the cost of fuel* for the fossil fuel plants.
Solar and wind farms are already cheaper LCOE than new fossil fuel plants, so new fossil fuel plants are not being built at *all* in open-market or maximize-ROI situations — they are only being built only by “guaranteed rate of return” utilities who can pawn the costs off on their customers (and particularly wasteful and stupid utilities at that).
So basically the fuel-for-electricity market is a dead business walking, it’s just taking a long time to die. As more solar and wind is installed with geographic distribution, the chances of a “wind is blowing nowhere and sun is shining nowhere” event drops. But something has to be done about windless nights, and about short peaks in demand. Hydro with storage is obvious. Batteries are already being installed as well, and the financials of that are really seriously complicated and deserve their own comment — the key point is that batteries *respond faster* than peaker plants and are already cheaper than operating peakers for frequency regulation and peaker operation, so they’ll drive peakers out of business quickly. Nighttime remains an issue, and will do so until batteries are cheaper.
OK. So now one more important point. As solar and wind penetration gets higher, it becomes more common for there to be serious overproduction on the grid. Solar and wind which don’t have steady PPAs — the ones bidding into the spot market — have to figure this into their financial plans. Which they do, and most systems now are actually overbuilt with more noontime production than they can run through the inverters. And they’ve got a lot of leeway in their financial plans. Since the financial plans are typically made for 20 years but the solar panels last for 40+ years, if they have more “overcapacity moments” than they expected, they probably still make money. So they build them anyway, and they are building them anyway.
But there’s a second option they have, which is to store the excess, and so small amounts of batteries are now being built as part of a lot of large solar farms. This catches the noon excess of solar — which they were previously *intentionally wasting*, remember, and still making money (think of it like flaring natgas) — and they can then feed the battery power into the grid whenever power is most expensive, potentially making very large incremental returns. Smashing the after-dark peaks with battery power is a bit of an untested model financially, but the batteries are cheap enough that many people think it’ll be profitable.
Now, batteries are destroying the economics of peaker plants. But solar and wind are destroying the economics of “baseload” plants. If solar and wind are pumping out lots most of the time, then baseload becomes useless. Nuclear power plants, which typically *can’t ramp down*, have sometimes had to bid negative prices — pay — to keep their power going out even when there’s plenty of solar and wind. Fossil plants can almost always ramp down or “spin free”, so they never bid below their variable costs.
You’re wondering what all this does to “fossil fuel prices”. Well, it’s destroyed the coal market and caused coal prices to go into permanent decline. This can be seen perfectly obviously in headlines around the world on Bloomberg and other news sites.
It’s done nothing to oil prices because oil isn’t generally used to generate electricity. *Anything* is cheaper and this has been true since the 1970s. The few islands still using oil to generate electricity are building solar and batteries ASAP even at prices which are really too high for the mainland to adopt.
The effect on natural gas prices is truly complicated because the natural gas market is very complicated compared to the coal or oil markets.
Coal is produced intentionally and used for two things: steelmaking and power generation. Which use two different sorts of coal. This is simple.
Oil is produced intentionally and used primarily for one thing: transportation fuel — everything else from the distilattion column is a byproduct sold for “whatever you can get for it” (nobody builds a refinery just to make asphalt or butane), and the other uses of products which use the same fraction as gasoline & diesel (for heating or electricity generatino) are miniscule in volume.
Natural gas is produced mostly as a side effect of oil production, though some of it is produced intentionally, and some of it is biogas, and it’s used for heating, industrial processes, and electricity generation. And it’s very hard to transport overseas so the markets are more local. *WAY* more complicated market. The worsening of oil wells, with the GOR going up, and the very high GOR of fracked wells, along with the craze for gas fracking which was caused by very high natgas prices a few years ago, has caused a long-running glut in US natgas. This has made it cheap which has driven it into much heavier use for electricity generation. If its price goes up, it will largely disappear from electricity generation in favor of new solar and wind farms, which will of course bring the price back down. There is also a price at which it becomes cheaper to heat with electricity, which will of course bring the price back down. I think it can’t stay above $6 for long without demand destruction in the heating sector. Fracking for gas isn’t viable below $4, but gas as a side effect will probably keep pushing supply up, so it could drop back below that due to oil production with very high GOR.
The Railroad Act allowed for westward expansion, Jay Gould had all kinds of Union Pacific stock.
Analogous to today’s transportation advances, comparable.
The Guano Act was about the same. W. R. Grace did the job of moving goods down and around the southern Atlantic.
The energy provided was from Coolies being fed maggot infested rice.
Oil has eliminated a lot of dreaded drudgery.
I don’t know if this has been posted here. It’s from November.
How to deal with worries about stranded assets | The Economist: “BlackRock, a big asset manager, estimates that more than 500 investment firms, with assets of $3.4trn under management, have pledged to divest from fossil-fuel companies.”
Let me know when the people at those investment firms actually stop using fossil fuels.
Probably they already have, except for airplanes. They’re rich, y’know. It’s perfectly straightforward to stop using fossil fuels (except for airplanes), the only issue has been the price.
And it’s now cheaper in most climates to use renewables — if you have the capital to pay the upfront costs. Which these guys do.
A tricky time for oil producers | The Economist: “… Royal Dutch Shell, the Anglo-Dutch supermajor, pulled out of the Arctic because drilling there would be too expensive. Its French counterpart, Total, is unwilling to invest more in Canada’s oil sands, for similar reasons. But they are also aware that if demand goes into long-term decline, those with the cheapest oil will survive longest. Simon Henry, Shell’s chief financial officer, says the company expects a peak in oil demand within the next 5-15 years. It intends to concentrate on what it sees as the cheapest deepwater reserves in places like Brazil where investments can be recouped within that time frame. It may also cut oil exploration. Total, too, is hoping to find low-cost oil. It has bought a small stake in a 40-year oil concession near Abu Dhabi, in the expectation that Gulf oil will always be cheap.”
Total is probably the smartest here.
Shell’s strategy is OK but it has a very tight timeframe; they have to get the money and run.
Total is going for the ultra-cheap oil in hopes of being the last survivor. Notably, Total is also the only oil company with a significant investment in renewables (as the majority owner of SunPower).
Outlook 2017: North Sea oil industry – London (Platts)–4 Jan 2017
A mini-revival in production in the last two years has helped keep hopes alive, with oil output running at nearly 1 million b/d — still a third of 1999 levels.
But while output has nudged up, and operating companies have largely kept bankruptcy at bay, investment has plummeted since oil prices crashed in mid-2014. Lobby group Oil and Gas UK thinks investment in the UK upstream sector will have dropped by 40% in 2016 to GBP 9 billion ($11 billion).
That suggests that despite an expected boost from projects begun before 2014 — including BP’s redevelopment of two west of Shetland fields, Clair and Schiehallion — production decline could soon return with a vengeance.
The International Energy Agency expects UK oil production to resume declining in 2017. North Sea consultancy Hannon Westwood says oil and gas output could soon be falling at rates of 11% per year.
http://www.platts.com/latest-news/oil/london/outlook-2017-north-sea-oil-industry-hopes-gradually-26631429
Geez, 11% per year. If that happens globally it’ll mess up my projections of terminal oil price decline, which is based on the steady-state decline rates of 6% – 9% per year. We could get one serious oil price spike before the terminal decline.
I’ve been trying to figure out whether there’s one more up cycle or whether we’re already in the last drop in prices. It’s too hard to tell. I’m pretty sure those are the only two possible cases.
Excerpts from:
U.S. Geological Survey Assessment of Reserve Growth Outside of the United States
December, 2015
https://pubs.er.usgs.gov/publication/sir20155091
The U.S. Geological Survey estimated volumes of technically recoverable, conventional petroleum resources resulting from reserve growth for discovered fields outside the United States that have reported in-place oil and gas volumes of 500 million barrels of oil equivalent or greater. The mean volumes of reserve growth were estimated at 665 billion barrels of crude oil; 1,429 trillion cubic feet of natural gas; and 16 billion barrels of natural gas liquids. These volumes constitute a significant portion of the world’s oil and gas resources and represent the potential future growth of current global reserves over time based on better assessment methodology, new technologies, and greater understanding of reservoirs.
The recently developed USGS method to assess reserve growth was used to estimate technically recoverable crude oil and natural gas volumes that have the potential to be added to reserves in discovered conventional accumulations under proven technology currently in practice within the trend or play, or which can reasonably be extrapolated from geologically similar trends or plays. These estimates do not assume or include estimates based on the application of speculative future technologies. The assessment methodology estimates future potential additions to reserves using current technology, but not necessarily current economics. No time period was assumed for the estimated reserve growth volumes in this report to take place.
Identified unconventional (continuous) oil and gas accumulations, such as shale gas, tight gas, tight oil, and tar sands, were excluded from this assessment of reserve growth. The USGS assesses unconventional, technically recoverable oil and gas resources using a methodology that is different from that used to assess conventional resources.
Definition of Reserve Growth
Reserve growth is the increase in estimated volumes of oil and natural gas that might be recovered from existing fields and reservoirs through time. Most reserve growth results from delineation of new reservoirs, field extensions, or enhanced recovery techniques that improve efficiency; or from recalculation of reserves due to changing economic and operating conditions. Many accumulations show no growth of reserves and many reserve volumes shrink, however. The term “reserve growth” as used here, is synonymous with “growth-to-known,” “reserve appreciation,” “ultimate recovery appre¬ciation,” “field growth,” or “reservoir growth,” among others.
Reserve growth is defined as increases in successive estimates of recoverable quantities of crude oil, natural gas, and natural gas liquids in discovered conventional accumulations. Reserve growth can be grouped into three activities:
(1) delineation of additional in-place petroleum volumes, which increases the degree of geologic assurance (for example, infill drilling; new reservoirs, pools, or pay zones; extensions);
(2) improved recovery efficiency, which increases the degree of technological feasibility (for example, enhanced recovery, well stimulation, recompletions, new completions of bypassed zones); and
(3) revisions resulting from recalculation of viable reserves in dynamically changing economic, operating, and regulatory/political conditions, which increases the degree of economic feasibility (for example, reevalution of production performance, more efficient operations)
Crude Oil Endowment Outside of the United States: – 3,300 BBO
Excluding cumulative production: 2,500 BBO
Comment:
Production from mature fields is supported not only by infill drilling which “just accelerates production while adding very few incremental barrels”, but also thanks to development of “new reservoirs, pools, or pay zones; extensions” and “improved recovery efficiency ((for example, enhanced recovery, well stimulation, recompletions, new completions of bypassed zones)”.
This can add significant volumes of incremental barrels.
Large part of reserve additions in the past several years was due to additions in discovered fields rather than new discoveries.
“improved recovery efficiency” is just doing well stripping earlier than usual, so basically accelerates production while adding no incremental barrels.
“New reservoirs, pools, or pay zones; extensions” are actually additional barrels.
“American producers can achieve 800,000 barrels a day of annual production growth at a price of $55 a barrel for benchmark West Texas Intermediate crude, “with limited outspend of cash flow and declining leverage,” the bank said.”
https://www.bloomberg.com/news/articles/2016-12-12/goldman-says-saudis-wrong-to-rule-out-u-s-shale-oil-renaissance
What perculiar game. OPEC cuts- price goes up, USA increases- price goes down. Or maybe Gold-in-sacks is just pumping their investment.
More on investment strategies.
Trump May Not Like Alternative Energy, but Investors Should – The New York Times
Notice from that article: in Idaho the IRR on a home solar array is 6%. This is a very big deal.
(It’s still lower than that in NY, so I’m waiting a bit longer…)
Weak Federal Powers Could Limit Trump’s Climate-Policy Rollback – The New York Times: “On a global scale, more than half the investment in new electricity generation is going into renewable energy. That is more than $300 billion a year, a sign of how powerful the momentum has become.”
“The intrinsically weak federal role was a source of frustration for Mr. Obama and his aides, but now it will work to the benefit of environmental advocates. They have already persuaded more than half the states to adopt mandates on renewable energy. Efforts to roll those back have largely failed, with the latest development coming only last week, when Gov. John Kasich of Ohio, a Republican, vetoed a rollback bill.”
“If Mr. Trump pushes for an early end to the subsidies, he will find that renewable energy has friends in the Republican Party. Topping that list is Charles E. Grassley, the senior senator from Iowa. That state — all-important in presidential politics, let us remember — will soon be getting 40 percent of its electricity from wind power.”