All OPEC data below is from the February edition of the OPEC Monthly Oil Market Report. The data thousand barrels per day and is through January 2020. OPEC Monthly Oil Marker Report
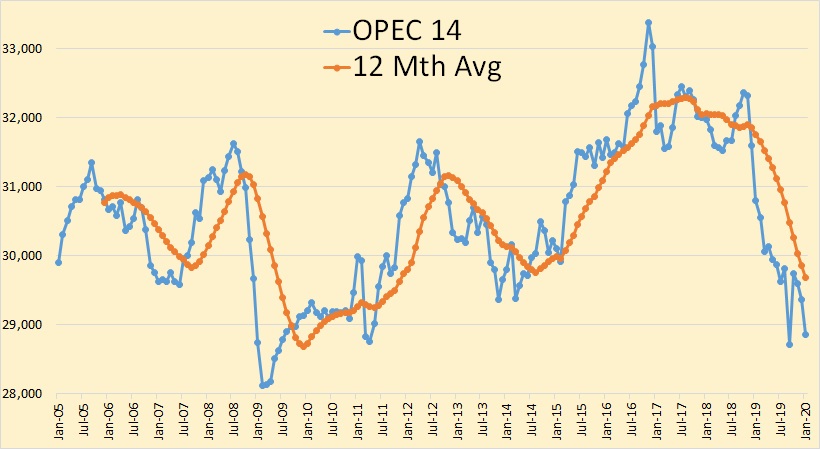
OPEC 14 crude oil production was down 509,000 barrels per day in January. And that was after December production was revised down 86,000 barrels per day.
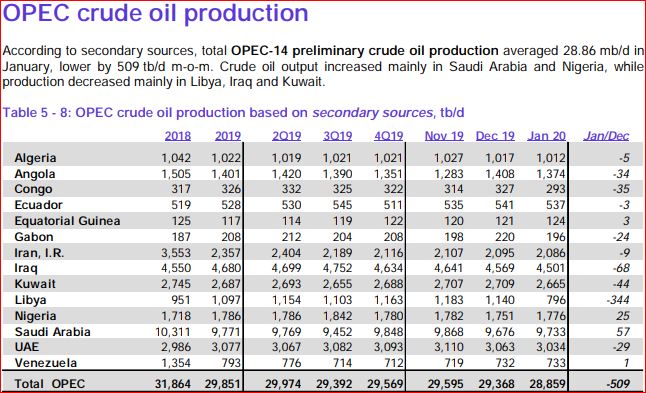
OPEC announced a couple of months ago that Ecuador was leaving the cartel. However they were still included in January’s data. I have no idea what’s going on.
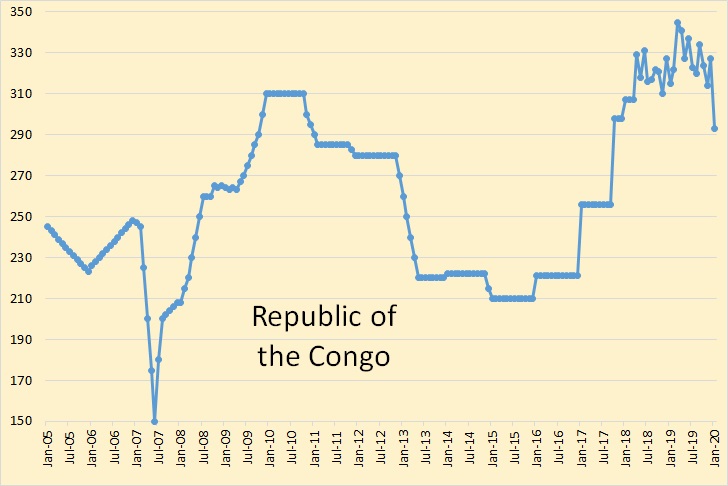
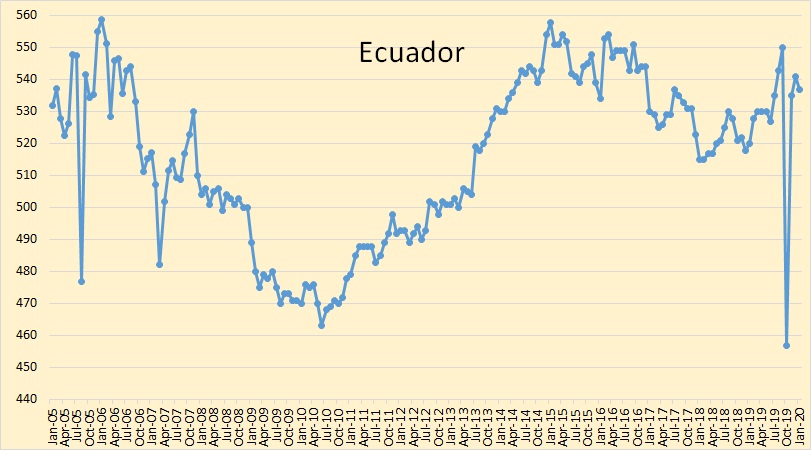
Ecuador appears to still be with OPEC even though it was announced that they were leaving this month.
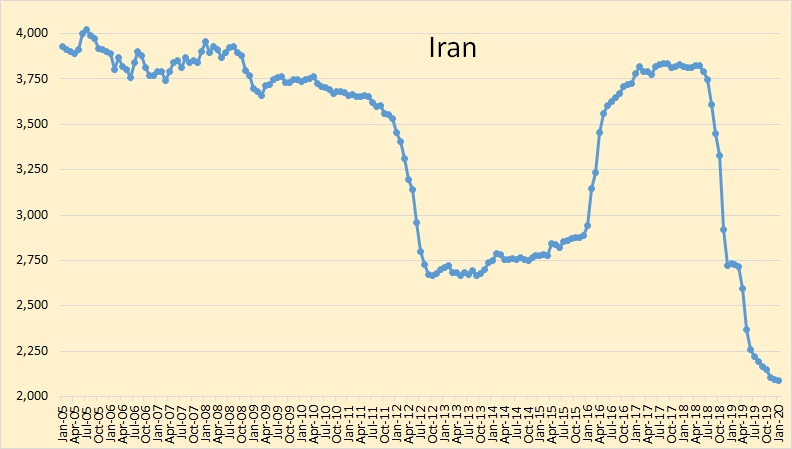
Iran appears to be leveling out at just over 2,000,000 barrels per day.
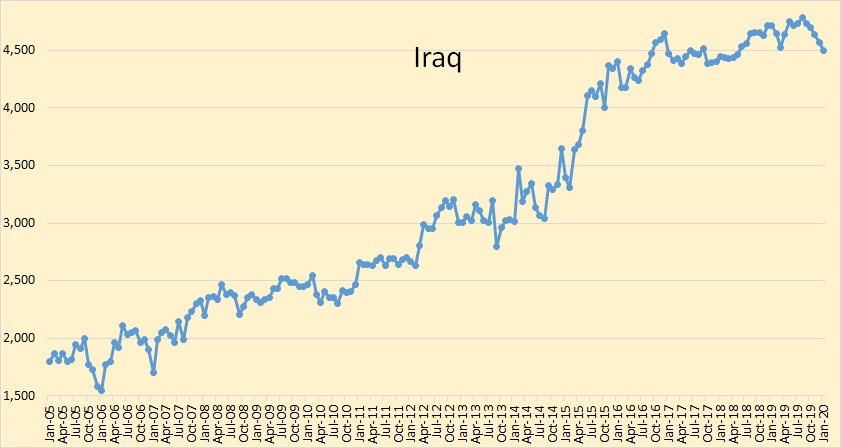
Iraq is at 4.5 million barrels per day. They have averaged 4.56 million barrels per day since the last quarter of 2016. It is my opinion that they are, and have have been, producing flat out for many years.
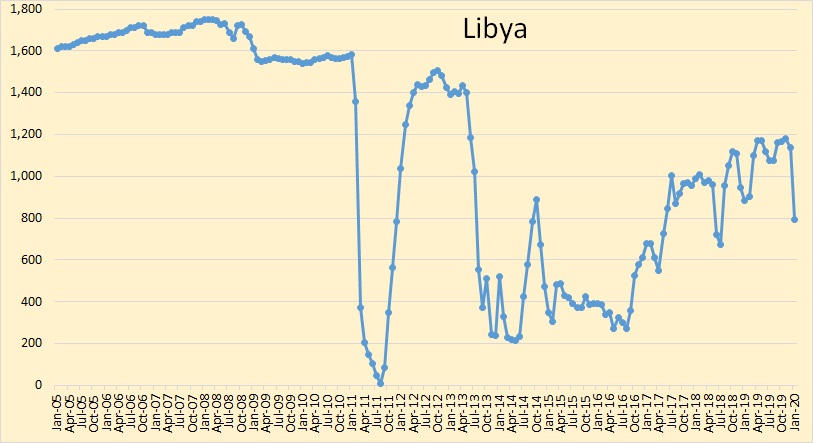
Libya’s production for the last ten days or so of January was only 200,000 barrels per day as the rebels blockaded their main port. The blockade is now in its fourth week so we can expect Libyan production to drop even further in February.
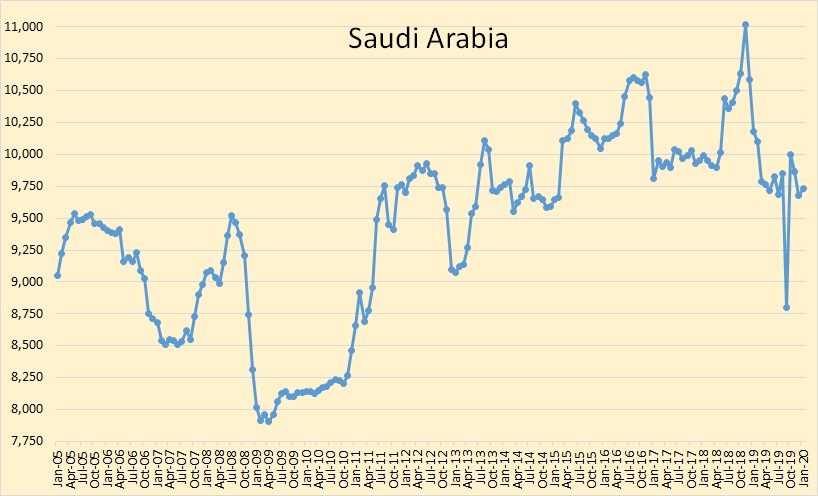
Saudi Arabia’s production was up 57,000 barrels per day in January but that was after their December production had been revised down by 86,000 barrels per day. They are now producing 578,000 barrels per day below their quota.
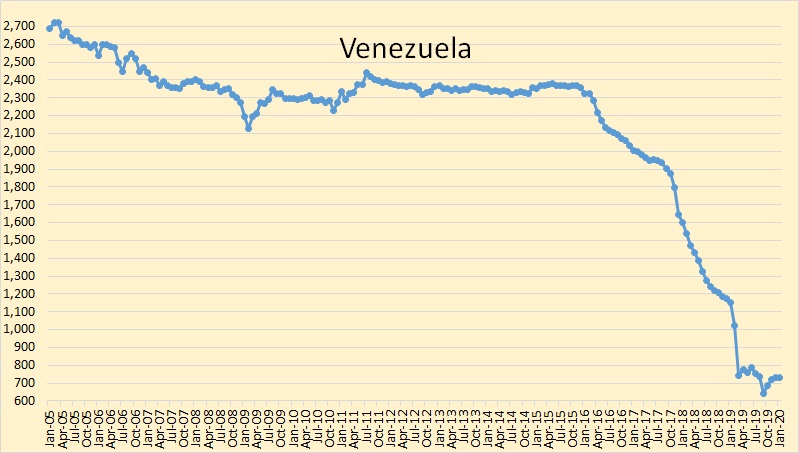
Venezuela’s decline seems to have stopped. They are looking for international help to increase production. Their history of confiscating foreign equipment and paying them pennies on the dollar for it is hindering that effort. But Russia may be able to help as they play by different rules.
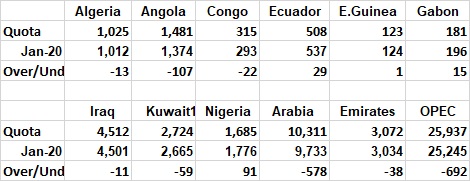
Iraq has finally met its quota. Angola wishes they could meet it. Libya, Iran, and Venezuela are exempt from quotas.
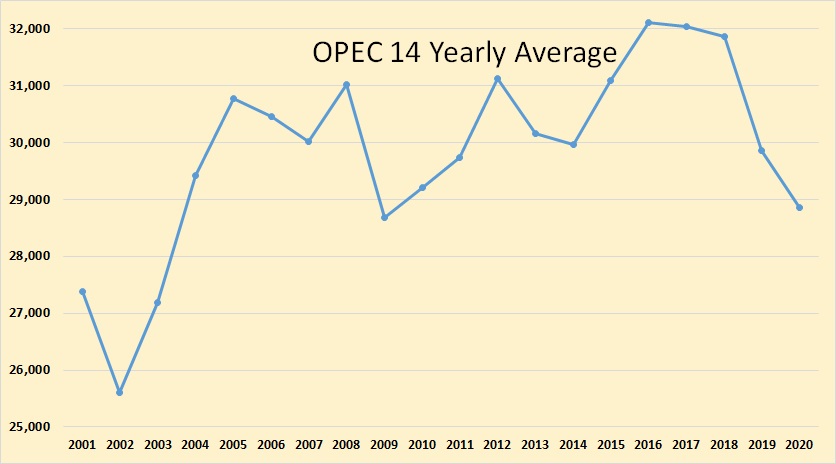
OPEC 14 Yearly average. The 2020 figure is only for one month. If that holds they will be below their 2004 annual average.
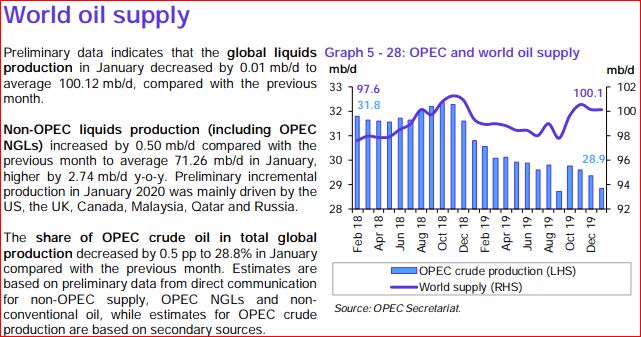
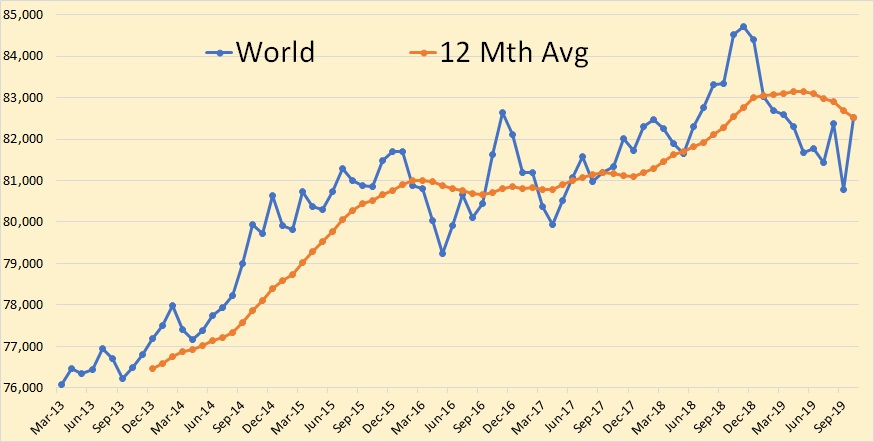
Their world oil supply graph is total liquids. It hardly resembles the C+C chart below. However, they still have the peak in late 2018.
The EIA has redesigned its International Energy Portal to streamline navigation, simplify data presentation, and implement responsive design use, or so they say. EIA World Crude Oil Data They show data for every producing nation, even the very small ones. They do not separate OPEC from Non-OPEC.
The Case For Peak Oil
When world oil production peaks depends on when the combine production of the world’s top three producers peaks, the USA, Russia and Saudi Arabia. In fact, it could depend on when the USA peaks because shale production has been perhaps the primary reason the world has not already peaked.
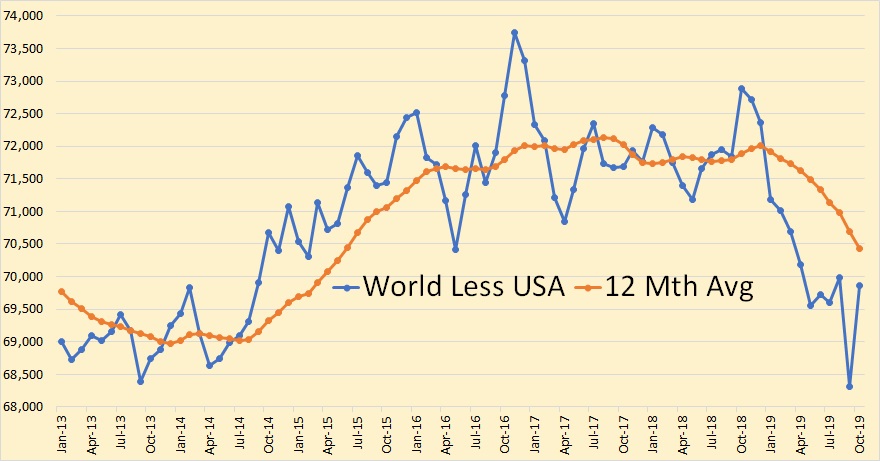
World C+C oil production, less USA production 12-month average, peaked, so far, in August 2017 at 72,134,000 barrels per day.
Okay, but what does World C+C production look like less all of the big three, USA, Russia and Saudi Arabia?
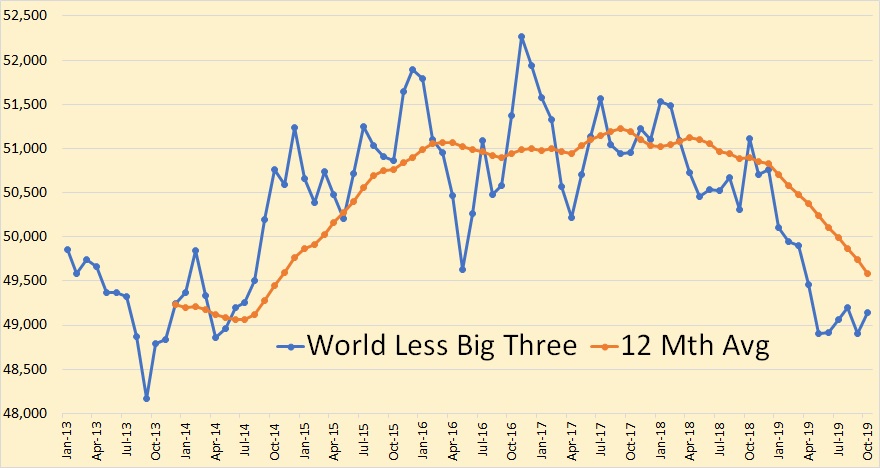
World less USA, Russia, and Saudi Arabia, 12-month average, peaked in September 2017 at 51,222,000 barrels per day and was down 400,000 bpd by December 2018 before the OPEC cuts. Obviously every nation other than the big three have not peaked, but cumulatively they have peaked.
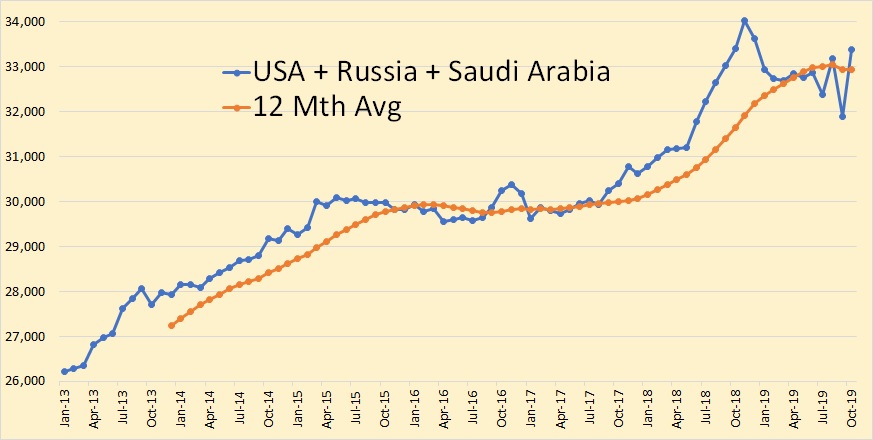
Here is the production data of the big three through October 2019.
Let’s deal with all three, first Russia.
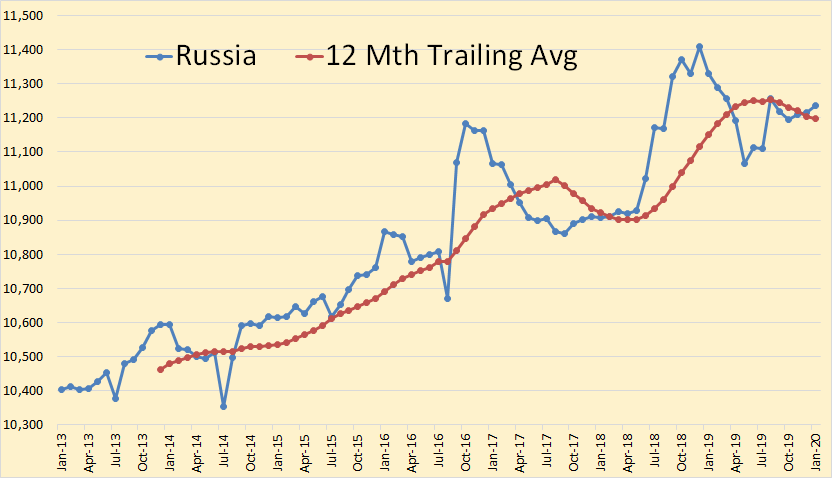
Russian production was up 20,000 bpd in January. They have stated that they hope to hold at this level through 2023. However they are obviously lobbying for lower taxes on profits. The Russian Minister of Energy has stated:
If current production trends continue, and if Russia doesn’t do anything to further stimulate oil exploration and new field development, after 2021, production may start to fall and reach just 310 million tons by 2035, that is, Russia’s oil production could drop by 44 percent by then, Novak said back then.
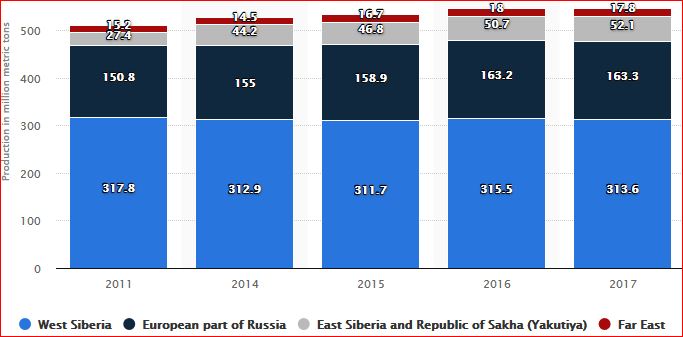
Almost 60% of current Russian oil production comes from their aging super-giants in Western Siberia. From Statista.
But how has Russia been able to keep their old Western Siberian fields from decline? We get a hint from this Russian Analyst back in 2009. Alex Burgansky: Russian Oil and Gas Industry Surprises Analysts
There are plenty of projects in Russia, both, new projects and existing brownfield projects. Russia is a very mature producer. If you exclude all the drilling activity taking place every year, then Russian organic decline in production is close to 19%. To compensate for that organic decline, Russia drills somewhere between 5,000 and 6,000 wells every year.
Many of those wells, perhaps most, are what they refer to as “existing brownfield projects”. That is infill drilling with horizontal wells in their old Western Siberia giants. They are in decline but all that infill drilling has dramatically slowed their decline rate.
In fact: Russia makes its oil reserves work harder as output declines
Such technological solutions as increased share of horizontal drilling, multistage hydraulic fracturing and multi-hole drilling have allowed Rosneft, Russia’s top crude producer, to slow the decline at Samotlor to 1 percent last year. The oilfield dates back to 1965 and is one of the largest in the world.
Last year, in the above article, was 2018. They have gotten the decline rate for their very old super-giant down to 1% per year. Of course, the depletion rate has not declined at all.
Below: Russia through January 2020 and projected through December 2021
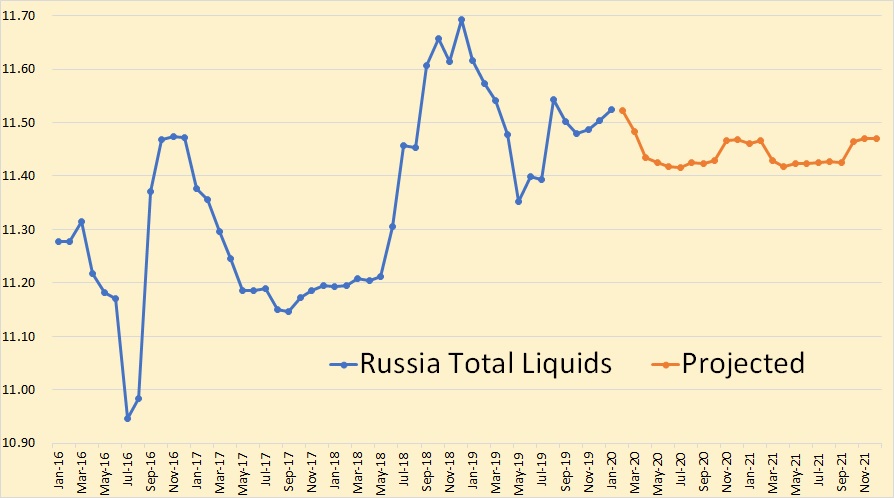
Russia total liquids according to the EIA Short Term Energy Outlook. Russia has much as having said they have peaked and it seems the EIA agrees.
I will not dwell on USA decline because we cover that almost every day here on Peak Oil Barrel. But most of us agree the peak could very well be this year, or in two or three years at the latest. At any rate, it appears that the dramatic growth in USA oil production is a thing of the past. The next few years will, very likely, see a plateau at best and an almost sure decline soon.
Then there is Saudi Arabia. I posted the Saudi production chart up top and will not re-post it here. However, I will point out a few very obvious things concerning Saudi Arabia and especially the largest field ever discovered, Ghawar.
From Bloomberg in April 2019: The Biggest Saudi Oil Field Is Fading Faster Than Anyone Guessed
When Saudi Aramco on Monday published its first-ever profit figures since its nationalization nearly 40 years ago, it also lifted the veil of secrecy around its mega oil fields. The company’s bond prospectus revealed that Ghawar is able to pump a maximum of 3.8 million barrels a day — well below the more than 5 million that had become conventional wisdom in the market.
Euan Mearns posted in The Oil Drum: Europe in April 2007, the following graph and data.
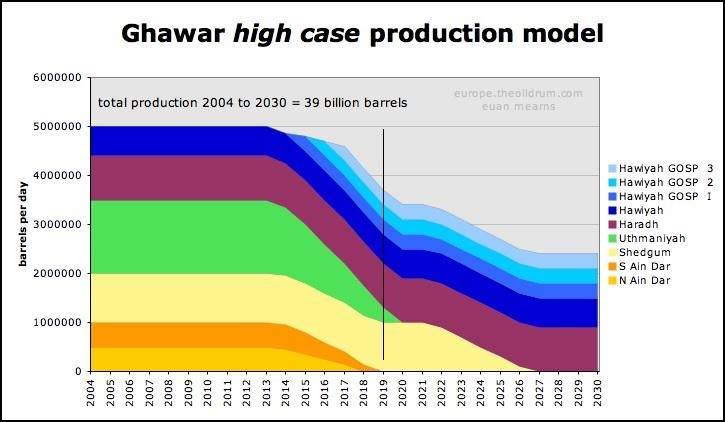
Notice where the 2019 line dissects Euan’s high case prediction, at exactly 3.8 million barrels per day. Yes, he had a base case that was a bit more pessimistic.
2002 was the last year any reserve figures came out of Saudi Arabia. Euan took those figures and projected them to 2006. What would they look like in 2020? Note: That data was not published by ARAMCO but by the Society Of Petroleum Engineers. Apparently they got their data from engineers who worked for ARAMCO before their total data shutdown. I do not have access to that data but apparently Euan did.
I am convinced that all the recent decline in Saudi production is not deliberate cuts. Some maybe, but definitely not all. They had a reason for issuing that ARAMCO IPO.
What is meant by the term “natural decline rate?
I, and others, have used the term “natural decline rate”. Exactly what is “a natural decline rate”? And what did ARAMCO mean when they used the term?
Without “maintain potential” drilling to make up for production, Saudi oil fields would have a natural decline rate of a hypothetical 8%. As Saudi Aramco has an extensive drilling program with a budget running in the billions of dollars, this decline is mitigated to a number close to 2%.
For starters, it depends on the size of the field and how long that field has been in production. A very small field will reach peak production and start to decline almost immediately. Even a giant field like Prudhoe Bay or Cantrell would begin to decline within a few years after peaking. But a supergiant field may produce for decades before production begins to decline. However, once a field begins to decline, then the decline rate should match the depletion rate. That would be the natural decline rate.
But if a country notices, after many years of level production, that their supergiant fields have begun to decline, that would likely be because the rising water table is rising to a higher level on their vertical wells. That country could counter that problem by shutting off its vertical wells and drilling new horizontal wells that pull only from the very top of the reservoir. They could then dramatically reduce their decline rate. But that would not help their depletion rate a damn bit.
If the depletion rate is far greater than the decline rate, then what must happen is not a theory, it is a hard-cold mathematical fact. The decline rate must, at some point, dramatically increase. The decline rate would look very much like a Seneca Cliff.
Note: A Seneca Cliff decline is experienced by fields, not countries. It is extremely unlikely that any very large producing country would experience a Seneca Cliff type decline.
What is happening right now in Ain Dar, Shedgum, and Uthmaniyah can accurately be called a Seneca Cliff. And since Rusia has gotten Samotlor’s decline rate down to 1% by creaming the top of the reservoir, we can expect a Seneca Cliff there in the near future, if it has not already begun.
Saudi Arabia likely already in decline, Russia likely at a peak plateau, the USA very near its peak, and the rest of the world is, cumulatively, post-peak. Is the world at, or near, peak oil? Or, can the USA continue to increase production enough to overcome the decline in the rest of the world? What would you conclude?
285 responses to “OPEC January Production Data”
Export Land Model coming into play now?
Getting interesting. Finally?
Hi Ron
Great work as usual
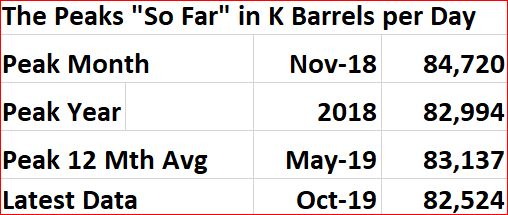
It would seem Nov 2018 is more and more likely as global peak. Coronavirus and sub $50 oil are going to reduce demand as well as reduce upstream investment. And then there is finance.
Nate, good to hear from you. I hope you become a regular. But yes, Coronavirus is going to throw a monkey wrench into everything, not just reduced demand and upstream investment but the entire world economy.
All hell could break loose.
Ron
Despite society being more energy blind than a decade ago I expect purgatory, not hell (unless nukes). We’re in for rude awakening on many fronts. Though the path between fantasy and doom is a narrow one, it is a clear path, and hopefully more people will bushwhack etc to widen it…
/njh
I admire your optimism Nate. And if it were only peak oil, or only climate change, or only the Coronavirus, then I would agree with you. But it is all those things and at least a dozen other environmental disasters.
No, I shudder when I think of the future my children and grandchildren must suffer. The world is marching straight into disaster while singing “Don’t worry, be happy”.
Ah, yeah, Ron: that’s the typical feature of collapses. All the bad things gang up together and the result is the Seneca Cliff. It seems that we have a good chance now to see exactly that.
Jumping In, I thought one would see more reaction to the NDIC cheerleader Lynn Helms announcing to state legislators that the Bakken has peaked and or plateaued and gives it 2 to 5 years and its done.
“We can only grow production for another two to five years, and then all of the drilling activity that we anticipate is only gonna be able to hold that production at a plateau.
It’s not going to be able to grow beyond that,” said Department of Mineral Resources Director Lynn Helms.
Google search “legislators ask lynn helms about nd oil tax revenue”
Its a real fall off your chair moment. No more Pom Poms.
Nate,
Generally I would expect lower oil prices to increase demand, I would agree it would tend to reduce supply as production would be less profitable. Low oil prices will reduce output, eventually the coronavirus outbreak will be brought under control and the economic damage will be recovered from. As economic recovery occurs, oil prices are likely to rise, profits for oil producers will rise and output will rise as the profits are invested. Much will depend on the oil price level, but even in the very conservative EIA AEO 2020 reference oil price case. We could see US tight oil between the low and high cases shown in the chart below, depending on the completion rate chosen by tight oil producers in response to oil price increases.
Curious if anyone sees the problem with the AEO 2020 reference oil price case?
Wouldn’t we expect that the decline in tight oil output (which may coincide with decline in World oil output in 2026 or 2027) might cause oil prices to rise somewhat more steeply after that date as there is likely to be a market shortage of C+C at those price levels? Any guesses as to how much more steeply oil prices might rise? Increase by a factor of 1.5 or 2.5 from the 2020 to 2025 rate of increase, perhaps (annual increase of about $1.4/bo)? Note that in 2026 the oil price is about $66/bo at the wellhead for the AEO 2020 reference oil price scenario. Perhaps by 2035 (earliest likely in my opinion) a transition to more fuel efficient vehicles including hybrids, plugin hybrids and some BEVs might reduce demand enough so that oil prices rise more slowly (perhaps at the rate of increase of the AEO 2020 reference scenario), but from 2026 to 2035 I think a steeper rate of increase is more plausible.
Thoughts?
If demand remains constant, the price of any commodity, including oil, tends to follow the cost of marginal production. Of course, there is always the dynamic connection between price and demand, so prices cannot rise to match marginal costs, but it does give an indication of the upside potential for prices.
However, I have no idea about the cost of a marginal barrel after shale, deepwater or bitumen. Gas-to-liquids or coal-to-liquids perhaps? An additional confounding factor is whether carbon capture would be required for either of those sources.
Prices will rise only to the point where the economy suffers. Many commentors here dispute what that point might be, but as EROI keeps declining, it is certain that energy extraction will make up a larger and larger fraction of the economy.
Joe,
Not clear what you mean about demand being “constant”. Consumption of World C+C has increased at an average annual rate of about 800 kb/d over the 1982 to 2019 period. Perhaps you meant that the rate of increase in demand has been constant. When peak oil arrives in the next 2 to 10 years (2022 to 2030), demand will need to stop increasing.
Note that price is equal to marginal cost only in a Walrasian perfectly competitive economy that only exists in textbooks. In a World where a cartel limits supply, that rule no longer applies.
I should have said “where demand does not decline”. If there is relative demand decline (demand remains below existing productive capacity) for whatever reason, the marginal cost of a commodity’s production becomes irrelevant. That’s because there is no incentive to increase production by adding marginal capacity.
As to the cartel issue: even if a cartel artificially reduces supply, the increase in price will eventually stabilize near the marginal cost of production (that is, if there is anything to produce elsewhere ex-cartel). Besides, if the cartel you are referencing is OPEC+, they are still pretty near their maximum productive capacity even with recent cuts.
And soon, everyone in the world will be producing flat out and looking for more. That is when the cost of the marginal barrel will really come into play. I expect that the limiting price on liquid fuels will be the cost of coal-to-liquids.
The world has lots of coal. When oil prices start rising as oil producers “scrape the bottom of the barrel”, I expect there will be massive construction of coal-to-liquids plants all over the world. Of course, that will be devastating for the climate, so I’m hoping industrial civilization collapses for other reasons well before that happens. Maybe the Holocene will be saved by the coronavirus or something like it.
“massive construction of coal-to-liquids plants ”
I don’t think this this will happen on a grand scale. It is too expensive, and much less viable than electricity for transportation.
If the coal is needed for energy, it will more likely just be burnt raw like it is currently.
People (Japan) have spent considerable brainpower trying to make the process of in-situ coal gamification work- that being the direct underground conversion. Thus far, the process is far too expensive from an energy standpoint, to be worth the effort.
Coal to liquids is coming alright. From about $120/bll.
120 $/b too expensive, not for the U.S and some other developed countries, but for most of the countries yes
If it can be produced at $120/barrel, then coal liquid fuel will fail in the marketplace due its transportation fuel competition- that being both crude oil product and electricity. Electricity for PHEV/EV is much cheaper than any liquid fuel at $120/barrel.
Straight up. If that isn’t clear to a person, they just haven’t been keeping up with energy industry innovations.
For example, note
-An average EV sedan will utilize 4,200 kWh/yr to drive 14,600 miles. At national average grid price in the USA (11 cents/kWh) that is total of $462 of electrical energy/yr.
-Gasoline would have to cost less than 95 cents/gallon to be a better deal than average electricity rates in this country to beat the EV energy cost. [assumes an ICE sedan would get 30 mpg] Coal to liquids for transport just won’t be able to compete in the marketplace.
Nate, just in case you read this, thank you for all the wonderful lectures.
I watch your updated Earth day lecture every year, and use your video series from Reality 101 to launch conversations with friends and family.
Sincerely, thank you.
+1
Hi Ron,
When I think of the Seneca effect or Seneca Cliff, the work of Ugo Bardi comes to mind.
https://cassandralegacy.blogspot.com/2011/08/seneca-effect-origins-of-collapse.html
In Bardi’s use of the term he is talking about World oil production. I have no doubt that individual oil fields might decline very rapidly in some cases, so we agree that is possible and fields such as Canterell have experienced rapid decline. Often these fields have ramped up very quickly as well.
As far as depletion rate and decline rate being the same, if we assume 71.2 Mb/d for conventional C+C world output in 2019, and 1265 Gb of remaining conventional C+C reserves, a decline rate of about 2.1% would result in a depletion rate that is approximately the same as the decline rate. This assumes no future oil discoveries or reserve growth and uses Jean Laherrere’s 2600 Gb URR estimate for conventional C+C.
If the decline rate were 8% (equal to your assumed natural decline rate), the depletion rate would decrease from 2.1% in 2019 to 0.46% in 2040.
In general the depletion rate and decline rate are different. However if they are approximately equal they will remain about the same over time, this is probably what you meant. This only holds if we assume URR remains fixed at some known value. Generally since 1998 World URR C+C estimates have been rising, we do not know what the URR will be, my guess is a bit higher than Mr. Laherrere’s (2800 Gb) for conventional resources, but in this analysis I have used the lower 2600 Gb estimate recently published by Laherrere in 2018.
As far as depletion rate and decline rate being the same, if we assume 71.2 Mb/d for conventional C+C………
No, no, no. I never made any argument whatsoever about world decline rate and world depletion rate. I specifically stated: Note: A Seneca Cliff decline is experienced by fields, not countries. It is extremely unlikely that any very large producing country would experience a Seneca Cliff type decline.
The natural decline rate of a field should match the depletion rate of that field once that field has begun to decline. Also, only the northernmost three fields of Ghawar are in decline. The lower two fields are not in decline at all.
And I stated it only applies to specific fields once they have begun to decline.
If the decline rate were 8% (equal to your assumed natural decline rate), the depletion rate would decrease from 2.1% in 2019 to 0.46% in 2040.
I made no such assumption whatsoever. Saudi said their fields had a hypothetical decline rate of 8%. That is the very only place I used 8%. Saudi said, in a post about 15 years ago, that their fields had a decline rate of 5% to 12%. 8% was just their average.
Again, the natural decline rate of an individual field that is already in decline should match the depletion rate. That is my assertion. It has no application to the entire world whatsoever, not even to an entire country.
Anyway, let’s just forget about the Seneca Cliff and just call it an accelerated decline rate that must happen if the decline rate of an individual field has been kept artificially low for an extended period of time.
One more thing. I make no assumptions about world URR. I will leave that up to you and Jean Laherrere. I just look at production and decline and make all my production guesses from that.
I suppose we could simply assume the natural decline rate and depletion rate will be the same and when they are not, claim the decline rate is not a “natural” decline rate.
For those unclear on “depletion rate”, there are different denominators used by different authors. Ron uses depletion rate=output divided by remaining reserves.
See
https://royalsocietypublishing.org/doi/full/10.1098/rsta.2012.0448
Excerpt from above:
Conceptually, the depletion rate is the ratio of annual production to some estimate of recoverable resources, where the latter can be defined as 1P or 2P reserves, RRRs or the URR (see [26] or [27]). A lack of standardized use has resulted in several studies using depletion rates based on very different definitions of recoverable resources and this has added to the confusion surrounding the concept.
In practice, a depletion rate can refer to two possible things. First, it can relate to the rate of change of the depletion level at time t. Second, it could also refer to the rate at which RRRs are being produced. Unclear definitions have led to confusion surrounding this parameter. This study will differentiate these two definitions by denoting them as depletion rate of URR (URR depletion rate) and depletion rate of RRRs (RRR depletion rate), respectively.
Ron uses what Hook would call the RRR depletion rate. Just a clarification for those who are aware there are several definitions and much confusion about what is meant by the term “depletion rate”.
I don’t think there should be any confusion here other than the fact that you never know how much oil you have left in the ground. But that is the only place where there should be any uncertainty.
The “yearly” depletion rate of anything, whether it is oil in the ground or whiskey in a barrel, is the percentage of the remaining resources, whiskey or oil, that you pump out in one year.
So the depletion rate is the percentage of remaining reserves, that you think you have left, that you produce in one year. As to remaining reserves, you just have to make an educated guess.
That is my very simple definition. You may have a different definition.
But… If in your calculations of depletion rate, you somehow count barrels that you produced 40 years ago, then that makes no sense whatsoever. As for as useful information goes, you may as well be speaking Greek.
Ron,
Your definition is fine, my point is that there are different definitions that have been used by others.
One could use the full barrel of whiskey in the denominator rather than the amount that is left in the barrel. Colin Campbell used the glass of beer analogy. I assume the full glass was considered as the denominator in his “depletion rate”.
I think your definition is better, but not everyone might not agree.
This is a bit off topic, but picking denominators is an interesting topic when you are trying to gauge the quality of a prediction.
Let’s say you make a few true/false predictions, and compare them with the real outcomes. Sounds simple, right? Most peoples’ brains start melting about halfway down the page.
http://queirozf.com/entries/evaluation-metrics-for-classification-quick-examples-references
You may think this is irrelevant to projecting curves, but you can always change these to true/false predictions with a threshold like say within 10%.
Ron,
No doubt there will be fields that decline at high rates and others that will decline at slower rates, I agree that a field can see a high decline rate, typically at the national level we do not see any evidence that the rate of decrease in output is faster than the rate of increase. In fact. for the World, the rate of increase of C+C output from 1910 to 1970 was close to 7%, from 1980 to 2019 the rate of increase slowed to about 1.2%. If we assume extraction rate increases for a while so the peak occurs in 2030 we still see decline rates at less than the increase, no Seneca effect. Extraction rate is output divided by producing reserves (not all reserves are proved developed producing reserves) and in this scenario increases from 5.46% in 2019 to 12% in 2070.
Countries can experience Seneca cliff like declines for political reasons such as in Venezuela, Libya or Iran.
Schinzy,
I agree. When I think of the Seneca effect made famous by Bardi, it refers to the World. A world wide economic depression, a pandemic, or World War 3 might result in a Seneca cliff for World C+C output, I suppose any of these could occur, but probability is low in the next 20 years, with the possible exception of an economic depression, which is not likely to be permanent. In that last case we would see a temporary Seneca cliff, followed by recovery.
Yes and lower oil price is not good for producer countries’ economies in general. Furthermore, the food price has continued to be fairly high (http://www.fao.org/worldfoodsituation/foodpricesindex/en/). Combined high food price and low oil price is unlikely to persist in the medium term. The situation is difficult for oil producers depending on imported food.
Dennis, as I was saying in a previous comment, oil depletion alone won’t bring a Seneca Collapse for the world’s economy. You need several factors reinforcing each other: the virus, oil depletion, climate change, pollution and perhaps a madman in the White House. I think there is a good chance that we are at this kind of juncture right now. But collapses always surprise you.
Ugo,
Seem to me the odds are not very high that all of those problems coincide to cause to a collapse, I expect total fertility ratio for the World will continue to decrease and that World population will peak and decline, as fossil fuel resources become scarce prices will rise and alternatives will become more competitive and will replace fossil fuel, active government policy will be needed to speed the transition which is likely to be difficult to accomplish.
My argument is not that collapse is not possible, simply that it is not likely in my view, especially with good government policy which will become more likely as peak fossil fuel becomes evident in about 5 to 10 years.
A combination of greater efficiency in the use of energy and perhaps a stiff carbon tax to speed the transition to alternatives may help to reduce the likelihood of collapse.
My preference is to look for solutions to avoid collapse.
My preference is to look for solutions to avoid collapse.
My opinions follow. The “you” is the USA as a country, not Dennis personally.
The problem with this is that survival is going to be a zero-sum game with the highest stakes possible: megadeaths for you or for somebody else… most likely caused by one of those somebodies deciding “better your megadeaths than my megadeaths”. I believe that you (or the other, but more likely you) will let the other die (if you don’t do the actual killing yourself, or steal resources with the same effect).
Collapse will not be evenly distributed, and that distribution will be decided politically and/or militarily. Your withdrawal from the Paris Accords and the TPP make me doubt there is any will for a fair (or even a semblance of fair) political solution going forward. More than ever before, I see the impossibility of a political solution that respects the rights of South-sea islanders, Canadian Aboriginal groups (currently fighting against Gas pipelines) and anyone else who is not from the USA…and if you continue to have a Republican administration, anyone who is not a white person from a Red state.
Sooooo…I don’t place any faith at all in greater efficiency or the likelihood of good government policy.
Apocalypse, however… there’s some good odds there.
The only question, in my mind, is the timing.
Lloyd,
From my perspective it is not a zero sum game. Trump does not represent my views and is supported by a minority of the population. Unfortunately the US has a political system where the president is not elected by popular vote, but by the Electoral College.
https://en.wikipedia.org/wiki/United_States_Electoral_College
Humans can cooperate when necessary and sometimes learn from past missteps.
You’re a data guy, Dennis, much moreso than me. The Electoral College is a data point that can’t be changed, and is going to keep your country much more conservative than the majority of it’s citizens for the foreseeable future. Conservative propaganda is going to keep the Right Wing as uninformed as it already is… there would have to be a flood and/or a brush fire in a Fox studio for them to admit there are climate or oil issues (and even then they would call it a Democrat plot)..
There is also the little problem that your elections have been, and are probably still being, tampered with.
I don’t doubt your goodwill or that of the majority of Americans. Unfortunately, that goodwill cannot be acted on, and where you are right now is already a compromise that pisses off the right.
Now, if Bernie is the candidate, the Dems win all three branches with 68 seats in the senate, and take a bunch of statehouses, I’ll take it all back….well, half of it back, anyway.
At this point, though, my money’s on apocalypse.
http://peakoilbarrel.com/eias-electric-power-monthly-january-2020-edition-with-data-for-november-2019/#comment-697351
Hi Lloyd,
The most valuable thing we have is time. Make the best of it. Let it go, everybody else does.
Hi Beach.
I don’t actually dwell on it that much; I accept that it’s a conundrum beyond any one person’s control. Every once in a while it comes out, though.
My preference is to look for solutions to avoid collapse.
And if you find a solution, then just tell 8 billion people what they must do to avoid collapse. And I am sure they will hang on your every word and praise you for saving them. 🙂
Ron,
Not looking for praise, just potential solutions, when there are problems to solve, humans are pretty innovative at finding solutions. Collapse will not occur from a single problem there are multiple problems to be solved.
Solutions can be proposed and debated, and eventually policy wonks will attempt to implement solutions primarily through governments, but possibly through public private partnerships.
I have no novel solutions, this blog can serve as a place where such ideas can be discussed.
Dennis, it was a joke. The whole idea that we will find a solution for the ecological problems the world faces is a joke, a very cruel joke.
Dennis, I have been thrashing this straw for half a century. I was talking about overpopulation when the population of the world was less than half what it is today. The world was overpopulated then and is far more than doubly overpopulated today.
What has been done about deforestation?
Nothing.
What has been done about topsoil being washed and blown away?
Nothing.
What has been done about ocean fisheries disappearing?
Nothing.
What has been done about falling water tables?
Nothing.
What has been done about the ongoing sixth extinction?
Nothing.
What has been done about climate change?
Nothing.
What has been done about depleting natural resources?
Nothing.
What has been done about air pollution?
Nothing.
What has been done about rivers, lakes and inland seas drying up?
Nothing.
What has been done about coral bleaching and reef death?
Nothing.
And I could go on and on and on. But you get the message. Human beings are overpopulating the world and destroying it in the process. And you want to debate it? You want to search for solutions. You think people debating these problems will lead to some kind of fix? Well, good luck with that one.
Total Fertility ratio was about 5.5 in 1965, today it is about 2.5 for the World population. When it falls to under 2.1, World population peaks and declines.
See page 254 of paper linked below
http://admin.globalchange.gov/sites/globalchange/files/Samir%20Demographic%20Scenarios.pdf
Chart below from that paper, education is the key to reducing total fertility ratio in the opinion of these authors.
Why can’t we get like 0.01% of this as a token donation?
https://www.space.com/jeff-bezos-blue-origin-climate-change-fight.html
$10,000,000,000
🙂
Dennis, the world
population has slightly more than doubled since 1972. More than doubled in just 48 years.
The elephant will be extinct in 20 years. Okay, too many links to post but the gorilla will be extinct in 10 to 15 years. And all other great apes, except humans, will be extinct in the next 20 to 40 years. As well as thousands of other species.
Indian farmers are committing suicide at record rates because the water tables are dropping and they can no longer irrigate their farms. Some towns in India are even trucking in drinking water. And I can go on and on and on.
Your chart, the best case still has the population at almost 7 billion 180 years from today. And you believe that is our saving grace. Dennis, give me a fu***** break! We have 50 years at best before total collapse.
Ron,
It is 80 years 2100-2020=80.
Ron,
Also the peak population for that scenario occurs in about 35 years (2055) at a little over 8 billion.
I don’t think the timing of a future global collapse can be predicted. You seem quite confident about what the future will be like, I steadfastly maintain that the future is unknowable.
In 30 years (2050) the world population will be 9.7 Billion. Plus or minus a few 100 mill.
Check the trend graphs. You can’t even see WWII as a blip on the charts.
Its like adding an additional country that’s bigger than the 3rd-13th countries today combined [USA, Indonesia, Pakistan, Brazil, Nigeria, Bangladesh, Russia, Mexico, Japan, Ethiopia and the Philippines, throw in Germany to get closer].
https://ourworldindata.org/world-population-growth
World energy consumption/capita may have just peaked this past decade. anyone have better data on this?
http://www.tsp-data-portal.org/Energy-Consumption-per-Capita#tspQvChart
Hickory,
There are different estimates of what will happen to future World Population, the UN estimates are not definitive, the Wittgenstein Center does a lot of research on this as well.
https://www.iiasa.ac.at/web/home/research/researchPrograms/WorldPopulation/The-Wittgenstein-Centre.en.html
Like most things about the future, we just do not know.
Charts like this tell us to relax because the population will eventually stabilize and decline slightly. But we have too many people NOW. The number 80 years from now will be far larger than now. Yikes!
I’m just crossing my fingers that research into male birth control gets a good investment boost. I don’t think this chart considers that and there are a lot of men that have kids they never wanted.
Deci, look more carefully at the chart I posted, in 80 years popultion will be slight ly less than today and it will continue to decline from there, maybe reaching 3.5 billion by 2200 and halving every 100 years until a sustainable population level is reached.
Solutions can be proposed and debated, and eventually policy wonks will attempt to implement solutions primarily through governments, but possibly through public private partnerships.
Dennis,
It is possible that in the not too distant future politicians of big countries can’t control the combination of problems anymore. The risk that they will become powerless, helpless is certainly not negligible.
Han,
Many things are possible, I think nation states have a lot of power, I am confident this will continue into the future.
You are right, Dennis, I needed to look more closely at the chart. But how much damage will we do while getting there with all those people?
Hello Dennis,
I agree problems can have solutions.
But I very much doubt that we have problems so I don’t believe that looking for solutions is the way to spend our time.
I suspect that reducing our predicament to a mere problem – or even set of problems – with solutions is, to put it mildly, unwise.
Paul Isaacs
The Shale Oil Bubble Accounted For 99% Of U.S. Oil Production Growth Since 2007
In December 2007, the Rest of the U.S. reported 4.6 million barrels per day (mbd) of oil production while shale oil (tight oil) accounted for 0.5 mbd. Now fast forward to December 2019. What do we see? Shale oil production reached 8.3 mbd while the Rest of the U.S. was 4.7 mbd. In 12 years, shale oil production increased 7.8 mbd while the Rest of the U.S. surged by a whopping 0.1 mbd (approximately 100,000 barrels per day).
https://srsroccoreport.com/the-shale-oil-bubble-accounted-for-99-of-u-s-oil-production-growth-since-2007/
SRSrocco,
That chart is completely useless. As you can see, no one in this blog has even commented on it.
Don’t you realize that oil is ABIOTIC and it is made continuously deep in the CREAMY NOUGAT CENTER of the earth? Thus, all these oil wells are going to be refilled.
There is no Peak Oil, only Peak Stupidity.
Bubba
Steve, I would have rejected this if I hadn’t known you posted it yourself. 😉
Ron
Ron,
Thanks. I was just having a little bit of fun. Ron, you don’t know how many emails and comments I receive from articles on my website about PEAK OIL being a SCAM. There are so many STUPID people in the world, it amazes me to no end.
So, instead of getting frustrated as we head over the ENERGY CLIFF, I’d rather poke some fun and enjoy some laughs.
So, if you see some comments by Anti-SRSrocco or Bubba, you’ll know who it really is. 🙂
steve
Bubba,
I agree most of the increase in World c+c output has been from tight oil since 2016. Lack of response to Steve does not imply disagreement all of us agree oil will peak from 2018 to 2030, with differences of opinion on the likely date.
Dennis,
Thanks for your reply, but what about the ABIOTIC OIL ELVES that are creating new oil every day?
Any thoughts on that?
Bubba
Steve,
I actually know someone who not only believes in abiotic oil, he also believes that when God sees we are running low he’ll make some more. He is also a religious nut who was simply brought up that way as a child. No excuse, but there are a lot of religious nut bars out there. Think about, no one before Trump has ever been elected without some kind of faith statement or track record. And then he quickly joined up and invented one.
I often wonder what percentage of folks just cruise through life convinced it is all part of a divine plan? Even today, 24% of Americans still believe the Bible is the literal word of God.
When decline starts in earnest there will be some very very bewildered folks out there.
Bubba,
Not really, are those elves under the flat Earth? 🙂
Yes they live on the other side.
That’s the reasone they are all winged – otherwise they would fall down ;).
Ron
Guyana should start showing up in the EIA and OPEC data shortly. As best as I can figure out, Guyana is expected to add about 200 kb/d/yr over the next five years for a total of 1 Mb/d. Saudi Arabia and Kuwait will start production from the neutral zone shortly and could reach 320 kb/d in 2021. Not clear if it will get back to its production level in 2010 of 600 kb/d. See note below. Then there is Brazil. Some reports indicate that it could possible add another 1 Mb/d over the next two years.
I am not aware of any other big discoveries coming online soon. These new fields could postpone the confirmation of Nov 18 being the peak.
Saudi-Kuwait neutral zone output could reach 320,000 b/d: IEA
Dubai — Saudi Arabia and Kuwait could pump 320,000 b/d from the neutral zone a year after resumption of production that’s shared equally by the two OPEC members, the International Energy Agency said Thursday.
The offshore al-Khafji field, owned by Saudi Arabia’s Aramco Gulf Operations Co. and Kuwait Gulf Oil Co., could produce about 60,000 b/d by August and after one year 175,000 b/d, the Paris-based agency said in its monthly oil report. The onshore Wafra field, which is operated by KGOC and Saudi Arabian Chevron, may produce 80,000 b/d in Q4 2020 and later 145,000 b/d, it said.
Production from the zone has been halted for more than four years. Saudi Arabia and Kuwait signed agreements in December to resume output but didn’t specify a timeline. Chevron has said it will restart “at the appropriate time.”
Saudi energy minister Prince Abdulaziz bin Salman said in December production from Khafji could reach 325,000 b/d by the end of 2020. Both Kuwait and Saudi Arabia have said the resumption of oil production from the divided zone would not clash with their OPEC+ commitments.
Guyana is expected to add about 200 kb/d/yr over the next five years for a total of 1 Mb/d.
I don’t understand that at all. According to the EIA Guyana is producing zero barrels per day. And all I could find on the net was this:
ExxonMobil and Hess reported that new discoveries contain estimated resources exceeding 4 billion barrels of oil equivalent, potentially producing 750,000 barrels per day by 2025. The value of oil dwarfs the roughly $3 billion gross domestic product of Guyana.
However, this, as well as the al-Khafji field coming back online, will make little difference in the big picture. What could make a difference is if sanctions were lifted on Iran next year. But I doubt that would be enough, especially if the US starts to decline in 2022.
Nothing is certain, not in Iran or Venezuela. And as in Libya, conflict in the Middle East and Africa is likely to increase rather than decrease.
Ron
https://www.businesswire.com/news/home/20191220005597/en/ExxonMobil-Begins-Oil-Production-Guyana
A second FPSO, Liza Unity, with a capacity to produce up to 220,000 barrels of oil per day is under construction to support the Liza Phase 2 development, and front-end engineering design is underway for a potential third FPSO, the Prosperity, to develop the Payara field upon government and regulatory approvals. ExxonMobil anticipates that by 2025 at least five FPSOs will be producing more than 750,000 barrels per day from the Stabroek Block. The timely development of these additional projects will ensure that the local workforce and the utilization of local suppliers will continue to grow.
Somewhere else I say the possibility of getting to 1 Mb/d if they make a few more finds
This question may have been answered several times. Does anyone know whether the oil & or gas consumed in production by Saudi Arabia is added to the production figures of the country?
By the way, do Texas producers consider the hydrocarbons they locally consume as production?
Thanks in advance,
m.
I have no idea how oil would be consumed in production. If any is, I think it would be such a small amount as not to matter. But oil consumed by the country itself is counted in production.
I am sure some gas is used but I know of no one that tracks world natural gas production.
KSA is a pretty serious oil consumer. Maybe he means that.
But I’m in your corner on this I have never heard of a quoted amount consumed as a consequence of production.
Maybe five years ago we played around with shale in North Dakota and the truck consumption, but not KSA.
Concerning that question EROEI comes into my mind as well as the Export Land Model.
Ron, Thanks for the update. Insightful analysis and super presentation.
Received this from an email from Matt Mushalik. I thought I would post it here for your information.
Weak demand from the Corona virus may cover up OPEC peak oil
1/10/2019
The Attacks on Abqaiq and Peak Oil in Ghawar
http://crudeoilpeak.info/the-attacks-on-abqaiq-and-peak-oil-in-ghawar
Today, an upward kink in Corona cases and deaths
https://www.worldometers.info/coronavirus/
With travel bans we see impacts similar to a peak oil scenario.
Australia has made itself absolutely dependent on China. Commodity
exports, students studying at Unis, tourists, investors buying up the
suburbs…It’s all Chinese money coming in.
Climate change has hit, too.
4/2/2020
Bush fires cause load shedding in NSW January 2020
http://crudeoilpeak.info/bush-fires-cause-load-shedding-in-new-south-wales-january-2020
Then the other extreme:
Rail tunnel flooded with brown water
https://www.smh.com.au/national/nsw/millions-of-litres-of-water-floods-sydney-s-metro-tunnels-20200211-p53zr8.html
We need to discuss this again:
Government Agency Warns Global Oil Industry Is on the Brink of a Meltdown
https://www.vice.com/en_us/article/8848g5/government-agency-warns-global-oil-industry-is-on-the-brink-of-a-meltdown
The report is here:
http://tupa.gtk.fi/raportti/arkisto/70_2019.pdf
Regards Matt
Shit Happens
If this is peak, it’s because of efficient environmental demand
“This means that although the oil industry can’t cope with the lower prices, the global economy can’t cope with high prices. “I now see peak oil as being defined by a contracting window between an oil price high enough to keep producers in business and a price low enough for consumers to access oil derived goods and services,” said Michaux.
As a result of this combination of geological challenges and above-ground market constraints, Michaux’s government study warns that a global peak in total oil production is either “imminent” over the next few years, or may already have happened, possibly in November 2018. But we will only be able to fully confirm the peak around five years after the fact.”
Nice fine-tuning of the peak oil definition. All of this oil production is propped up by massive quantities of debt, not just shale oil companies but also Pemex, Petrobas, Exxon, Chevron, etc all down the line. Consumers and consumer governments are also drowning in debt. In effect, no one can afford to produce the oil at given prices, and no one can afford to buy it. Yet the system limps on, at least for the time being. The vibe is getting similar to 2007 when stocks kept hitting new highs but the housing market was obviously out of whack on a fundamental scale. The big question in my mind is, when the shale oil companies all go bankrupt here in the next few years, will they drag down all the traditional oil companies as well, including the NOCs?
I’ll play devils advocate here.
Since 1980, the highest percentage of total income the average US household spent on gasoline was slightly above 5% in 1980, the lowest was 2% in 1998, 2011-14 it ran at about 4% and right now it is at 3%.
I am sure there is a price where gasoline becomes unaffordable for US consumers, but we are a long way from it.
Compare this to the increases in the cost of healthcare, housing, college tuition, and yes, automobiles.
Food and fuel continue to be cheap. $80 oil and $5 corn is not unaffordable.
Most families of four spend more on cell phone service than on gasoline.
Shallow sand,
I think the other person may have been thinking of oil and food prices in less developed nations, rather than in the OECD. I agree that this is not a problem in the US, in south Asia and Africa, maybe not. Many believe the high oil and food prices from 2011 to 2014 led to the Arab spring, rising oil prices might lead to another such crisis which could disrupt oil supply from many OPEC nations if a future such uprising might lead to regional wars affecting OPEC nations and disrupting oil supply.
I may be reading too much into the comment though.
Being the devil here. Don’t t need to play being one.
Efficiency is the mother’s milk of capitalism and free markets. Reducing the commodities and energy demand in the manufacturing process adds to the bottom line. Building more efficient vehicles makes them more valuable selling against competition.
EV’s maybe only 1 percent of of new sales today, but over the last decade ICE have become 20 percent more efficient.
The price of gasoline isn’t an economic problem except for oil producers. In time the oil market will return to a supply and demand price balance.
Dennis. Do you have any stats on the percentage of income used in other nations to purchase fuel?
My argument is based on US using 2-5% range from 1980-2019. I agree if other nations have a much higher percentage, $80+ WTI might make a bigger difference.
However, I suspect US consumers also use many more gallons of fuel per capita than those in developing nations.
shallow sand,
I have not actually gathered the data, but I suspect in developing nations average income levels are far lower, you are correct however that fuel use per capita is no doubt much lower.
short answer, I do not have the data to back my claim, sometimes when I actually look at the data, what I think is true is in fact false.
I usually do these calculations at the World level. Rather than focusing on individual nations, as there are many nations and it’s a lot of work to do them all. I could compare China with US, I suppose, but I have never done the calculation.
Dennis. I think from prior comments that you agree that the cost of oil from 2011-14 did not significantly impact developed economies. Same with the cost of food?
As for developing nations, I am not sure about the answer.
Shallow sand,
Actually that was where I used World numbers. I do not think it affected the economic growth rate of the World economy in constant dollars, so called real GWP. Gross World Product.
By it in above comment I mean high oil prices from 2011 to 2014 had little effect on the growth rate of World real GDP over that period. I believe that there is good evidence that food prices rose, a problem for developing nations and perhaps the spark that ignited the Arab spring.
I agree with Shallow Sand- don’t think oil price is anywhere close to a level where the ‘worlds economy’ would find it unaffordable. Most would reallocate money from other uses if they found the price rising.
“This means that although the oil industry can’t cope with the lower prices, the global economy can’t cope with high prices. ”
True, but by high prices I think we would talking about over $100/barrel, not current levels.
I suspect we will come to see these higher prices, this decade.
Hi SS, you seem to state that oil is affordable for producers and consumers, yet across the board they both are drowning in debt almost everywhere in the world. If someone is charging their life’s necessities on their credit card, it may seem affordable, until whoever is in control of the purse strings pulls them shut.
To state it more emphatically, producers are borrowing money to produce oil, and consumers are borrowing money to consume it. Therefore, it is affordable for neither. The system is merely operating on inertia- Wile E. Coyote suspended in air on the wrong side of the cliff.
Stephen,
Doubtful that consumers in general in the US are borrowing to pay for gasoline. For US consumer debt here is some data:
https://fred.stlouisfed.org/series/CDSP
click on chart for larger view.
Stephen. I didn’t say the price of oil currently is high enough for producers. It isn’t high enough for non-conventional sources, which is where the bulk of remaining supply will come from.
I only argue that current prices are affordable for consumers in the United States, given US consumers spend less than 5% of income on gasoline on average, and the range has been from2-5% over the past 40 years. $80 WTI would not have a big impact in the US. As for other nations, I cannot say, I would need to see comparable stats.
It would probably make more sense to calculate the geometric mean instead of the arithmetic mean, since household spending never falls below zero. As a rule of thumb, numbers that can’t fall below zero are poor candidates for arithmetic means. That is why Wall Street models always use percent changes in values and geometric means.
More importantly, the geometric mean is insensitive to outliers. The arithmetic mean is dominated by large values, which makes it a poor measure of typical values, which is what you seems to be looking for. Market prices will tend to be driven by the behavior of the typical consumer.
Alimbiquated,
Put the name of the person you are talking to in your comment. I have no idea who you are talking to or what we are supposed to apply the geometric mean to.
Alimbiquated,
When looking at economic growth rate over time I always use geometric mean.
avg per person income in usa $31099
avg miles per person in usa 13,476
avg mpg in usa 25
number of gallons used to drive 13476 mi: 539
avg cost of gasoline $2.60
average annual cost of gasoline $1400
1400/31099 = 4.5% of income on gasoline
while this confirms the relatively small amount of income (<5%) spent on petrol, it also confirms why EV adoption will meet much foot dragging.
DuaneX,
Gasoline prices are likely to rise faster than income while the price of EVs is likely to decrease over time. Eventually Tesla will introduce a “budget” EV for 20K (in 2020$), perhaps in 5 years or so, at that point ICEVs are done within 10 to 15 years. Also there is the potential for robo taxis which may make car ownership a thing of the past, that is probably 15 to 20 years in the future (government approval will take time).
A lot of electrification will be driven by the industry. Mild hybrids are coming very quickly, and they eliminate a lot of the mechanical gizmos in cars, including cam shafts, power steering, power brakes, passive suspension, turbo chargers powered by exhaust, automatic transmissions with fluids, etc.
Mild hybrids also make the combustion engine second fiddle to the electric motor. They consume less fuel because that is required in the big markets of Europe and Asia. Gas is pretty cheap in China, but the government wants to push electrification to get a jump on the rest of the world.
American car companies have to follow the rest of the industry or abandon the international business, as GM is doing. The problem is that the American market really isn’t big enough to support competitive platform development. That is explains their decision to stick to pickups and leave the rest of the business to foreigners. But since Rivian announced, even this niche is disappearing from the ICE.
Sorry Duane,
Average cost of car ownership US- $8,649
Median income US – $31,099
28% of income. Older cars cost more to maintain. Lower income adults in the US are ready to abandon their cars, as is much of the urban upper classes.
https://www.nerdwallet.com/article/loans/auto-loans/total-cost-owning-car
https://en.m.wikipedia.org/wiki/Personal_income_in_the_United_States
stephen,
Let’s assume all tight oil focused producers go bankrupt, except majors (that seems far fetched because only a portion of their operations are in tight oil). Let’s further assume that all tight oil production gradually stops because it is no longer profitable to produce.
That tales about 8 Mb/d of output off the World market (or more if tight oil output rises to 9.7 Mb/d as I expect in 2026). World C+C output falls to about 74 Mb/d in this scenario, by perhaps 2030 to 2035.
What would you expect will happen to the price of oil under such a scenario?
My expectation that WTI would rise to at least $100/bo in 2020$, at that price the oil companies left standing will be doing just fine, with bankruptcy highly unlikely. Eventually an energy transition will reduce consumption levels of oil so that consumption starts to fall by more than the output of oil falls and at that point oil prices may decrease, at that point OPEC starts to fall apart and NOCs start to compete with each other for market share and may drive oil prices quite low as they over supply the market. My guess is this occurs some time after 2040 and oil prices may fall to $40/bo and some higher cost NOCs might be driven to bankruptcy, perhaps by 2050.
Difficult to guess how quickly the transition to alternative forms of land, sea, and air transport will occur, I think by 2060 to 2070 we might reach only 20 Mb/d of oil demand, but that’s probably on the optimistic side of possible WAGs.
Hi Dennis, I don’t think the remaining oil companies will be just fine. We’ve had several prolonged periods of oil at $100/b and great surges of production have not occurred other than shale oil. There are three primary things going on that make ALL oil companies susceptible to failure as an industry over a brief period of time (less than two years).
1) Lack of prospects/rising costs of new projects and bad debt. Debt taken on for only short-term gains is essentially rot that will inevitably lead to bankruptcy if done for a prolonged period of time. Shale companies do this when they drill wells that deplete quickly; large oil companies do this when they take on debt for dividends and share buybacks; NOCs do this when they used oil companies like piggy-banks for payments to their citizens. At the end of the day, you have the debt and nothing to show for it.
2) Inherent inefficiency of the oil-ICE car paradigm. Cars typically use 5% of their energy to move their human payload around (200 lbs in a two ton car e.g.). Internal combustion engines are about 20% efficient. Therefore we have a transportation paradigm that is 99% inefficient. Technological improvements in structural materials; batteries and EVs; AI; and PV are all improving, while the oil resource is degrading and ICEs are improving only modestly. Systems that are 99% inefficient do not survive crises well.
3) Narrative/Paradigm shift among investors. When oil goes to $100/b in 2030 as you suggest, the remaining oil companies (if there are any) will make some money. There will also be articles about many new EVs are being sold, and/or how the young are abandoning owning a car altogether. Wall Street is not interested in investing in companies who happen upon a windfall but otherwise represent the past, they want to invest in the companies that will be dominant in the future. This narrative will be fully entrenched by 203o if not by 2022.
Add to this an overdue recession and 1-2 years of very low oil prices, likely caused by a travel-destroying bug encircling the globe with plodding intensity. This last item remains something of a hypothetical, but less so every day.
Yes indeed, I agree. That’s why it makes absolutely no sense to give an oil price scenario from 2020 to 2070. There will be spikes in oilprices and periods of oilprices imploding in the coming decades, also because OPEC will fall apart imho.
Stephen quoted the essence of the article of Michaux:
“This means that although the oil industry can’t cope with the lower prices, the global economy can’t cope with high prices. “I now see peak oil as being defined by a contracting window between an oil price high enough to keep producers in business and a price low enough for consumers to access oil derived goods and services,” said Michaux.
A smooth transition, regarding oilprices and EV sales increase for example, is not be expected.
Stephen,
There is a lot of low priced oil that can be produced by OPEC+, those companies might eventually go bankrupt, but not in the short term (next 5 to 10 years). It will take time for EVs, plugin hybrids and hybrids to reduce demand by more than the rate that supply will fall after peak oil, hint, Seba is likely too optimistic, my guess is 2037 at the earliest.
In the mean time, recession is not assured, the corona virus may not be as much of a crisis at the World level as some speculate that it might be and the World can easily afford oil in the $100 to $120/b range (in 2018$) just as it did from 2011 to 2014, in fact higher World real GDP today compared to then means that $120 to $140/bo in 2018$ may be roughly similar from 2023 to 2030 as the 2011 to 2014 price due to higher World real GDP.
The idea that consumers will not be able to afford oil is likely incorrect.
Han,
The oil price scenario by the EIA AEO is a scenario. Perhaps you are not familiar with modelling, and economic model requires an input, I say repeatedly, nobody knows what future oil prices will be, so we guess. All guesses about the future are wrong, whether one week in the future or 100 years.
I use 2070 because a tight oil well produces for 15 to 20 years, if we are considering a well that might be completed in 2050, to do an economic analysis we need the price of oil over the life of the well to see if it makes sense to complete the well or not. The question is will the future discounted net revenue from the well be greater than the cost of the well, the question cannot be answered without a price assumption.
Denise , you are incorrect . The low cost of production price of oil at OPEC is the well head price . I have always said this is not important . What matters is the full cycle price which means keeping MBS in power ,keeping the Al Sabah family in power in Kuwait,and the Princes in power in UAE . Take away the subsidies provided by the regimes and you can see beheadings . The full cycle price is + $ 100 per barrel . If all things were so rosy why did Aramco go for an IPO ? They are all suffering from the low oil price, some more than others . As a passing thought ,this is aggravated with the China crisis . Prices will remain low for eternity ( concede their will be spikes ) . I have always appreciated your work and analysis ,but at the same time criticized your view from rose colored glasses . We are headed in a time of great uncertainty , and my call is that oil prices are not going into any territory except down . Your equation is supply and demand , my equation is affordability .
hole in head,
Agree there will be great uncertainty. The scenarios show what might happen under a certain set of assumptions.
Future is unknown, at least for me.
The future is unknown is not only true for you but for the whole world . Jesus , why go around the effort of making models etc if it is unknown . All of on this forum make an educated /informed decisions based on data available , then some layman who reads the headlines and fires an arrow in the dark . This is in way criticism of you but appreciation of all members of this forum .
Hole in head,
I tend to admit up front that predictions of the future are not likely to be accurate. I make several sets of assumptions that seem reasonable about what might happen in the future, often with low and high scenarios that might bracket the most likely outcomes, based on what we know about what has happened in the past. These are called scenarios, if all the assumptions of the model were correct, the scenario is what might occur (if the model is correct).
I use the past data as an input to see how the model performs relative to the data up to the most recent data to give some measure of confidence that the model represents reality to some degree. Beyond the present we have to make assumptions about future oil prices, well profiles, completion rates, well costs, etc. These are unknown, plain and simple, assumptions must be made to even make a guess, I try to lay out those assumptions so knowledgeable people like Mr, Shellman and Shallow sand can suggest more realistic assumptions.
It is the best I can do, but you are correct to point out that any scenario may be incorrect, I would say the odds that such criticism is correct is about 100%.
Sorry Denise . It should have been ^This is in no way criticism of you^ . Guess should not post while drinking Cabernet Sauvignon ;-).Pls accept my apology .
hole in head,
No apology necessary. Thought you might have meant no criticism, but criticism is good. I prefer this not be an echo chamber where everyone agrees, sorry if I came across as being offended, if so it was not intended.
I appreciate your comments, often I am in fact, incorrect. In many cases, if we are discussing the future, I tend to say, “I disagree”, as there are no correct views of that which is unknown in my opinion.
Dennis,
Yes, I know economic models need input. In the case of future (50 years ahead !) oilprices there are so many variables that indeed it becomes guessing. Any projection could be given, especially the ones more than a few years from now. An optimistic scenario with a more or less smooth transition can be given. My opinion is that the chance for such kind of transition is small. That’s why I expect periods with spikes and implosion of oilprices. Not in the last place because I expect OPEC to fall apart and more military conflicts. Having to be added is any dangerous infectious disease spreading the globe between now and 2070. A ‘bumpy ride scenario’ without giving time frames is more realistic I think. In this case: NO graph. Projecting oilprices between 2020 and 2030 is already more than difficult enough.
Han,
I used the following.
https://www.eia.gov/outlooks/aeo/data/browser/#/?id=12-AEO2020®ion=0-0&cases=ref2020&start=2018&end=2050&f=A&linechart=ref2020-d112119a.4-12-AEO2020&ctype=linechart&sourcekey=0
I agree prices may be volatile, but cannot predict that volatility in advance.
Dennis is this in 2019 dollars or what? Do you adjust for inflation?
Ron,
That is the AEO reference case for WTI oil price in 2019 $/bo (see upper right of chart, click on chart for larger view.
Dennis,
Prices WILL be volatile. This is a graph for ‘fantasy world’, that shows a concerted effort in energy transition.
Maybe in 203o average oilprices will be 70 dollar/b and in 2040 almost 90 dollar/b on average, with a few brief spikes above 100 dollar and a few brief dips below 30 dollar between 2020 and 2040.
In that case Peak oil and the following terminal decline can hardly become the threat that many here on peakoilbarrel fear, because in that case there will be a kind of smooth transition during which hybrids, EV’s, etc will expand steadily rather quickly worldwide. That is possible, but I consider the chance well above 50% that the result will be different. We don’t have only Peakoil (soon) as a problem, and climate change is showing its horrible consequences already in many countries.
Han,
I agree that prices will be volatile. The chart is the EIA’s AEO 2020 reference oil price case for WTI.
I cannot predict the ups and downs of the price of oil, this chart is likely to reflect the centered 12 month average price within +/- 2% in my opinion. Short term oil price volatility has been around for a long time. (1973-2020)
Note that you would need to talk to the EIA about their future expectations, this is not my oil price scenario.
REal prices re interesting, but it’s worth noting that GDP is increasing. I think it’s a safe bet that oil revenues will continue their long term decline as a percentage of the larger economy.
The real price of oil is one number, but the percentage of the economy dedicated to oil is more interesting.
Alimbiquated,
Yes as oil peaks it will become less important if prices remain fixed in real terms, but it is likely that oil prices will rise. I agree the percent of World GDP spent on oil is an interesting figure.
If we assume my World Oil shock model is correct, that World real GDP continues to grow at the 1975-2017 average rate of 2.92% per year and that the AEO 2020 reference oil price case is correct, then we get the following for the percent of real World GDP spent on C+C output (where I use the Brent oil price for the average World oil price).
If we use the same assumptions as my comment above we can deam the 2019 oil price as “affordable” at 1.92% of World real GDP (aka real GWP) spent on C+C at Brent oil prices in 2019$/bo.
We can find the affordable price for oil assuming the percentage of real GWP spent on C+C output is equal to 1.92% (I assume output follows my shock model).
Chart below gives this “affordable” oil price where it is assumed demand remains robust through 2050.
click on chart for larger image
Note that you would need to talk to the EIA about their future expectations, this is not my oil price scenario.
Dennis,
Don’t you think that “the EIA” would like to see nothing more than a smooth slow declining world crude oil production curve together with slow rising oilprices, to fit a smooth energy transition ? Wouldn’t most of EIA staff have children and because of that don’t want to let possible pessimistic scenario’s to get in their heads ?
Han,
I do not know what is in the minds of the economists at the EIA, perhaps this is what they think the most likely scenario is, or it may be wishful thinking.
The future is not known by anyone.
Han,
It has been a bumpy ride for the past 50 years, perhaps the ride will become bumpier as many have been predicting for about 50 years (or more).
Perhaps you have a better crystal ball than me, my predictions up until now have been uniformly too pessimisitic relative to what has occurred.
Though it is certainly true that they have been less pessimistic than many others.
In any case, every scenario of the future is very likely to be wrong. The number of possible futures is infinite, when any one scenario is created, odds are 1/infinity=zero that such a scenario will be correct.
Hi sirs,I want to thank you for this opportunity I’ve been looking for oil information to make some investment if I can warm regards.
Interesting how different one can perceive and make use of information found on this site and others (I’m not an oil investor).
I would disagree of a Seneca cliff like decline of giant fields.
Giant field are more a conclusion of several subfields, with different hight of oil colums in them.
So if you perfectly cream it, pump water pressure / CO2 etc.., oil level in the subsection will develop different.
So it’s more like 2021 south section runs dry, 2022 east section … and 2026 the central (best) section starts to draw water. So the complete field decline will look like a 1x% annual decline, even when the subsection break down very fast – but on there own time scale.
Perhaps even every single well that has to be closed when the water draw gets too high – resulting in an organic looking decline even when single wells die within a few months.
You have documented this here very good on Ghawar – one section already broke down, others still producing.
Giant field are more a conclusion of several subfields, with different hight of oil colums in them.
That is the exact point I made in my post. Ghawar is five fields. We can see a dramatic acceleration of the decline in three of them. Two are not declining at all. But taken as a whole, we still see a Seneca Cliff in Ghawar. If you disagree, then you disagree with exactly what is happening.
This look very much like a cliff to me.
I agree for this single field, there was indeed a Seneca cliff, it is in fact the classic example. For the World this would only occur if all fields exhibited this behavior and the timing of the decline from all fields was simultaneous. Odds of this occurring is approximately zero.
The odds of a simultaneous cliff-decline from all fields is zero, but what about the odds of two or three larger super-giants dropping off the cliff within a few years of each other?
If that were to happen soon the world could quickly lose about 10% of its conventional oil production. But the super-giants will probably be among the last to be sucked dry, so the loss of production at that time might be a far higher percentage of the total. The end of the oil age could easily be a Seneca cliff.
Joe,
Doubtful that will occur in my view. If it did prices would spike and resources that were deemed not profitable to produce might be developed and might blunt the decline. Many of the supergiants are onshore, Canterell was offshore and so far is the exception to the general rule for giant oil fields. Also it is highly unlikely that 3 fields contribute more than 5.8 Mb/d to total World output and they will not drop to zero overnight, 5.8 Mb/d is about 7% of World output and it is not very likely the three largest will all decline sharply within a few years of each other in any case. If they dropped at 20% per year (unlikely), we would see World output drop by 1.14%, prices would rise, other resources would be developed.
Note that currently Ghawar has output of about 3.8 Mb/d, the next largest field is around 1 Mb/d, I assume the 3rd largest is also close to 1 Mb/d which is how I arrive at 5.8 Mb/d for a worst case scenario where the 3 largest producing fields all start to decline steeply simultaneously (a highly unlikely scenario).
Hi Ron,
By Bardi’s definition the Seneca effect means that rate of decrease in output is greater than rate of decrease in output. If we use data from Twilight in the Desert (p. 368) for Ghawar increase from 1957 to 1975, the rate of increase in output averaged about 11.4% over that 18 year period, over the shorter period of 2017 to 2019 the rate of decrease in output the Ghawar decline rate was about 10.6% based on the Mearns model presented in your post (chart). So not really a Seneca cliff at least by Bardi’s definition. Certainly the decline is fairly rapid in Mearns model, it is unclear if that rate of decrease will continue, Mearns model suggests over the longer 2017 to 2030 period the average decline rate is about 4.8%.
Geological Survey of Finland
Of existing world liquids production, 81% is already in decline (excluding possible future redevelopments). By 2040, this means the world could need to replace over 4 times the current crude oil output of Saudi Arabia (>40mb/d), just to keep output consistently flat.
In January 2005, Saudi Arabia increased its number of operating rig count by 144%, to increase oil production by only 6.5%. This suggests that the market swing producer (as Saudi Arabia was seen) was not able increase production enough to meet increasing demand.
Global conventional crude oil plateaued in January 2005. This would prove to be a decisive turning point for the industrial ecosystem. Since then, unconventional oil sources like tight oil (fracked oil shale) and oil sands have made up the demand shortfall, where U.S. shale (tight oil, fracking with horizontal drilling) contributed 71.4% of new global oil supply since 2005. Global conventional oil production broke out of its plateau in late 2013 and has been able to expand incapacity, where deep offshore plays become more important.
Since 2008, the Shale revolution (tight oil or fracked oil) has increased global oil supply which stabilized increased demand. This was achieved with the application of precision horizontal drilling applied to the existing hydraulic fracking industry. Tight oil produced in August 2019 was 7.73 million barrels per day, approximately 8.37% of global supply. The U.S. tight oil sector accounted for 98% of global oil production growth in 2018. Future global demand growth is now dependent on the U.S. tight oil sector.
This report is 497 pages long with many charts. From page 262:
17 Peak Oil
Oil is a finite natural non-renewable resource. The planet Earth is a finite system. At some point, rates of resource discovery and oil extraction rates will peak and decline. Has all the oil deposits been discovered, or is there vast reserves yet to be tapped? A pertinent question is when this date might be. Another pertinent question would be how society might manage this supply gap in oil supply.
Data collected over the last several decades show that peak oil is now an observation in several oil-producing regions (Norway, United Kingdom, etc.) and is not just a theory. In the past, as one region peaked and declined, a new region was developed to take over production growth, thus the global production could continue to grow. So what happens when regions on the planet are in decline and there are no more new regions to exploit?
What is to be remembered is that not all oil deposits are equal and some will be much harder to exploit than others. It is appropriate to state that the easy to find, extract and refine oil deposits have all be exploited decades ago, and what is left is the less economic deposits. Technology has been the mechanism that has allowed the continued economic extraction and delivery to market.
Reading further in this report, I found the following comments very interesting.
17.1 Oil & Gas Industry and Peak Oil
In the review process for this report, it became clear that the current paradigm in the oil industry is that the concept of finite reserves or peak oil production is ridiculous and not considered a worthwhile topic of discussion. The following reasons are routinely encountered when interacting with the oil and gas industry when enquiring about how long oil supply can be sustained:
1. Oil based technology and products will be simply phased out when it becomes too difficult to supply, and replaced by more economic substitutes.
2. Electric vehicles (EV) and hydrogen fuel cell cars will replace internal combustion engine (ICE) technology vehiclesare the technologies that will make oil (and all fossil fuels) irrelevant.
3. Economics and market forces will ensure this is done. When the substitute system is cheaper than petroleum based ICE systems, they will naturally become dominant and oil will be left behind.
4. More deposits will be discovered once the oil price goes up making lower quality resources viable.
5. Fracking technology can continue in the same rate and economic footprint as conventional oil production.There are a number of difficulties with these paradigms.
The assumption that EV technology will work the same way and be assemble to all parts of society like ICE technology does now is unlikely to work out as planned. A parallel report done (Michaux 2020) examines the logistical practicalities of transforming the existing ICE felt to EV, with the purpose of estimating the needed extra capacity required in the global (and EU, US and Chinese) electrical power grids to charge the necessary number of batteries. The report (Michaux 2020) shows that the task to transform the existing fleet of ICE vehicles into EV’s and manage their operation is a far larger challenge than currently understood. Another study being planned is to examine the volume quantity of minerals needed to manufacture the required batteries, solar panels and wind turbines to support a fully renewable power system that supports a fully EVfleet of vehicles. Preliminary results at the time of writing this report suggest that Geological Survey of FinlandOil from a CRMPerspective263/49722.12.2019 Geologian tutkimuskeskus | Geologiska forskningscentralen| Geological Survey of Finlandglobal mineral reserves of cobalt, nickel, lithium, and neodymium are not large enough to supply raw materials for this task.
Then there is the question of time. It will take time to implement this kind of industrial reform. Once a substitute system has been diagnosed, it would take 10 to 20 years to phase out the ubiquitous application of ICE technology and its supporting infrastructure (Hirsch 2005). If the transition was started at a larger scale than what is being done now, will petroleum supply be stable for another 10 to 20 years? This is a question that is required to be addressed.
This suggests that the assumption that the EV revolution will overturn oil as the preferred and more economically viable system, is far from certain. Just so, assessing the long term stability of such an important resource is required to be examined in context of physical supply and demand of that resource, in conjunction with market economic forces. Assuming market forces on their own will address society’s industrial needs in a timely fashion may not be appropriate.
Points 4 and 5 will be examined later in this report.
The implications of the statements in this section require that oil be examined in context of what it does for society now, and if no widespread economically viable and logistically practical solution was developed, how long will oil supply be stable. The perception that peak oil does not need to be discussed because electric vehicles and renewable energy will replace oil may not be appropriate. Oil is required to be studied as a system as it is now, not what it might be in a decade from now.
This difference in paradigm has resulted in some aspects of the oil industry not being studies at all (at least publically). That there was no publically available oil Critical Raw Material study published by the oil industry, was the motivation to write this report.
I stated this once before and I will state it again. The concept of the all electric EV (BEV) is nuts from a cost, resource needs, and speed to market penetration reason. What the developed world needs are a variety of Plug in Hybrids (Cars, SUVs) with a range of 50, 75 and 100 miles so that consumers can buy the one or two that best suits their driving needs.
A person my son knows who owns a Gen 2 Chevy Volt, (54 mile range) gets over 1000 miles per gallon. Most of his driving is in EV mode. After he drives 4,000 to five thousand miles he has to add 4 to 5 gallons.
I am not saying that there should be no BEVs. Those with the ability to pay for the BEV should have that option. However, I think there should be an additional penalty charged because one BEV with a range of 400 miles is using the scarce resources, as noted above, that are needed to make four 100 mile Plug in Hybrids.
Ron, great post. What a treasure this site and it’s comments is. Sorry to be a bother and all, but would you please show a top 3 less usa; just a Russia + KSA total with trailing average. I’d do it myself but I’m kinda thick.
No problem. Here it is, Saudi Arabia + Russia through January 2020 in K barrels per day.
Shale Oil: The High Risk of High-Grading
02/ 11/ 2020
http://blog.gorozen.com/blog/shale-oil-the-high-risk-of-high-grading
Historic high-grading means the sweet spots are disappearing.
Tony,
If one looks at average Bakken well profile this is not clear yet.
Ron, thank you for your excellent post.
Noble Energy has just released their 2019Q4 results, and has shale crude oil production from DJ, Permian and Eagle Ford basins.
http://investors.nblenergy.com/
US onshore crude in 2019Q4 was 123 kbd, down from 127 kbd in 2019Q3. Noble’s guidance for US onshore crude is between 118 to 130 kbd for 2020. The midpoint of this guidance is 124 kbd which means that Noble US shale crude oil production is on a plateau now.
Noble also said “Sales volumes from the Eagle Ford totaled 52 MBoe/d for the fourth quarter 2019, down five percent from the fourth quarter 2018 resulting from base declines.”
Eagle Ford base decline rate has stopped dropping and was recently 116 kbd/month. This is equivalent to a monthly base decline rate of 7.9% per month, as from EIA DPR.
https://www.eia.gov/petroleum/drilling/pdf/eagleford.pdf
Eagle Ford base decline is also shown from shaleprofile slope of monthly production increments, which is about 100 kbd/month. Eagle Ford is on a peak plateau.
Bakken December production is down by 41 kb/d. ND down by 43.4 kb/d. Here is what they are getting for their LTO. Can you make a profit at $38/bbl?
—————————WTI — Discount
November – 46.07 — 57.12 — 11.05
December – 48.35 — 59.86 — 11.51
January — 47.19 —- 57.73 — 10.54
Today —- 38.00 — 52.02 — 14.02
The wells already drilled and flowing probably are profitable.
Most of them are. $38 is a low price.
Say your well produced 10,000 gross BO in a year, or 33.33 BOPD. Assume royalty of 20%. Gross revenue of $304,000. Subtract 10% for severance. So the oil check is $273,600 for the year.
Now subtract LOE of $14,000 per month. After LOE, we are at $105,600. Say our well cost $7 million to drill, complete and equip. Our well returned 1.5% of its investment.
Of course, I have not included the minimal gas and NGL income. But I doubt it covers g & a. And then there is the interest that still needs to be paid. And the principal that is maturing 2020-2022.
$38 doesn’t work. Nope.
They have had some real productivity gains in the Bakken since 2014. But they sold a lot of flush production in 2015 and 2016 for $15-40 per barrel, which was really bad.
It looks like these wells will crank out 20-40 BOPD for several years. But if you are still $2+ million short of payout, you are sunk.
Some people hopefully will make some decent money operating these ND Bakken wells. Pay $30,000 per flowing BO now, if oil goes back to $75+ they will payout pretty quickly.
Lots of times the company that drills the well loses money, but the company that owns it later makes money. Easy to see how that happens when a well costs $7-10 million and sells for less than $1 million five years later.
Shallow sand,
Great stuff thanks. I always wonder why they continue to complete new wells at those prices. Maybe they have pipeline contracts that allow them to get WTI minus transport cost. Or there are hedges, it is a mystery.
While I don’t know the exact issues of various companies, isn’t one of the reasons that many wells are actually drilled with borrowed money, and with agreements that require certain drilling regimes, almost regardless of price? If drilling budget was coming out of cash flow, low prices would reduce activity, but if it’s coming out of pre-arranged drilling covenants with external lenders that require payment, sometimes directly out of specific drilling regimes, that’s different. Anyway, I’m far from an expert on how it works, and it may not apply to bigger companies, but I’m not sure this issue gets enough attention.
Of course, you have to think about total costs and covering them from a business perspective.
As you mentioned, the second owner of the well may profit nicely. It’s initial costs that are getting in the way.
Lots of initial costs get erased in society. After a road is built nobody really cares what it cost to build it. The national highway system got built in the 1950s? There were probably Treasury bonds floated. They didn’t get repaid. They got rolled over. Could probably trace their money to paper CUSIP issuance today. Nobody will because nobody cares.
Bankruptcy is a pretty solid answer to these problems. The more sophisticated the bankruptcy filer, the more money the shareholder keeps or even makes. As for lenders, and the purity of the bankruptcy process it could be useful to revisit 2009’s GM bankruptcy process. That won’t be easy because there was some political revisionism in the Wiki.
Lots of Seeking Alpha type folks have been showing up here lately. They haven’t really embraced the idea of society’s descent from oil scarcity. That descent will be measured in bodies, not dollars.
SS , you just hit the ball out of the park . This forum without you and guys like Mike Shellman ,etc would be go The Oil drum Way . Keep plugging . With best for you but I think the oil prices are on the way down from here . I am not an oilman , just thinking out loud . Best of luck,but I see real tough times for the oil and gas sector . Gas has already tanked .
We have been fortunate to have not bought much when oil prices were high. Thankfully we were not the high bidder several times in 2011-14. Would have hurt big time having debt from 2015 to now.
$60 WTI would be wonderful. But we just cannot seem to get there. Maybe this year if the coronavirus issues clear.
I don’t know what oil prices will do. I see alternatives on the horizon. But I think those will take a lot of time.
I think the Permian Basin is the only thing keeping oil prices low on the supply side. Very little growth outside of US.
Demand is much tougher for me to see in the future.
I am also worried about regulatory issues because a “one size fits all” scheme will likely disproportionately harm small producers like us. Our methane emissions are minimal (no wells capable of burning a flare) but if we have to constantly monitor every well with the technology proposed by the Obama Administration, it will be very tough with the present oil prices.
I worry about regulatory because I suspect those in charge know little to nothing about what we do. State regulators with industry experience are few in our area. Most people take the job hoping to move to EPA or some other state agency.
The politicians know even less. Obama wanted to get rid of “big oil” tax breaks, that were limited to the first 1K BOPD. Most of the “breaks” have to do with depreciation acceleration, which is available to other industries. Percentage depletion is only limited with regard to upstream oil & gas. Someone mining ore, gravel etc doesn’t have the same percentage depletion limitations.
Just hanging in there for now, hoping for good times like 1973-1985 and 2004-2014 to happen one more time.
(Before anyone takes offense to the Obama references, please know I generally liked his 8 years. I have his autograph while a Senator in my lockbox. I just point to him to show that even thoughtful politicians won’t have any nuance for stripper well oil producers. If they are anti-FF, they won’t give a crap if they knock us out, even if we aren’t hurting anything.)
Looks like Bakken is on a peak plateau too.
Tony and Ovi,
Agree it looks like Bakken and Eagle Ford may be on peak plateaus at current oil price level.
Basically my model has all tight oil with the exception of Permian peaking in 2022. Permian peaks in 2028 and all US tight oil in 2026.
Dennis
What price do you use in your model. Is it WTI or the local price. I just checked the price of two crudes at Oilprice.com, Coastal Grade A and Giddings. They are roughly discounted by $10 to WTI, similar to the Bakken discount. Just wondering how this would affect your model.
This site has a whole range of prices for different crudes in the US.
https://www.oilmonster.com/crude-oil-prices/united-states/1
I use AEO 2020 wellhad price in constant 2019$ through 2045, then assume flat price at 93 per bo for 2 years then slow decline to 40 per bo by 2075. Clearly future prices even one month out are unknown. Lower prices would result in lower output, higher prices in higher output. Though I expect higher prices would mostly affect decline rate after 2026 peak.
Dennis
Could you run your LTO model for a reference price, say $55 and then do the same with the price raised by $5 so we can see the sensitivity to a $5 change.
Thanks.
Ovi,
As it is a fair amount of work to run these, it is actually 5 scenarios for each price which are then combined to get a US tight oil scenario. Let’s communicate by email.
Ovi,
I am not clear on what you are asking for. Happy to run a scenario or two, but would like to be clear so it is done right the first time. A spreadsheet with specific oil price scenarios would be clearest. Monthly price from Jan 2020 to Dec 2070 would be best.
Ovi,
Here is a $65/b scenario (maximum oil price), for this low oil price scenario, the oil price at the well head is $55/b from 2020 to 2023 and prices then gradually rise to $65/b (all prices in 2019$) and remain at that level until 2049 and then decrease to $42/b by 2066. This is compared with the modified AEO scenario that rises to $93/b in 2019$ by 2045.
Ovi,
My model adjusts for local prices by including a transport cost, for Bakken it is $9/b so I assume the producer gets $10/b less than Brent at the wellhead, for Eagle Ford and Permian it is less because they are closer to refineries or export terminals. I assume about $5/b for those plays.
Thanks Dennis
Ovi,
Please check email.
Dennis
Did you see my response?
New Coronavirus Hotspot: Singapore
With the recent uptick in confirmed cases at 67, the Singapore Minister of Health made some interesting comments. It feels like a breath of fresh air to have something other than CCP propaganda to go off of. Two highlights –
“The coronavirus is actually closer to the H1N1 virus because it spreads more easily than severe acute respiratory syndrome, or SARS, Minister Lawrence Wong said.
“Wong says authorities are unlikely to continue contact tracing if the situation worsens, but will look at patients who come forward.
That’s right, Singapore, a major travel and financial hub, is considering no longer continuing contact tracing. That is, they intend to let the virus run its course through the population and treat only the severely infected because they don’t think it can be contained.
https://www.bloomberg.com/news/articles/2020-02-14/singapore-says-clearly-emerging-coronavirus-differs-from-sars-k6m2zjsc
Due to the long lag between exposure and infection and then recovery, it could take 18-24 months for the virus to runs its course through the populated areas of planet earth. Although we in the West think everything should have the decency to quietly fade away after its two week news premier, that doesn’t appear to be likely with covid19.
China’s debt rearing it’s ugly head again also:
https://www.barrons.com/articles/coronavirus-brings-chinas-debt-problem-back-into-light-51581679800
The pressure on oil prices has only just begun.
IEA Jan OMR released to public.
https://webstore.iea.org/oil-market-report-january-2020
Russia crude oil charts show a negative change for 2020 as on pages 26 & 27.
https://oilprice.com/Energy/Crude-Oil/Russia-Warns-Market-That-Its-Oil-Production-Could-Drop.html
https://energy.economictimes.indiatimes.com/news/oil-and-gas/russia-raises-oil-condensate-output-to-11-28-mln-bpd-in-jan/73766112
https://www.msn.com/en-us/finance/markets/opec-2b-close-to-dropping-early-meeting-idea-as-russia-balks/ar-BB100LY2
Russia crude oil production is probably on a peak plateau.
Don’t quite know how this was missed, but the largest discovery last year was from Russia in the Kara Sea. The official announcement was for gas at 1.x BOE.
But there seems to have been some small print. Rosneft has arranged a 20 to 25% financing stake from India to do oil development in that find that is dependent on securing 40 billion dollars of tax cut spread over 30 years.
That’s really very odd. Why the money would come from India of all places is not clear. One would expect Sinopec or Petrochina, with their pegged currency. But India it is.
ack 1.x billion BOE
US shale crude oil production chart has been updated to include royalty owner production. In Texas royalty production is capped at 25%. Company operated wells produce 100% crude oil but royalty owners get up to 25% and company reported production in quarterlies including SEC filings about 75%.
https://www.kallanishenergy.com/2019/01/11/n-m-commissioner-seeks-higher-cap-on-oil-royalties/
Permian production growth showing some strength but not enough to offset declines from Bakken and Eagle Ford. This implies that US oil production is on peak plateau.
Tony,
Eagle Ford, Bakken, Niobrara, and Anadarko Plays look roughly to be on plateau rather than declining at least through Dec 2019, Permian basin continues to increase, eventually US tight oil will reach a peak plateau, but probably not before 2023, peak year is most likely to be 2025 or 2026, with a greater likelihood (probably about 70% probability) if we widen the window to Jan 2024 to Dec 2027 for peak centered 12 month average output of US tight C+C output.
Tony. Unfortunately most companies do not publish in 10K or 10Q what the companywide or field specific royalty burden is.
Chevron is likely performing better in the Permian Basin than most because it owns part or all of the minerals on around 2 million acres.
There is no limit regarding royalty on private land.
Also, many of these shale wells are burdened with overriding royalty interests and/or carried working interests.
shallow sand,
I agree that Chevron’s growth rate in the Permian is better than most. Permian 2019Q4 production was 514 kboed which is 13% higher than 455 kboed in 2019Q3.
https://chevroncorp.gcs-web.com/static-files/1a9af8e8-3cab-4684-a5cc-da7b6538a8d5
Chevron shale crude oil production was 123 kbd in 2019Q3 according to shaleprofile, which should include royalty production. 123 kbd is 27% of 455 kboed (includes oil, NGLs, gas). 27% of 514 kboed is 2019Q4 estimate of 139 kbd which is also 13% Permian crude oil growth which is impressive.
However, Chevron’s shale crude oil production growth isn’t enough to make a difference because total US shale crude oil is about 7,400 kbd in October according to shaleprofile. Chevron’s share of this is only just under 2%.
Tony. I should be clearer. Chevron’s financial performance with shale is better because the company owns a lot of minerals which bear no expense except for taxes. At least that is my argument.
Of course, what we see on shaleprofile is gross well production. What would be interesting is to see the net each company receives.
Also, many companies own WI in wells where another company is the operator.
We also do not know what was paid per acre, what the lease drilling commitments are, and many other matters which bear on profitability.
I suspect the money to be made by operators in shale post 2014 will be by the smaller, private firms that pick up leases for a fraction of what they cost to drill, and then benefit when oil prices go up.
If oil prices don’t go up, no one will make much money from shale, except the upper management in salaries, the mineral owners, and state’s in tax receipts.
shallow sand,
It would be easy for shaleprofile to give net company production if the data is easily available. I’m guessing it’s not easy to get.
From Texas RRC
https://www.rrc.state.tx.us/about-us/resource-center/faqs/royalties-faq/
“Areas over which the Railroad Commission has no authority include lease and royalty matters (including leasing, payment of royalties and the right to receive royalties), the financing of or investment in oil and gas activities, and bankruptcy.”
“If you have questions about an existing lease or royalty agreement, you may find the information you seek in the courthouse of the county where the land is located. Usually a call to the courthouse can help you determine if any of the documents on file there are what you want.”
The data is definitely not easily available.
Most counties in shale basins now have digital recording and research capabilities available online; it is not necessary however as I estimate +90% of shale leases made after 2012-2013 are 0.7500 net revenue leases. I am often amazed at the overriding royalty burdens attached to newer leases, their Assignees often LP’s or LLC’s and not traceable thereafter. Odd, that. Everybody has their grubby hands in the pot. All leases made post 2012-2013 have very onerous drilling commitments in them to earn, or retain acreage. Between that and loan covenants, and pledges associated with hedging, shale oil and shale gas operators cannot get off the drilling hamster wheel without serious implications to PUD assets pledged as collateral. A lessening of available capital will not help all that, in fact it will just put the shale industry in a bigger crack than it already is. Most PDP, owned by anybody, is discounted by at least 30%, sometimes 50 and terminal decline rates never sleep. Nobody wants to buy that crap, they want the PUDS but it takes money to develop the PUDS.
Making wild ass guesses about the future of shale oil, or shale gas, without completely understanding those sectors dire financial status is really sort of silly. When I am able to ask CFO’s, etc. where the money is going to come from I get the thousand yard stare. They haven’t a clue and if they don’t, nobody does. Hope for higher product prices is not a plan.
Mike,
0.75 net revenue leases are supported by EOG and Pioneer.
EOG quarterly production from company reports divided by adjusted quarterly production from shaleprofile gives an average of 75% for five recent quarters. Pioneer is 76%.
I have updated my chart below for royalty owner production, recent company 2019Q4 reports and recent company guidance statements for 2020Q1 production. Recent guidance is often indicating no growth in 2020.
However, there are still many more 2019Q4 reports to be released over the next few weeks which should clarify 2020 shale crude oil growth.
Tony, PXD has vast Spraberry holdings with 1/8th to 3/16ths leases that have been HBP for decades. No to very little growth in 2020 short of a big spike in prices. Data is one thing, reality another; we have to keep asking ourselves where is the money going to come from for shale to achieve growth, much less replace reserves. At <50/2 it won't be from cash flow. Past lousy results are indicative of future lousy performance. I like your stuff, keep it up.
Mike,
ExxonMobil Bakken production is down to 72 kbd in Dec 2019, including royalty owner production, from shaleprofile. In July 2019 it was almost 100 kbd. 2020 is looking more and more like a slow US shale crude oil growth year.
Tony,
Probably more instructive to look at XOM tight oil for all of the US.
Note that the final few months will likely be revised higher n the future.
Click on chart for larger view.
Mike,
Not at all clear there is a solution to the mess. If poorly performing companies go under wouldn’t somebody buy up the assets that are worthwhile? In that case is it possible the new operator could renegotiate lease terms?
I am just asking because I do not know how it works and you may have heard.
If it is possible to do those things to get out from under debt and onerous lease terms, perhaps the business could be run from cash flow.
Or the whole industry could be shut down gradually as companies go belly up.
Output would fall and eventually prices might reach a level where the industry can gradually start back up, but run smarter the second go around.
Note that this is not what I hope for, but the picture you paint seems so dire it seems something has got to give.
I know you hate my dumb scenarios, how about some smart ones from an oil man with 40 to 60 years experience?
I hope Ron does not mind me posting this here as there’s no ” none crude oil ” thread.
Gridwatch has started a chart/metric of Nat gas consumption this year – its work in progress so its a bit rough at the mo.
some might have already seen it so I post the link for those who have not .
https://gridwatch.co.uk/gas
forbin
Forbin, it’s not my site anymore. I gave it to Dennis Coyne. Too much of a hassle for me and I have other priorities that take up much of my time. But I still do one post a month, the OPEC post. And I comment a lot when I am not busy with my other project.
However, the Electric Power Monthly is the non-petroleum thread. But never mind, you posted in the right place because this is the Crude Oil and Natural Gas thread.
Japan is in recession. Europe is right there on brink of recession. China,Well all 3 of these central banks are going to be easing monetary policy in a big way. A lot of that money particularly out of Japan and Europe since they don’t use capital controls like China does will end up in US assets. Don’t be surprised if the money going to shale oil and gas just keeps coming regardless of how bad the economic fundamentals are. It just might come more so from a different source.
>>Such technological solutions as increased share of horizontal drilling,
>>multistage hydraulic fracturing and multi-hole drilling have allowed Rosneft,
>>Russia’s top crude producer, to slow the decline at Samotlor to 1 percent last year.
Is it not the case that using such technologies to slow down oil production decline now, in the case of Samotlor to almost zero, means later on the decline rate will be much higher? And if they are using this enhanced oil recovery in all their large ageing oil fields, as hinted in the quoted text, this is setting up a scenario where Russian oil production could fall precipitously in future, just like Cantarell?
Yes, that is exactly the case.
Russia has many fields. That will probably be true for that one field, it is not likely that the “steep decline” will happen in all fields at once. Also keep in mind that Canterell was a unique case, there are few giant fields that have declined that dramatically, much of Russian production is onshore, the decline for the nation is more likely to look like the US conventional L48 onshore output decline, about 3% per year.
OT:
1600 — Rome: Giordano Bruno, advocate of Copernican theory & plurality of worlds, murdered by the Catholic Inquisition.
North Dakota was down 43,172 barrels per day in December 2019. December 18 to December 19, their production increased 73,047 barrels per day. That comes to an average 6,087 barrels per day per month over 12 months.
Ron,
North Dakota, including Bakken, is starting to stall.
https://www.willistonherald.com/news/state/bakken-could-feel-pinch-from-coronavirus-as-oil-demand-drops/article_987819d6-51c1-11ea-9a7b-9b9e149763b1.html
State Mineral Resources Director Lynn Helms said the state’s older and lower-producing wells are “really vulnerable” to the price drop that has occurred in the wake of the new virus. Those wells are only profitable at higher oil prices and could idle if prices stay low. “I think we are going to see our inactive well count climb all the way through the middle of the year,” Helms said.
The inactive well count was 1,920 in Dec 2019, up from 1,726 in Nov and up from 1,553 in Jun, according to Director’s Cut.
https://www.dmr.nd.gov/oilgas/directorscut/directorscut-2020-02-14.pdf
The Director’s Cut also showed 16,110 producing oil and gas wells for Nov 2019, an all time high. In Dec 2019 there were 15,979 producing wells of which 14,847 or 93% were unconventional wells. I assume the majority would be shale wells.
Bakken producing oil wells also dropped from 13,520 in Nov 2019 to 13,490 in Dec 2019. The all time high was 13,554 in Oct 2019. That’s a drop of 64 wells or 0.5% from Oct to Dec.
https://www.dmr.nd.gov/oilgas/stats/historicalbakkenoilstats.pdf
John Hess said the “Bakken field in North Dakota where Hess is a major producer will hit its peak production levels within the next two years, said Hess, who spoke Tuesday in Houston at the Argus Americas Crude Summit.”
https://www.worldenergynews.com/news/shale-pioneer-hess-says-key-fields-starting-710765
If the number of inactive wells continue to increase as Director Lynn Helms says then North Dakota oil production could continue declining this year.
Note that a drop in active wells in North Dakota happens almost every winter. When a well is down in need of maintenance, especially the low volume wells, they may wait for the weather to warm up in April to do repairs or maintenance. Though it is supposed to warm up above freezing this weekend, so maybe they’ll work on a few wells. Today the high temp was 5 F, it warms up to 8 F tomorrow. 🙂
It looks like a plateau to me probably in the 1450 to 1550 kb/d range. I doubt they will get to 1800 kb/d unless oil prices rise more quickly than I expect.
Frac spread count at 312 for week ending Feb 14 2020. It was about 480 in Mar 2019.
https://twitter.com/PrimaryVision/status/1228416902747369474
The continued low frac spread counts confirm the statements made by Schlumberger and Halliburton last month. “U.S. shale oil fracking has already peaked and is in a period of sustained contraction, according to two major providers of services to the industry.”
https://www.worldoil.com/news/2020/1/22/us-shale-has-already-peaked-for-major-service-companies
This comment based on analysis of frac spread counts, DUCs and rig counts was interesting. “If the production decline is half as severe as the 2015/2016 cycle, we will be looking at a 500K BBL Day decline December 2019 to December 2020. That is what I am predicting.” https://www.investorvillage.com/groups.asp?mb=19168&mn=246294&pt=msg
Drilling rigs fell quite a bit more in 2015/16 than they have in this case. In 2016 the frac spreads fell to about 160 from roughly 480 in late 2014 (about a factor of 3. Today the frac spread count is rising from Jan low of 275. The frac spread count today is similar to the 2017Q1 count when tight oil output was growing.
Horizontal oil rig count in 4 major tight oil basins (Permian, Williston, Eagle Ford, and DJ Niobrara) fell quite a bit more in 2014 to 2016 (nearly a factor of 4) compared to recently (600 to 529).
Any expectation tight oil output will fall by a similar amount to 2014 to 2016, is likely incorrect, unless we see much steeper decreases in rig counts and frac spreads.
Note that horizontal oil rigs in the major tight oil basins are higher today than at any time in 2017. In 2017 US tight oil output grew by 1361 kb/d from Dec 2016 to Dec 2017.
Sheridan Production Co., LLC is laying off 116 employees. Sheridan is a private company founded in 2006 that bought a lot of onshore conventional production 2006-14. Not good timing. It filed Ch. 11 in 9/19 and emerged from Ch. 11 last month, now owned by its lenders.
At one time Sheridan operated over 30,000 BOEPD, heavily weighted towards oil. Not sure how much is left, has been selling off assets both pre and post bankruptcy.
Permian basin output is likely to depend on the price of oil. Two different oil price scenarios are used with a low completion rate scenario with no more than 488 completions per month (recently the completion rate has been about 488 completions per month). For one case the AEO 2020 reference oil price scenario is used, for the other oil prices rise in line with the AEO reference case up to $60/bo in 2019$ for WTI oil and then oil prices remain at that level until 2074 and then decline. For the higher price scenario the URR is about 60 Gb, and for the lower oil price scenario about 30 Gb. The price of oil will matter. My WAG is that oil prices will be higher than the low oil price scenario, at least until 2050, and it is more likely that oil prices will be close to the AEO oil price scenario and perhaps higher.
Bottom line is that the future is unknown, we do not know what oil prices will be tomorrow, much less 30 or 60 years from now. Also future completion rates are unknown, the scenarios presented have very conservative completion rate assumptions, I expect that if oil prices rise the completion rate might also rise, to perhaps 700 completions per month by 2026, that scenario would see Permian output rise to about 7000 kb/d in 2028 (not presented here).
As before, I would suggest that if the “low oil price” scenario were correct, it would seem that the 3Mb/d decrease in Permian output from 2028 to 2032 that would result might cause oil prices to rise.
Does that seem reasonable?
It is, in my view, part of what makes the low price scenario a low probability scenario. Scenarios with even lower prices than my “low price scenario” would be even less likely at least through 2040, after that under the more realistic AEO oil price scenario, we might see demand reduced as alternatives to oil, whether natural gas, biofuels, or plugin hybrids and BEVs might start to reduce demand for petroleum liquids to less than petroleum liquids supply some time after 2040 and possibly lead to decreasing oil prices.
EIA DPR just released and shows a tiny increase of 18 kbd for US 7 shale regions from Feb to Mar.
https://www.eia.gov/petroleum/drilling/#tabs-summary-2
Permian was the only region to show a positive increase in production. However total gas production from the regions is estimated to fall by 172 mcf/d from Feb to Mar.
Tony
Attached is the net growth chart updated to March 2020. There has been quite a revision to the data back to December when net production fell to 5.3 kb/d. Since then it has bounced above and below 20 kb/d. This small increase of 20 kb/d/mth is consistent with the STEO which is indicating a peak in the lower 48 in May and a peak in the L48 minus GOM in October. There is very little growth projected from March to October. These low oil prices are not going to help.
It will be interesting to see US production for December when it comes out at the end of the month. According to the DPR, it should not be very much larger than November. The STEO is projecting an increase of 28 kb/d over November.
Ovi,
What’s interesting is that monthly base decline keeps increasing by about 6 kbd/month. In Oct 2019 it was a decline of 563 kbd; Mar 2020 593 kbd, which is 6.48% of monthly crude oil production.
DPR production growth has stalled to an average of only 15 kbd/month from Nov 2019 to Mar 2020. During the same period monthly base decline/crude oil production has increased from 6.31% to 6.48%.
Tony
I was looking at the my completion charts and completions have been heading down for most of the oil LTO basins since August. I think completions are the thing to watch to determine what is going to happen to LTO production.
Production growth really slowed in December. I am wondering if there is 4 month lag between the drop in completions and when it starts to show up as slowing production.
Ovi,
As I have pointed out before, the DUC spreadsheet uses models to guess at completions and it includes conventional completions (which have far less output than the horizontal tight oil wells and are less important).
If you want the real data, I checked with Enno Peters and he does not use models for his completion data (he calls these “first flow” wells), it is real data from state agencies and frac focus. The most recent few months will likely be revised higher as the state agency data becomes more complete over time. The DUC data for the most recent few months is not very reliable.
Data in chart below from well status tab with first flow wells selected at
https://shaleprofile.com/blog/permian-monthly-update/permian-update-through-october-2019/
Dennis
I wonder if there is some way of asking DPR staff if they use a model for completions or whether they work with the frac companies to get info from their work schedules. To me it makes more sense to get their info than trying to model completions.
I note that there is a significant drop in completions in Enno’s data from August to October, 151. The first big drop in the DPR completions shows up in November. August to November is only 85.
Ovi,
If you look back at older data from shale profile, you will see there is always a drop in completions for the most recent few months, later updates revise the data as it becomes available. Companies do not make timely reports on completions, it really is that simple. The only reports that are more timely are output data as taxes and royalties are based on that and people want their money pronto.
For DUC spreadsheet see
https://www.eia.gov/petroleum/drilling/pdf/duc_supplement.pdf
EIA assesses monthly completion activity by using
•The FracFocus.org database to observe end-of-completion activities indicated by producers’filing fracking reports
•Files released by the states regarding completion activities of individual wells
With the combination of continuous enhancement of data sources and model methodologies, the DPR strives to provide high-quality forecasts and actual historical settlement of DUC counts.
Bold added by me.
Chart below compares completion data from the most recent US Update through Oct 2019 with the US update through April 2019. For the April report the most recent 4 months had more than a 6% error relative to the most recent report. The data may have gotten better, but we will only know as future updates are published.
Dennis
The first part of the sentence you bolded states: “With the combination of continuous enhancement of data sources”.
My question is what are those enhanced data sources. Are they the completion schedules from fracking companies? Completions have to be a crucial part of the model and where better to get it than from the frac companies.
Ovi,
Haven’t asked them, I just have the document. Pretty sure getting the data from the companies is not straight forward. The data is not even reported to state agencies in a timely manner.
The shaleprofile data is the best we have.
Ovi,
For the EIA’s “official” tight oil estimate there is not a big slow down in output in Dec 2019. In November the increase was 87 kb/d and in Decemver it was 81 kb/d, so yes a slow down in the rate of increase, but a small one. Should the December increase continue as the average fmonthly increase for the next 12 months we would see about a 972 kb/d increase in tight oil output in 2020, I expect lower oil prices may result in about half this rate of increase for 2020.
When the well is completed it flows within a month in most cases, unlikely to be a 4 month lag, that is why Enno calls a completed well “first flow”, it is completed and then it flows, there is no reason to wait. It is like putting a check in a drawer rather than putting it in the bank.
Dennis
I think that the LTO and DPR must use the same data. Attached is the January DPR output. The shape is very close to the LTO data. The only difference is in October. The LTO drops after September whereas the DPR has slight increase after September. I expect that the LTO will also see substantial change in the February update.
So here is what I am seeing for for the December increment.
DPR 6 kb/d
STEO 28 kb/d
MER 15 kb/d
These are small compared to the 203 increment for October to November. So lets wait for the next LTO update and the US total at the end of the month to check on the accuracy of the data and estimates.
As for the time delay. It Just a bit of speculation after looking at Tony’s chart
Ovi,
In your chart you show the change in production for the DPR in Dec at 60 kb/d. Have you switched to the second derivitive?
As I have suggested in the past, the data is not the same because the DPR includes conventional output, if we are interested in what is happening in the tight oil plays, the addition of conventional output just condounds the analysis.
STEO, beyond the monthly data is mostly a model, for tight oil output shale profile and the EIA official tight oil estimates are the only data worth paying attention to in my view, especially https://shaleprofile.com
Enno Peters does amazing work, probably the only thing Mr Shellman and I agree on. 🙂
The chart is the same as yours except it is for the DPR and yours is for the LTO. The chart is the difference between production and decline.
Note that I say the shape is the same. Attached is a chart with both the LTO and DPR. Data for both is from January. I expect the February LTO will have changes similar to those in the DPR. I am aware that the DPR data includes conventional crude.
Ovi,
You said in a previous comment on December increment.
“DPR 6 kb/d”
This may have been a typo as your chart shows about 60 kb/d, I agree the shape is similar, the last 3 “data/model” points of the DPR are best ignored in my view, the “official” tight oil estimate is a better indicator of what is occurring in the tight oil plays. The DPR is more like the STEO, simply economists guesses about the future, for anything beyond the most recent official estimate and with conventional output added to confound understanding.
Ovi,
Ignore my last comment, I did not see the large revision to the DPR, perhaps the EIA’s “official” tight oil estimate will be revised for December. Often tight oil output is lower in the winter months, as output often falls during the winter in North Dakota and Colorado.
The DPR data for Jan to March is based on a model. I have little faith in their model based on past performance.
Ovi,
If we look at L48 excluding GOM for STEO the December increment is 50 kb/d.
I agree that it looks like a revision for Dec LTO output is likely.
The drop in completions in the shale profile data after August 2019 is likely due to incomplete data from state agencies, note that the earlier Permian completion data was not up to date, it was from an earlier Permian update through September. The data below was just checked and is from
https://shaleprofile.com/blog/us-monthly-update/us-update-through-october-2019/
For the Bakken, Permian, Eagle Ford and Niobrara basins only the completion data is in the chart below. Data from
https://shaleprofile.com
Thank you Mr. Peters.
Pretty typical for tight oil output growth to slow down during the winter, pretty cold and snowy in Colorado and North Dakota in winter as far as I know.
Dennis
The main increases are coming from Texas. Not much snow there.
Ovi,
True today but not historically, note that if Niobrara and Bakken are on plateau the winter decreases would be even more apparent.
Did you notice the areas where there were decreases in output in the DPR? Anadarko is an exception, that is just a play that has not been very profitable and capital is exiting, not much snow in Oklahoma either. About 50% of the decrease in tight oi output as estimated by the DPR is from cold weather areas (Bakken and Niobrara). That was what I was referring to, but if you look at the long term tight oil data, almost every winter output either plateaus or decreases, perhaps coincidence, but I think not.
Negative Vaca Muerta articles appearing.
The new Argentina presidential administration has not moved fast enough reassuring oil companies or offering a plan to do what those companies want done. The two months since they came to power seems to be deemed sufficient and it has not happened.
The way it’s being phrased is boom and bust, in the context of employment in the area. The companies being in a pause is enough to shut off employment and create the impression of bust.
The administration seems to be frozen by indecision. There were speeches given during their campaign that were anti multinational. Somehow, now, those speeches are being presented to the multinationals to discourage involvement. It is not clear by whom. There is talk of some measures put into place in the final days of the previous administration and those seem to be difficult to eliminate.
So it looks like the current obstacle is political.
“So it looks like the current obstacle is political.”
Perhaps, or at these ‘low’ prices for oil and gas the projects just aren’t attracting a frenzy of investment.
Why rush to produce into a well-endowed market, just because American shale industry does so?
For 2-3 years now they have declared their own price of oil. That’s not the issue. The opposition put some poison pills in place as their reign ended. Seem to be hard to swallow, especially with the IMF poised to rage about unpayable debt.
Yemen’s deadly ghost ship
https://www.opendemocracy.net/en/oureconomy/yemens-deadly-ghost-ship/
Interesting—–
Another view from the EIA DPR
U.S. Shale Oil Production – All That’s Left Is The Permian And That Won’t Last Forever Either
Summary
Over the coming months, the story that US oil production growth is set to decelerate materially will become mainstream.
Using an estimated 11,728 wells to be completed this year, we have US shale oil growing ~424k b/d y-o-y.
So while the overall figure remains in the positive, all of the growth will be coming from the Permian.
The declining well productivity profile in Bakken, Eagle Ford, Niobrara, and Anadarko combined with lower well completions in 2020 will result in a decline in production. This will be the first y-o-y decline in these basins since 2016.
But to make matters worse, the Permian won’t be able to hold the US oil production growth much longer either. If we assume ~5,500 wells completed in the Permian per year, the rate of growth starts to nosedive after 2020.
The above is just a summary. There is much more and some charts with this article.
Ron.
If Oil Prices rise, the completion rate will rise to more than the 5500 wells completed per year assumed by HFI research. Let’s assume for a moment that peak oil was 2018 as you think and that this is the permanent peak and is never surpassed ( I do not think this, but I believe you have stated as much).
What would you expect might happen to the price of oil? Do you have a rough idea what might happen to the price of oil, if world real GDP continues to grow at about 3% per year, would perhaps $70 to $80/bo for Brent crude for an annual average in 2021 seem reasonable?
Permian output will continue to grow even with the 5500 new wells per month assumed by HFI according to my model, see chart below. I doubt 5500 wells per year is the right number after 2020.
From Jan 2017 to Dec 2018 the completion rate in the Permian basin rose at an annual rate of about 145 completions per year. I doubt we will see that rate of increase again, but rising oil prices as the peak approaches (if it has not arrived) ensures that the completion rate might increase at about 48 per year (an average increase of 4 per month). If this rise continues up to 660 wells per month (7900 per year) by 2025, then Permian output rises to about 6500 kb/d.
Dennis,
HFI says: “This is just the nature of the shale beast. As the base production increases, so does the base decline rate. The proverbial treadmill increases with pace so without a corresponding increase in productivity or well completion rates, the growth inevitably grinds to a halt and turns into an outright decline. By our estimate, total production gain in the Permian from 2020 to 2025 is just a puny ~426k b/d.”
From EIA DPR, the Permian monthly base decline keeps increasing by 3.5-4.0 kbd every month. In Mar it was 289 kbd up almost 4 kbd from Feb. Soon it will be 300 kbd as in chart below. This is what HFI refers to as the “proverbial treadmill”.
Tony,
DPR legacy decline estimate is not very good. Look back at 2015-2016, completion rate went down, and legacy decline was smaller. Many of these models rely on the DPR, that model is not good.
My model is based on average well profiles, and completion rates. The well profiles are based on the data found at https://shaleprofile.com a simple hyperbolic is fit to the data. Future completion rates are unknown, but in the scenario presented I used the completion rate suggested by HFI research.
The model vs data through Dec 2019 matches well.
For the 5500 completions per year scenario we get the following for legacy decline (absolute value) in kb/d. This is for the scenario a few comments up, with peak at about 4900 kb/d in 2028.
Tony,
For a medium scenario for the Permian that has output rising to about 6000 kb/d in 2028 with completion rate rising from 5500 wells/year in 2020 to 7248 wells/year in 2028 we have the following for the absolute value of legacy decline in kb/d.
For scenario above the tight oil output looks like this.
Dennis, Ron, steve, others,
I have a question,
What are the possible other countries in the world that potentially could produce (many) million barrels/day of shale-oil ? Regarding geological rock formation
Russia Bazhenov
Argentina Vaca Muerta
China Fushing
Canada Bakken across border
Mexico Eagleford across border
good list
mexican eagleford heads down to the coast.
can you frack shale offshore in the gulf?
Hickory,
I imagine if it is possible it would be very expensive, probably not a profitable proposition. My understanding is the Mexican sections are mostly gas prone, not a lot of tight oil.
Canadian Bakken
Hickory,
Due to differences in the regulatory environment and perhaps the geology as well, there has been far less output from the Canadian Bakken, also the Montana Bakken has not produced at nearly the level of the North Dakota section, so it may be mainly a geological difference.
Watcher (and Dennis),
If it is only those five mentioned countries, the situation in the U.S. is rather unique.
Moreover when the other nations don’t have very large tight oil resources (and comparable with Argentina).
Is there an explanation why the U.S. is so unique, regarding rock formations or/and presence of tight oil ?
Han,
It is probably less about geology and more about fewer regulations in the US as well as fewer taxes along with private ownership of mineral rights. In many nations the mineral rights bong to the nation, it seems to change the level of mineral development.
There are roughly 700,000 oil and gas wells that have been drilled in the World and roughly 500,000 of them are in the US.
I doubt this ratio will change much in the future.
The US is unique and there is not likely to be significant tight oil development elsewhere in my opinion.
Han,
There are other nations with tight oil resources, but whether they will ever be extracted remains in doubt.
The Vaca Muerta produced 102.2 kb/d in September 2019 (from article linked below.)
https://www.spglobal.com/platts/en/market-insights/latest-news/oil/110419-vaca-muerta-leads-rise-in-september-oil-gas-output-in-neuquen-argentina
They might be able to increase output to 600 kb/d by 2040, the tight oil resource is not very large, more of a shale gas play.
Concho, Diamondback, Devon, Pioneer and Parsley have lodged 2019Q4 reports and 2020 guidance over the last couple of days. My forecast for 2020Q1, based mainly on aggregating company report data, shows a small increase for 2020Q1 of 17 kbd from 2019Q4. There was some strong guidance from Diamondback and Parsley. However, there are many more 2019Q4 reports over the next few weeks which will clarify 2020 production. For example, EOG, 460 kbd; Occidental, 500 kbd; and Continental, 200 kbd, report 2019Q4 later this month.
These 75 companies represent 87% of US shale crude oil production and if this production is adjusted to 100% then US average shale crude oil growth in 2020 should be 300-350 kbd greater than 2019. This means that the whole of 2020 US shale crude oil production will be on a bumpy plateau.
The forecast change from chart above of 17 kbd from 2019Q4 to 2020Q1, grossed up to 100% US shale crude, is 20 kbd growth. My other chart based on EIA DPR which includes about 900 kbd conventional crude, can be adjusted quarterly from monthly, and shows an increase of 75 kbd from 2019Q4 to 2020Q1.
This means that the stalling of US shale crude growth from US shale oil company reports is being confirmed by EIA DPR crude production.
The growth from the EIA DPR chart below has only been a tiny 15 kbd/month from Nov 2019 to Mar 2020 while monthly base decline/crude oil production has increased to almost 6.5%. 15 kbd/month increase on a base of 9,160 kbd in Feb is 0.16% which is almost nothing.
Tony,
The uptick in the base decline % changes from the previous trend in Jan, Feb and March, this is likely due to a poor model result. Look at past data for clues, when the completion rate decreased from Jan 2015 to Aug 2016 what happened to the base decline %?
Are the 87 companies that you follow predicting higher or lower completion rates in 2020 compared to 2019? If the answer is lower completion rates (less capital spending), past data would suggest the base decline rate will fall rather than rise (see red line in your chart from Feb 2015 to Dec 2016 for a clue, to how a slow down in the rate of completion is likely to play out. The uptick in the base decline rate from December 2019 to March 2020 is likely not correct, it should be ignored, as is the case for the most recent 3 months for every DPR.
Dennis,
I only look at company guidance for production
Tony,
Ok thanks.
Tony,
I suppose that depend on how one defines bumpy plateau, if annual output rises by 250 kb/d for 10 years, then at the end of 10 years output has gone up by 2.5 Mb/d, about 30% higher than today’s tight oil output level. Higher oil prices are likely, especially if the growth rate in tight oil output is 250 to 300 kb/d in 2020 (Dec 2019 to Dec 2020). Higher oil prices may lead to higher completion rates which might raise the rate of growth in tight oil output.
Dennis
I have attached a chart that I believe shows that the DPR is getting better. Not perfect but I think improving from the past when the volatility was pretty significant.
Attached is a comparison of the monthly increments taken from the EIA 914 data and compared with the DPR estimated increment for the same month. Note this is only for the onshore L48 to capture the area covered by the DPR. I have only used data since July since that is when I sensed that the DPR data began to improve. As you can see, the match in 4 of the five months is pretty reasonable. September was bad.
Note the chart uses the DPR February data and it shows a 6 kb/d increment for December which is consistent with the low increments estimated by the MER and the STEO.
I agree. The latest DPR had the North Dakota production data correct, (December). Before this was not the case. They would publish data that was no where close to the latest, already published, N.D. production numbers. I think they have heard the complaints that their data has been too far off and are making an effort to get it as accurate as possible.
Of course they don’t have the December numbers for the Permian or Eagle Ford so their December numbers will still be revised when the data comes in.
Ron
Next Friday we will find out how close they came. If the onshore L48 is within 25 kb/d, that will indicate a definite slowing in growth going forward. The Permian well completions started to drop in August and accelerated in November. What happened back in August that made the LTO companies start to reduce completions?
Ovi,
It is doubtful that the completion estimates in the DUC spreadsheet are accurate in my opinion, they differ significantly from the shale profile estimates, possibly because there are many vertical well completions included in the DUC spreadsheet completion data. For an analysis of tight oil it is horizontal well completions that are significant data. Just one more area where there is superior data at https://shaleprofile.com
Ron, there are December numbers published in the tight oil estimates by play, see
https://www.eia.gov/energyexplained/oil-and-petroleum-products/data/US-tight-oil-production.xlsx
For some reason the change in production for the DPR does not match up, perhaps there are revised estimates that are available internally at the EIA (and used for the DPR) before they get published. The updated tight oil estimate should be available soon(in a week or so).
Ovi,
Interesting, it is the final few months which I believe are most problematic, MER, and STEO also are not great beyond the 914 data. So your 914 net production change is for L48 onshore? There’s roughly 3000 kb/d of conventional data in there, which is also likely fluctuating. We can assume it is fixed, but it probably is not. It will be interesting to see how the tight oil estimate changes at the next update.
Dennis
The comparison has to be apples to apples to be consistent and that is why I chose the onshore L48. The DPR only covers the onshore L48 and includes both conventional and LTO oil in those basins. The only states producing conventional oil not covered by the DPR are California and Utah. Not sure about Texas. They probably have conventional wells outside of the shale basins.
Ovi,
What is the difference between DPR and L48 onshore? If this is more than zero then one would only expect the net production change of the two measures to be similar if that difference was expected to remain constant.
Is that what you would expect?
I would not expect that to be the case in general. That is my only point.
Dennis
I don’t think the difference is much between L48 onshore and the DPR. What puzzled me was this statement above “So your 914 net production change is for L48 onshore? There’s roughly 3000 kb/d of conventional data in there, which is also likely fluctuating.” Wasn’t sure what you were trying to convey. So to clarify I compared onshore lower L48 to DPR since I think they are essentially the same. However as mentioned above, California and Utah are not covered by the DPR. Also not sure of conventional wells in Texas outside the LTO basins.
Ovi,
The idea is that the conventional output changes over time, but the change is much smaller than for tight oil in most cases so the correlation between net production change for L48 excluding GOM and DPR for Feb 2007 to Nov 2019 is quite good, with an R squared of about 91%. So using L48 excluding GOM is a good proxy for tight oil when considering monthly production change.
Ovi
STEO for L48 excl GOM has a 50 kb/d increase for Dec 2019. That is closer to the 80 kb/d estimate from the Jan 2020 EIA tight oil estimate.
Dennis
The 28 kb/d I used above was for all of the US. Should have used onshore L48
yes, I guessed that was the case. Not sure why there’s such a big difference between DPR and STEO, perhaps the tight oil estimate will be revised somewhere between these two.
Will peak oil actually matter?
If sales of new vehicles actually did peak in 2018 at 93 million and an increasing number of new electric vehicles come onto the market peak oil could simple speed up the transition.
https://www.cnet.com/roadshow/news/every-electric-car-ev-range-audi-chevy-tesla/
Norway will ban the sale of petrol cars in 2025 and other countries will follow.
The UK will probably ban the sale of internal combustion engine vehicles in 2032.
European countries have various incentives to buy electric cars.
https://wallbox.com/en_us/guide-to-ev-incentives-europe
Once 200 mile plus range becomes the norm these cars will take an ever larger share of the market. Thus the number of gallon consumed will drop dramatically.
Check how Norways oil consumption is doing, then consider they are in a unique position no other country in the world is close to.
Add immigration, globalization and global population growth to the mix. I wont hold my breath for when Evs will impact consumption.
Its easy for politicians to make promises 10-20 years in the future, i say those are worth about as much as a fist of sand in the desert.
Baggen
One of the main obstacles to EV is range, only recently have mid priced cars with a range over 200 miles come onto the market.
In a few more years we will see electric cars with a range of 300 miles for under £25,000.
This will allow many average earners to buy an electric vehicle which will cope with any likely journey.
It is still early days, but there is a real alternative to petrol and diesel engines.
Lets check back in 5-10 years and we can see how much consumption has declined in Norway and then the rest of the world. If its not material in Norway it wont be in any other place either.
Range and prize doesnt really adress immigration, globalization and population growth that i suspect more then enough will cover any consumption mitigated by evs.
Wayne, Baggen, and those below, Dennis, Hickory, Alimbiquated, Eulenspiegel
I am not thinking of the more common current plug-in hybrids like todays offerings that have a large ICE, an electric motor and an low range 50 mile battery.
What is coming is the EV with a “Range Extender Motor”. This vehicle uses its electric motor and battery as the primary propulsion system. It also has a small ICE, approximately 30 hp, to drive a generator to recharge the battery when it gets low. Currently there is a BMW that is an EV that can be bought with the range extender motor as an option. “The gasoline engine is only used to charge the batteries, and is not connected to the wheels. With the Range Extender you can travel 160 to 180 miles.”
https://www.autobytel.com/car-ownership/technology/what-is-the-bmw-i3-range-extender-123805/
However there is, IMO, a better simpler version coming. Mazda is coming out with their range extender version in 2021 and it uses a rotary engine that is lighter, more compact and has fewer moving parts. The rotary has a higher power to volume ratio than a piston ICE. It may be placed on its side and may sit flat under the trunk. I have also read that Nissan is working with a rotary engine developer in the UK.
“A rotary is a pretty good choice for a range-extending engine for not just the reasons cited above, but because it’s pretty much vibration-free and has fewer moving parts than a conventional piston engine, helping with maintenance and longevity.”
https://jalopnik.com/mazda-officially-announces-the-return-of-the-rotary-eng-1829459947
Ovi,
Perhaps it will work out more cheaply, sometimes these ideas don’t work out so well in practice, might not be reliable (Mazda rotary engines were never known for great reliability). Also possible that Teslas and the like may not prove reliable.
Wayne
Norway subsidizes EV sales very heavily and they have the cash to keep subsidizing, so 2025 does not surprise me.
I agree that once the sniff of peak oil starts to propagate through the media and becomes mainstream, the transition to EVs will accelerate. I still think that there will be information brought forward by the car companies regarding potential shortage of rare earth metals such as cobalt and others required to make batteries and the electric motors. A better overall approach will be to have a variety of Plug-in cars/SUVs that have a range of from 50 to 150 miles to satisfy each persons driving needs rather than BEVs with 300 to 400 mile range.
Hybrids are likely to be more expensive due to greater complexity. With charging infrastructure buildout BEVS with 150 to 200 miles of range may be the sweet spot. A plugin hybrid will still need a motor and battery.
However, a plugin hybrid ev [PHEV] is an excellent vehicle for many people, at least as a transition vehicle this decade.
I’ve got one and have drastically cut down on the number of trips to the gas station. No compromise on size, performance , or range when I want to gas up and go long.
He is a new one coming out this summer- looks great. 39 miles electric range before the petrol engine kicks on.
https://www.kbb.com/articles/car-news/2021-toyota-rav4-plug-in/
Hickory,
What year is your vehicle? Toyota hybrids have been quite reliable for me, so plugin hybrids may be a great choice. I agree the RAV4 plugin may be a nice choice.
Hybrids are more complex than EVs, but the industry is already switching to 48V to reduce the cost of ICEs by replacing complex mechanical systems with simpler electric systems plus software. The Ford Puma is a good example.
We’ve already seen this happen with the carburetor, which has been widely replace by electronic fuel injection. 12V is what is holding this back on a lot of other systems. The cost reductions 48V brings will more than compensate for the increased complexity of hybrid.
Meanwhile EV sales are still being held back by limited battery production. A blistering 20-30% annual growth rate is predicted, but even that is only 14-fold increase in 10 years.
Ovi
The trouble is hybrid cars is they have all the complexity of an ICE car plus that of an electric,
Battery technology is obviously improving.
https://www.pocket-lint.com/gadgets/news/130380-future-batteries-coming-soon-charge-in-seconds-last-months-and-power-over-the-air
a battery using different elements would solve that problem
In Europe Battery electric vehicle sales grew by 81%.
https://www.best-selling-cars.com/electric/latest-europe-electric-and-plug-in-hybrid-car-sales-per-eu-and-efta-country/
With more models coming out almost every month, increase in sales could be even higher going forward.
A growth rate of not 80% but 50% would see sales of electric vehicles reach 90% of market share in 9 years.
It’s still the double income green voting middle class buying electric cars.
The final hurdle is other people buying them.
from 2032 every single person in the UK will have to buy one if they want a new car
Ovintiv and Cimarex reported their 2019Q4 results yesterday. Shaleprofile has just updated Permian to Nov 2019.
https://shaleprofile.com/blog/permian-monthly-update/permian-update-through-november-2019/
The decline rate for the 2018 wells is astonishing, according to shaleprofile. In Dec 2018, the 2018 wells produced 2.16 mbd: in Nov 2019 production was 0.91 mbd, a drop of 58% in about a year. The 2017 wells over the comparable period in 2018 showed a drop of 55%.
The chart below has been updated for the above and shows upward revisions for 2019Q4 and 2020Q1 growth. I’m guessing that there could declines for some private companies as raising money to increase production could be difficult. For example, Mewbourne mainly Permian producer, seems to have a hit a peak plateau of 82 kbd, including royalty production, starting on May 2019. Similarly, Endeavor pure Permian, has been on peak plateau of about 100 kbd since Aug 2019, according to shaleprofile.
Bankruptcy risks in the US shale sector are rising, with weak oil prices and tightening access to credit worsening the outlook for some producers just as a “staggering” $86bn in debt maturities start to come due.
Speculative-grade, or subinvestment, debt makes up more than 60 per cent of the total to be repaid between now and 2024, “implying a higher degree of default risk for the industry”, said Moody’s, the rating agency, in a report on Wednesday.
https://www.ft.com/content/76c15898-52a2-11ea-90ad-25e377c0ee1f
I posted a back of napkin calculation of what the shale production in the PB has cost per net flowing BOPD on shaleprofile.com. Hopefully it will be up tomorrow after review for moderation.
I assumed 4 million BOPD after revisions as of 11/19. I assumed the over 25K wells, land, infrastructure and other necessary CAPEX cost $300 billion. I assumed a royalty of 25%.
That comes to an aggregate of $100K per flowing BOPD. About 4 times or more what the stuff is worth at $50 WTI given the extreme early decline rates.
This assumes my fifth grade math is correct.
I’d like someone to poke some holes in my assumptions/math.
Globally pension funds need between 7%-8% return. Only place they can get it is high yield debt. Pension fund money does not care what the fundamentals economics are. It can’t it has promises that have to be met. It’s the largest single source of capital out there. Just here in the US during the mid 1980’s pension funds were 60% of GDP. They are over 120% of GDP now. They are desperate for yield. All the corporate buyback you hear about. That is pension fund money loaning corporate America money who use the funds to do stock buybacks. You get a stock market valuations that are only based in the reality of the need for yield.
Banks might take a step back from shale oil due to the numbers not adding up. But desperate yield chasers from all parts of the world will line up to fill and void.
Crickets are chirping ExxonMobil management.
Compelling returns on capital at $35 WTI? Lol. Try $85.
Shallow sand,
I would think you would want to consider all the oil that will be produced by the 25,000 wells completed, let’s say 300 kb for each well on average, that would be 7.5 Gb of oil produced over the life of the wells (there is also NG and NGL, but I will ignore that for now). Let’s say it is 28.5% for royalties and severence and ad valorem taxes and $13/bo for lifting costs, but about $3 of this is offset by NGL and NG sales so call it $10/bo. At $50/b wellhead price minus $10 minus $14.25 for royalty and taxes we have $25.75/b0 net. So only $193 B net revenue. I figure all in cost for these wells is an average of 8 million (because the older wells were shorter laterals and cheaper), so about $200 billion well cost. I have ignored interest that would add to total cost.
Basically $50/b does not work, note however that the average price of oil from 2008 to 2019 has not been $50/b nor is it likely to remain so.
Norway oil consumption last year grew over 5%, one of the stronger numbers in the world.
Vaguely recall talk that EVs so thoroughly subsidized in Norway that people were buying them with the intent to sell them for a profit . . . somehow. They were a 2nd car, not primary, for whatever reason.
Regardless of all that, 5%.
Depends on what you mean by 2nd car. Older EV models were great for commuting in the city with lower cost for parking and road charge than ICE. But the short range and small size made them unpractical for weekend trips for a family of four. Some families have two cars so then the EV is used during the week and the ICE car on weekends and when both needs the car during the week. Newer EVs have larger batteries, fast charging and pricing starts to look more attractive so mid to upper income families will likely replaced the ICE with and EV or PHEV when it gets to old.
Not sure of what explains the oil consumption growth, is it trucks perhaps? I doubt it is petrol.
From where did you get the 5% figure?
According to statistics Norway (https://www.ssb.no/en/energi-og-industri/statistikker/petroleumsalg/aar). Total sales of petroleum products have declined every year for quite a few years now so even if it bumped up a little in 2019 the trend is still down. In 2018 sales of gasoline and auto diesel declined by 2%. Figure for 2019 will be released on 15 April. Preliminary figure for Jan 2020 is a decrease by 7% (https://www.ssb.no/en/petroleumsalg).
Norway oil consumption:
2016 216K bpd
2017 223K bpd
2018 234K bpd
The growth is strong. The absolute number isn’t big. Small population. They don’t go anywhere.
Though their oil funded Sovereign Wealth Fund is buying a multi billion dollar very long highway along a coastline, above and below the ocean. Driving distances are going to get very long.
Norway oil consumption was 230,000 in 2013 and has been bumping around there since.
I found out where this data comes from:
https://www.ceicdata.com/en/indicator/norway/oil-consumption
It really can’t be that hard to provide a link. It’s likely that Watcher is not walking around with these numbers memorized 🙂
From the official figures that Jeff posted:
product annual sales
2016 8 735 140 thousand liters/yr -> 2,307,579,858 us Gal/yr
150,527 bbls/day
2017 8 545 834 000 liters/yr -> 2,257,570,503 US Gal/yr
147,265 bbls/day
2018 8 589 832 000 liter/yr -> 2,269,193,546 US Gal/yr
148,023 bbls/day
One wonders about the discrepancy from Watcher’s figures, are they boE thus including propane, etc.? Looks like they come direct from BP (pg 20):
https://www.bp.com/content/dam/bp/business-sites/en/global/corporate/pdfs/energy-economics/statistical-review/bp-stats-review-2019-full-report.pdf
Which includes “Inland demand plus international aviation and marine bunkers and refinery fuel and loss. Consumption of biogasoline (such as ethanol), biodiesel and derivatives of coal and natural gas are also included.”
Norway ran 286 kbpd thru their refineries in 2018 (BP pg. 26), that would account for some “consumption” as process fuels that isn’t “sales”.
Also, pg 21 10.4 MTO 2018 consumption doesn’t match with 234 kpd -> 11.65 MTO using BP’s conversion of 1 bpd = 49.8 tonnes/yr. ???
From actual sales, both motor gasoline and auto diesel (dutiable) are down, 3% and 1.5% respectively, so EVs and fuel economy standards are having an effect.
What’s up is marine fuel and non-dutiable diesel.
This guy says: increase in water transport and farmers getting bigger tractors (farm diesel is non-taxed).
http://folk.uio.no/roberan/t/norwegian_emissions3.shtml
Main reason is probably marin bunker. This has nothing to do with domestic driving or demand. Stricter sulphur rules came into effect a few years ago in the baltic sea similar to IMO2020. Ships then started to refuel in Norway instead of harbours in the baltics, poland, sweden etc.
Will Norway be satisfied with their political leaders as long as they are in this situation?
(btw the above comment was deleted)
https://thehill.com/opinion/energy-environment/470782-does-trump-have-a-bunch-of-losers-to-thank-for-a-growing-economy
I think Venezuela sold gasoline locally for 15 cents a liter until rather recently. That would certainly promote consumption. Does Norway do something similar because they are such a significant producer? Or perhaps Norwegians get complacent because they hear of these recent North Sea oil finds?
Norway has quite a high tax on petrol and diesel
https://taxfoundation.org/oecd-gas-tax/
So they can use some of this money to subsidize electric cars
banning the sale of petrol and diesel cars will obviously erode consumption quite dramatically after 2025. This will mean Norway will be able to export more oil and get even more foreign currency.
It also has a considerable wealth fund from oil and gas
https://www.nbim.no/
“Based on existing reports, the spread of coronavirus started in Qom and with attention to people’s travels has now reached several cities in the country including Tehran, Babol, Arak, Isfahan, Rasht and other cities and it’s possible that it exists in all cities in Iran,” health ministry official Minou Mohrez said.”
https://www.reuters.com/article/us-china-health-iran-official-idUSKBN20F1R7
Iran seems to be in further troubles … and if it’s true then also the world with lots of pilgrims on their travel back home all over the world – maybe peak oil demand was 2019 …
“It comes as four die and 18 test positive for the virus in Iran as authorities struggle to trace the source of the outbreak after it emerged that none of the diagnosed patients have traveled to China or been in contact with anyone who had.”
a worrying development
There will be more of these sudden developments in the next 4-6 weeks. Countries with poorly developed national health care systems (and I would probably include the US in this because of our high number of uninsured) will not realize they have a Coronavirus problem until folks start dying. China has industrial connections to many nations who fit this profile for resource procurement for their rapid industrialization. Many of these global companies are based or have bases in Wuhan, which is considered the Chicago of China because it is (was) a thriving center of China’s industrial might. Some of these countries (Ethiopia, Cambodia, Iran, etc) are still maintaining their flights to China to this day. Because of the long incubation period, Covid19 takes about 6-8 weeks to develop into a crisis. It is also taking about 4 weeks after contraction for folks to die of it.
How many airlines will be able to survive 12-24 months of severely reduced travel?
I work in construction and we are already seeing supply problems because of the loss of China’s manufacturing. Many ripple effects in numerous industries are just gaining steam and will cause disruptions at least through year end even if there is a sudden improvement in the spread of the virus, which seems increasingly unlikely.
Stephen,
Yes, the next weeks are critical
BBC world news:
“WHO says: narrowing window to contain coronavirus outbreak”
“U.S. business levels fall sharply amid coronavirus”
Woodmac says “Permian production growth is decelerating rapidly. Independent producers, constrained by capital discipline, have cut drilling rigs and are shifting focus from growth to generating free cash flow. That will progressively show through in production. We expect Permian tight oil production to increase by just 0.6 million b/d from January 2020 to December 2021 – a fraction of what we saw in the two prior years.”
https://www.forbes.com/sites/woodmackenzie/2020/02/21/have-we-passed-peak-growth-for-tight-oil/#253f71543963
Could shale crude oil production from the Permian Bone Spring formation be about to enter a peak production plateau? Bone Spring produces less oil than the Spraberry and Wolfcamp formations but EIA shows Dec 2019 Bone Spring at 670 kbd which is still significant.
https://www.eia.gov/energyexplained/oil-and-petroleum-products/data/US-tight-oil-production.xlsx
Occidental, which owns Anadarko now, appears to be on an oil production plateau since mid 2018 for Bone Spring of about 85 kbd which is 13% of total Bone Spring.
Similarly, Concho Bone Spring production appears to be on an oil production plateau since mid 2015 of around 60 kbd. Both of the charts are from shaleprofile.
Bone Spring production continues its recent growth from Jul 2019 at 602 kbd to Dec 2019 at 669 kbd. I don’t know which companies are contributing to that growth 67 kbd. According to shaleprofile, Occidental and Concho are not contributing.
A new post on “Non-OPEC Production” has been published.
http://peakoilbarrel.com/non-opec-output-reaches-new-high/
A new post on “Open Thread Non-Petroleum” has been posted.
http://peakoilbarrel.com/open-thread-non-petroleum-7/
Peak oil happened in the last half of 2018 – I’m sure of it. How can I be sure?
ASPO-USA finally closed down in the summer of 2018, and sent notice to the State of Colorado that we were surrendering our corporate charter. The forces running the universe saw that and decided it was finally OK for oil extraction to peak!