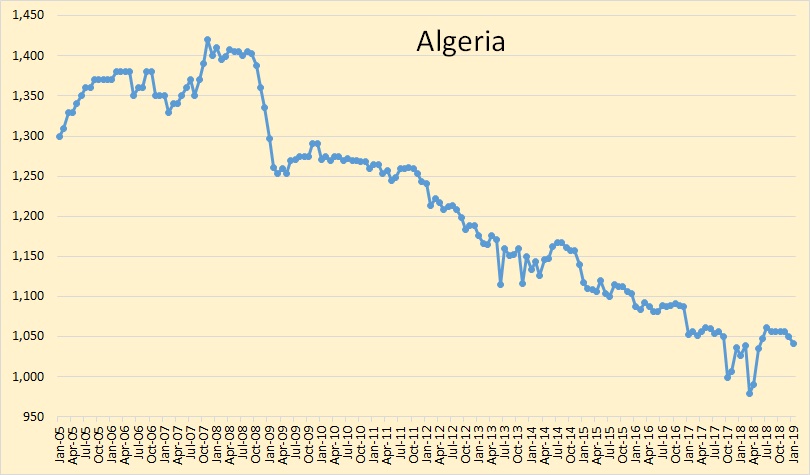
The data below is taken from the OPEC Monthly Oil Market Report. All OPEC data is through January 2019 and is in thousand barrels per day.
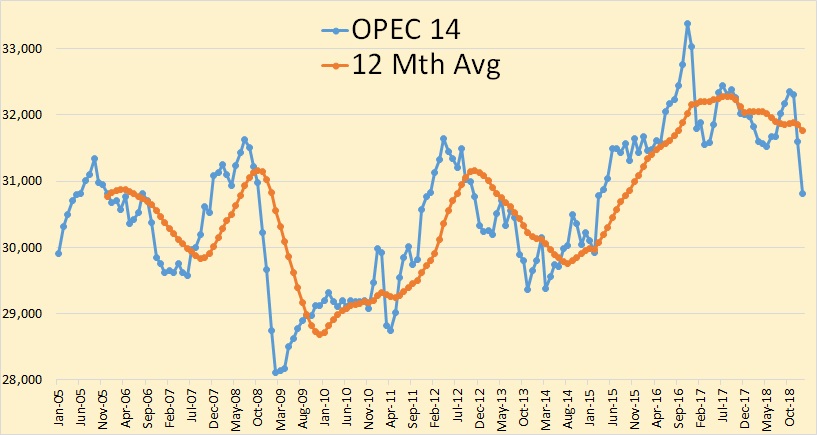
OPEC 14, crude only, was down just three thousand barrels short of 800,000 barrels per day in January.
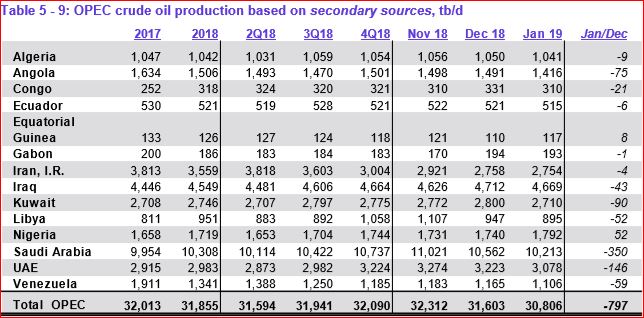
The difference between what Saudi says they produced and what secondary sources say Saudi produces is 51,000 bpd. But the difference between what Iraq says they produced and what secondary sources say is even more remarkable.
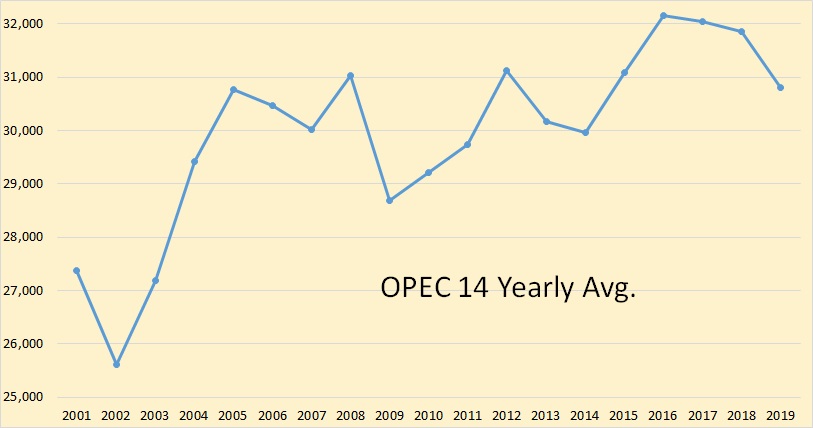
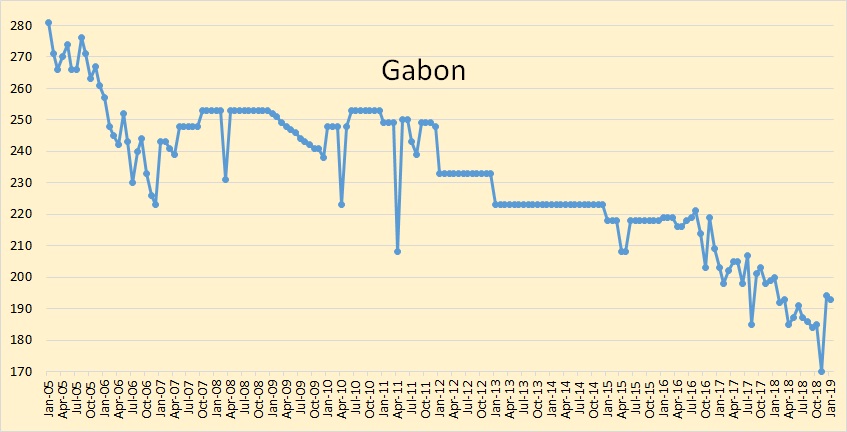
OPEC 14 peaked in 2016 and, in my opinion, have been producing flat out since then, except for January of course. The 2019 avg is January only.
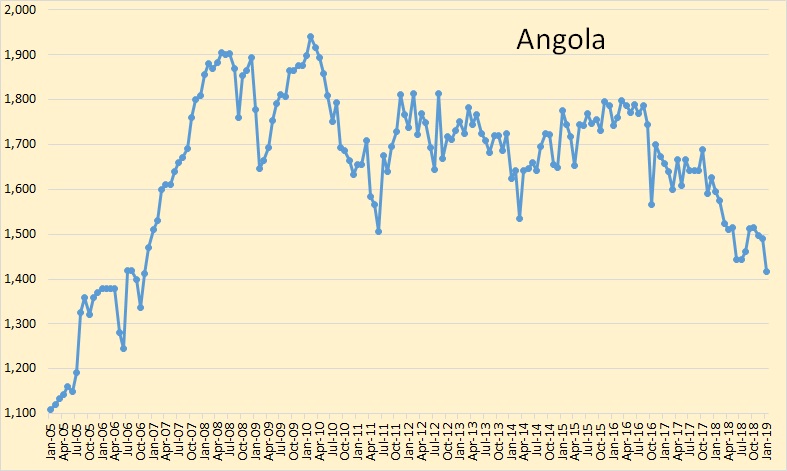
Angola was down 75,000 barrels per day in January.
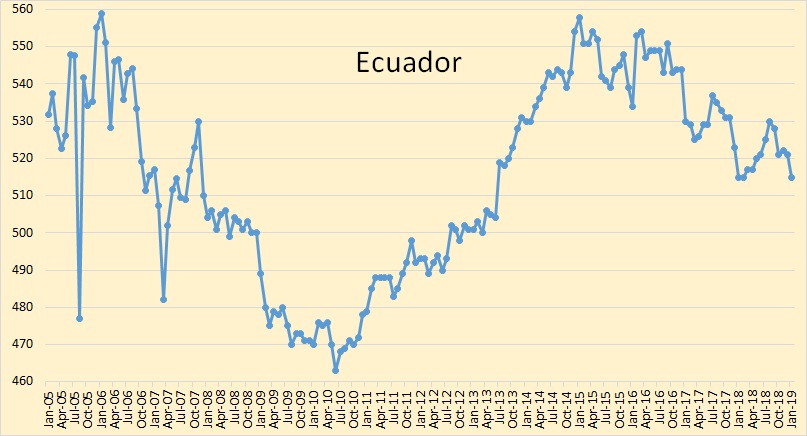
Ecuador peaked exactly four years ago and is down 43,000 bpd since that point.
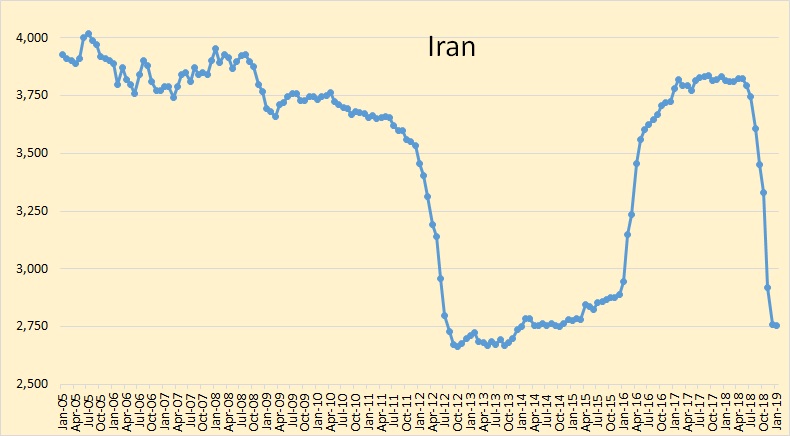
It looks like Iran has reached their post sanctions level of production.
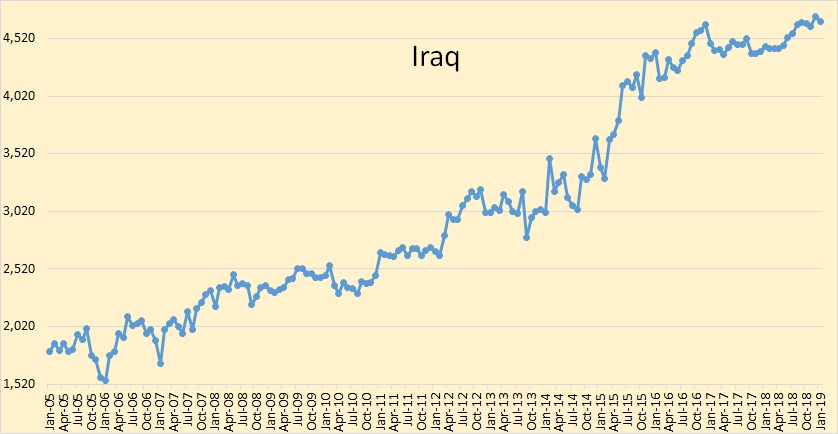
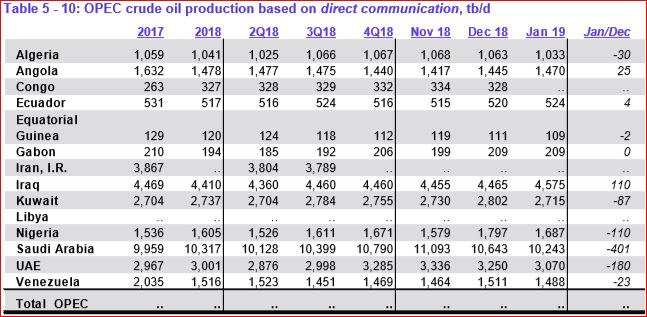
Iraq showed little interest in cutting production in January. Via direct communications, they said they were up 110,000 barrels per day though secondary sources said they were down 43,000 bpd, a 153,000 bpd difference.
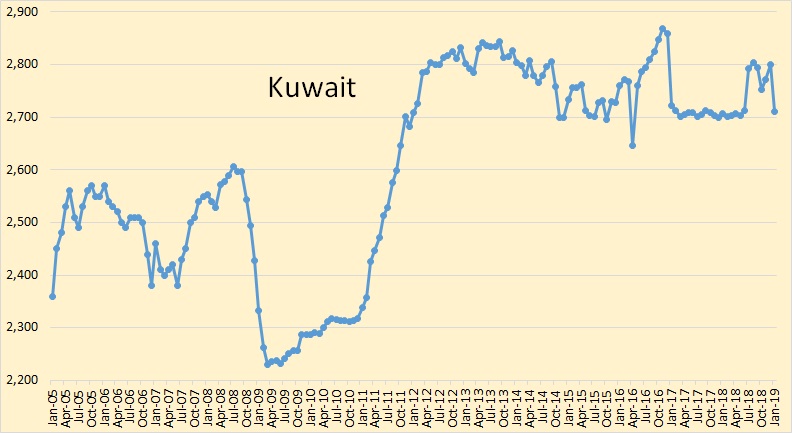
Kuwait’s monthly peak was in December 2016. Their annual peak was in 2013. They are now back to a level they have been able to hold.
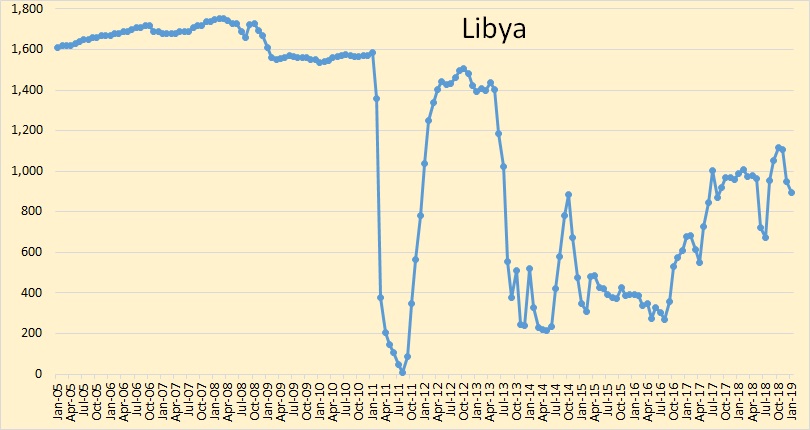
Libya, like Iran and Venezuela, is exempt from quotas.
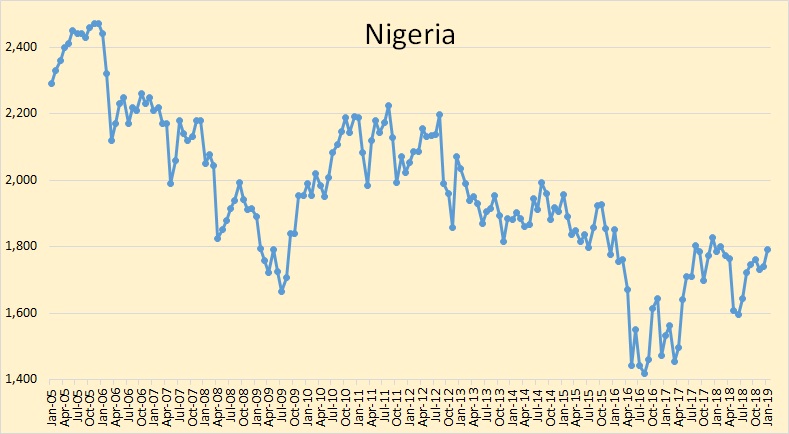
Nigeria claimed they were down 110,000 barrels per day but secondary sources says they were up 52,000 bpd. Perhaps with all the political problems they are having, they are in no mood for cutting production.
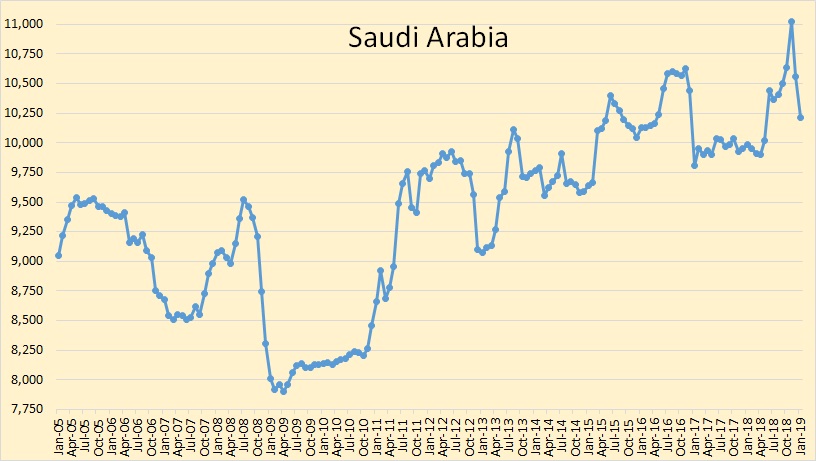
Saudi Arabia, the big dog on the block, was down 350,000 barrels per day in January, though they said they were actually down 401,000 bpd.
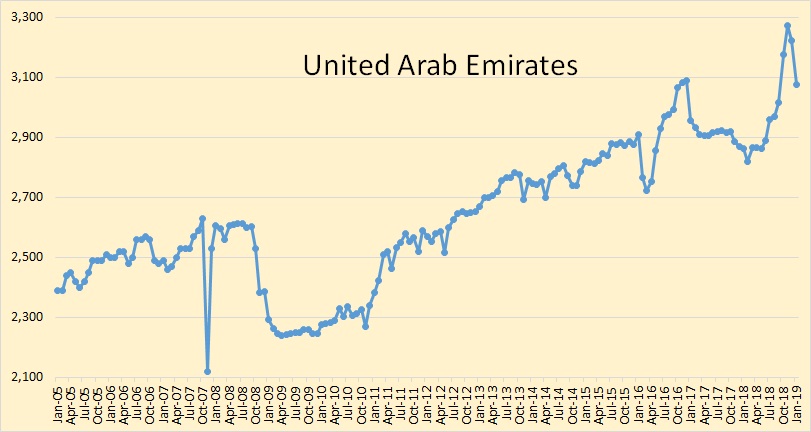
The UAE was obviously prepping for their quota cut for the last three months in 2018. They are now backs to what they can probably hold for awhile.
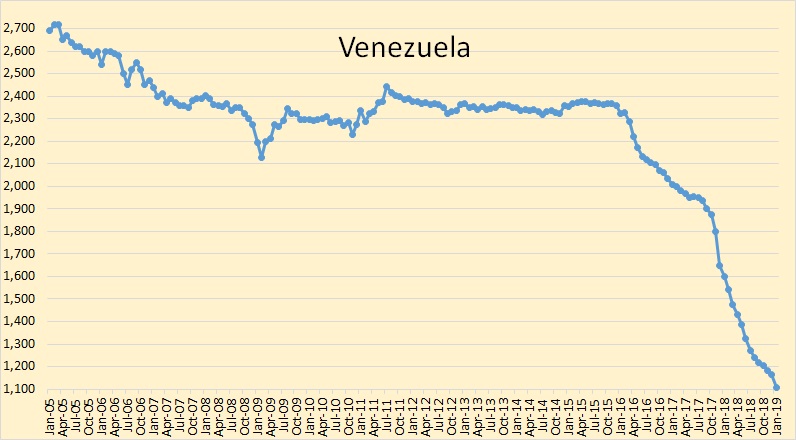
The sad story of Venezuela continues…
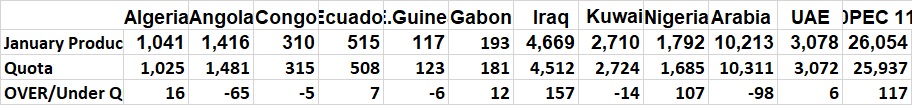
Eleven OPEC nation are subject to quotas. Here are their over or under stats.
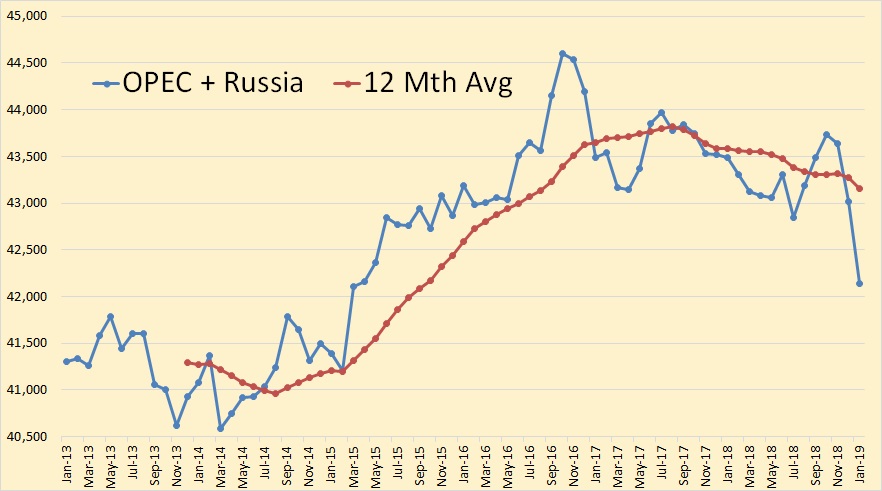
OPEC + Russia, down 1,590,000 barrels per day since October, should be enough to move the market. And it does seem to be up about 1.5% this morning.
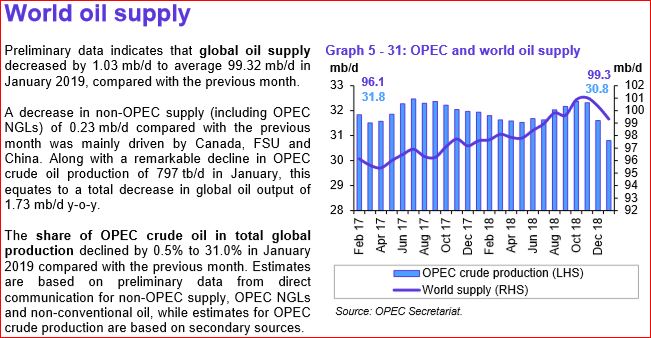
They are saying Non-OPEC liquids were down 23,000 barrels per day in January.
284 responses to “OPEC January Production Data”
Thanks Ron. I always find your charts to be more informative than just the momr numbers. It seems that the chart for Angola is missing, and they are down quite a bit for the month. Is that an oversight or is there something else up with that.
Sorry about that. Angola is up now. I just missed them accidently.
Some other stuff from OPEC’s MOMR.
Forecast for Non-OPEC output increase in 2019 seems pretty high at 2.33 Mb/d from Q4 2018 to Q4 2019, I doubt it will be even half this level. Though OPEC includes NGL and processing gain in their estimates and I focus on C+C, I expect non-OPEC C+C output to increase 1 Mb/d at most from 4Q2018 to 4Q2019, my guess would be 750+/-250 kb/d.
Yeah the forecast increase is mostly from the USA with a bit from Brazil
OPEC MOMR forecast for 2019
US total supply +1.8, Oil +1.29, NGLs +0.48, Biofuel +0.03
Brazil – oil production could rise substantially in 2019 if the delayed FPSO vessels and other scheduled facilities come on line in time during the year. Liquids supply is expected to rise by 0.36 mb/d to average 3.63 mb/d in 2019.
Double checked EIA’s estimate for US C+C+NGL and it is a 1.35 Mb/d increase from Dec 2018 to Dec 2019 in the most recent STEO, 0.79 Mb/d of this is C+C. So their estimate is different from OPEC estimate if one looks at the Dec to Dec increase. However if we take the annual averages for 2018 and 2019 the difference is 2 Mb/d for the STEO, in my mind the Dec 2018 to Dec 2019 increase is the important number to focus on and the C+C number is more important than total liquids.
A question here:
The graphic states some really “big” changes like Vietnam – what’s about all the other non opec states, especially China. Are they exactly flat?
And Russia commited a cut – I think they’ll keep word as last time.
China is not flat. No one is ever exactly flat.
Russian average oil production in 2018 was 11,115,000 barrels per day. Their quota, if they keep it, is 11,191,000 barrels per day. That is a 76,000 barrels per day increase over their 2018 average production.
Their production in December was 11,408,000 bpd and 11,330,000 bpd in January.
Russia
OECD Stocks
The EIA’s STEO released today.
https://www.eia.gov/outlooks/steo/
They forecast US C+C production to increase +0.79 million barrels per day during 2019
From Dec 2018 11.93 million barrels per day
To Dec 2019 12.72 million barrels per day
The EIA’s forecast might not be too far off, but I think they expect maybe 200 kb/d higher output in the GOM and my interpretation of George Kaplan’s and SouthLaGeo’s recent comments is that flat or possibly declining GOM output is a more likely scenario.
If I have interpreted correctly and their assessments are correct (they both know way more than me) then this would imply about a 600 kb/d increase primarily from tight oil in 2019 (Dec 2018 to Dec 2019). With enough pipeline, refinery, and port capacity that is a possibility especially if WTI returns to $60/b or higher by Dec 2019. My guess is the EIA expects oil prices to be lower than that.
It is doubtful that both the STEO oil price and output predictions will be correct.
Looking more closely at the STEO, lower48 excluding GOM increases 520 kb/d from Dec 2018 to Dec 2019 (seems reasonable, this will be mostly tight oil). GOM increases by 270 kb/d from Dec 2018 to Dec 2019, I will let others more knowledgeable than me comment on that forecast. Alaskan output is supposed to be flat in 2019.
WTI is supposed to rise from $50/b in Jan 2019 to $56/b in Dec 2019, it is not clear if that is a high enough oil price to spur higher tight oil output, especially as interest rates continue to rise.
Venezuela production should take a larger drop in February. Today Interim President Guaidó announced Feb 23 would be the day a big push would be made to push humanitarian aid columns into Venezuela. Collection points for food and medicine are now available in Colombia and Brazil, and others are being prepared.
Maduro moved 700 special forces (FAES) which are usually kept serving as death squads in large cities, to cover the bridges between Ureña in Venezuela and Cucuta in Colombia, with orders to fire on the humanitarian relief trucks. Guaidó responded the border was plenty long and Maduro lacked enough FAES and Cubans to stop the relief from crossing the border. He also pointed out that if Maduro had to use death squads to patrol the border it meant he didn’t trust the Army, the National Guard or the National Police, so he asked for volunteers inside Venezuela to help overcome Maduro’s thugs with sheer numbers.
Today it became very common to see an individual scream “Maduro!” and the crowd respond “f…k you!”. It’s the way people pass the time at metro stations and while waiting in line. And the police seem to have abandoned the usurper, because they seldom do anything about it.
PDVSA can’t keep operating long with that US sanction on payments.
Yesterday the National Assembly named a new PDVSA board of directors. They also named boards for PDVSA subsidiaries, all the way to CITGO. The paperwork will be in the USA this weekend, and next week CITGO’s new management can start sending dividends to accounts controlled by Guaidó. The new PDVSA board will also notify entities doing business with PDVSA that all contracts and agreements made with the “Maduro PDVSA” are illegal, and those participating in what amounts to looting and robbery will be prosecuted to the full extent of the law.
Given that US Democrats who are interested in helping Maduro now control the House, I have proposed that 200 million USE from CITGO dividends be used to create a heavily armed police force with 20 thousand volunteers. This sidesteps the communists in the US Congress who are likely to leak plans to their Castro spy network contacts.
Fernando,
LOL. Yes it is clear that Castro rules the World.
You may not realize how ridiculous some of the political stuff you say sounds.
Castro died of old age.
I think Fernando believes Raul Castro is the new World leader, responsible for every bad thing that occurs world wide. 🙂
The Castro dictatorship has between 22000 and 40000 agents, military personnel, administrators, and specialists in torture in Venezuela. The lower figure is from a Cuban government statement informing that 22K Cubans would be voting for the new Cuban communist constitution in February.
Cuba’s ruler is Raul Castro. They set up a stooge called Diaz Canel as nominal president, but the real power is held by Raul, his son Alejandro, and Alejandro’s son Raulito.
I understand Americans, Europeans, etc who favor Marxism and may be closet communists are not about to accept these facts. I have spent my life watching your performances all over the world, and I realize you will always favor, cover up, or deny, the grossest abuses and the imposition of misery because that’s fundamental to your ideology.
In other news, Liborio Guarulla, the tribal chief and Assembly deputy who represents Amazonas tribes, announced they had successfully begun to bring food and medicine to Indian tribes using river launches which crossed the Colombian Venezuelan border using three rivers, including the Orinoco. The launches were escorted by Indian warriors, and the army border posts didn’t try to stop them.
I’m told this self declared president was elected to the National Assembly from a fairly small district in an election with a small turnout. I’m further told that his leadership of the National Assembly is a result of his being the leader of a fairly small party, and the leadership of the National Assembly rotates among the various parties. It happened to be his turn. On that schedule, the orchestration from Washington has unfolded and we see what we see.
I’m also told that the other opposition parties are about three-quarters opposed to this guy declaring himself president, largely because no one had ever heard of him prior to January, other than his friends from the Washington DC university where he was educated.
The people who live in the barrios, who are two things, poor (subsidized) and the majority, do not favor this guy, of whom they have never heard. Obviously their subsidy for decades has come from oil. One might ask, why is this wrong? The oil is under their country and the proceeds from that oil funds their subsidy.
If you want their support, outbid Maduro. No one has seemed to want to build huge apartment complexes with excellent air conditioning and fully funded electricity for those people in the barrios — because perhaps they don’t want to separate themselves from their own money. So outbidding Maduro hasn’t happened. And let’s not pretend that this isn’t the way that politics is done in the United States. It is exactly the same way. Budget is allocated for votes. Let’s not pretend otherwise.
The alternate approach, being pursued now, is to try to cut off that subsidy flow from the oil via sanctions. This was tried some years ago by getting control of the oil union workers management and orchestrating strikes to shut off the oil flow and thus the subsidy to the poor. Chavez pointed out what had been done and the populace decided that any faction who would inflict that sort of pain on the country to further their own ends must be denied power, and Chavez was re-elected over and over.
I suspect this is not going to fly. At least not until you can manufacture some evidence of al-Qaeda having control of Maduro, and maybe some alleged chemical warfare attacks. The chemical warfare card is a good one to play, when all else fails.
I don’t think it is going to fly also.
But I have no contacts in country now.
Things seem to be sputtering on the coup attempt by the US.
Maduro was to gone quite a while ago according to MSM .
Obviously they are a flawed propaganda source.
“Obviously they are a flawed propaganda source.” Yes, if only it came from a truly legitimate source such as “Moon of Alabama – Where Barflies Get Together” that you frequently link to it would be so much more believable.
Hint–
Maduro is still there—
Where the Barflies hang?
The National Assembly just approved the new PDVSA boards. The process is slow because lawyers have to make sure all the paper work will meet US Court requirements (the target is CITGO and the state bank accounts).
Yesterday I heard a recording which discloses Maduro’s murder squads, the dreaded FAES, number 1600. About half are convicts taken from penitentiaries. In addition to the FAES, Maduro counts on Cuban military personnel placed in the chain of command, the SEBIN (equivalent to the KGB), and colectivos, armed motorcycle gangs which number about 10 thousand, and the National Police. But it looks like the National police is split. The armed forces will not fight for Maduro, they are kept in check by the SEBIN, a military intelligence outfit similar to the Soviet GRU, and Cuban agents.
The next steps are therefore for Guaidó to have full access to the CITGO dividend flow, as well as claim all the funds owed from recent oil sales. That money is needed to buy food, medicine and weapons. The idea is to try to enter Venezuela with food and medicine on February 23 via multiple entry points, and try to get army units to take sides with Guaidó. If that doesn’t work the CITGO funds will be used to buy weapons, and the next time an effort is made to take food in, if the regime has groups loyal to it blocking access, they will be dealt with.
Maduro’s FAES appears to be his main fighting element, he sent 700 to Ureña to block access from Cucuta in Colombia. But they can’t put more elsewhere because they are needed as terror and hit squads in the main cities to stop people there from revolting. And the Cubans don’t appear to be working in compact units, they are placed in individual units. So I don’t expect to see a Cuban infantry company appear anywhere, they learned the lesson in Granada.
Yesterday I saw an interesting video: a young man, dressed in military fatigues, approached Venezuelan National Guard soldiers who were on the other side of the Colombia-Venezuela barrier. He asked them to approach him and explained he was a Venezuelan who had served in the US Marines in Afghanistan, that many guys like him, Venezuelan citizens veterans of the US Middle East wars, were getting organized to escort the food into Venezuela. I have a grandson who served in the Middle East in the Rangers, and he told his mother he wouldn’t mind if they sent him to see some action, but right now he’s in some sort of program going to college to be an officer, so I doubt he’s going to be sent. My guess is the US may be organizing forces which have dual nationality so they can chat with the locals they meet, if the US does send troops in.
Remember, this effort is intended to put Maduro down in a peaceful manner. But if he doesn’t want to cooperate then he will be put down, period. And anybody who backs him is also likely to end up dead. The process is irreversible.
Watcher,
Start here:
The National Assembly is the legislature of Venezuela.
If the Speakership of the National Assembly rotates then that is the way the National Assembly operates. Whoever is rotated in is the Speaker, and that is currently Guaido.
The Venezuelan constitution allows for the Speaker to act as Interim President when there is no legally elected President.
In the last election for the National Assembly the parties supporting Maduro lost the majority. Subsequent to that loss Maduro called a special election for a Constituent Assembly that was to draft a new constitution for Venezuela. That election was declared fraudulent by the usual suspects: Most of the countries of South America, the EU, the OAS, the US, Australia and so on.
After the Constituent Assembly first convened it declared itself able to make laws that overruled any made by the National Assembly (the nation’s legislature, remember) that did not support Maduro’s policies and act in solidarity with them.
The Constituent Assembly subsequently declared that the National Assembly had no authority to make laws anyway.
The election that Maduro is said to have won was scheduled for December, as presidential elections are in Venezuela, but moved to April–by the Constituent Assembly–then to May, which is why it was called a snap election by opponents. The election had the lowest turnout in the country’s era of democratic elections. It was declared invalid by the usual suspects, for good reason.
This is why the current Speaker was able to declare himself the Interim President: because the election was re-scheduled by a body that lacks the authority to do so and the results were thus invalid. Got that so far? (Maduro had declared that parties that boycotted elections had removed themselves from legislature and couldn’t run in elections anyway.)
Now, it is correct that the poor (a couple of million of whom have left Venezuela in the last few years) were given subsidies by the governments of Chavez and Maduro. The subsidy programs were funded by using PDVSA, the national oil company that supplied 97% of export income to the country, as a piggy bank while overlooking the fact that it costs money to keep an oil industry going. Objections to the results of this led to more than 14 000 oil workers fired by Chavez and an ongoing loss of expertise and experience as oil workers have left the country for some years now. Those policies, along with Maduro’s helpful appointment of a general to lead PDVSA, have contributed to the degradation of the national oil industry that is reflected in Ron’s charts. Byproducts are poverty increasing along with malnutrition and lack of medicines and the other reasons that so many Venezuelans have left Venezuela.
It doesn’t matter where Guaido went to school.
Not an expert on the National Assembly, but I read someone’s translation of the relevant item in the Constitution as regards interim presidents. There is nothing in the Constitution that allows an individual to become the interim president because someone declares an election invalid. The relevant text only allows an interim president if the current president abandons his post, which seems to be interpreted as leaves the country.
This has not taken place. There is no valid text to allow the Speaker to take power because his party declares an election invalid. There is no law permitting this and claims to the contrary are not correct. The quoted law only permits it when the president abandons his post.
Now the reason the speakership rotating is significant is the presentation of the situation with the suggestion that the individual was elected by the National Assembly to the post of speakership. I believe this suggestion came out of Pompeo or it may have been Bolton. This elevation of the individual in question to some supposed acclaim by the National Assembly via votes is not correct. The guys small party happened to be scheduled for that position and Washington orchestrated their scheduling around that. Odds are extremely high that if the National Assembly was voting for a Speaker it would not be him. It would be someone from one of the larger parties.
The entire exercise is an external coup d’etat.
Oh, by the way, why do you think it is the poor who left? One would think it was the middle class seeking some place with more potential for themselves. Why would the poor leave those subsidies? How would the poor fund the travel?
And of course this would suggest Maduro’s majority becomes even larger, if it was the non poor leaving.
Hi Watcher.
Article 233: The reasons are absolute absence, or permanent inability to serve, for reasons of death, resignation, physical or mental incapacity, abandonment of office, or the popular revocation of his mandate.
The present situation isn’t one of getting the President out of office, though–it’s that Maduro was re-elected in an election that was fraudulent because it was convened by the Constituent Assembly, itself created in an election declared fraudulent because not done according to the constitution. Thus, Maduro’s term ended 9 January 2019 and there is no President. That’s the opposition position.
With no president in office the Speaker of the National Assembly, the current one whoever that may be, becomes Interim President.
Why do I think it’s the poor who have been leaving? Because some million of them have crossed into Colombia with some moving on to Peru and Ecuador, for a start, and others into Brasil, where indigenous people are moving humanitarian goods across the border into Venezuela past the border guards.
The subsidies aren’t for everybody poor in Venezuela either but you’ll have to ask FernandoL for details.
The poor aren’t the only ones leaving, no; there’s been a great drain of oil workers and management (?) from PDVSA. This bodes ill for restarting Venezuela’s oil industry even if, or when, the country settles down to where that would be possible.
Synapsid has it right. And Watcher is doing his best to argue in favor of a communist tyrant. We have seen plenty of this here over the years, although I notice their numbers have dropped.
One point I can make is that to get the Europeans to back Guaidó has been incredibly difficult, because they have a heavy component of hard core leftists in key positions. For example, the head of EU Foreign policy is Mogherini, an Italian communist who used to be an Arafat groupie. Even now, the EU recognized Guaidó but she’s running around with a “Contact Group” trying to organize a dialogue, which by now can only be held to lay out how the Maduro clique and Cuban forces leave Venezuela.
So are we yet willing to declare peak OPEC?
There is no way to know for sure, but I think the odds favor that not just OPEC, but the combined production of OPEC + Russia has peaked. That’s just over half the world’s crude oil production. But it will be about two years before the picture becomes clear, or a lot clearer than it is today.
Under a favorable political and managerial climate [such as no sanctions and civil wars], Libya Venezuela and Iran could combine for close to 3 Mbpd additional production, correct?
I know, fat chance.
Yeah, if only peace would break out all over the world.
With the population still rising, especially in the undeveloped world, and natural life support systems declining at an increasing rate, it is far more likely that political problems will increase rather than decrease. And that includes political problems in oil exporting countries.
I’m with Ron, peace in the undeveloped or lesser developed countries is less likely than trouble, even when the economies of such countries are growing.
And while they may skip the land line in favor of the cell phone, it’s damned unlikely, imo anyway, that they can skip the ICE in favor of electrified transportation, because conventional vehicles and machinery are going to be cheaper than electrified versions for quite some time.
So oil demand is going to grow in any lesser developed country with a growing economy for at the very least ten years. Maybe a LOT longer than ten years. And it will grow faster than it does in developed countries that will be adapting to shorter supplies by reducing per capita consumption to some extent, as the price goes up.
“Rust and depletion never sleep.” I forgot his name, but the guy who’s famous for saying it was a noted figure in the financial sector of the oil industry.
Venezuela can’t recover production for a while. I just saw the draft of a white paper on what needs to be done, gave them a harsh review, and concluded the best short term goal is to stabilize production. The lack of trained and experienced personnel is a huge bottleneck, and they are bound to make mistakes. And the situation on the ground is terrible.
Is it only missing maintainance and material defects – or do they even have damaged their oil fields by wrong pressure management?
As much as I read the big number of their oil reserves is kind of tar oil – so lifting this huge treasure would need another kind of investing like in Canada?
Eulenspiegel,
Venezuela’s Orinoco is at about 55 C vs 15 C for Canadian oil sands.
So it is easier to produce than the Canadian oil sands (less energy intensive) mostly using a process called CHOPS (Cold Heavy Oil Production with Sand)
https://en.wikipedia.org/wiki/Heavy_oil_production
Yes I was looking at that a few days ago, so in fact the extra heavy oil of Venezuela can still be produced by wells ? (with specific technologies). It is true for all of this reserve ?
And currently, do they produce any, or is all or most of their production from conventional reservoirs ?
By the way Venezuela passed its peak in 1970, with a secondary peak around 2000 :
http://mazamascience.com/OilExport/output_en/Exports_BP_2017_oil_bbl_VE_MZM_NONE_auto_M.png
Can it be said that without the extra heavy, their conventional peak is passed “whatever the management” ?
And about extra heavy, I see in below slides (11) :
http://www.oilproduction.net/files/extra-heavy-oils-in-the-world-energy-supply.pdf
“About 500 wells drilled and 2,000 additional wells
to be drilled to maintain production (up to year 2033)”
(just for Total)
So is it correct to say that extra heavy from Orinoco also requires much more wells than conventional ? (a bit like LTO but for different reasons)
Venezuela produces oil from over 100 fields. These are located from the Colombian border all the way to the Orinoco Delta, and from the Orinoco river to wells drilled near the coast in Falcon state. Today heavy oil is about 70% of the country’s production because the light and medium oil fields are depleted and have been mismanaged. There’s also a large number of shut in wells, oil spills, broken pumps, etc. Nobody really knows how bad it is.
These 70% are what is called “extra heavy” or just “heavy” ?
10 degrees API or lower. I’m trying to get some information, but my contacts are a bit pissed off because I criticized a white paper they wrote. They included BS about renewables and I told them to cut that out. The emphasis right now should be on how to use existing laws to get foreigners to put cash in to recover production. This means the existing JVs are the most useful vehicle, and that additional JVs can be created to handle other areas. The cute part is that the JV regime was suggested by the Cubans and implemented by Chavez, so the commies won’t have much to complain about.
my contacts are a bit pissed off because I criticized a white paper they wrote. They included BS about renewables and I told them to cut that out.
Well, this is where your bad judgment about renewables is coming back to bite you. There’s a good chance they know more than you about it, and they’re annoyed that you’re being obtuse or they’re losing faith in your expertise.
Or both.
I believe when I have asked Fernando in the past he thought even 10 years from the time Maduro is removed from office to get Venezuelan output back to 2 Mb/d was quite optimistic and that might not even be possible.
Libya and Iran might provide another 1 Mb/d combined, but I agree with Ron it is not very likely. Possibly Iraq could increase output a bit further and note that the peak in OPEC output occurred around the time of the oil glut in 2016, since that time OPEC has been purposely restricting output to bring oil prices up. When oil has returned to $80/b or higher for a year or two, that is when we will know the true potential for OPEC output, I believe they may return to the previous 12 month peak and perhaps higher in the 2020 to 2025 time frame and then might maintain a plateau for 5 years or so (2025 to 2030 would be my best guess at perhaps 33 to 34 Mb/d for OPEC 14).
peak in OPEC output occurred around the time of the oil glut in 2016, since that time OPEC has been purposely restricting output to bring oil prices up.
Errr… and just which OPEC nations has been purposely restricting output to bring prices up?
Saudi Arabia, Kuwait, Iraq and the UAE were all producing at maximum capacity during the last quarter of 2018, and OPEC still did not reach their peak of 2016. The rest of OPEC is declining faster than these nations can increase production. The decline of other OPEC nations is the problem OPEC has.
In late 2016 an agreement was reached to reduce OPEC output, sanctions on Iran has reduced output there by 1000 kb/d, those sanctions could be removed, potentially Libya might settle its civil war and output might increase by 200 to 300 kb/d if that should occur. Perhaps Iraq might be able to raise output further when oil prices rise.
When oil prices are high (over $80/b for a couple of years) and we continue to see OPEC output fall, that’s when I will believe OPEC might have passed it’s peak, until then we don’t really know what their potential is in my opinion.
The last three months of OPEC production excluding Iran, was 250,000 barrels per day lower in 2018 than the last three months of 2016. During both three months period, OPEC was at maximum production, prepping for cuts.
So evem excluding Iran, OPEC was still down a quarter of a million barrels per day during each period of maxium production, 2016 to 2018.
Iran peaked in 2005, if that is of any interest to anyone.
Iran has self – declared reserves of 120 billion barrels – much more than all this LTO wizardry in the USA even in optimistic guesses.
When this is even a bit true, they could double their output with enough investments.
I don’t know enough about conventional oil development, but even if it takes a 3-digit billion sum to develop it’s much cheaper than LTO.
Only: Who invests a 3 digit billion sum into a theocratic regime on a top position in the “Shoot em up” list of USA and Israel.
Iran has self – declared reserves of 120 billion barrels…
No, Iran has self-declared reserves of 155.6 billion barrels.
OPEC share of world crude oil reserves, 2017
Two thirds of them are mythological barrels, just like the rest of OPEC reserves.
Ron
Saudi Arabia cut production from 10.4 to 9.8 at the beginning of 2017. Also 10.4 was not their max as they produced 11 million barrels per day in Nov 2018.
December and January OPEC have cut 1.5 million barrels per day.
We do not know if Saudi Arabia cannot produce more than 11 million barrels per day, because at the moment it is not needed.
I realize that Hugo, but OPEC is 14 nations, not just Saudi Arabia. Also, during the last three months of 2016, as well as the last three months of 2018, Saudi was producing what they could, not what was needed.
Ron
How do you know they produced what they could?
If you look at the charts, every OPEC nation that could produce more oil during the final quarter of 2016 and 2018, did produce more oil, especially in November. (Quotas were set in December.) The obvious reason was they were prepping for quota cuts. Their quota cuts would be determined from what they produced during that period.
OPEC has never cut their production because of what was needed. They only ever cut when prices were very low. They cut in order to increase prices. Then when prices were high, they produced every barrel they possibly could.
OPEC is not a philanthropic organization and never have been. They don’t give a flying fuck about what is needed. They only want maximum profits from their oil and gas.
FWIW: A VZ production recovery would probably mirror Iraq’s in the sense it takes a while for a nation to recovery from anarchy. I am sure there will be groups that battle for control (like the Shia\Sunni in Iraq), even with heavy US\NATO involvement. Then it’s going to take time for oil companies willing to send in people. Generally skilled Foreign workers are reluctant to work in unstable areas (No point in making big $$$ if you get killed).
Like Iraq, anything that can be sold for scrap will. I am sure people will loot equipment & steel during the chaos during the transistion (like the did in Iraq). But I suspect that unpaid\underpaid Oil workers already started scraping equipment & steel years ago.
My guess it will probably take close to 10 years before VZ oil production recovers to its pre-Madrio\Chavez levels, once the Mo is gone.
Your vision is a bit wrong, because Venezuela isn’t at all like Iraq, and Guaidó isn’t nearly as stupid as Bush, Cheney etc al. Army units guard oil installations and they will not be fired. Venezuela has no Sunni Shiah sectarian divide, and Maduro supporters are less than 15 % of the population. Plus many are in the cities away from the key oil fields.
It’s hard to explain to foreigners who don’t understand the details, but the main reason why it will be slow to get things going very fast is the amount of damage already done, the lack of personnel and the need to dot every i to make sure there’s zero corruption or waste.
“and Maduro supporters are less than 15 % of the population.”
And you Fernando have zero credibility on any of these kind of issues. Your bias is about 900 miles out in front of your facts. So far, you can’t even realize that the rear view mirror is showing the front of your car as tiny speck.
Fernando Wrote: “Venezuela has no Sunni Shiah sectarian divide, and Maduro supporters are less than 15 % of the population. ”
I presume the remaing 85% don’t all back Guaidó. I suspect like Iraq is not necessary backing the right guy that can turn VZ around quickly. US has a habit of supporting the wrong leader. I doubt this time will be different. Also Both China & Russia have Billions of loans with VZ that will likely be defaulted with USA support. China & Russia might choose to promoted opposition to Guaidó.
Fernando Wrote:”Venezuela has no Sunni Shiah sectarian divide”
Perhaps not on a religious difference, but one of economics & political ideologies. VZ has been socialist leaning for a very long time. Once Mo is gone I suspect we’ll see plenty of new Communist\Marxist pop up. They will simply blame the Crisis as Mo being incompetent, not the failures Socialism or Marxist. I have talked with several people that fed VZ to the US and they still see the country heavily entrenched in Socialism & Marxism, They think the failures are simply the result of Mo not delivering the Promised Marxist Paradise. Most of the smart people left VZ already. What Remains is mostly Socialist Marxist supporters.
Your supposition is wrong, because Guaidó has become very popular. This led potential rivals to hitch themselves to his wagon. That means the 85% who does oppose Maduro has a very solid front. The differences of opinion are about details such as whether Guaidó is being too soft with Chavistas, whether they should lynch high level Maduro supporters, put them on trial, or just let them be. After Maduro is gone there will be a few communists who try to make trouble, turn to terrorism, etc.
You are right in the sense that most Venezuelans are used to daddy state and dependency, lack self initiative and are quite passive. But chavistas will never return. The regime stole too much, the depravity and torture have been too much, the murder squads in poor areas have killed too many young men, and the horror will be engraved. So the government that emerges will be similar to say Macron’s in France. Guaidó actually sounds like a Jesus like figure with Bill Clinton inside. Why do you think the regime hasn’t arrested him? If they do that 85% would trash the 15%. And they know it. Venezuela is on the edge of an orgy of violence, and a significant number Maduro supporters will likely come out missing their heads. Some of them are putting out videos threatening terrorism and mayhem, but that’s the typical reaction of bullies who know they are about to lose control.
Just scrolled through EIA. They’re looking for oil consumption increase this year in the US, and next year and the year after.
Magnitude looked like a few hundred K bpd for this year. Well north of 20 mbpd. Revision date Feb 2019.
IEA Febuary OMR released today for subscribers, free highlights https://www.iea.org/oilmarketreport/omrpublic/
2019-02-13 (S&P Global Platts) Unlike other oil forecasting agencies, the IEA expects global demand to grow faster this year than in 2018 due to “lower prices and the start-up of petrochemical projects in China and the US.”
The IEA raised its estimate of the US’ crude output growth this year to 1.1 million b/d, from 1 million b/d in last month’s report,
Platts -> https://www.spglobal.com/platts/en/market-insights/latest-news/oil/021319-oil-markets-may-be-able-to-adjust-to-venezuela-sanctions-iea?
(They don’t say if the demand increase from petrochemical is for LPG (ethane propane butane) or Naphtha. In other words is it natural gas or oil or flexible?)
Note the discrepancy between IEA and EIA on US crude output, this may be a matter of the IEA including NGL with C+C, not really sure. The EIA says US output will increase by 790 kb/d with 270 kb/d of this coming from offshore in the Gulf of Mexico, about 520 kb/d is forecast to come from tight oil from Dec 2018 to Dec 2019. In my view non-OPEC supply is likely to increase by about 800 kb/d (I expect GOM output to be flat, but there might be a 280 kb/d increase from Brazil that will make up the difference). I expect World demand for C+C will increase about 800 kb/d (long term average from 1982 to 2018), so the OPEC/Russia cuts will leave a /supply demand imbalance. This will become apparent by May or June 2019. At that point OPEC/Russia would be wise to let oil prices rise to $80/b before gradually raising output to balance the oil market. That point might not be reached until May 2020 with a gradual rise in Brent oil prices (3 month centered average price) from $65/b in May 2019 to $80/b in May 2020. Political instability is likely to lead to less than a steady upward trend in oil prices, they will be volatile, but this is how I see the general trend developing based on expected supply and demand.
This article is from Nawar Alsaadi. We know Bakken should peak as the NG capture is only 79% vs. state mandate of 88%. We also know EF is not the growth engine. I agree with OPEC assessment that Permian will peak in 2020. According to Enno Peters, more than 70% of the new wells drilled in US is to compensate for legacy wells decline. I am skeptical of the US growth projections if most companies say that they want to live within free cash flow.
https://oilprice.com/Energy/Crude-Oil/Fifty-Shades-Of-Shale-Oil.html
Excellent article, couldn’t agree more with the author.
Krishnan V.
Interesting article thanks. I think OPEC may underestimate US tight oil potential while the IEA tends to overestimate. Below is a high and low scenario for US LTO and a “medium” scenario that is a simpe average of the low and high cases. The Permian, Bakken, Eagle Ford, Niobrara, and other US lto scenarios are laid out at link below.
http://peakoilbarrel.com/open-thread-petroleum-february-5-2019/#comment-665896
An alternative Permian scenario is used for the “high” US LTO scenario leaving the other basins the same for both the high and low scenarios. The difference between the two Permian scenarios is simply the rate that new wells are completed, for the low scenario the peak monthly completion rate is 500 new wells per month and for the “high scenario” the peak completion rate is 727 new wells per month. For context the completion rate was about 410 new wells per month in Dec 2018 and had increased from a 184 wells/month average in 2016 to 392 wells/month average completion rate in 2018 or about an increase of 104 new wells per month each year. The high scenario reaches an annual average completion rate of 727 new wells per month in 2026 an increase of only 86 new wells/month per year on average from 2019 to 2026.
High Permian scenario used in high US LTO scenario in chart below.
This is really interesting stuff. Thank you Dennis.
I went to shaleprofile and did a little “eye balling” and some calculations based on his October update for the Permian. It looks like the decline for 2017 will probably end up a little above 60% by the end of December. It’s currently 52.8% for the ten months to the end of October. Assuming declines don’t get better on 2018 wells which seems a safe bet, that means the decline from 2018 wells alone will be a little over a million barrels a day in 2019. My complete “guesstimate” on the declines from 2017 and earlier vintage wells is that will be somewhere around 350k barrels per day? That would mean that total decline to be “made up” before there is growth for 2019 at about a little over 1.35 million barrels per day. That would imply that to get 650 thousand barrels per day growth, 2019 wells would need to deliver about 2mm barrels in production by December of next year. I think I did that right?
It gets more pronounced in 2020. Again using 60% decline on the 2019 would mean 1.2mm decline from 2019 vintage wells, and likely more like 500k plus for 2018 and earlier vintage wells which would suggest that the first 1.7mm barrels produced in 2020 would be just to make up for decline rates? Does that seem right to you?
Yes I guess that’s why someone called it the “treadmill” as frackers have to run just to standstill
Energy News,
Good point that someone’s work can be found at link below
http://peakoilbarrel.com/debt-oil-price-bakken-red-queen/
also
http://www.theoildrum.com/node/10119
Energy news Wrote:
“Yes I guess that’s why someone called it the “treadmill” as frackers have to run just to standstill”
Also referenced as the “Red Queen” From Alice in Wonderland.
Mario Vachon,
Thanks. Everyone else seems to ignore this stuff.
For the entire Permian Basin if no wells were completed after Dec 2019, the entire Permian tight oil output would decline at an annual rate of 56% from Dec 2019 to Dec 2020. The annual decline rate in this “shutdown” scenario would accelerate to 89% from Dec 2024 to Dec 2025 and remains at about 90% until 2039 before moderating a bit.
I don’t really use decline rates in my models, I fit a hyperbolic well profile to the data for the average well and assume all completed wells are average wells (for simplicity). This is essentially based on the “Red Queen model” presented long ago at the oil drum, (these same ideas were developed about the same time by James Mason and Paul Pukite).
In the past my work has been reviewed by Paul Pukite and Jean Laherrere, though this specific model has not been checked by anyone but me, the author of the Red Queen series is in no way associated with any of my work, any errors are mine alone.
Enno Peters at http://www.shaleprofile.com has presented very interesting data lately suggesting terminal decline rates are quite a bit steeper than I have usually assumed (my typical assumption has been 10% per year terminal decline rates). I have revised this to 14% based on data from all wells in the Permian basin using a different methodology than Enno Peters (who focuses on the wells at the bottom of the rate distribution).
The model below assumes $10 million well cost in 2017 $, royalties and taxes of 32%, LOE of $2.3/b plus fixed monthly cost of $15000 until well is shut in at end of life, and transport cost of $5/b, all costs in real 2017$. Real oil prices are assumed to follow the AEO 2018 reference oil price scenario for real Brent oil prices in 2017$, the annual discount rate is 10% (inflation rate assumed at 3%/year, so real annual discount rate is 7%.) It is assumed wells are completed if their NPV, based on assumptions is greater than or equal to $10 million in 2017$.
Cumulative net revenue is not discounted and reaches a maximum negative value of $179 billion in 2027 (annual interest rate is assumed to be 7.9%in nominal terms), the debt is paid off by 2028 and cumulative net revenue (cumulative profits) reach $732 billion in 2017$ by Dec 2050. Peak tight oil output of the scenario is 7450 kb/d in 2028, economically recoverable resources are about 59 Gb and about 176,000 total wells are completed from Jan 2010 to June 2054.
Wow. Thank you very much for that Dennis. I’ll try to digest that a little bit but I have a few questions that come to mind right away. First of all, what is an “average” well, and does it change with time? For example, it seems that newer wells have higher peaks and “likely” higher EUR than older wells, so do you change the model continuously to fit most recent wells? I also wonder if wells start to deteriorate somewhat (Parent/child wells, sweet spot exhaustion and other things I don’t really understand too well but have heard may hurt future wells?) Another question that comes to mind is how you determine when wells are drilled because I don’t know if there are any physical limits to how many can be drilled in any particular year and whether that would be a consideration?
Anyways, that you very much for the detailed and interesting response. I’m going to chew on this some more and try to think it through.
Mario.
Hi Mario,
I use 6 separate well profiles to match historical data at shale profile as the well profiles have changed over time.
After 2017 I assume the well profile is unchanged until Jan 2023, at which point I assume new well EUR starts to decrease. I assume the shape of the well profile (b and Di parameters for a hyperbolic) and that the Qi parameter decreases in proportion to the number of wells drilled. I assume a total of 250,000 wells would be drilled at very high oil prices (a TRR limiting scenario) and set the amount that each well completed will decrease the EUR so that with the maximum of 250,000 wells completed the URR would be the mean USGS TRR estimate for the Permian (75 Gb). The economic assumptions result in fewer wells being drilled (176,000) for my “medium scenario”.
The 250,000 number was chosen because the Permian is roughly 6 times larger than the Bakken for mean TRR and typically the Bakken scenarios have about 42,000 wells for a medium TRR scenario, 42,000 times 6 is about 250,000 (the EUR of Bakken and Permian wells is similar so that is the basis of this approximation).
Also note that after Dec 2022, tis scenario uses a slightly smaller well profile for Each future month until no more wells are completed after 2054.
For the chart below I show the well profiles from 2010 to 2017, wellpro1 is used from Jan 2010 to Dec 2012, wellpro2 from Jan 2013 to June 2014, wellpro3 from July 2014 to Dec 2014, wellpro4 from Jan 2015 to Dec 2015, wellpro5 from Jan 2016 to Dec 2016, and wellpro6 from Jan 2017 to Dec 2022 for the medium scenario.
As to how many wells can be drilled per month (it is simply a guess), I look at older basins to see their experience as well as what has occurred in the Permian basin so far. There may be future limitations due too lack of workers, water, or deteriorating roads, I have assumed here that well completion rates roughly double over 9 years (2019 to 2027), this might be too optimistic. The EUR ranges from 146 kb for wellpro1 to 413 kb for wellpro6. (146, 165, 221, 306, 396, and 413 kb respectively).
Consider that the Eagle Ford (with a total mean TRR of about 11 Gb from USGS estimates, so a 6.8 times lower mean TRR than Permian basin at 75 Gb) had a maximum competion rate over 300 new wells per month in early 2015.
For the Permian basin at 6 times the size this suggests a maximum completion rate of 2000 new wells per month to match the Eagle Ford rate relative to TRR. My scenario has a maximum completion rate of 727 new wells per month ( the number was chosen to get a curved function with a peak around 2027 and about 250,000 total wells completed, the method was not very scientific, it was chosen arbitrarily, clearly the future completion rate cannot be predicted.)
Think of this as a “what if” exercise, if this many wells are completed, then output looks like this, if all the other economic assumptions are also correct, the new well EUR starts to decrease as I have predicted and the rate of decrease in new well EUR falls at the rate the model predicts and that the USGS mean estimate for TRR is accurate.
The likelihood that this scenario will match the future is pretty close to zero as there are an infinite number of future possibilities and this is but one of that number.
Mario,
Chart below has well completion rate in wells completed per month on right axis.
I always invite others to suggest alternative scenarios that they believe are more realistic and I can easily run them in my model. All I need is a list of numbers and I can copy and paste into model. The scenario has 410 wells completed in Dec 2018, a list of numbers say 120 numbers for the next 10 years (120 months) or one could give me annual average completion rates and I can interprolate. Happy to do it.
Wow. Just wow. That is some incredible work. I had no idea it was such a complex model. All the assumptions seem reasonable, although as you say will undoubtedly be wrong just because the possibilities are almost limitless and new information and circumstances will alter today’s best guesses.
Thank you very much Dennis.
You’re welcome Mario.
Chevron’s Permian production plan
https://pbs.twimg.com/media/DzUA_NtWkAIRGI_.jpg
A chart with MBOE is useless IMO.
I wish they would ignore the natural gas and NGL, it is only the C+C that generates any net revenue, that is why they flare as much natural gas as will be allowed in the Permian basin.
It is useful in the following sense though. If we assume the ratio of natural gas and NGL output to C+C output remains constant from 2018 to 2022, then Chevron is forecasting an increase in their output of roughly a factor of 3. For the basin as a whole (if the same assumption were applied basin wide,) that implies an increase from 3000 kb/d to 9000 kb/d from 2018 to 2022.
I doubt that will happen, I expect an increase from 3000 kb/d at the end of 2018 to about 6000 kb/d at the end of 2022, so a factor of 2 rather than a factor of 3 is my high completion rate scenario. In that scenario the average monthly completion rate increases from 392 new wells per month in 2018 to 639 new wells per month in 2022 an increase in the monthly rate of about 62 new wells per month each year (in the 2016 to 2018 period the rate of increase was about 104 new wells per month each year.)
There’s a comment below about Laredo. Their gas and gas liquids production are rising disproportionately fast and oil – not so much. The oil portion of their Permian production is forecast to decline 5% while BOEs continue to rise because the GOR keeps rising.
What is not discussed here are the rate limiting steps. Are there pipelines to carry NG and NGL? Mike Shellman said that there is a lot of flaring of NG in Permian.
Krishnan Viswnathan,
There is not enough pipeline capacity especially for natural gas and yes there is a lot of natural gas being wasted by flaring, it is up to the Texas RRC or DEP or perhaps the EIA to enforce any existing regulations.
Up to the people of Texas and New Mexico and the owners of the resources to make sure this is done.
I am not an oil guy, can the natural gas be reinjected into the formation?
Perhaps it is too expensive.
I’ve not got any insight into Permian production limitations. I don’t subscribe to anything and so I only know what’s in the news.
EIA – U.S. commercial crude oil imports last week fell to the lowest since Jan 1997 (might be partly due to fog?) Crude oil imports from Venezuela were 117 kb/day
U.S. Petroleum Balance Sheet
http://ir.eia.gov/wpsr/overview.pdf
EU & USA monthly chart plus US weekly inventory Feb 8th (yellow dot on chart)
US total (crude oil + distillates) 924 million barrels
Total = crude oil: 451 + distillates (light+middle+heavy): 473
Chart https://pbs.twimg.com/media/DzT_sfNX0AAMxpW.png
US weekly inventory change (million barrels)
Crude oil +3.6
Light +0.4
Middle +1.4
Heavy +1.5
Total +7.0
SPR no change
Propane & NGPLs +0.25 (not included)
Chart https://pbs.twimg.com/media/DzUAPwaWsAY3IxZ.png
https://flowcharts.llnl.gov/content/assets/images/charts/Energy/Energy_2017_United-States.png
It would be educational if there were an oil flow diagram for the oil producers which contrasted internal usage and export.
I was just fixing to ask which countries are expected to become net importers, rather than exporters, over the next five or ten years.
OFM,
Difficult to predict because it depends on oil price policies and how consumption responds to the oil price that results. My guess is that nations that subsidize oil internally will gradually reduce those subsidies as oil prices rise. They could give poor people a free gas card that grants them a fixed number of gallons of fuel and people would be allowed to trade those to others on the market, this would encourage people to conserve fuel as the traded price will rise to the price people are actually willing to pay, this “market” price could be used to set the price of gasoline for those who choose to use more than their allotted number of gallons.
Such a policy might reduce riots especially if the allotted number of gallons was close to median usage by the middle class.
The subject of Tradable Energy Quotas (TEQs) was widely discussed here in the UK a few years ago. It’s not a thing that is getting much attention at the moment though.
https://en.wikipedia.org/wiki/Tradable_Energy_Quotas
Back atcha Dennis,
Thanks for your ideas.
They may actually be put into effect in a couple of the more advanced countries that are oil producers, but my guess is that the lesser developed countries that produce oil are more likely to take the easy short term route, and continue to provide gasoline and diesel to their own people, at less than market prices, in most cases.
The end game is that at some point it will be impossible to avoid allowing the prices of oil products to go up very sharply. Riots may follow.
And when this happens, depending on how many other things are going wrong at the same time….. governments may fall.
It is often said the consequences of revolutions are worse than the conditions that brought them on.
OFM,
The smart nations will use the tradeable energy quota idea and thereby encourage their citizens to conserve scarce resources. The others will fall to revolution as you assume, then the quotas will be used by the government that replaces the foolish ones that came before.
There are few things more profound than that box marked “Rejected Energy,” representing over 2/3 of all energy extracted.
I’m not really sure of the significance of that. Using fossil fuel products as combustible fuel limits the efficiency at which one can obtain useful work from the fuel. That efficiency number is really only useful when comparing one source to another and the ffs pretty much will operate in the 40%=/- range for most stationary applications. For motor vehicle type uses the efficiency is just terrible compared to electric and I doubt much improvement is likely there. That rejected energy is just a fixture of the way energy is extracted through combustion so I doubt it has any meaning except for how much you are overheating a river near a coal or NG power plant.
“Using fossil fuel products as combustible fuel limits the efficiency at which one can obtain useful work from the fuel.”
Yes, that’s what I mean. We’ve wasted that endowment on trips to the package store. That’s profound.
I am not so sure. It looks like hybrid cars are very competitive with the EV.
The efficiency of Tesla and similar EV is grossly overrated. You have losses in the transmission line, losses in the charger, losses in the battery. Plus if the mechanical transmission is used (for example 10:1 fixed gearbox like in Tesla), you have losses in transmission and motor during driving (say 10%). So total efficiency of electricity usage would be around 70%, which is high, by not that high. Atkinson-cycle ICE engines used in hybrids have ~40% efficiency.
The ~56kwh Roadster battery takes ~70kwh to charge. (approx) So ~20% of the electricity you pay for is lost to heat. How much is the charger and cabling, and how much the batteries, I have no idea.
Here is a very simple calculation. Tesla with the air conditioner on auto 73F and external temperature 60F (minimal use of the air conditioner) consumes around 300 watts/mile. Double this for temperatures below freezing point or temperatures above 90F.
The cost per mile at 15 cents per Kwh and 20% loss is 5.4 cent.
Hybrid SUV like RAV4 hybrid (which is a much better and safer car, especially in winter) with an average of 35 miles per gallon and the price of gas at $2.5 per gallon has cost 7.1 cents per mile.
That means that Tesla provides just 24% economy, which is completely eaten by the higher cost of Tesla (say $44K vs. $29K ).
Assuming mileage 200K at the end of the life of each car, this $15K difference adds 7.5 cents per mile.
Which means that at those price levels Tesla is competitive only if electricity is free.
likbez
Your calculations are probably correct, but there are other considerations.
For instance, UK oil production peaked in 1999 at around 3 million barrels per day, it has now fallen to 1 million. At $50 oil, it costs us $25 million per day to import the oil we consume over our production. Our wealth is draining away in a trade deficit that has increased with declining oil and gas production.
If we install enough wind turbines.
https://www.theguardian.com/environment/2018/nov/30/windy-weather-carries-britain-to-renewable-energy-record
We can power electric cars, trains and trams and reduce our energy insecurity.
Also global warming is a major concern also
Likbez,
The Tesla Model 3 is perfectly safe in winter, and is a far nicer car than a RAV4 hybrid. The appropriate comparison would be to Volvo XC60
https://www.edmunds.com/volvo/xc60/2018/hybrid/
Let’s compare apples to apples
https://www.edmunds.com/bmw/3-series/2018/hybrid/
Seems the model 3 is working for you.
Great!
Dennis,
Dennis,
I know people enjoy opening Telsa 3 “suicide handles” at -5F . The joke is that “Now you know what Elon’s flamethrower is for.” 😉
https://www.youtube.com/watch?v=–pD42h0VK4
What about road clearances? What about the ability to lock differential when driving on steep ice-covered incline ?
There are also “known unknown” related to lithium battery use (Panasonic cells) at low and very low temperatures. As no Tesla 3 is 8 years old yet, it difficult to say whether the battery can last till the end of the warranty period in continental climate weather conditions (very cold in winter, very hot in summer).
Looks like if you cool a lithium battery below zero F and try to drive before it warmed to 70F the longevity of battery decreases. Higher temperatures also have negative effect (https://www.ncbi.nlm.nih.gov/pmc/articles/PMC4526891/ )
There is also another proven negative factor at winter temperuture for cars with lithium batteries — the dramatic loss of range. https://www.cnbc.com/2019/02/06/aaa-confirms-what-tesla-bmw-nissan-ev-owners-suspected-of-cold-weather.html
See also
https://www.hybridcars.com/tesla-model-s-could-lose-up-to-40-percent-range-in-cold-weather/
At low temperatures lithium battery can’t be charged so if in normal conditions Tesla recaptures energy for the battery during regenerative braking (regen) this is not the case anymore. That further decreases range.
If you run out of energy at -5F, the car needs to be tolled.
If you try to keep battery warm your battery will be drained during parking, unless you are connected to the charger.
At low temperatures (especially with front wind) and during initial warm up of the cabin the heater consumes around 5KWH further draining the battery.
At 90F loss of range is less then in winter — about 20%, but at 100F it is similar and the effect of battery longevity are also similar and negative.
So in areas with continental climate EVs make much less sense then say in California.
Likbez,
As I have suggested, works fine in winter. As long as one doesn’t ride in the car naked during the winter, losses from using the heater are not that great. So far the lowest temperatures the car has seen parked overnight outside have been about minus 15 F for a low with an average of about minus 10 F, battery lost about 250 Wh each hour on average. Battery capacity is about 78,000 Wh. Average temperature where I live is about 19 F in Jan. In Jan I drove about 1500 miles and averaged about 300 Wh per mile vs 245 Wh/mile in October (1600 miles). That is my experience in average winter weather where temperature averaged 19 F in Jan 2019. Range decreased by about 22%. My experience is that range also decreases in a hybrid during winter( I have been driving Toyota hybrids since 2004).
Have driven plenty in snow and ice with the Model 3 this winter, take it to a ski area almost every weekend, the more snow the better. 🙂
Dennis
Judging from people experiences there are some undeniable problem with driving Tesla 3 in winter.
The construction of door handles in Tesla3 is a problematic for winter. Frameless windows also represent a problem. Some pretty educational videos:
1. People are running of energy with Tesla 3 parked at airport for a week or so at cold weather. You need to leave at least 15 km per day in battery in cold weather, or you are in trouble. 30 if weather is very cold. Looks like Tesla 3 tries to heat battery all the time to avoid damage from low temperatures.
https://www.youtube.com/watch?v=0mfs9amXhs8
2. To drive Tesla 3 in cold weather you need to “preheat” the car until battery reaches “working temperature” range:
https://www.youtube.com/watch?v=D2gmphV8IZQ
3. ~52 miles commute to work in cold weather is all that can be made safely. In video below only 43 miles left at the end (the car was not connected to the charger during the working day):
https://www.youtube.com/watch?v=Uvybhb8P894
4. A very short round trip with a preheated car, which was parked outside) reveals problems some problems with handling.
https://www.youtube.com/watch?v=E2Qjt0obVfI
Ample supply of heat from ICE engine helps steering. Tesla does not have it and it looks like it became very stiff.
It is actually amazing that lithium batteries (which are electrolyte based) work that well at such low temperatures. So in way Tesla experiment opens new frontier for lithium batteries.
FYI: The biggest issue is that Tesla does not make any money selling cars. Its estimated that it looses about $5900 for every car sold:
https://www.investopedia.com/articles/markets/070116/tesla-losing-money-each-time-it-sells-car-tsla.asp
When you have heavy weights like Stanley Druckenmiller & Ray Dalio shorting Tesla its likely that company will go bankrupt in about 2 years.
GM has announced it ending production of its Volt in March.
Most electric vehicles have very high deprecation rates, Losing about 70% of its value in about 5 years.
https://www.denverpost.com/2018/10/11/electric-car-depreciation/
Meaning its a very niche market, since almost no one wants used EV’s. I see a lot of people buying used EV’s, taking the battery pack for off-grid homes & sell the rest of the vehicle for scrap.
My guess is electric cars will follow the same path as Edison’s DC grid, that was replaced by AC power. Only Hybrids will be economical. Its just one of those experiments that just does pan out over the long term.
TechGuy
You are quoting old “news” from 20 Oct 2018 about Tesla. The news were from year 2016 , probably after they invested for Model X line of production. After Oct 20 Tesla reported 2 quarters of positive earnings, with surprising good margins for Model 3 , over 20% in Q4 , even after a price cut in the quarter. By the way, total Tesla sales increase from 7B$ to 21B$ in just 2 years, from 2016 to 2018.
Your second quoting is mainly about Nissan Leaf EV cars. Hard to jump to conclusions from this about Tesla.
Beside this, most car makers plan a lot of EV in the immediate future. Give them some credit they know something on this matter.
Alex Palti: “You are quoting old “news” from 20 Oct 2018 about Tesla”
October 2018 isn’t old news. Nothing has changed since then except that Telsa is laying off about 10% of its workforce. As far has it profit, I think its just fiction & fraud. Most of Tesla Executives are leaving. Its CFO quit just a few weeks ago which should be a very large waving red flag.
Tech Guy says:
My guess is electric cars will follow the same path as Edison’s DC grid, that was replaced by AC power. Only Hybrids will be economical. Its just one of those experiments that just does pan out over the long term.
Even if Tesla does go belly up ICE and Hybrids are already dead! You really need to have a conversation with my son’s generation. They will not own cars as you think of them. They will use EVs such as this when they need them.
https://www.youtube.com/watch?v=wLZKdkgB85k&t=7s
They will also change the economic model that supports private car ownership. As for Hybrids, oil and ICE vehicles They are so last century!
Likbez,
I will say it again, not really any significant problems, occasionally doors freeze shut during thaw freeze cycle (rain or very wet snow followed a severe temperature drop. Heating the car solves the problem, which can be done using smartphone app remotely.
Dennis,
I agree that Tesla 3 is OK luxury car. It is not a lemon but it is overhyped. Being cutting edge technology entails problems with reliability, while the price is very steep. I guess you paid around $50K for it. For this price you can by XC60 or UX 250h LUXURY. A couple of my friends are driving Tesla 3 and so far none has any significant problems. Both are enthusiasms highly recommending it.
It might well be connected with how much money they spend for a Corolla size luxury car 😉
https://www.consumerreports.org/car-reliability-owner-satisfaction/tesla-model-3-loses-cr-recommendation-over-reliability-issues/
Consumer Reports has now pulled its recommendation of the Model 3 based on reliability issues. “Members say they’ve identified a number of problems with their cars, including issues with its body, hardware, as well as paint and trim,” Consumer Reports said.
Likbez,
Like I said, no problems for me, it is possible the earliest vehicles might have had problems. I received my car in October 2018.
Consumer reports also rates the Tesla Model 3 as having the best consumer satisfaction of any of the cars it has evaluated. The size is comparable to the Mercedes C class and BMW Series 3.
I live in a place where the average temperature was 19 F (-7 C) in January 2019. I drive the car to a ski area almost every weekend, no matter the amount of snow on the road (the more the better as I prefer more snow at the ski area).
The car is parked outside, not plugged in, often with temperature at -20 C for an overnight low temperature. The car is charged at the base area while I ski (no charger at condo complex).
At some point I hope to convince my condo association to install a charger as it would be more convenient.
I used two pieces of recent info to estimate the percenatge range drop associated with EVs in cold weather.
Recently the AAA issued a report in which they stated that at 20F, the average percentage range drop of the four EVs they tested at 20F was 40%. A few weeks ago in our local paper, a reporter tested a Chevy Bolt at 14F and reported that the range drop was 47%.
The range of a vehicle is determined in a test lab at 68F. So a temp drop of 48F reduces the range by 40%, based on the AAA tests. Assuming the efficiency drop is linear, that translates into 0.833% drop for each 1 degF drop.
So the percentage range loss for the Bolt, which is 54 degs below the test temp, should be approximately 0.833*54=45%. Reasonably close to the 47% reported.
A 40% to 47% range loss is major and I am now beginning to think that the Canadian/US govt/Automakers should be providing this info to customers on the fuel economy label. A good bogie cold temp would be 32F. I can hear the howls from the EV crowd. “Automakers in Canada/US discouraging consumers from buying EVs.”
Maybe Consumers Report might start doing cold weather tests on EVs and plug in hybrids after the recent cold snap in US and Canada this winter. As noted above, some plug-in hybrids turn on the gasoline engine to provide cabin heat in winter. Not sure what they do at 95F. Does the engine drive the AC compressor?
Ovi,
The drop in range depends on the length of the trip.
In cold temperatures such as 14F the battery energy is used to warm the battery over the first few miles and range is not very good if calculated over a 5 mile trip. Over the course of a longer trip such as 100 miles the range loss is not as great.
It also depends how high one heats their car. I dress warmly when it is 14F outside rather than my typical clothing inside my house.
If I didn’t dress properly, my range would be lower.
Average temperature where I live was about 19 F in January (average monthly temperature in 2019), the range was about 24% lower over about 1500 miles driven compared to October 2018 results (1600 miles driven in October 2018).
There is a loss of range, but it is not as large as 47% based on my experience in a Tesla Model 3.
In October the average was 241 Wh/mi and in January it was 300 Wh/mi.
Recent 500 mile trip mostly highway miles at about 0 C, I averaged about 270 Wh/mi, mostly drove at about 65 MPH (104 kph). At 270 Wh/mile that’s is about 285 miles (455 km) of range.
The integrated oil companies usually avoid trouble during periods of low oil prices because of steady refinery profits. This could be an issue?
2019-02-13 (EIA TWinP) Low gasoline crack spreads and high crude oil feedstock costs reduce U.S. Gulf Coast refinery margins
The U.S. Energy Information Administration (EIA) estimates that margins for U.S. Gulf Coast refiners have declined to the lowest levels since late 2014, based on recent price trends in certain grades of crude oil and petroleum products.
https://www.eia.gov/petroleum/weekly/
World gasoline margins (Platts & MS) chart https://pbs.twimg.com/media/DzMyUtVW0AEqE_D.jpg
Reuters longer term version from last month https://pbs.twimg.com/media/DyJc-NbWkAIirak.jpg
(EIA STEO Feb 2019) U.S. Gulf Coast refinery margin—reached $5.89/b on January 29, the lowest price since December 2014
OPEC spare capacity is now around 2 million barrels per day.
OPEC has cut production by 1.5 million barrels per day in the last 2 months.
Besides that Saudi Arabia and Kuwait have ended their dispute over the neutral zone, which will add another 500,000 of spare capacity.
https://oilprice.com/Energy/Crude-Oil/Saudi-Arabia-Kuwait-Discuss-New-Oil-Production-In-Neutral-Zone.html
IN the longer term Saudi Arabia will add another 1mmbd to it’s capacity over the next few years.
https://www.reuters.com/article/us-oil-opec-falih-investment/saudi-arabia-to-invest-20-billion-in-spare-oil-production-capacity-idUSKCN1ME111
As Ron Patterson explained several times here, OPEC members cheat. They cut from the elevated, unsustainable level, achieved specifically to accommodate cuts.
So “after cut” level is often not that different from a reasonable “normal,” sustainable production level in their current production conditions, plus some, related to previously delayed maintenance, shutdowns.
Four years of capital underinvestment bite production both in OPEC and non-OPEC. So talking about excess capacity is somewhat problematic and we now need to distinguish between “prime oil” and “subprime oil.”
Most people who talk about “excess capacity” are interested in lower oil price (the list includes the USA and the EU governments ) That’s why condensate and other “subprime oil” is counted in total oil output. Supply of “prime oil” now is stressed.
In other words, everything connected with oil is now politically charged. That means that it is not wise to take IEA data and their forecasts at face value. It should be viewed as an opinion of the agencies deeply (institutionally) interested in the low oil price.
You need the ability to read between the lines, much like readers of the press in the USSR. And as several experts here do. You need the acute ability to cut through “official bullsh*t”.
And neutral expert opinion is very difficult to come by. That’s why this blog has so much value.
Likbez
You mean like the expert opinion that claims peak oil has arrived every single year since 2008?
I cannot be bothered to find the quote from the oil drum, but a more recent comment by Ron.
“Bottom line, it is obvious that we are on the cusp of peak oil and only the seemingly ever-increasing barrels from US shale oil production is keeping it at bay. But it now looks like that party is about to be over. I think it is very likely that peak oil has already arrived, if not this year then 2015 for sure.”
https://oilprice.com/Energy/Crude-Oil/Did-Peak-Oil-Arrive-in-2014.html
OPEC which peaked in 2014 at 30 million barrels per day, produced 33 million barrels per day last year before cutting production. OOPPPS
You are correct expert opinion is hard to come by.
Dennis, with his calculation of a peak in 2025 + or – 3 years is about right.
Hugo Wrote:
“Dennis, with his calculation of a peak in 2025 + or – 3 years is about right.”
That really depends on how much debt the Shale Drillers can take on, and presumes there is not another global recession before 2025. Next three years for Shale Drillers may be a problem. I believe something like $150B in debt comes due between now and 2023. That’s a lot of debt to roll over, as well as take on more debt to fund CapEx. Without constant US Shale production increases, world production peaks.
TechGuy
It is a massive amount of debt. It all depends on the price of oil over the next couple of years. A price over $70 will probably see them though, if an economic downturn causes prices to fall to $40-$50 then some will go out of business.
This in turn would probably causes oil prices to rise sufficiently to save less indebted companies.
Hi Tech Guy,
As log as the recession is mild, oil output is likely to recover above 2018 levels (highest 12 month average of C+C output to date).
If there is another GFC, possibly the peak will be 2018. I cannot predic t future financial crises with any accuracy, my expectation is the next severe recession will be 2030+/-3, with peak oil being a possible cause (with a lag of 3 to 7 years).
I am also likely to be incorrect.
Heads up. Some scroll upwards there is a quoted article from oilprice.com.
The writer is Nawar Alsaadi. I suspect we fell victim of presumption. He has an Arabic sounding name, and that leads us to suspect he knows something about oil.
Look into this guy. There’s nothing ugly or horrible about his background, but there is nothing in it that shouts out expert. He is a writer. Including publishing fiction.
He’s also “with” some investment firm. Turns out he’s president and CEO of the firm and conveniently an employee count is not easily found.
What this got to do with the content of the article? I doubled checked the data and its spot on, you are free to take his data and come up with a different conclusion, but I don’t get this personal spin.
Don’t you check credentials of people you hire?
I know Nawar quite well from Energy Investing board. He started a board for long term investing there. I consider him quite knowledgeable in energy area. He has an issue with the board and quit the site. I would say your comments are off base.
Watcher likes to experiment with others. I believe it’s called trulling.
Yeah, and he probably has brown skin also. And you know what that means. /Sarc
Ron,
That he is highly intelligent no doubt, like many other non-white people. 🙂
I’m curious – does anybody know, by the data trends, which OPEC country is likely to run so low on oil that they become a net importer, next? I do understand this event may take some time to occur.
If you take a look at PXD announcements, I reach the conclusion that Permian is slowing. Like Dennis Coyne, I look at growth after fourth quarter 2018. Oil production in fourth quarter is 199.2 Kilo barrels/day. The guidance for 2019 is between 203 to 213 Kilo barrels/day. PXD is spending 300 MM dollars for gas processing and water treatment infrastructure.
Hi guys,
Long time lurker, but first time commentor. I would like to get Mr Patterson’s take on Robert Rapiers latest report on KSA’s reserves.
Thanks.
I had to google the link, but it was not hard to find.
How Much Oil Does Saudi Arabia Really Have?
Okay, you will have to read the article to see how Robert arrived at his conclusion. But his conclusion is:
So, I have no good reason to doubt Saudi Arabia’s official numbers. They probably do have 270 billion barrels of proved oil reserves.
I find his logic horribly flawed. Robert compares Saudi’s growing reserve estimates with those of the USA.
First, the US Securities and Exchange Commission have the strictest oil reporting laws in the world, or did have in 1982. Also, better technology has greatly improved reserve estimates. And third, the advent of shale oil has dramatically added to US reserve estimates.
Saudi has no laws that govern their reserve reporting estimates.
From Wikipedia, US Oil Reserves: Proven oil reserves in the United States were 36.4 billion barrels (5.79×10⁹ m3) of crude oil as of the end of 2014, excluding the Strategic Petroleum Reserve. The 2014 reserves represent the largest US proven reserves since 1972, and a 90% increase in proved reserves since 2008.
Robert says US reserves are 50 billion barrels. I don’t know where he gets that number but it really doesn’t matter. Oil production, along with reserve estimates, are growing in the US for one reason and one reason only, the advent of shale oil. Reserve estimates before 2008 were based on conventional oil. Onshore conventional oil production in the USA is in steep decline.
Robert Rapier is brillant oil man, but a brilliant downstream oil man. Refineries are his forte. He should know better than the shit he produced in that article.
100 percent of Saudi Arabia’s reserves are based on conventional oil. Their true reserves are very likely somewhere in the neighborhood of 70 billion barrels.
Ron,
Nobody but the Saudis know their actual reserves, it is all guesses. My guess is that your guess is too low. US conventional reserves grew by about 63% from 1980 to 2005 (before shale reserves were significant.) If Saudi reserves grew by a similar amount, I doubt the 70 Gb estimate for Saudi reserves is correct.
Ron,
The reserve numbers for the US can be found either in BP statistical review of World energy (which Rapier uses) or at the EIA.
From 1980 to 2005 (before tight oil production was significant) US reserves grew by about 63%. If we take Saudi reserves in 1979 and assume they also grew by 63%, then the Saudi 2P reserves in 1979 of 177.5 Gb (p 378 Twilight in Desert) would have grown to 289 Gb, if we deduct the 66 Gb produced from 1979 to 2004 this would leave about 213 Gb of 2P reserves at the end of 2004. If reserves continued to grow by another 25% over the 2004 to 2017 period and we also deduct the 45 Gb of output over the 2004-2017 period, then that would leave about 220 Gb of Saudi 2P reserves at the end of 2017. A Hubbert linearization suggests about 177 Gb of 2P remaining reserves for Saudi Arabia, but as Robert Rapier has shown in the past, the HL method is not very reliable.
If reserves continued to grow by another 25% over the 2004 to 2017 period and we also deduct the 45 Gb of output over the 2004-2017 period, then that would leave about 220 Gb of Saudi 2P reserves at the end of 2017.
Isn’t it wonderful that we live in a world where the more oil you pump from a reservoir, the more oil the reservoir contains? I have read that Saudi Arabia, as well as the other Middle East OPEC countries have magic oil. That is, for every barrel pumped out of the ground, another barrel magically appears to replace it. Well that is just wrong. Now for every barrel pumped out of the ground, then 1.25 barrels magically appears to replace it.
In the US from 1985 to 2005 reserve growth was about 2% per year.
Why is it that you believe that the “magic” that has happened in the US cannot occur elsewhere?
Dennis, the reserves of most oil reservoirs, are at first, underestimated, especially if they belong to companies listed on a US stock exchange. There are several reasons for this. I will not go into that now but you know the reasons. As they age, their estimate gets more accurate. In other words, at some point, they stop growing.
National oil companies that are not publically traded have no reason to underestimate their reserves.
At one point, around 1980, OPEC started discussing quota numbers based on proven reserves. That’s when all OPEC nations began inflating their reserve numbers. And they have been doing it ever since.
Dennis, I thought you knew all this. It has been discussed here and on the old Oil Drum many times. But to refresh your memory:
Why does OPEC lie about its oil reserves?
Hi Ron,
The 1979 estimate for Saudi reserves is from the period where there were independent audits of Saudi reserves. The 2P reserves were 177.5 Gb. The question is very simple really, why do you think the Saudi reserves did not grow, but the US reserves clearly did grow by about 2% per year on average from 1980 to 2005.
A simple assumption thag Saudi reserve growth was similar explains current Saudi reserves pretty closely, they might be overstated by about 20 to 25%, but not by a factor or nearly 4.
I need your source of US reserves and reserve growth. This chart, derived from the BP statistical review, gives a different story.
BP Statistical Review: proved reserves not so proven
Also, how much of the increased reserves was “reserve growth” and how much was new discoveries?
Hi Ron,
See
http://peakoilbarrel.com/us-oil-reserve-growth-2/
Links to EIA data there. New field discoveries and production were deducted from remaining reserves in 1980, analysis through 2005 to avoid tight oil.
Okay, I’ll take your word for it. Are you sure your new discoveries are correct. They must include GOM you know. Anyway, Saudi does not claim their reserves grew. They just jumped in one fell swoop. And since 1980, they have produced over 100 billion barrels with no decline in proven reserves. Now tell me you believe that.
Ron,
In short, all of the reserve growth was reserve growth only, new field discoveries were not counted as reserve growth in the 63% reserve growth estimate.
Data from
https://www.eia.gov/dnav/pet/pet_crd_pres_dcu_NUS_a.htm
proved reserves grew by 62.6% from the end of 1979 to the end of 2005.
New field discoveries were 6338 Mb from 1980 to 2005, cumulative production was 62,862 Mb and crude reserves decreased by 8053 Mb. Reserves at the end of 1979 were 29,810 Mb.
So 62,862 minus 6338 (discoveries) minus 8053 (reserve decrease) is 48,471 Mb of reserve growth from 1979 to 2005.
48471/29810=1.626 minus 1= 0.626 or 62.6% reserve growth. The average annual growth rate in proved reserves was 1.96% per year over the 1979 to 2005 period.
An assumption that the Saudi 2P reserves of 177.5 Gb grew at 1.96% per year from 1979 to 2017 and deduction the 111 Gb of cumulative production would leave about 260 Gb of 2P reserves at the end of 2017, proved reserves should be lower, about 163 Gb. Typically 2P/proved=1.6.
It is likely that OPEC nations report 2P reserves rather than proved reserves. In fact, the IHS data suggests World 2P reserves are about the same as reported “proved” reserves in the BP statistical review.
Ron,
The jump was probably in response to others raising “proved reserves”, clearly the reported number may not be accurate. My point is simply that if 2P reserves were 177.5 Gb in 1979 as reported in Twilight in the Desert (see appendix on US Senate investigation) and Saudi reserve growth matched the US reserve growth annual rate from 1979 to 2005 (about 1.9% per year), then Saudi 2P reserves would be 252 Gb in 2017 if their reserves grew at an average rate of 1.9% from 1979 to 2017.
It is possible they grew more slowly than this, we do not really know.
It is possible they grew more slowly than this, we do not really know.
It is possible that they shrunk, even shrunk dramatically as did those of OMAN a few years ago.
Shell Scandal Points To Exaggerated Estimates Of Oil Reserves
Shell fined over reserves scandal
This overestimation of proven reserves was exposed because Shell was an exchanged traded company. If OMAN’s oil was entirely a national oil company, like Saudi and other Middle East countries, the overestimation would have never been exposeed.
I do not follow Laredo Petroleum closely, however their recent year-end results and operations summary contained disclosures that may affect north american shale production more broadly, or perhaps they are company specific, I don’t know.
Laredo is a nice sized E&P producing around 70,000 boepd in the permian, mostly in Glasscock and Regan counties. Much of their production is horizontal Wolfcamp.
Laredo has been disappointed with its oil production recently, as well as an increasing GOR.
“Laredo has taken action to address the reduced oil productivity experienced in 2018 that we believe was impacted by the tighter spacing of some wells drilled in 2017 and 2018. Responding to these results, the Company began widening spacing on wells spud in the first quarter of 2019. Laredo expects this shift in development strategy to drive higher returns and increased capital efficiency versus 2018 as widening spacing is anticipated to address one of the causes of higher oil decline rates.”
They have changed their developmental strategy to widen spacing to improve recovery and mitigate the increasing GOR. They have also reduced their capex by around 35 % from $575 million in 2018 to a planned $365 million in 2019.
“Responding to the current commodity price environment of WTI strip pricing of approximately $54 per barrel, Laredo expects to invest approximately $365 million in 2019, excluding non-budgeted acquisitions. This budget includes approximately $300 million for drilling and completion activities and approximately $65 million for
production facilities, land and other capitalized costs. Laredo anticipates adjusting capital spending levels to match operating cash flow if operating cash flow does not meet budgeted expectations. Should operating cash flow exceed budget expectations, free cash flow could be used to complete additional wells, repurchase stock or pay
down debt.
By the third quarter of 2019, enabled by the Company’s operational flexibility, Laredo anticipates reducing activity from the current three horizontal rigs and two completion crews to operating one horizontal rig and utilizing a single completion crew, as needed. The front-loaded completion schedule and disciplined reduction in activity should drive free cash flow generation in the second half of 2019 that is expected to balance capital expenditures with cash flow from operations for full-year 2019.”
Of course this is just one producers take on productivity concerns. Link below.
http://www.laredopetro.com/media/223310/21319-laredo-petroleum-announces-2018-fourth-quarter-and-full-year-financial-and-operating-results.pdf
Interesting. They are more a gas company than an oil company with only 23000 of the 70000 BOEs being oil. Interestingly, they are forecasting oil production to decline 5% year over year while BOEs rises high single digits, showing how gas to oil keeps rising.
As such a tiny oil producer (23000 barrels) its pretty meaningless in the grand scheme, but very interesting nonetheless. Thanks for sharing.
Food for thought
I just did a little math using OPEC’s estimate of OPEC and Non-OPEC World proven oil Reserves.
OPEC says they have 1214.21 billion barrels of proven reserves. And they say non-OPEC has 268.56 billion barrels of proven reserves. Average OPEC C+C production, over the last four years, has been 12.78 billion barrels per year according to the EIA. The EIA says the average non-OPEC C+C production over the last four years has been 16.8 billion barrels per year.
Okay, here is the killer. If those numbers are correct then the average non-OPEC nation has an R/P ratio of 16 while the average OPEC nation has an R/P ratio of 95. If you think those R/P ratio numbers are even remotely correct then I have a bridge I would like to sell you.
Ron,
I agree that the R/P numbers seem very suspicious. But if this is true then OPEC reserves are closer to 400-500 billion barrels not 1.2 trillion barrels. That would give us another trillion barrels at best to consume in the future in addition to the 1.3 trillion already consumed. This brings the URR to 2.2-2.5 trillion barrels at best including extra heavy. What do you think of the URR of 3.1 trillion barrels that is commonly assumed? Also canadian tar sands and venezuelan heavy oil have very low EROI which brings down the extractable oil reserves further. Do you think that is taken into account?
I agree that the R/P numbers seem very suspicious.
No, no, no, they are not very suspicious. They are absoutely absurd!
What do you think of the URR of 3.1 trillion barrels that is commonly assumed?
Commonly assumed? By whom? Why people who believe those absurd OPEC reserve numbers of course.
Very heavy oil is another matter. It doess not have the same recovery rate as conventional oil, therefore the R/P ratio will be, and should be, totally different. But not counting heavy oil, the R/P ratios should be similar for OPEC and non-OPEC. Non-OPEC has more reserves than the OPEC.org site gives them. But OPEC has a whole lot less.
Jean Laherrere estimates C+C less extra heavy oil URR at about 2500 Gb and his older estimate for the URR of extra heavy oil was about 500 Gb for a total of 3000 Gb, he has recently revised his estimate to 250 Gb for extra heavy oil which reduces his estimate to about 2750 Gb. I tend to think the Hubbert Linearization technique tends to underestimate future output in most cases and think conventionalC+C URR (excludes both extra heavy and tight oil) will be about 2700 Gb with 100 Gb of tight oil and about 250 Gb of extra heavy oil for a total C+C URR of 3050 Gb, which if we round to two significant figures would be about 3100 Gb.
Laherrere typically deducts about 300 Gb from OPEC conventional reserves, so at the end of 2017 if we make that deduction and also deduct extra heavy oil reserves we have about 1000 Gb of 2P reserves (IHS 2P reserves match BP “proved” reserves approximately). Laherrere expects about 200 Gb of future discoveries, if we also saw 20% reserve growth on 1000 Gb of 2P reserves over the next 25 years due to higher oil prices, that would add another 200 Gb to Laherrere’s URR estimate bringing URR for C+C less extra heavy to 2700 Gb. Note that this level of reserve growth(20%) is more than 3 times lower than the US reserve growth from 1980 to 2005 (63%).
Okay, in your opinion, what does all this mean in terms of peak oil? When do you see OPEC peaking? When do you see non-OPEC peaking? And do you still see world peaking between 2022 and 2026? I believe that was your previous estimate. Please correct me if I am wrong.
And just one more question, what is your honest opinion of the OPEC generated graph below? The term “net additions” includes new discoveries plus reserve growth.
Hi Ron,
I would exclude the Orinoco reserves that have recently been added (about 216 Gb). So for OPEC that would mean net additions of about 46 Gb. If it was all from reserve growth (some was probably new field discoveries) then that would suggest only 5% reserve growth since 2006 (46/933).
I don’t model OPEC and non-OPEC separately, but the peak in both might coincide, but I expect non-OPEC to peak first and OPEC to peak a few years later. For the World I still expect 2025+/-2 years for the peak, I think it is likely the World C+C peak will coincide with the peak in US tight oil around 2025.
This assumes both my medium World and medium US tight oil estimates for URR are correct. If those estimates are too high the peak may be earlier (closer to 2023) and if the URR estimates for my medium scenarios are too low then the peak might be later (2027). I would say there is about a 66% chance my guess of 2023 to 2027 may be correct.
What is your current estimate for the peak in 12 month average World C+C output, if you also assume that there is no major World recession or major (WW2 level) war between now and the peak in the 12 month average World C+C output level?
Correction on OPEC reserve growth. The reserve growth over the 2006 to 2017 period has to account for production.
For simplicity I will assume no new field discoveries (as I do not have data for that for OPEC), 142.6 Gb of oil was produced and reserves increased by 46 Gb so reserve growth over that period was 20%, not 5% as I said earlier.
This would be an average annual reserve growth of about 1.69% per year from 2006 to 2017.
It’s possible to have very high reserves to production ratios, but the reserve booking doesn’t follow exactly the US SEC Guidelines. In some cases the idea is to sustain production for a very long time while keeping facilities full. In others the operator doesn’t want to flood the market and drive prices down. For example, I believe the state of Texas would benefit from imposing restrictions on flaring to reduce oil production as well as the waste of gas. This would drive oil prices up, and state income would be higher. But we already know state governments can behave irrationally.
This is what I’ve been trying to get across on this site on several occasions, that Saudi should be able to produce 35 million barrels/day if their official reserve numbers were correct. But for some reason almost everyone here thinks that I’m incorrect but I’ve never gotten a clear explanation why.
People have been looking at those OPEC reserve numbers for so long they have began to believe them. Yes, if Saudi has 266 billion barrels of oil reserves then they should be producing at least 25 million barrels per day. Perhaps even 35 mbd as you suggest.
R/P ratios change over time. And they are different for larger fields than smaller fields. But countries like Saudi Arabia, and other nations that get the majority of their oil from giant and super giant fields, the R/P ratio should start out very high and gradually decrease as those giant fields gradually deplete. But instead OPEC countries report the very opposite. The more oil they pump from these giant fields, the more oil they say they contain. Their R/P ratio just keeps growing and growing and growing. Why some people cannot see the very obvious absurdity of this just baffels me.
Another thing:
When SA has these giant reserves of onshore oil – why do they tap the offshore oil at all? It has much higher development costs than Ghawar style giant fields – or do all the other giant fields only exist on paper…
Speaking of the expense of Saudi offshore oil, the recently developed Manifa field will produce the most expensive oil ever produced in the Middle East.
Saudi Aramco’s Manifa oilfield production hit by technical issue: report
Manifa is one of state-run Aramco’s biggest oilfields and latest expansions, with a production capacity of 900,000 barrels per day. Aramco brought the field online in two phases.
The industry publication reported that it was unclear how much production was removed as a result of corrosion of the water injection system used to maintain pressure in the reservoir.
It added, quoting sources, that the losses were likely to be in the “millions of dollars”.
Saudi Aramco did not immediately respond to an emailed request for comment.
The offshore oilfield – made of rigs on manmade islands linked by 41 km (25 miles) of causeways and bridges over the Gulf – was discovered in the 1950s.
Manifa is pronounced ma-NEE-fah. I was pronouncing it MAN-if-a. But my son, who just retired from 28 years of working in Saudi for Aramco, corrected me.
Basic economics.
Selling 35 million barrels a day would depress prices to what…$1/bbl?
Why would you do that? No one wants to sell their valuables into a glut and destroy wealth.
Do this one or 2 times, and nobody would invest in long running oil projects anymore – only pumping their known fields.
Then earn money. When they come out of their holes again, whack them again while building up.
“should be able to produce 35 million barrels/day if their official reserve numbers were correct.”
Not that I believe the KSA reserve figures, but there is a flaw in your argument, Quite a big one:
Why would KSA produce 35mbpd or even 20mbpd? What would that do to the global oil prices? I don’t think KSA would produce that amount even if they could.
Saudi Aramco halts oil output at the world’s largest offshore oilfield: report
Saudi Aramco halted oil output this week at Safaniyah, the world’s largest offshore oilfield, Energy Intelligence reported Thursday, citing sources familiar with the matter, according to a tweet from Amena Bakr, senior correspondent at the news and research service provider. Further information was only available through subscription-based Energy Intelligence. The potential impact on oil prices depends on how long output at the oilfield is down, said Phil Flynn, senior market analyst at Price Futures Group. “The thinking is that the field produces heavy crude, and the world is short of that [type of] oil.” The unplanned shutdown takes out another 1 million barrels a day of heavy oil from the market, Alex Schindelar, executive editor of content & strategy at Energy Intelligence Group tweeted Thursday, adding that the heavy crude oil market was already tight because of the OPEC output cuts and U.S. sanctions on both Iran and Venezuela. In electronic trading, March WTI oil CLH9, +1.06% was at $54.51 a barrel, after settling at $54.41 on the New York mercantile Exchange. ~Marketwatch
Might well be a strategic move by KSA: the current situation allows to cut much less production of heavy oil to influence prices, then light sweet oil.
From https://www.oilsandsmagazine.com/news/2019/2/12/eia-warns-of-rising-light-oil-production-and-shortage-of-heavy-sour-crude
2019 BP Energy Outlook is now available if interested-
https://www.bp.com/en/global/corporate/energy-economics/energy-outlook.html
I’ve not had time to dig through it yet yet. here is the short exec summary link-
https://www.bp.com/en/global/corporate/energy-economics/energy-outlook/introduction/executive-summary.html
Looks to me more like a mixture of 50% propaganda and 50% analysis this time. Mostly parrots IEA.
One interesting tidbits is that BP thinks that mostly light (“subprime”) liquids (including NGL) will be produced:
BP claims that the US tight oil will be produced in larger quantities, which means that they preduct oil prices significantly higher then, say, $70 per barrel, the threshold below which the US production is barely profitable or unprofitable.
Funny they want their cake and eat it too: “In all scenarios, trillions of dollars of investment in oil is needed” but, at the same time BP honchos hope that the low cost oil producers will sell their oil for peanuts:
This particular “wish” looks like pure propaganda to me.
Taking clear desire of Trump administration to get back US companies in Venezuela via color revolution despite low EROEI of Venezuelan oil suggests that something different might be in play: “prime oil” is becoming a deficit product on world markets (or they feel that it will become very soon) and securing the supply of existing refineries with the proper mix became more and more challenging.
Interestingly BP also predicts refineries closures in US, Canada, Japan and Europe, but not because heavy oil might soon became a deficit and it might be too costly to retrofit them to “subprime” liquids:
Has anyone else noticed the recent run of discoveries on the North slope Alaska?
BP sees oil consumption plateau in 2030
https://www.bp.com/content/dam/bp/business-sites/en/global/corporate/pdfs/energy-economics/energy-outlook/bp-energy-outlook-2019.pdf
Renewables and gas will replace some coal but rising energy consumption will make shutting coal plants in India and China a slow process.
I have been suspicious for some time that production numbers can be corrupted by fuzzy definitions. Iran is being sanctioned, but Iran shares that enormous gas field under the Persian Gulf with Qatar. Gas production yields condensate and it yields NGLs.
High vapor pressure NGLs get labeled liquefied petroleum gas, and that is used for transportation fuel in India. Pentane Plus is used or called something akin to natural gasoline.
You can see how the definitions are going to blur and they’re going to allow declaring oil production numbers to be anything that they want them to be. Iran is using this to dodge sanctions, or they did use it when condensate was not restricted. Don’t recall if that loophole was closed in the current sanctions. That would be a good thing to know.
The same thing can happen with shale. We hear all sorts of talk about how much gas is being flared and how much gas is being captured, and you know perfectly well there has to be condensate involved. There was an article a year or so ago about NGL capture in the Bakken, but I don’t recall any follow-up. It shouldn’t take too much of a stretch on the part of state regulators to find a way to count the high vapor pressure portion of NGL as oil.
The new sanctions do indeed cover Iranian condensate.
This appears to be unimportant. Iran has a new refinery that can process that condensate for domestic use. This permits production of natural gas that would have needed to be shut in otherwise. Also, high vapor pressure LPG is being shipped for export, not covered by sanctions. This is from a story/photo as recent as last month.
In terms of raw natural gas, Iran does continue to export, but it imports, too. And appears to be a net importer (weird).
Exactly. And this, in turn, allows Wall Street to suppress the price of “prime oil” using fake production numbers, fake storage glut (which is essentially condensate glut) and similar tricks.
Please note that the US refineries consume mainly “prime oil” while the USA mainly produces (and tries to export at a discount) “subprime oil.”
Pretty polished and sophisticated racket. It might well be that shale oil companies are partially financed from those Wall Street profits as nobody in serious mind expect those loans to be ever repaid.
So OPEC cuts are the only weapon that OPEC countries have against this racket.
In any case, I think all those nice charts now need to be split into “prime oil” and subprime oil parts and analyzed separately. In the current conditions, treating “heavy oil” and condensate as a single commodity looks to me like pseudoscience.
OIL (BRENT) PRICE COMMODITY
65.83 USD +3.86 (6.23%)
I came across this very interested article the other day. https://oilprice.com/Energy/Crude-Oil/Fifty-Shades-Of-Shale-Oil.html Under section Implication Figure 1 year over year net addition in global liquids supply shows exspected 2.6 million bbl/d in 2019 , than there will be falling 2021, 2022 and forward. If at same time the world economy will show good growth this will not be suffisient to cover additional supply in growth. As this article highlight under Analysis the figure related to Bakken and Eagle Ford reach top production in 2015 and is today 22% below . From 2010 to 2015 thoose fields shows dramatical increase . From the Permian graph this field have had signnificant increase for 8 years and as most graph shows this increase might slow down significant or even decrease in 2019 onwards. As the article mention there is some cooperation between Opec and Russia regarding this issue , but so far no one have ramp up their production that much as it can cover this gap and a increasing gap in future.
For all you folks monitoring the ‘Shale Revolution’ story, today’s (Feb 15) Today In Energy piece from the EIA contains some powerful data points … both explicit and implicit.
The EIA has expanded the number of their producing regions along with a more granular breakdown of specific formations within each region.
The Powder River Basin, some Oklahoma formations, Utah, Upper Devonians are amongst those now identified by the EIA in their reporting.
A close look at the geologic make up of the new targets should show how far ranging this unconventional development has become, with the unspoken recognition that more expansion is coming in the future.
This is especially true for shallower formations as Little guys are adopting/adapting some Big Boy techniques in their efforts.
Unrelated, the Feb 13 piece from Bloomberg (Upstart Pitches Plan …) on the Calcascieu Pass LNG project from Venture Global is further evidence of the blindingly rapid advances in the world of LNG.
This project will use mid scale sized modular components manufactured in Italy and then be assembled on the waterfront of Looeezeeannuh.
Promoters expect to cut in half construction costs in this fashion.
From new manufacturing plants in Florida to Argentina to Thailand, the processing, storing, and transporting of natgas is undergoing a truly revolutionary transition.
The fact that 2 FSRUs (Excelerate’s Express and Exemplar) just bailed out New England’s energy shortage a few weeks ago will greatly impact decision makers across the spectrum and across the globe.
… and the Director’s Cut out of NoDak just released for December.
New record posted, just over 1,400,000 barrels oil per day.
That’s a grand total of 9000 more barrels a day than October and DUCs are declining there.
Combined with the 60% first year decline rate of those wells, I’m doubtful of much further growth in North Dakota. I guess we shall see.
Plausible that production could bump between 1,200,000 and 1,700,000 barrels per day for the next 2 decades.
Pricing will be a major determinant.
The 2 biggest unknowns may be the productivity of the Three Forks wells, especially the 2nd, 3rd and possibly 4th benches, along with whatever EOR efforts may show is recoverable.
Still early innings in North Dakota.
Production per well continues to decline. That’s mid-t0-late inning relief pitching right there.
Not sure what you mean by the phrase ‘production per well continues to decline’.
Decline in output happens in 100% of the wells after the initial peak at the start.
Total recovery of the OOIP of current Bakken wells is in the 20% range compared to earlier 3 to 5 %.
The re-entry of numerous older wells, frac’d in primitive fashion compared to today’s methods, invariably shows a huge bump in output.
Bruce Oksol’s Themilliondollarway blog site shows this on an almost daily basis.
The shortened drill times, along with increased targeting precision and higher oil recovery has actually expanded the productive footprint of this play significantly … both vertically (into the Three Forks) and areally – particularly up towards Canada where productive unconventional wells have been brought online for a decade.
Starting pitchers are still fresh.
Production per well has declined from the record levels so that more wells are needed to make up for the lower production. Not hard to understand the race of the red queen.
I pointed this out back in 2012
http://theoilconundrum.blogspot.com/2012/05/bakken-growth.html
You believe in marketing blurbs, whereas I believe in logic.
… and Pennsylvania just released December’s production numbers.
555,555,288 Mcf total production. (That’s a poker hand number rachthere).
The 555 billion cubic feet is a new monthly record, while the daily output of 17.9 Bcfd is just a sneeze under November’s 18 Bcfd.
For context, Pennsylvania alone is on track to produce 7 Trillion cubic feet of natgas in 2019 as new pipelines continue to come online. (Mountaineer Xpress just got the ok for the final 1.6 Bcfd online due next week. At 2.7 Bcfd total, this pipe is almost as large as the Rover).
Folks, love it or hate it (jes kidding. Most here despise ‘Murican hydrocarbons), we are witness to a stunning disruption to the contemporaneous world order.
Seems the gaz production might continue to grow in US and as EIA predict they believe the demand will continue to be strong as coal as energy source should be reduced in future. But if that will happen remains to see as espesialy developments Countries , Africa seems to stay with things as they are , most consumers lives there. If not much decline in coal there will be a pressure in gaz prize down wards and this again will reduce oil and gaz majours income as there will be less exsploration drilling that will add more pressure on OPEC and Russia. World oil consumption have exseed 100 mbbl pr. day and if suggest 2% increase anualy that is 2 mill bbl. I see Permian might add acc to EIA forcast 230k in 2019 , 180k in 2020, 140k in 2021and 2022 , 6k in 2023 , 5k in 2024… i.e In man time offshore field , onshore will continue to decline and a new offshore field might take 10 years to get first oil from discovered.
Freddy
All the above mentioned factors – and more – will continue to impact future energy and hydrocarbon production and consumption.
One of the more overlooked factors, IMHO, is the price spread between the energy content to be had in natgas versus oil .. generally a 6 to 1 ratio (more precisely 5.8/1) in comparing the price of 1,000 cubic feet of natgas to 1 barrel of oil.
6,000 cubic feet of gas costs $16 Henry Hub while 1 barrel oil costs $56 WTI as of this posting … yet each contains the same amount of heat energy.
There is an intense, world wide push to more effectively put this disparity into practical use by way of a vast array of emerging hardware, processes, and operations.
The build out of a small LNG storage tank in Fairbanks, Alaska – to be supplied by railroad-transported container modules – is but one example of this evolving process.
Smaller localized LNG supplied power plants, like the current Jamaica project, will spread to the Philippines, Indonesia, virtually anywhere power is needed.
Heck, even LNG powerhouse Australia is planning on as many as 5 FSRU-supplied import terminals to provide reliable, flexible, precisely tailored-to-need energy sourcing.
The model of the Northeast Gateway depot outside of Boston along with the recent FSRU-supplied fuel via dual buoys offers a real world example of what is possible.
USGS uses 6000 cu ft of nat gas for 1 barrel of oil. Energy equivalent. And the bad news is not all cubic feet of natural gas is the same as other cubic feet of natural gas.
The same assay issues with oil will exist for natgas. There will be other stuff in the cubic foot beyond CH4. Might contain more muscle, but effort to separate it reqd.
Watcher
Yes, the ethane, propane, butane and pentanes need to be separated from the methane, but – historically – these components were far more valuable than simple CH4.
There are Indian, Chinese, and European companies building massive crackers (new one just announced for Antwerp), ports, even a whole new class of ships with the purpose of importing ultra cheap US NGL feedstock to supply their industries.
See Energy News’ post below about Waha pricing.
The pivotal shift towards natgas will occur when – not if – mass transportation adopts a largely natgas fueled character.
This movement is well under way with trucks, busses, ships, and even trains more and more being run on methane … either in LNG or CNG form.
Not the point. You quoted 1000 cu ft above. That’s not the equivalent.
Not the point as natgas is priced in increments of 1,000 cubic feet (more precisely in mmbtus … the
actual heat content contained in almost precisely 1,000 cubic feet of methane).
Hence the multiplier by 6 to give apples to apples comparison cost/energy equivalence.
I don’t do much scrolling so I’m putting this here. Several posts above is a quote of BP’s projection of oil demand, by which of course they mean consumption.
BP does a projection based on several assumptions and I think the poster above thought they saw a plateau. The graphs look like they all rose to me, absent some extreme stuff like global ban on single use plastics.
But the posters link should be scoped out pretty carefully. I was a little bit astonished to see BP noting that field declines are I think they said 4.5% and that their increased consumption projections would require trillions of dollars of investment for supply to meet that desired consumption. Folks should open that PDF and scroll down wait a second I’ll get the page number, 84.
There is one line on their consumption chart that slopes down pretty sharply and is labeled mysteriously “no new approvals”. This is on pages where there is talk of infield development rather than discovery. But everything seems to conclude that there must be trillions of dollars of investment in oil to satisfy the consumption requirement of essentially all of their projections.
They also present on alternative something or other in which there is a surge in supply in the near term and I presume they’re saying it generates a huge surge in consumption as a consequence of lower price, and that graph’s curve upwards is mind-boggling. I don’t know who talked them into tossing that in there, but it seems somewhat bizarre for what I have come to learn is a fairly sophisticated BP analysis operation of these things. I’ve had one occasion of direct correspondence with a staffer there and the guy knew his stuff.
Watcher
Field decline rate has been a feature of oil production since the first well was drilled. Around 2003-2007 numerous articles on the oil drum highlighted the issue as if it were something new.
Obviously if no new drilling occurs then there will be a decline in existing fields. The fact is since 2005 when many Oil drummers were claiming peak oil, the oil industry has invested trillions in exploration, new technology etc.
They have successfully proved the likes of Ron wrong over the past 15 years.
Obviously at some point new discoveries will not be sufficient to make up for the increasing decline rates.
BP does appear to be acknowledging this fact and stating that trillions of dollars of investment will be needed to meet even the lowest predicted consumption levels.
There are definitions of field decline that seem to vary. Lukoil at one time actually delineated a sort of gross and net amount for fields they were producing, with gross being undrilled and net being the decline with additional drilling. Those were all post Peak fields. There are also fields with changeable boundaries, geographically. Drilling wide of a previous boundary could be called new discovery, but maybe they prefer to apply the new flow to the same field and change the decline rate.
The notable thing here is the 4.5% number, that seems to be net. BP is never this doomsterish.
They haven’t proved it wrong, they’ve moved to different resources that weren’t part of the peak calculation. Conventional oil production has more or less been on a plateau since 2005 with the occasional short-term ramp. Demand increase since 2005 has been met entirely by unconventional oil.
If more conventional oil could be produced, it would be. It’s cheaper and so more profitable at prices supporting the expensive unconventional.
Way up above, somebody brings up Robert Rapier, a truly competent man, at least when working within his professional specialty.
I used to follow his blog religiously, and took him seriously, a few years back, when wind and solar power in particular were still prohibitively expensive, which he was very quick to point out.
Back then, I was a doomer, in large part because I believed then that the exhaustion of nature’s one time gift of fossil fuels was sufficient in and of itself to result in the crash of industrial civilization. Since then, I’ve come to believe that some countries and people have at least a fair shot at transitioning to an industrial economy based on renewable energy.
As far as I have been able to find out, with the prices of wind and solar started falling like rocks over the last few years, Rapier has not mentioned them since, in terms of the viability of renewable energy. He certainly is not blogging about the cost of them, the way he used to.
Point is, people who work in various fields often have reasons to say things they do not necessarily believe, personally. You can ethically present an argument without actually believing it will prevail in the court of law, as lawyers do, on a daily basis, and you can ethically ( I suppose ) present an argument in the court of reality, without believing it will hold true in that court, so long as you acknowledge you may be mistaken.
And so far as THIS goes, a person can create and post a model, while pointing out that it’s JUST a model, and may be WRONG, by a country mile, while at the same time NOT saying what they BELIEVE is most likely going to happen.
So for instance Dennis presents models about electric cars and trucks cutting into oil consumption to the point that oil prices will actually decline, even in the face of declining production, while ethically pointing out that his model may be wrong.
Dennis, do you actually BELIEVE this is going to happen? What sort of odds would you want in order to place a bet on it happening?
I’m not trying to put you on the spot. What I’m asking is how confident you are, in terms of investing your own old age money, when you speak of oil being displaced by electricity?
Will you bet three to one that oil will be cheaper ten to twenty years from today, in constant money, than it is now? Two to one? Even money?
I applaud your modesty pointing out that you have often been wrong about oil prices and so forth. So have I, lol. I never expected oil to be as cheap as it is these days.
If anybody has links to Rapier’s current day opinions about the present and future costs of renewable energy, and whether we can transition to a sustainable industrial economy based on renewable energy, please post links, and thanks in advance.
Methinks perhaps he is not saying much about renewables because he may be making some money talking about fossil fuels. Or perhaps like most people, he doesn’t like to advertise his mistakes, lol. I don’t like to advertise mine.
Barring near catastrophic economic troubles, I cannot even imagine the price of oil going any where other than UP, and sharply up, long term, UNLESS electricity does come to dominate in the mobile power market, meaning not only cars, but also heavy trucks, farm machinery, construction machinery, and such.
Given that I might with luck live another twenty years or so, I have a personal stake in the future price of oil.
Do I replace the oil furnace with a heat pump? Do I keep the big yellow machines, knowing that every day I run one of them, or hire it out, means a good bit of cash income, or run the hell out of them now, and get rid of them ? Do I buy another gas hog truck, knowing it will only be used when NEEDED to haul stuff, or plan on getting by with a compact truck?
Will demand for solar panels and associated equipment accelerate to the point that even though the cost of production of them keeps the price of them as high or higher than at present? This could actually happen, imo, if battery prices fall far enough that demand for them skyrockets… in which case the price of batteries may stay high or go higher, even as the cost of manufacturing them declines.
The more I know, the better I understand the magnitude of my ignorance!
My personal firm opinion or belief is that there will not be enough electric vehicles sold within the next ten years at least to result in the price of oil falling, and I’m willing to make a long term bet, three to two, that in constant money, oil will cost MORE twenty years from now than it does today. It’s going to take a LONG time to wear out all the legacy equipment running on ICE power, and depletion never sleeps.
Hey OFM, I would love to own an electric vehicle. Certainly not for economics, I only use about a 1/4 gallon per day lately while keeping my old car running costs well less than a dollar a day, but for moral, ethical and enjoyment purposes.
Yep, no way to accurately predict the end of oil transport nor it’s future price. It could end up high priced as a niche specialty product for those few who still need or want it.
Considering the multitude of factors occurring in the world now I don’t really believe any predictions past 2025 and not many of the short term ones either. However, considering the increasing pressure against carbon burn at many levels as well as the decreasing profits it’s fun to look at how things might turn out. Here is a conservative view of the transition away from liquid fuel burn.
https://www.visualcapitalist.com/rise-electric-vehicle/
Hi GF,
Thanks for the link. I’m going to reply in more detail in the not petroleum thread.
It seems to me the price of oil will remain extremely volatile for the foreseeable future for the following reasons (my own wag is a range of $20-200 over the next five years):
1) High oil prices tend to lead to economic contraction, leading to reductions in oil use;
2) oil use is very inelastic in economic terms, changing slowly as prices rise and fall, meaning inventory levels will fluctuate greatly and price will follow
3) high oil prices sustained for six months or more are likely to hasten a transition to EVs on the part of consumers;
4) tight oil production is not responsive to oil price declines in the short term because of locked in quarterly planning and also because of hedged contracts;
5) supply risks from political causes will continue and likely increase as oil price volatility continues;
6) volatile oil prices will make planning for oil companies difficult because of intermittent revenue streams and lack of insight into profitability for individual oil development projects.
7) there is a large amount of uncertainty regarding future production because of the incentive to be dishonest about reserve and production numbers, thus the cushion for how much spare capacity exists is difficult to ascertain;
8) the regulations regarding oil development are likely to be changing over time because of legislation concerning climate disruption, including potential litigation and insurance costs on a massive scale…
I never cease to be amazed at what people sometimes say about me.
“As far as I have been able to find out, with the prices of wind and solar started falling like rocks over the last few years, Rapier has not mentioned them since, in terms of the viability of renewable energy.”
Someone just called my attention to this, which they thought was a “ludicrous comment about you.” The reason he considered it ludicrous is, as he says “I think you actually give more credit than renewables deserve.”
The fact is, I have written literally hundreds of positive articles about renewables. I wrote one way back in 2007 — before the explosion of solar power in the U.S. — called The Future is Solar (Link: http://www.rrapier.com/2007/07/future-is-solar/).
I am one of the reviewers for the REN21 Global Status Report, which reports on renewables around the world each year. It’s one of the most influential publications on the global status of renewables.
I could post a ton of links, but my comment would probably get caught by spam folders. My “anti-renewable” writing was focused on ethanol and biofuels. In particular, some of the unwarranted hype — especially about cellulosic ethanol (which was entirely warranted). So, I don’t know if you have me confused with someone else, or are just misremembering. But you can go to my blog or my profile at Forbes and search for “solar” (for example) and find hundreds of articles talking about solar in a positive way. These articles date more than a decade.
Regarding my Forbes article on Saudi reserves, it isn’t designed to be a proof. What I am arguing is that the methods used to suggest that Saudi’s reserves are low don’t give accurate answers if we apply those methods to other countries. I have a follow-up scheduled for this afternoon dealing with some of the feedback to this article.
Sincerely,
Robert Rapier
Robert, thanks for the reply. Looking forward to your follow-up article.
However I would love to get your opinion on Saudi Arabia’s reserves to production ratio. Right now, using their average 2018 production data, it is just above 70. The all of OPEC it is about 95, but that includes Venezuela’s heavy oil. Do you think these numbers are resonable?
I hadn’t really looked much at the R/P, but it’s not that far out of whack with the rest of the world. Canada’s is 95. Ours in the U.S. is 10.5. I recall working at ConocoPhillips in 2002 and fretting that our R/P was only about 10. Of course, 10 years later it was still about 10. Not sure what it is today. Probably greater than 10.
You had asked for my source of U.S. reserves. I pulled all reserves numbers from the most recent BP Statistical Review.
I had intended to show a number of case studies in the follow-up article, but it got so long that I am going to do that in the article after this one. Forbes wants us to keep these articles to under 1,000 words, and the one that will publish today (at 18:00 EST) is already 1,490 words.
Canada’s is 95
This is obviously because most of Canada’s reserves are tar sands, which by their very nature are much slower to extract. The same cannot be said for Saudi oil reserves, which are mostly conventional oil that can easily be extracted much faster than tar sands — so why aren’t Saudi Arabia extracting their oil much faster than they are today?
Frugal,
Perhaps because oil prices would drop too low. That is the reason the RRC regulated oil output from 1935 to 1970 in Texas (the swing producer up till then. After that OPEC regulated output to keep the market from being oversupplied.
The OPEC proved reserves are likely lower than they claim, they are probably 2P or even 3P reserves. For non extra heavy reserves probably deducting about 300 Gb from their “proved reserves” might get us close to their actual proved reserves.
Hard to know for sure.
This doesn’t explain why the Saudi’s spend billions building and operating peripheral water injection systems and refineries that can handle oil with vanadium. If they truly have 266 billion barrels in the ground, all they would have to do is drill some wells and millions of cheap, extra barrels/day would gush out of the ground.
Like the Beverly Hillbillies, that’s the way the oil industry works, just find some crude shootin at some food. 🙂
Nobody is claiming that the 266 Gb is easy to produce, just that it can be produced.
OFM,
I agree oil prices are unlikely to fall by 2030, my expectation is about 2040+/-5 years that oil prices might start to fall from $200/b down to $50/b by 2055+/-5 years. I would say there is about a 33% chance this will be correct with a 33% chance it will be earlier or later. This is a seet of pants gut feel estimate. Nobody can predict anything in the future accurately, even for next week. When we ar talking 25 years in the future it is a wild guess at best.
2019-02-14 (RBN Energy) Waha Price Collapse Signals Worsening Gas Supply Glut In The Permian
Permian natural gas production is pushing against available takeaway capacity. Waha Hub gas prices last week collapsed to their lowest level ever, with intraday trades even going negative. This wasn’t the first time that’s happened in the Permian — a similar event occurred in late November 2018 — but it was the worst to date and signals a heightened supply glut in the region, at least until the first new takeaway pipeline comes online in the fourth quarter of this year.
https://rbnenergy.com/king-of-pain-waha-price-collapse-signals-worsening-gas-supply-glut-in-the-permian
How does this work? For prices to go into negative territory i assume there are restrictions on each operator how much they are allowed to flare?
Else wouldn’t they just flare instead of selling or actually paying to get rid of the gas?
That was interesting news, what I know from offshore production is that flaring often is used for safety reason, might also be related to production tests. Each time I guess they pay for the CO2, NOx they let out in the atm. If they burn gaz just to be rid of it that sounds like high polution and cost of CO2 quota ..
I believe shale oil have also with some gaz that normaly are sold. This drop in gaz prize might further reduce shale invedtment in 2019 and lead to a further decline in both oil and gaz riggs. I see Permian exspect to grow from 3.4 Mbbl – 3.63 Mbbl or 230 000 bbl. We are now in mid Feb. and so far it seems flat… some more riggs decline weekly , all the DUC..
I just copied this from Quora, posted as part of a long comment by a person who understands the basics of the oil biz.
“Oil is becoming difficult to extract, and this operation is becoming increasingly expensive. While it is true that the use of fracking has enabled the extraction of previously inaccessible deposits, this just buys us a little more time. As it is, a Goldman Sachs study found that the cost of extracting crude oil went up over 15% a year in the decade prior to the economic slowdown (and is still rising by possibly 10% a year).”
Obviously enough, the cost of getting tight oil out is declining, but tight oil is only a small part of total oil production. I’m not sure about the costs of tar sands oil, it may be declining in real terms, or rising. I haven’t seen anything recent on the costs of tight oil.
Hopefully somebody in the biz will have something to say about the cost of conventional oil production is changing, based on their personal knowledge.
If it is going up anywhere close to ten percent a year, in real terms, world wide, the price of oil will HAVE to get back into the hundred dollar plus range within five or six years, maybe sooner.. economic troubles can lead to some countries selling for less than production costs.
My opinion is since the crack in 2014 aproximately all exploration offshore stopped, there have been some discoveries near exsisting infrastructure that some have been built out as tieback. In General even with cut in drilling cost , subsea tecnology , remote controlled platforms a brent price of 65 usd bbl will make some profit for oil Companies but you will never see a huge increase in activity to find billions of new barrels that is needed. There is also a fact less discoveries are made each 100 wells drilled and size declining in average. This trend together with increase labour cost , everything else in general will demand higher oil price to solve a global supply crize..
I was having a quick look at Europe without Norway or the UK if anyone is interested
JODI data just released
https://www.jodidata.org/
if anyone is interested…
Good question. I am sure some people on this list is interested, but not all of them. And as far as those who would have been interested ten years ago, well they just can’t be bothered anymore. They are all sure that peak oil is many decades down the road so why worry.
I am interested in all of it.
Well, especially the facts.
And unbiased analysis, when it is offered.
That decline would not be uniform across the list of countries. Probably mostly Denmark, Romania and the Netherlands. Netherlands big gas producer so there will be liquids, and eventually those liquids will be called oil.
Saudi crude oil closing stocks fell again by 2.84 million barrels to nearly 10-years low of 205.38.
JODI’s own chart: https://pbs.twimg.com/media/Dzr_iVGWoAEVkm7.png
Oilytics chart https://pbs.twimg.com/media/DzsB3kIWsAArlyG.jpg
Why on earth would Saudi stocks be falling at such a rate? If Saudi is concerned about low oil prices, they do not need to cut production, they only need to cut exports.
Saudi has 266 billion barrels of oil in the ground, and in the dead of winter, their lowest crude burn season, their stocks are falling? Something just don’t add up here.
Giovanni Staunovo
?
@staunovo
Saudi Crude Exports Slump to 6.2M B/D in 1H February: Kpler
Shipments tumble by 1.34m b/d in 1H February, compared with same period in January, consultant says in report.
BBG #OOTT
Are there any (public) estimates of how much SA produce vs. draw from inventory to cover their exports or are all these charts based on their own reported figures?
There are several issues with the reported numbers that appears odd to me.
I found, back when I was reporting JODI data, that for OPEC, they used the “direct communication” data rather than the “secondary sources” data for their OPEC production data. But that was several years ago.
It’s just their own reported figures. I know that the secondary sources quoted in OPEC MOMR use tanker tracking and reported refinery runs to check OPEC production but beyond that I don’t know.
Robert Rapier’s newest article
Discussion Of Saudi Arabia’s Oil Reserves Provokes Some Emotional Responses
I find his logic impeccable.
In summary, while I have not proven that Saudi has 270 billion barrels of proved oil reserves, I think the evidence points in that direction. And if you accept a much lower number, you essentially accept that there is a vast conspiracy involved in hiding the real numbers.
An old post by me, maybe I got the idea from Robert Rapier. I hadn’t realized he had written something on this at the time. (If so I apologize to Mr. Rapier for the lack of citation.)
http://peakoilbarrel.com/us-oil-reserve-growth-2/
I don’t find Mr. Rapier’s logic even close to impeccable.
Mr Rapier does not address a number of issues which concern Saudi reserves in his article. For instance, KSA reserves are known to consist mostly of a relatively small number of giant fields, as compared to the USA which has a much larger geographic area, many small fields and perhaps close to a million wells drilled.
In KSA most of its oil resources are concentrated in about a fifth of its 830,000 square mile geographic area. It has conducted a systematic and thorough search using seismic, drilling and other tools to explore for other resources. I believe their best undeveloped findings have been deeper gas in the known oily areas. The Shaybah oil field, said to be the last of the elephants, was discovered in 1968. Remote and relatively expensive, it was not developed until 1998. Likewise, the development of Ghawar also proceeded slowly, with the last southern parts not being developed until around 2000.
The manner in which the country’s resources have been developed has not been addressed. In the USA every promoter with access to OPM has drilled, including many wells of questionable economics. Would the LTO currently developing here be brought on at all, or very slowly anywhere else? Is LTO really economic at today’s prices?
In KSA the government owned oil company has systematically developed their resources, and by most accounts they have been thorough, methodical, and have used cutting edge technology. In the early 2000’s they combined advanced seismic, drilling, and completion technologies to create multi-lateral super wells which have been used to develop Shaybah as well as to rejuvenate many older worn out fields such as Abqaiq. These super wells have allowed KSA to maintain its massive production but when these traps have been depleted there is not likely to be an encore.
The nature of the giant Saudi fields is different from the USA. Ghawar has been described as the perfect trap. With high perm and porosity KSA expects to produce a large percentage of original oil in place. The old reserve reports Rapier referenced also expected to recover high percentages of original oil. Technology has certainly increased the amount of oil KSA will recover but I believe they are looking at increasing recovery by a few, maybe up to 10 percentage points in each field. Their best result, is pulling forward production with their super wells, not creating recoverable oil from resources such as shale which were previously considered uneconomic.
Rig counts in KSA were around 10 for much of the 90’s. They have increased sharply since with the push to maintain their production around 10 million bpd. Current levels of around 130 rigs seem needed to maintain 10, not 25.
Of course, the underlying problem comparing USA reserves with KSA is the geology, and I am not a geologist, but my understanding is that the persian gulf area is unique and not comparable to USA.
Thanks dclonghorn. I find your logic impeccable.
Good post dc.
EIA used to publish stats regarding number of US oil wells, gas wells and average TD per well.
I guess there are over one million active oil/gas wells in US, including Alaska and GOM. There are over 100K “shale wells already and US is adding 10K +/- per year.
Schlumberger had a graphic awhile back comparing the drilling intensity of the US to both Russian and the Middle East. Was an eye opener.
Thanks for the kind comments Ron and Shallow.
After reviewing recent comments, I see an additional area to address, that of the D&M reserve review. As one who used to do audits, I can tell you that auditors rely heavily on management to present them with a basis for their opinion. Auditors cannot review everything, and most are familiar with some of the noted failures such as Enron and Billie Sol Estes.
One of the old standard auditor jokes goes like this.
A prospective client interviews three firms and asks each the same question: What is 2 plus 2.
First firm answer is : We pride ourselves on our expertise, the answer is 4. They do not get the job.
Second firm: We would like to research this question and provide you with a suitable answer. No job.
Third firm: What did you have in mind? Job!
A bigger question is why would KSA want to overstate its reserves. At its face value, the answer is they would not, lower reserves should lead to higher prices realized from their oil. I don’t think it is that simple. The Saudi regime is an oppressive dictatorship that oddly relies on extensive welfare type payments to maintain power. They do have a national interest in overstating their reserves, its sort of an Emperor’s new clothes thing.
And if you accept a much lower number, you essentially accept that there is a vast conspiracy involved in hiding the real numbers.
That sentence is total nonsense. In 1980 ARAMCO suggested that quotas would be allocated on the amount of proven reserves each country has. That is, the greater their proven reserves, the higher their quota would be. Within the next few years, every OPEC nation started increasing their “proven reserves”… with a pencil. And their reserves just kept growing and growing and growing. They never did allocate quotas based on proven reserves, but that did not deter any of them from continually increasing their numbers.
But it is just downright silly to suggest that there is a conspiracy to hide their true reserves. Of course their true reserves, like those of Iran, Iraq, Kuwait and the UAE are closely garded secret while their published reserves are published everywhere. But no conspiracy is needed to keep their true reserves a secret. All they have to do is deny all other published numbers. Besides, most OPEC officials really believe those numbers. It is not really hard to believe something you really desire to believe.
I find it astonishing that you Dennis, or Robert, thinks a conspiracy is needed to claim those absurded numbers. No, no, no. It’s just a gross exaggeration, nothing more. A gross exaggeration does not require a conspiracy and it is just absurd to claim it does.
Until Saudi oil reserves are independently audited their remaining crude oil reserves cannot be verified.
This is recent audit but until the entire audit is released, maybe in an IPO prospectus, there remains uncertainty.
https://www.bloomberg.com/news/articles/2019-01-09/saudis-raise-oil-reserves-estimate-ahead-of-aramco-s-planned-ipo
http://tradearabia.com/news/OGN_349583.html
Saudi Arabia published the first audit of its vast oil reserves since it nationalized its energy industry about 40 years ago, saying its reserves total 268.5 billion, slightly more than the 266.3 billion figure that the government published previously.
The audit, conducted by Dallas-based consultant DeGolyer & MacNaughton Corp., is the first since Riyadh fully nationalized Saudi Aramco between 1976 and 1980, and it comes as the kingdom tries to generate interest in Aramco ahead of a potential initial public offering.
“This certification underscores why every barrel we produce is the most profitable in the world, and why we believe Saudi Aramco is the world’s most valuable company and indeed the world’s most important,” Saudi Energy Minister Khalid Al-Falih said in a statement posted on the state news agency’s website.
This is a link from DeGolyer & MacNaughton about their audit on Saudi oil reserves. There is no field by field split of the reserves or the quality – heavy, light, sweet etc
Feb 12, 2019
https://www.demac.com/dm-confirms-independent-assessment-of-reserves-in-saudi-arabia-for-the-saudi-arabian-oil-company/
DeGolyer and MacNaughton is pleased to acknowledge the recent completion of the first contemporary independent assessment of reserves in Saudi Arabia for the Saudi Arabian Oil Company. The study encompassed a highly detailed independent analysis of a massive dataset and onsite review. More than 60 geophysicists, petrophysicists, geologists, simulation engineers, reserves engineering specialists, and economists were involved in the 30-month effort.
In 1943, one of our founders, Everette DeGolyer, surveyed the Middle East and Persian Gulf area as part of the war effort. Mr. DeGolyer was quoted at the time as declaring, “The oil in this region is the greatest single prize in all history.” At the time of this survey, Mr. DeGolyer’s estimates and predictions that the Middle East would become the center of the world’s oil production were considered by some to be massive exaggerations, but his work has since been found to be quite conservative. DeGolyer and MacNaughton’s work in the Kingdom of Saudi Arabia continues Mr. DeGolyer’s legacy of knowledge and integrity, and the firm remains at the forefront of the petroleum consulting services industry.
Below is a compilation of article links where you can find further information regarding our most recent work in Saudi Arabia. At this time, DeGolyer and MacNaughton will make no further comments on this extensive project.
This link had some more detail
https://www.reuters.com/article/saudi-oil-reserves/update-3-saudi-arabia-announces-rise-in-oil-reserves-after-external-audit-idUSL8N1Z93WO
The consultant evaluated 54 major oil reservoirs operated by Aramco, out of 368 in its portfolio. In DeGolyer’s view, these contained 213.1 billion barrels of proved oil reserves, compared to 210.9 billion as estimated internally by Aramco.
Thanks Tony.
More than 60 geophysicists, petrophysicists, geologists, simulation engineers, reserves engineering specialists, and economists were involved in the 30-month effort.
That’s a lot of doods. Who funded it?
Watcher,
All audits are paid for, so I guess that means we cannot believe any of them.
A reputable firm does not lie when they make these evaluations, they make their best estimate as their reputation for honesty is the core of their business.
Of course.
Just like tobacco danger audits funded by the tobacco industry were entirely credible because the analyzing firms had to be so very careful about their reputation.
I also recall the brain cancer/cellphone linkage study was funded by Motorola and challenging it on that basis never really got traction.
Watcher,
In those cases there were competing studies, perhaps there are other audits of Saudi reserves which give different results.
Every reserve audit is paid for by the oil companies, so perhaps they are all lies and we know nothing.
No doubt that is your position, there are a number of different estimates by USGS, IHS, Jean Laherrere, etc.
They are not really that far apart, 3000 Gb to 4000 Gb, probably 3500 Gb+/-500 Gb for C+C+NGL World URR is not a bad guess. At low prices it might be toward the low end and at high oil prices it might be close to the high end of this range.
That’s only $100 million. The Saudis can afford it.
The fishy things are the more side themes:
Why do they want to produce from the neutral zone – not really necessary the next 50 years with that reserves?
Why do they produce the expensive off shore fields? They could wait for a few decades more before spending this money.
Normally, a tapped giant field produces for 50-60 years – so with an original 4-500 GB ressources(this survey + everything they produced already) they should have capacity for up to 20 or 25 mb / day. They have erverything tapped they have, not some giant fields untapped as reserve.
Russia produces 11 mb/day from reserves of round about 100GB.
Good points Eulen.
Exactly, why would you develop more expensive and complicated offshore if you have “unlimited” resources left in cheap and easily accessible already developed areas?
Dont they need that money to pave the streets with gold, balance the budget, keep people happy? What king or politician would make that desicion? Lets develop the more expensive stuff we dont need so i have less money to throw around.. makes sense?
Schlumberger mentioned in their q3 in the q&a they had contact for drilling 400 infill wells for saudi during the next 3 years think starting year was 2019. Why is that needed if these unlimited reserves are there?
Or should we look at it the different way, 400 new holes unlocks these reserves or perhaps even more future reserves?
“everything they produced already) they should have capacity for up to 20 or 25 mb / day.”
The logic flaw is that they don’t want to drive down oil prices. The logical approach for a net export is to produce what you need and not excessively produce causing prices to fall or run out. Sorta like the UK did with its North Sea production, but running it dry when Oil prices were rock bottom in the 1990’s.
That said, I very much doubt KSA has anywhere near the reserves they quote. I use to read the Saudi Aramco tech articles that would explain all the advanced Tech they used. They deliberately left off the field names, but it fairly easy to figure out which fields. I believe they no longer post their tech journals on their Website (I couldn’t find them)
I recall reading back in 2014 that Arab-D of the Ghawar has a oil column between 30 Feet and 10 feet deep. They designed special lateral intake ports with sensors that could be shut off when the water column reached the intake. This was to reduce to the water cut. I also recall that have to periodically drill new horizontal well above the old ones as the water column rises above them.I presume that as the water column continues to shrink it becomes more & more difficult to manage the water cut as well as the need drill new horizontals above the old horizontals more frequently, as the oil column thins.
Regardless its only a matter of time when Oil production peaks and the world simply isn’t prepared for future Oil shocks. Couple that with exploding global debt and aging populations its surely going to be a mess.
The logic flaw is that they don’t want to drive down oil prices.
Bad logic TechGuy. Saudi did not increase production when oil was well over $100 dollars a barrel. And they have been producing oil for over 70 years, long before OPEC existed. Now you are telling me they always kept production down just tokeep prices high? NO, they have always produced every barrel they possibly could except in the periods when OPEC cut production. Or except during the Iran, Iraq war in the early 80s when the tanker wars forced them to cut.
Also, Manifa is the most expensive oil ever produced in the Middle East. Why did they spend billions to keep production up if they had all that oil?
However for a better explanation see Jeffrey Brown’s comment in my post below.
Ron,
You seem to be missing this:
To reiterate, in preparation for an IPO of Aramco, Saudi Arabia commissioned an outside audit of its oil reserves by Dallas-based consultant DeGolyer and MacNaughton. Their business is auditing reserves around the world, and hence the integrity of these audits is important. The study took two-and-a-half-years, and also involved Gaffney, Cline and Associates, part of Baker Hughes. Sources told Reuters that “the independent external audit has found the proven oil reserves to be at least 270 billion barrels.”
and
Two different consulting agencies, involved in a two-and-a-half-year study of Saudi’s reserves, are lying about the results — risking their credibility and future business for the sake of this study.
Higher oil prices are a big reason for reserve growth, if Saudi reserve growth has matched US reserve growth from 1980 to 2005, and the large number of wells drilled in the US suggests the US has been explored extensively so one would expect reserve growth would be lower in the US than in Saudi Arabia as it is a more mature basin with more thorough exploration.
Before the “shale revolution” US reserves grew by about 63% over a 25 year period (1980 to 2005).
My guess is that Saudi 2P reserves are probably about 180 Gb and 3P reserves might be roughly 270 Gb, proved reserves might be as low as 100 Gb. Nobody will really know unless there actually is an IPO for Saudi Aramoco.
Well the IPO was yanked for unclear reasons.
https://www.reuters.com/article/us-saudi-aramco-ipo-reforms-idUSKCN1L90ZK
As to do the Saudis have any consequences for lying or being, er, very optimistic? No they don’t. They’d have internal consequences if they did adequately plan for a decline because this is all of their budget but do they have to tell anyone else? Nope. Can they have a certain truth they tell to consultants? Yep. Is a consultant going to physically duplicate Aramco’s exploration work? Heck no…
The Saudis have had 270B barrels of oil since the 80s even though they’ve been producing 3-4B/yr. An independent audit found, miraculously, that they still have 270B barrels of oil. As a small business owner I can tell you that my books can be audited and deemed in good order, and the auditor will never have gone back in the warehouse to see if there is actually any of the stock that I have listed in the books. The Saudis will have 270B barrels of oil, until, one day, they have none.
Stephen,
US proved reserves decreased by 8 Gb from 1979 to 2005 while only 6.3 Gb was discovered in new fields, so we might expect only 14.3 Gb of oil was produced over that period to balance the books.
Instead we find that 62.9 Gb of oil was “magically” produced by the US from 1979 to 2005. This “magic oil” comes from reserve growth, but it can only happen in the United States, it is not allowed in OPEC nations. 🙂
It’s the 270 GB that implies they are lying – how much is unknown.
Reserve growth and production never is hand in hand – it would be slowly decrease to 200 during the 90s, increase to 300 with higher oil prices for reclassifying marginal fields or introduction of new recovery technic, and reducing again.
Or a bump up with the discovery of a new field (this is always good for propaganda reasons).
Instead it was constant 270 over almost 40 years – not believable. And the audit was too near at this 270 – a 300 or a 250 would have been more believable.
So we still know nothing yet – perhaps it’s 150, perhaps even 300.
Your auditor never tests your inventory controls in any way? Hmm.
In any case, aren’t we talking apples and oranges? You’re talking about a financial/bookkeeping audit, and the KSA audit is of physical reserves, not of finances.
The point I was trying to make above was that in any complex audit the auditor must rely on management as the source of most information.
Further, management normally provides conclusions about that information, and the auditor usually has an incentive to get to the point of agreeing with that conclusion. In this case, there is no incentive to look to hard to find deficiencies in KSA’s representations.
Hi Ron,
Thanks for the correction.
https://www.forbes.com/sites/rrapier/2019/02/17/discussion-of-saudi-arabias-oil-reserves-provokes-some-emotional-responses/#147a9631bc1d
The dude said his methodology for evaluating reserves did not rely on R/P and there was some talk how about while there is no proof of the methodology being valid, it seemed to be accurate for other countries.
Something like that. He’s using he said BP’s numbers for Reserves. So we really shouldn’t care what this guy has to say. What we would care about is what BP has to say.
I thought the old methodology, and maybe it is still the current methodology, was to make an estimate of volume of rock in the oilfield. Then that volume number is multiplied by whatever porosity data exists. One would hope there are multiple drilled rock samples for that data, which would be averaged. From the same samples one should be able to evaluate a percentage of water versus oil. This will tell you how much of the porosity in the rock will be filled with oil versus water.
Then you have at that point an estimate of how much oil is in the field.
Then presumably one makes an estimate of how much of that’s recoverable, and one probably has to adjust the recoverable number based on price, too. At that point you have an estimate of reserves in that field.
The powers-that-be would examine this number, and if that number is not what they would like it to be they can credibly adjust some of the values used in the computation stream just described to get a different final number. A CEO going into the bank to borrow money is going to need collateral in the form of estimate of how much oil is in the rock. As Ron mentioned above the OPEC folks used to allocate quota-based on reserves and if a country wanted to produce more oil and sell it they needed a new estimate of bigger reserves. Such an estimate is fairly easy to produce as was just described. There are all sorts of coefficients and multipliers in the computation stream that credibly can be adjusted to get the final result desired, and it won’t be glaringly offensive to anyone.
And thus you can get results that differ appreciably from reality without any conspiracy at all. And you can do all of that without declaring condensate or NGLs in the rock to be oil. One would suspect that will take place sometime in the not-too-distant future, but KSA can report almost any number that it wants to now, and the calculations leading to it will look benign.
It depends. For a large field we start with a description of the geology and petrophysics. This is usually done with models, which incorporate the well and seismic data. The data between wells can be filled in using different techniques, of which krigging is more sophisticated. This yields a static model. The static model is scaled up and we run a dynamic model using fluid descriptions. I’ve seen cases where there were multiple field descriptions and multiple dynamic models used for the history match. History match involves matching the field’s performance. One trick I like to use is to keep the model unaware of the last three years’ history to see how it does forecasting that period.
There are zillion ways of doing this, but that’s the way it has evolved. Younger professionals tend to trust the static models too much, get lazy and allow busts in the data, so I’ve had to get very hard nosed to get them to clean up their act.
Meanwhile we look for analogues, fields which resemble as much as possible what we have. The problem with analogues is the difference in development pattern and operations philosophy. But they tell us the ball park recovery factor. And of course the model’s oil production rate gas to mimic the actual well rates. That’s easy to do because we fix oil rates and match other fluids, pressures, and saturation. The model can have a simple black oil fluid description, or a compositional description, with fluids partitioned in pseudo components. This means we can have the oil divided into four components, NGL, and gas. This partitioning into pseudo components is almost an art form, but computers are getting much better at doing it automatically. Injecting CO2 adds a lot more hassles.
Hope this helps, and don’t forget this is what we do with a fat budget for large fields.
The Norwegian Petroleum Directorate gives a new production forecast every year. 2019 has a deep dip for summer maintenance. Then I guess Johan Sverdrup starts at the end of the year. This chart shows crude oil + condensate without NGLS.
Chart https://pbs.twimg.com/media/DzwrcLhXgAAnmKc.png
NPD -> http://www.npd.no/en/news/Production-figures/2019/January-2019/
2019-01-10 (S&P Platts) The Norwegian Petroleum Directorate – In its annual industry report, the NPD forecast a further 4.7% drop in oil production this year, including condensate and natural gas liquids, after a greater-than-expected 6.3% fall last year. Last year’s decline had been greater than expected due to the complexity of some more recently launched fields and a shortfall in drilling activity, it added.
The NPD reiterated expectations that overall liquids output will return above 2 million b/d in 2020 thanks particularly to the start of production at the Johan Sverdrup field, expected toward the end of this year.It also predicted that crude oil production alone would reach the 2 million b/d mark in 2023, reflecting the start of production in 2022 at phase 2 of Johan Sverdrup and the Johan Castberg project in the Barents Sea.
https://www.spglobal.com/platts/en/market-insights/latest-news/oil/011019-norway-resource-shortfall-to-curtail-oil-gas-production-improvement-regulator
Just to keep it on the radar screen, the USA produces approx 1 Mbpd corn ethanol, utilizing close to 40% of the USA corn crop acreage equivalent. This production is still subsidized.
Oil producers facing a challenging pricing environment are in direct competition with corn farmers, who face their own perennial economic challenges.
Is prime farmland being used (and subsidized) for corn ethanol a clever use of scarce economic and environmental resources in a time when oil production from hydraulic fracturing has emerged as a major energy source?
The moonshine to gasoline industry is an ecological and economic disaster, in every respect except one. It makes and has made a lot of money for farmers in the corn biz, farm equipment manufacturers and dealers, and business men in the processing and shipping end of the biz.
First class fuck up for everybody else, excepting certain politicians.
But I must admit that a million barrels of ethanol means we need somewhere around seven hundred to eight hundred thousand barrels of gasoline a day less, so this must have a serious effect in terms of depressing the price of crude, and the price of gasoline. I can’t seem to find any good figures on the elasticity of gasoline, except long term estimates, but the effect has to be real, even if it IS hard to measure accurately.
It should also be acknowledged that the leftover mash is a superb livestock feed, and worth quite a bit of money, on your feedlot operation, if you happen to have access to it in bulk at wholesale prices.So this feed stock certainly offsets some of the higher price farmers must pay for corn to feed it directly.
So, so long as we continue to eat lots of beef, the picture is not quite as bad as it looks, at first glance.
But the rational thing to do, if we were actually rational, would be to spend the money on efficiency and conservation, rather than moonshine. The corn and equipment and processing guys would still be doing their NORMAL business, and ALL of us would be a little better off, economically and environmentally.
Production of ethanol from corn probably has EROEI 1.5 (https://peakoil.com/alternative-energy/the-eroei-of-ethanol )
so most of those “seven hundred to eight hundred thousand barrels of gasoline a day less” are consumed on production of ethanol.
With expenses of mixing of ethanol and additional losses from increased corrosion EROEI might be 1.2 or less.
Except that most of the energy inputs of ethanol are not liquid fuels. They’re mostly NG.
Irans oil minister claims Iranian recoverable oil reserves stand at 160 billion barrels.
http://www.iotco.ir/en/newsagency/3924/Iran-recoverable-oil-reserves-at-160bn-barrels
To get the real number, all you have to do is divide the official number by three!
It doesn’t look too absurd.
But some numbers are not consistent. 50 billion in 4 yrs is 3.4 mbpd, rather a lot less than quoted 4.
Unless you count the 750K bpd condensate. Then . . . it’s ballpark.
That’s really the big story of Iran. 750K bpd condensate vs 0 in 1979. The final sentence says they doubled gasoline output, also likely high vapor pressure pentane plus from the gas field.
Sanctions are not going to hurt these guys. They have plenty of money, especially when it all becomes cryptorubles.
Russia has half the reserves of Iran and produces round about 11 mb/day – so they can get up to 20? It’s all conventional oil, mostly in giant fields so this should be possible. Would be a death blow to their rival Saudi Arabia.
New EIA report:
https://oilprice.com/Energy/Energy-General/Permian-Production-To-Jump-Over-4-Million-Bpd-In-March.html
Production is strong growing in all shale areas. Pipeline problems look to be solved, I never hearded anything again about the deep Bakken discont or deep Permian discounts?
Eulenspeigal
The Director’s Cut includes a few months of ATW (At the Wellhead) pricing along with contemporaneous WTI pricing.
For Nov/Dec/Jan/Feb, the differential was $17/26/13/9 per barrel.
The operators attempt to minimize the spread in various ways, especially by hedging.
There are a few hundreds of thousands of barrels shipped out every day via CBR and these customarily fetch higher prices.
The dominant destinations are Louisiana refineries (garnering LLS prices), and east and west coast refineries who draw their supplies from the global market.
2019-02-20 (S&P Platts) Saudi Arabia’s energy minister Khalid al-Falih said Wednesday he was confident a long-running dispute over the country’s shared Neutral Zone oil fields with Kuwait will be resolved this year.
Saudi Arabia and Kuwait launched fresh efforts last year to agree on the terms for the restart of the oil fields in the Neutral Zone but little progress had been made by late 2018, sources have said.
https://www.spglobal.com/platts/en/market-insights/latest-news/oil/022019-saudi-arabia-confident-of-neutral-zone-deal-with-kuwait-this-year
Here is what the EIA’s Drilling Productivity Report says will happen in March.
They say, total new shale oil produced in March will be 628,526 barrels per day. (Net increace+Legacy decline)
Net Increase will be 84,406 barrels per day.
Legacy Decline will be 544,119 barrels per day
Therefore for every 1 barrel per day increase, 7.45 barrels of new oil had to be produced.
Therefore for every 1 barrel per day increase, 7.45 barrels of new oil had to be produced.
This is simply mind-blowing. And the more oil they produce, the more oil they need to produce to keep from going negative. How long can they keep this up?
https://www.rigzone.com/news/permian_oil_and_gas_production_to_hit_new_records-21-feb-2019-158209-article/
Seems EIA predict production in Permian will increase from 3.98 MMbpd to 4.02 MMbpd next month. Guess it have been mostely flat at least US production have been 11.9 MMbpd since January. Think than an increase of 40 000 /3 month = 13. 333 x12 = 160 000 barrels for 2019 increase seems reasonable. World demand seems increase by 1.5-2.0 MMbpd. Hopefully Permian production will increase significant when tje new pipeline is compleated 4th Quartile 2019 but that remaind to see.
Are you sure ?
For the permian and for march, the legacy decline is not 249 217 but 249 217 – 244 310 = 4907
So the total new shale oil un march Will be 84 406 + 4907 and not 84 406 + 249217
Because february have already compensed the decline from January, January for december etc…
Am I wrong ?
Yes, I am sure, and yes, you are wrong. You are reading it all wrong. The legacy decline numbers are the total decline for that month, just as the prodeuction numbers are the total production for that month. Per day per month of course.
Just as Permian production increased, or will increase, by 43,237 barrels per day, legacy decline will increase by 4,907 barrels per day.
They give you the total legacy decline. You don’t have to subtract one number from the other to get it.
Ok I understand, but that’s doesn’t mean what freddy say:
“This is simply mind-blowing. The more oil they produce, the more oil they need to produce to keep from going negative. How long can they keep this up?”
If we take year average for the permian, we have this number …
I have no idea what those numbers you posted are. But what Freddy says is exactly correct. The Permian has a legacy decline rate of over 6% per month. And the total shale area of the USA has a legacy decline rate of about 6.5% per month.
Therefore the more oil they produce, the more they must produce just to stay even. (The Red Queen Effect.)
My numbers are
“Therefore for every 1 barrel per day increase, X barrels of new oil had to be produced.”
with X being the average for 2007 then 2008 then 2009 etc…
(sorry, my english is bad)
And yes, I just saw that with the decline/month
Interesting, short article today from Bloomberg/Rigzone about Brazil’s new deepwater production platform starting up.
In December, Brazil produced 2.7 million bbld and the Lula field alone should pass the 1 million barrel per day threshold this year.
The numbers relating to resource size are very high.
As this mammoth operation continues to successfully evolve, the anticipated huge potential of the global pre salt potential inch closer to realization.
Presalt isn’t global, because salt is fairly rare. Don’t forget it gets deposited where the ocean dries up, and then the salt layer gets covered with sediment. The best place to find it is in rifting zones, where a crack opens up, fills with nice juicy source rock, then sand or carbonates, then it dries up, and leaves a nice thick salt to drape over the older layers. For example, basins such as Western Siberia have no significant salt deposits. But the Atlantic did have salt deposited in what was to be Brazil, Nigeria, and all the way down to Angola. But there’s no salt further south. So Argentina has a lousy potential.
U.S. Petroleum Balance Sheet
US crude oil exports at a new record high of 3607 kb/day
Saxo Bank chart summary https://pbs.twimg.com/media/Dz8Qlf-X4AE54s9.png
EIA pdf file: http://ir.eia.gov/wpsr/overview.pdf
Mamdouh G Salameh’s Response to Robert Rapier’s article
Jeffrey J. Brown
9:35 AM
From Oilprice.com (Dr Mamdouh G Salameh):
In a paper titled:”Saudi Proven Crude Oil Reserves: The Myth & the Reality Revisited” I gave at the 10th IAEE European Energy Conference in Vienna, 7-10 September 2009, I reached the conclusion that Saudi proven crude oil reserves actually range from 90-125 billion barrels (bb) and not the 264 bb the Saudis were claiming then. That was 2009.
However, there has recently been claims that an independent audit has put Aramco’s Oil Reserves at $270 billion Barrels”. It transpired that the audit was neither independent nor unbiased since some of the companies that conducted the audit (DeGolyer, MacNaughton, and Baker Hughes’ Gaffney, Cline, and Associates) have or have had service contracts with Saudi Aramco, so it can’t truly be classified as an independent audit.
Still, I decided to make a new estimate of Saudi proven reserves by adding Saudi production since the discovery of oil in 1938 till now (for which we have figures) and then deducting them from Saudi claimed proven reserves along with an annual depletion rate of Saudi aging fields averaging 5%-7% for the same period. My calculations came to around 70-74 bb of remaining reserves compared with the figure in 2009 allowing for production since 2009.
The fact that Saudi Arabia’s proven reserves remained virtually constant year after year despite sizeable annual production and a lack of major new discoveries since 1965 is due to the Saudis increasing the oil recovery factor (R/F) and the oil initially in place (OIIP) to offset the annual production. The Saudis have been declaring an R/F of 52% or even higher when the global average is 34%-35%. They have also increased the OIIP from 700 bb to 900 bb on the basis of Saudi Aramco projecting new discoveries which are yet to be discovered.
Venezuela does have the world’s largest proven reserves estimated at 303 bb and growing. However, the United States Geological Survey (USGS) estimates that there may be more than 513 bb of extra-heavy crude oil and bitumen deposits in Venezuela’s Orinoco belt region. The fact that the bulk of the reserves consists of extra-heavy oil doesn’t detract from the fact that they are proven and have been refined in Venezuela’s own refineries in Texas and sold in the United States as gasoline and diesel. Moreover, it is virtually no different from Canada’s tar sand oil.
Your argument that the rise of oil prices to triple digits has made Venezuela’s extra heavy oil economical to produce applies also to Canada’s tar sand oil and US shale oil (though shale oil is light).
Your argument that Saudi barrels were deemed to be economical to produce even before oil prices spiked is a valid one but it misses the point about reserves. Irrespective of whether crude oil reserves consist of light or medium or heavy or extra-heavy crude, once they are proven they are all categorized as oil reserves. Of course, cost of production is a very important factor in the economics of oil and the profitability of production. In this regard, the production of Venezuela’s extra-heavy oil at current prices is not different from an economic point of view from US shale oil production or Canadian tar sand oil production.
Finally, the claimed audit about Saudi reserves smacks of a blatant attempt by Saudi Aramco abetted by foreign oil companies which are beneficiaries of Saudi Aramco largess to resurrect the IPO of Saudi Aramco. The IPO is dead and buried. We now know that the withdrawal of the IPO was because of risk of American litigation related to the 9/11 destruction of the World Trade Centre in New York and question marks about the true size of Saudi proven oil reserves. However, when Saudi King Salman called off the IPO, he justified his decision by saying that he didn’t want to expose Saudi Aramco’s finances or reserves to be scrutiny. His words speak volumes about Saudi reserves.
Dr Mamdouh G Salameh
International Oil Economist
Visiting Professor of Energy Economics at ESCP Europe Business School, London
Two other articles:
What is the Real Size of the Saudi Oil Reserves? (Pt 1/2)
http://blog.gorozen.com/blog/what-is-the-real-size-of-the-saudi-oil-reserves-pt-1/2
What is the Real Size of the Saudi Oil Reserves? (Pt 2/2)
http://blog.gorozen.com/blog/what-is-the-real-size-of-the-saudi-oil-reserves-pt-2/2
My comments:
The data suggest that on a net exports basis, after subtracting out rising domestic liquids consumption, Saudi Arabia has been supply constrained since 2005.
Their net exports of total petroleum liquids (BP data base) increased from 7.1 million bpd in 2002 to 8.7 million bpd in 2005, but their net exports have been below the 2005 level for 12 straight years, through 2017, averaging only 7.9 million bpd for 2006 to 2017 inclusive.
Note the large increase in Saudi net exports from 2002 to 2005 as annual Brent crude oil prices approximately doubled from $25 in 2002 to $55 in 2005.
However, as annual Brent crude oil prices doubled again, from $55 in 2005 to $110 for 2011 to 2013 inclusive, Saudi net exports averaged only 8.0 million bpd during this three year period of triple digit oil prices, versus 8.7 million bpd in 2005.
Regards,
Jeffrey Brown
Thanks for Dr Mamdouh G Salameh’s response, I’ve read his comments before, and he seems knowledgeable and credible. I do not know if he has more info than publicly available, but there is this:
“They have also increased the OIIP from 700 bb to 900 bb on the basis of Saudi Aramco projecting new discoveries which are yet to be discovered.”
Now I understand how you get to 270 bb barrels of proved reserves for KSA, just count the projected new discoveries, and project what you want, don’t worry about the “proved” thing.
I hope Dr Mamdouh G Salameh stays far away from the Saudi embassy in Turkey.
As Frugal suggested, it looks like the rule of thump for the estimate of proven reserves for Arab nations should be to take the official figure and divide it by three.
Also just adding different types of reserves like tar sand and Saudi oil is a somewhat questionable exercise. And resulting graphs are pseudoscience.
They are not created equal. They differ by EREOI (considerably).
By some estimates EROI of tar sands is around 3. https://journals.plos.org/plosone/article?id=10.1371/journal.pone.0144141
Which means that 300 bb of Venezuela oil or Canadian tar sands are equivalent to only to ~200 bb of regular heavy oil from Saudi wells with EROEI 20.
And higher oil prices does not change EROEI they just make oil with lower EROEI profitable to extract. For example, oil prices need to be around $80 per barrel for oil sands mining to be profitable.
We can also use Hubbert linearization for all Saudi output. That suggests remaining reserves at the end of 2017 of about 194 Gb. Generally the Hubbert Linearization method is not very reliable, often it underestimates future URR.
See Robert Rapier’s post from 2007 at link below.
http://www.theoildrum.com/node/2389
I agree with Mr. Rapier that the HL method is unlikely to give an accurate URR estimate.
In any case the chart below gives such an estimate which is highly likely to be an underestimate of Saudi Arabia’s URR.
A Hubbert Linearization from 1991 to 2009 gives a much different URR estimate of 200 Gb, this is the problem with the method, it gives widely different results, some will like the 200 Gb answer, others will like 340 Gb basically we are left with little insight.
Note the red dots are 2010 to 2017 data, not used in the HL fit. A fit on 1994 to 2017 gives about 277 Gb for the URR.
Very interesting regrding Saudi Arabia oil resourses. There is one factor that we often see in sand stone reservoir where they use water injection to maintain reservoir pressure. Often the result is brittle rock with fraction. This might impact how much oil can be exstracted even permeability is exselent.
Reviewing this past weekly(2/15) oil inventory report reveals import of 7.5 million barrels/day and 7.0 million barrels/day for the past 4 weeks. Yet I hear how we are down to perhaps 1-2 million/day and even that we are a net exporter. Could someone Help me understand what is going on to this non oil person! Thanks in advance
Hi Doc,
I’m not one of the experts, but I can nevertheless answer your question!
Short answer:
The fossil fuel industry is in bed with certain politicians whose mascot is the elephant, and together they put out a continuous stream of half facts, cherry picked facts, and outright lies in furtherance of their own ends.
You’re at the right place to get the straight dope. HERE.
Doc,
You need to look at more of the report.
http://ir.eia.gov/wpsr/overview.pdf
Crude imports on line 5 as 7,522 kbpd, crude exports on line 9 are 3,607 kbpd for net crude imports on line 4 of 3,915 kbpd.
Other supply includes products and natural gas liquids. It shows net imports on line 21 of -2,809 kbpd. Total net imports of Crude and Petroleum Products on line 33 are 1,106 kbpd.
This is somewhat questionable math as one barrel of oil and one barrel of condensate have different energy content (condensate is around 60% of oil).
So condensate input into the USA energy balance should be multiplied by approximately 0.5 to get a more clear picture.
The USA imports heavy oil and exports condensate. Not the same liter for liter things.
All of which combines to make tracking of production a very shaky thing. The liquid leaving is subtracted from the liquid coming into the United States and a net quantity is quoted. The liquids aren’t the same.
The usual reaction is to wave a hand at this and say the liquid leaving is paid for. So is the liquid arriving. The price won’t be the same, but just the fact that it’s paid for somehow generates underpinning to the rationale that it’s the same thing.
For Saudi reserves I agree the 1P reserves are likely less than reported in BP Statistical review. In 1979 the 2P/1P ratio was about 1.6=177.5 Gb/110 Gb. It think it likely that Saudi reserves may have grown, just as they have in the US (with an annual rate of growth from 1980 to 2005 of about 1.9% per year). I would put the Saudi proved reserves (1P) at about 160 Gb and 2P reserves at about 250 Gb at the end of 2017. An assumption that R/P ratios will be similar in different nations is not one I would use. A quick look at these ratios for different nations reveals wide differences.
Ron may be correct that the Saudis produce every barrel they can when oil prices are high. The point being missed is that the rate that they choose to develop their resources is very different from other nations because they do not want to flood the market with oil and drive down prices, even simply developing excess production capacity will have a negative effect on oil prices (driving them lower). So they develop their resources very slowly relative to most non-OPEC nations.
In that case why did they choose to develop expensive offshore if they had other options?
Baggen,
I imagine they chose whatever option they thought best. Not all resources are equal, some are more difficult to develop than others. Generally the resources that will be the least costly to develop and produce are developed first (of those that have been discovered).
Exactly and that is my point, if they now have 200 gb left or whatever the amount is, most of that will be on land in previous developed resources as new discoveries was quite limited after 80s right?
Why then go for the offshore expensive stuff, if they have 200 or so easy inland Gb of reserves?
In my mind the only reason for developing those offshore resources is they are actually forced to do so as they don’t have any other better option that hasnt already been developed.
Dennis, from Dr. Salameh’s report above:
The Saudis have been declaring an R/F of 52% or even higher when the global average is 34%-35%. They have also increased the OIIP from 700 bb to 900 bb on the basis of Saudi Aramco projecting new discoveries which are yet to be discovered.
That should tell you all you need to know about Saudi reserves. They are basing their reserve numbers on the belief that they will recover 52% of the oil in the ground when the global average is 34% to 35%. And they increased their Oil Initially In Place by 200 billion barrels, based on what they expect to discover but have not discovered.
That’s it Dennis. That is both incredible and outrageous. That should settle the argument about Saudi Reserves.
A 52% recovery factor isn’t unreasonable. It can be achieved with careful reservoir management. The worldwide recovery factor isn’t useable for much.
Ron,
Often OOIP estimates are revised with better knowledge of the reservoir and as oil prices rise, making parts of a field thought initially to be too expensive to produce economically recoverable. Also better technology allows better recovery factors. The Saudi resources are some of the best oil reservoirs in the World, the recovery factor is likely to be higher than the World average. Let’s imagine at the end of 2017 Saudi 2P reserves were 260 Gb, that would imply a URR of 370 Gb and if OOIP was 900 Gb the recovery factor would be 41%. Proved reserves would be about 160 Gb in that scenario.
By the way, things are getting interesting in Venezuela over the next few days.
Vulture funds started to descend on shale oil companies
https://www.bloomberg.com/opinion/articles/2019-02-22/the-next-shale-fracker-revolution-has-begun?srnd=premium