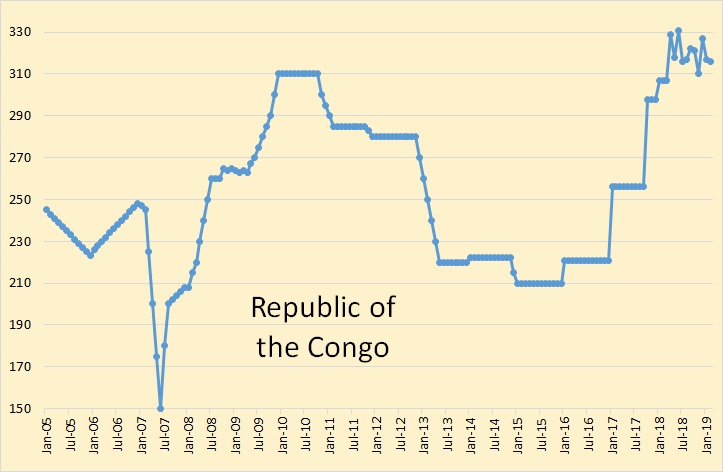
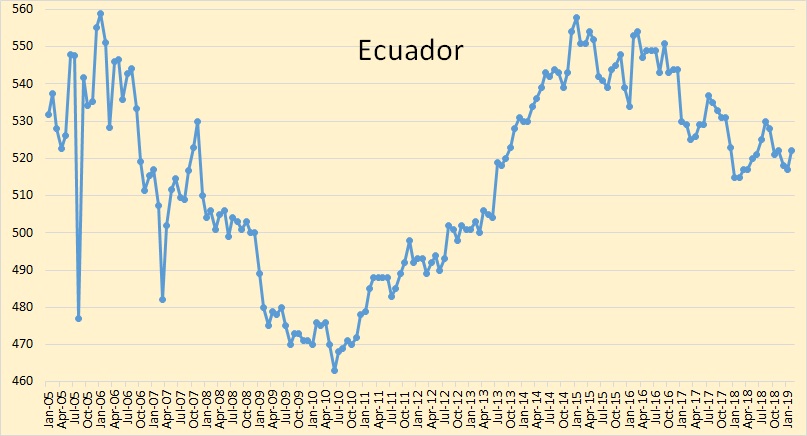
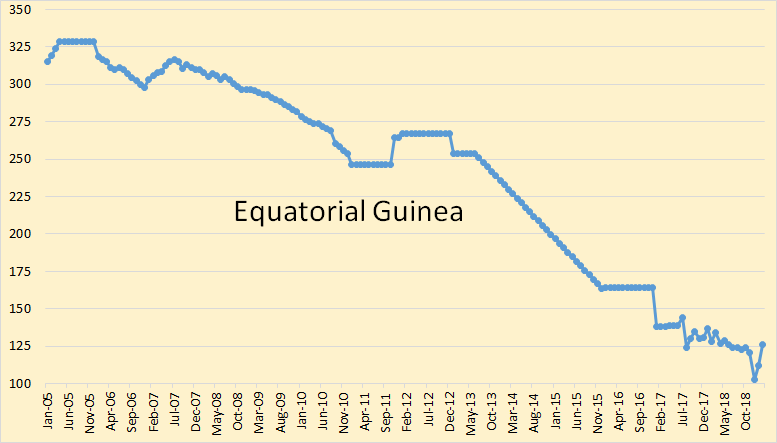
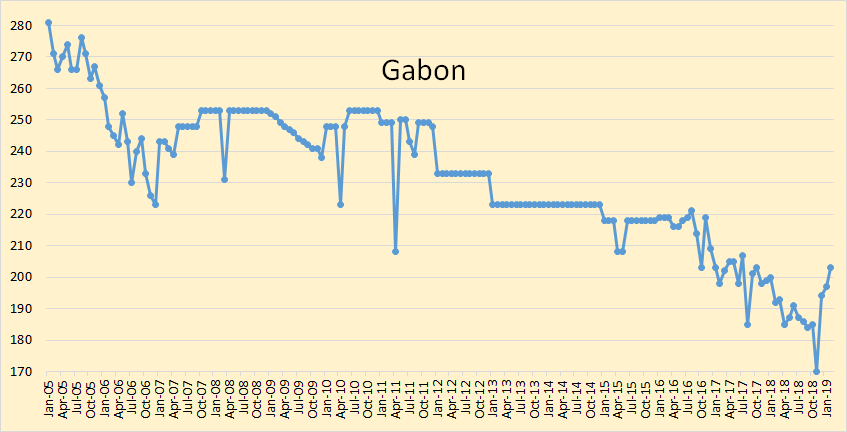
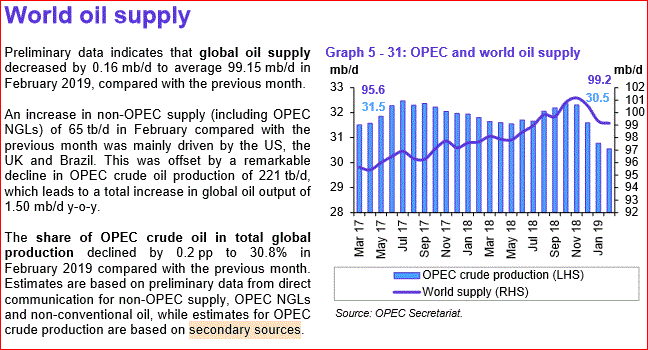
The following OPEC charts were created with data from the OPEC Monthly Oil Market Report. All OPEC charts are through February 2019 and is in thousand barrels per day.
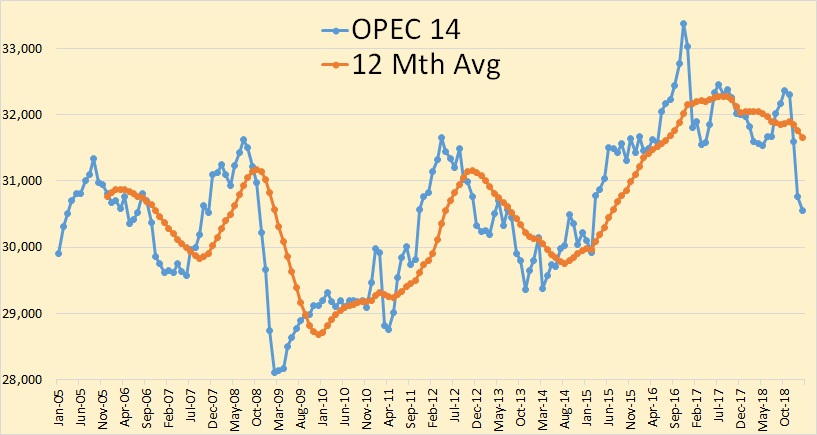
OPEC crude oil production was down 221,000 barrels per day in February. That was after December production had been revised downward by 13,000 bpd and January production revised down by 40,000 bpd.
OPEC 14 crude oil production now stands at 30,549,000 barrels per day. That is the lowest since February 2015. The peak was November 2016 at 33,347,000 bpd. So OPEC production is down 2,798,000 bpd from that point.
There is little doubt that if Libya, Iran and Venezuela had no political problems then OPEC production would exceed that 2016 peak. Iran’s problems will likely be settled in the next couple of years. They will likely recover quite quickly. Libya will take a bit longer to recover to full production if and when their problems are settled. However it will likely take Venezuela a decade or more when and if their problems are ever settled. But it is likely they will collapse even further, closer to zero production, before their situation even starts to turn around.
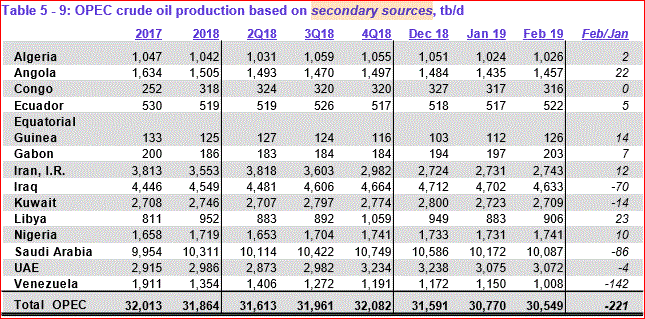
Major decliners in February were Iraq, Kuwait, Saudi Arabia and Venezuela. Everyone else was either relatively flat or up slightly.

Above are the quota numbers for the 11 OPEC members who are subject to quotas. Saudi Arabia is undershooting their quota number by quite a bit. Iraq and Nigeria seem uninterested in any compliance to their quota.
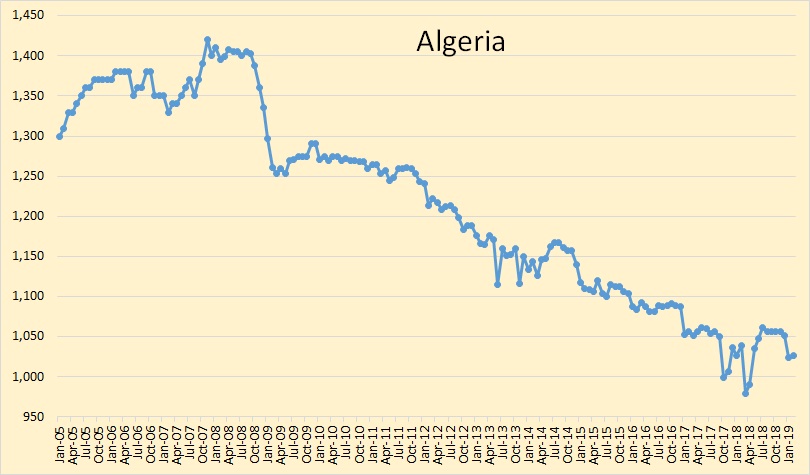
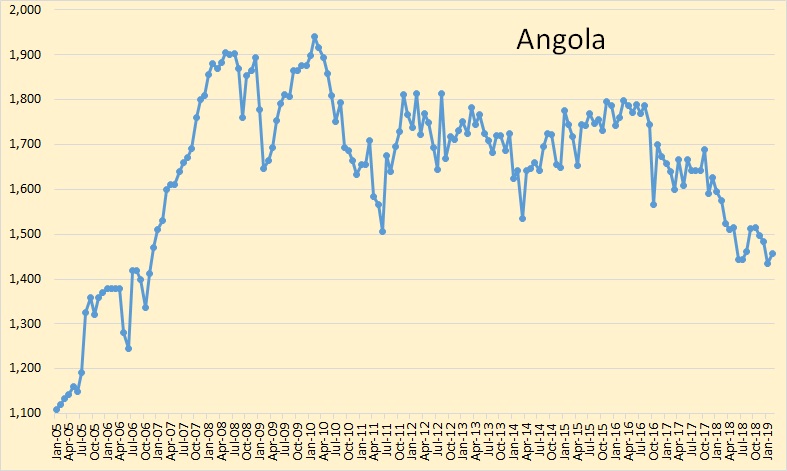
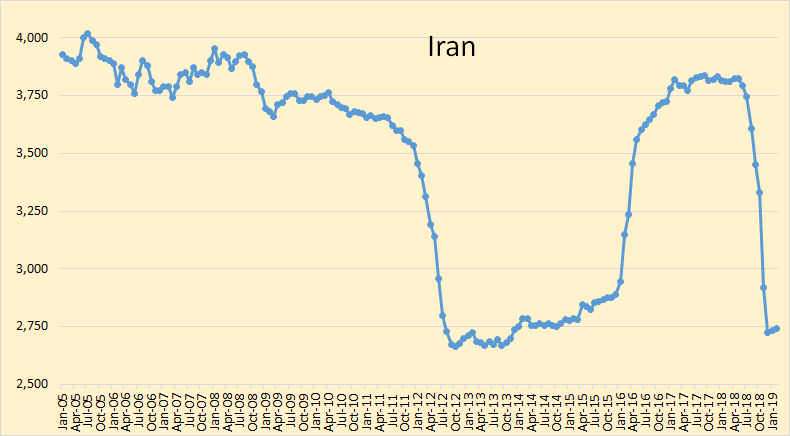
Sanctions on Iran have apparently taken their toll. Iranian production will likely continue to drift upward from here, until sanctions are lifted.
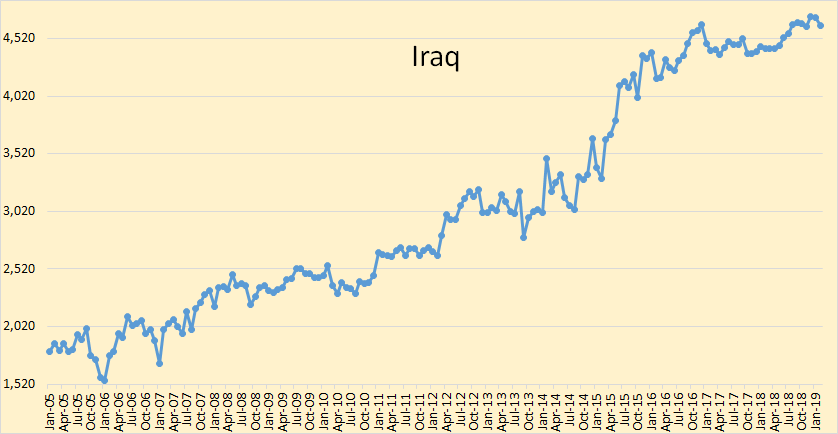
It appears that Iraq has no interest in cutting production. They appear to still be producing flat out.
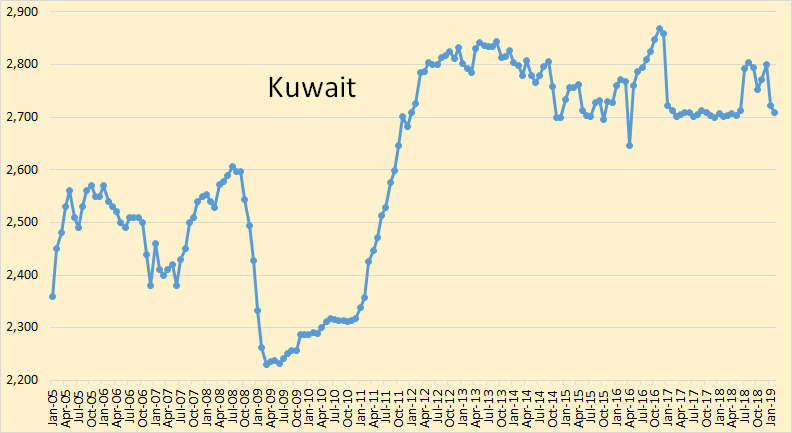
Kuwait is down about 80,000 barrels per day from their average the last six months of 2018. However they are down over 100,000 bpd from their average during their peak year of 2013.
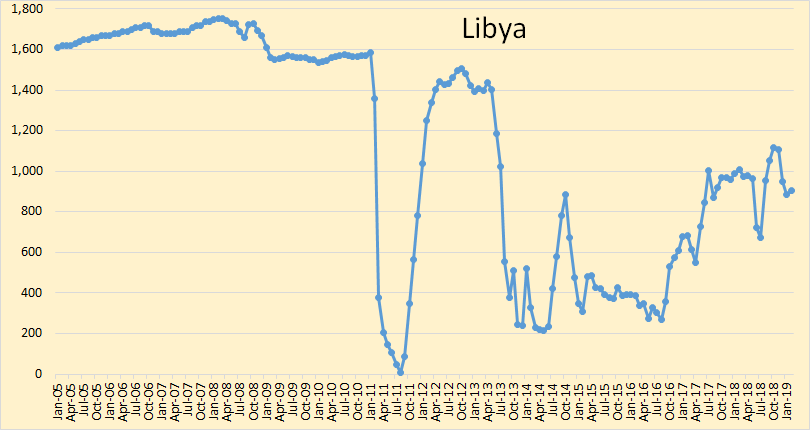
Libya, exempt from quotas, seem to be holding steady.
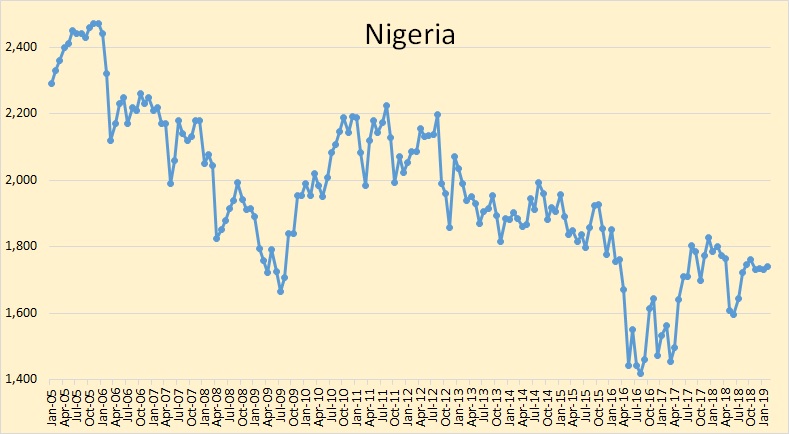
Nigeria seems to be totally uninterested cutting production.
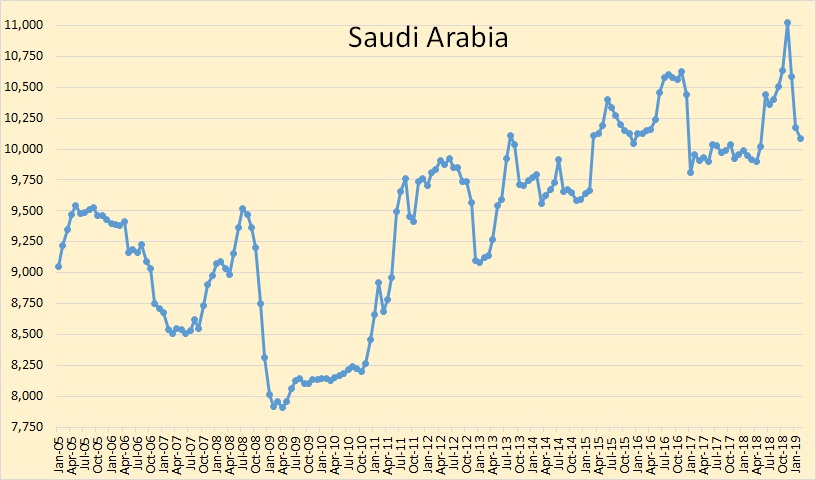
Saudi Arabia is down 934,000 bpd from their peak in December. They are 221,000 barrels per day below their quota.
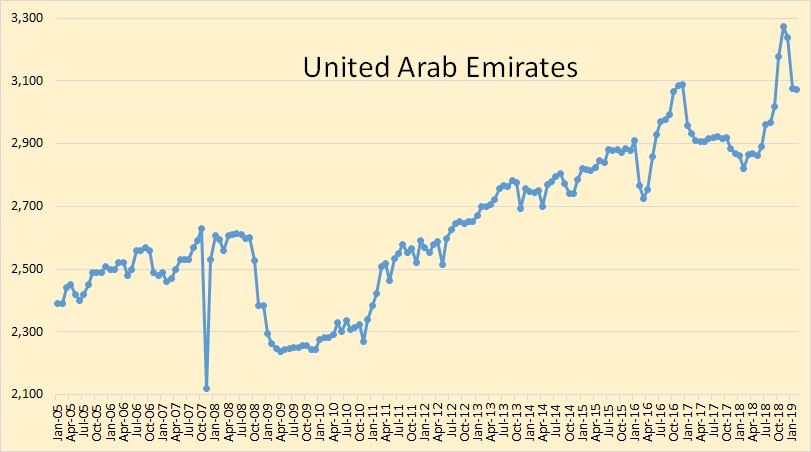
The UAE dramatically increased production during the last three months of 2018 in order to increase their quota numbers. They are now exactly at their quota.
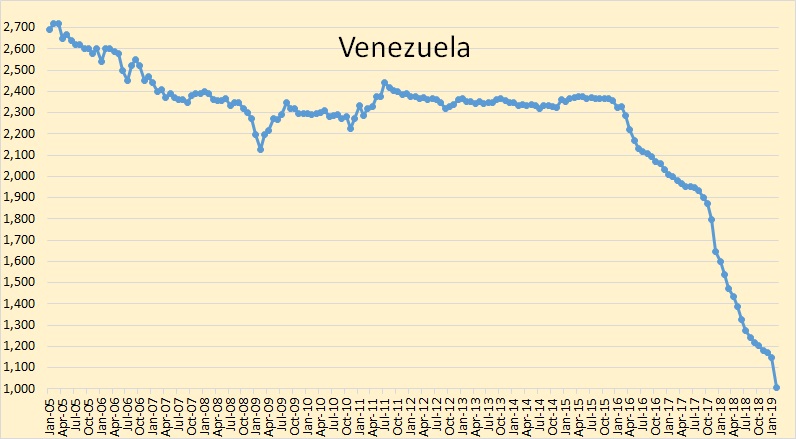
Venezuela took a huge hit in February, down 142,000 barrels per day. They will likely be down even more in March due to the blackout.
The data for the four charts below are from the EIA and is in thousand barrels per day through December 2018.
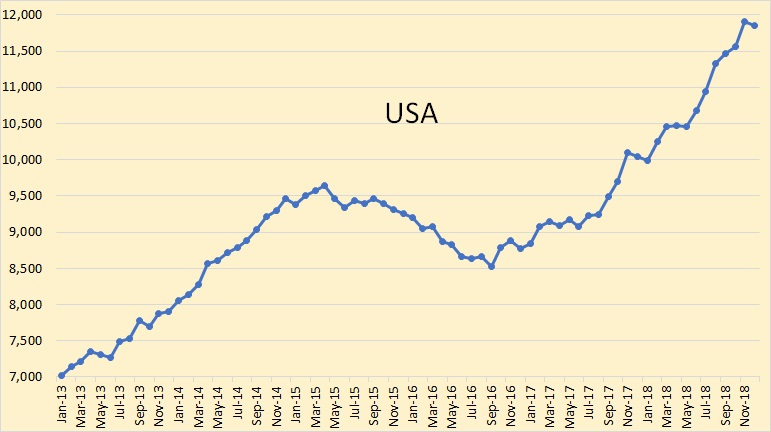
USA production was down 56,000 barrels per day in December to 11,849,000 bpd.
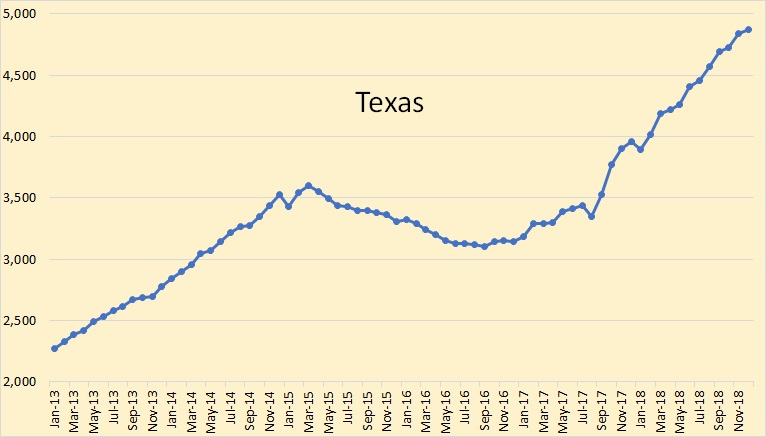
Texas oil production, the USA’s largest producer, was up 35,000 barrels per day in December, to 4,877,000 bpd.
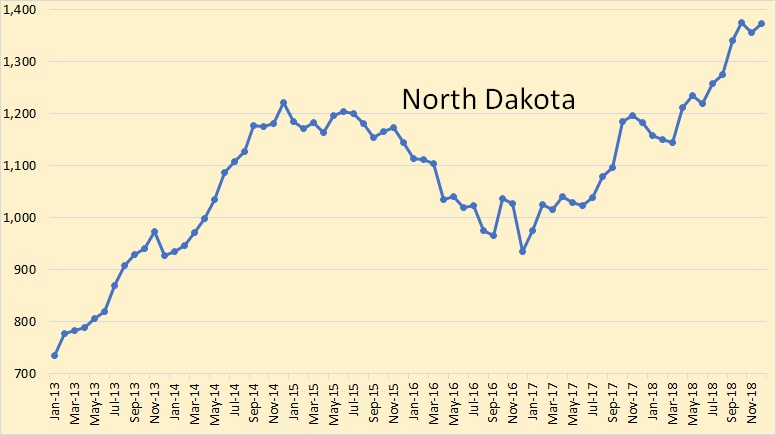
North Dakota crude oil production was down 18,000 barrels per day in December to 1,373,000 bpd.
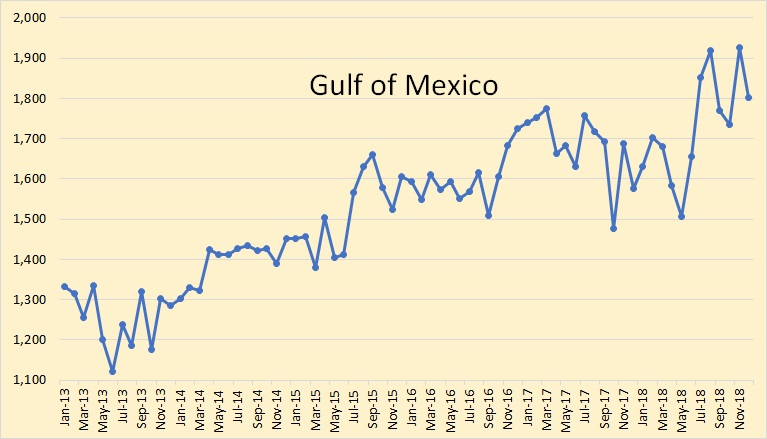
Gulf of Mexico crude oil production was down 125,000 barrels per day in December to 1,802,000 bpd.
The EIA’s latest Short-Term Energy Outlook has some very optimistic figures. The below chart gives their Non-OPEC total liquids production estimates for the next two years. That is December 2020 production estimate as compared to their December 2018 production data. The data is in million barrels per day.
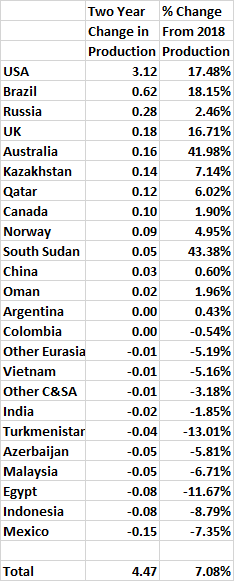
The EIA expects total liquids production to increase by 4,470,000 barrels per day over the next two years. The lions share of that will come from the USA. The rest, 1,350,000 bpd will come from the rest of Non-OPEC.
Notice that they are expecting Russian and Canadian production to taper off but expecting Brazilian production to continue booming. In a July 2017 post, George Kaplan had a different opinion. Brazil: Reserves and Production
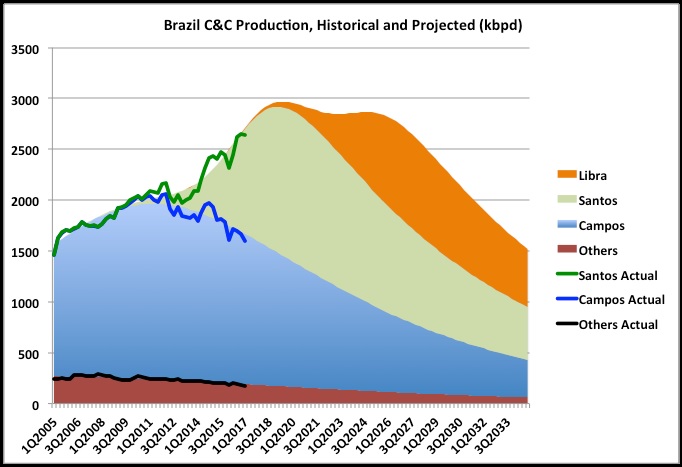
George has Brazil peaking in 2018 at just over 2,900,000 barrels per day.
Brazil Crude Oil Production (November 2018)
Crude Oil Production in Brazil decreased to 2567 BBL/D/1K in November from 2614 BBL/D/1K in October of 2018. Crude Oil Production in Brazil averaged 1661.38 BBL/D/1K from 1994 until 2018, reaching an all time high of 2730 BBL/D/1K in December of 2016 and a record low of 330 BBL/D/1K in May of 1995.
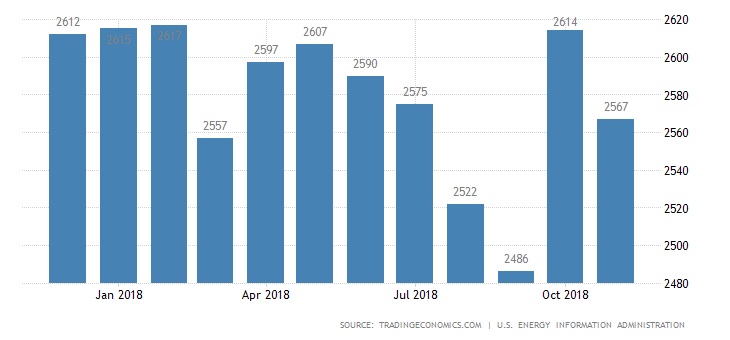
It appears that perhaps Brazil may not be the bonanza the EIA hopes it to be.
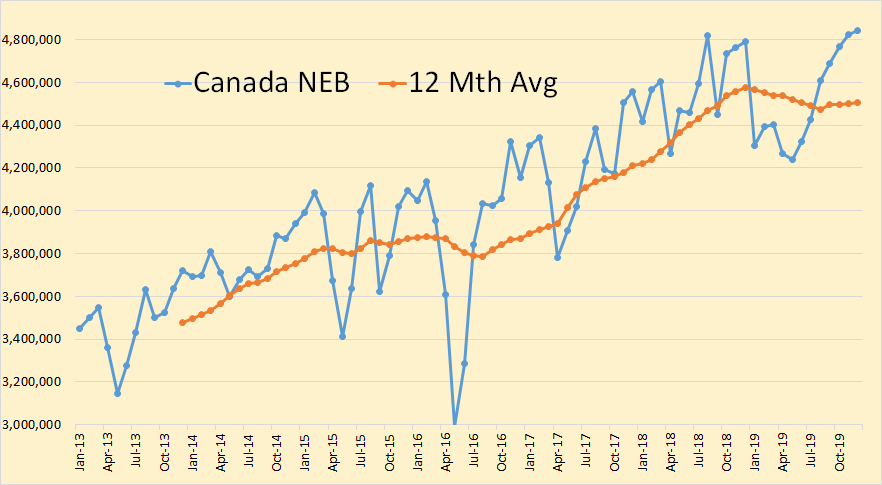
The Canadian National Energy Board is out with their latest Crude oil production data with projection through December 2019. They are expecting a huge hit in production starting in January, down by 0ver 550,000 bpd by May 2019 and not recovering until late summer.
I am now of the opinion that 2018 will be the peak in crude oil production, not 2019 as I earlier predicted. Russia is slowing down and may have peaked. Canada is slowing down and Brazil is slowing down. OPEC likely peaked in 2016. It is all up to the USA. Can shale oil save us from peak oil?
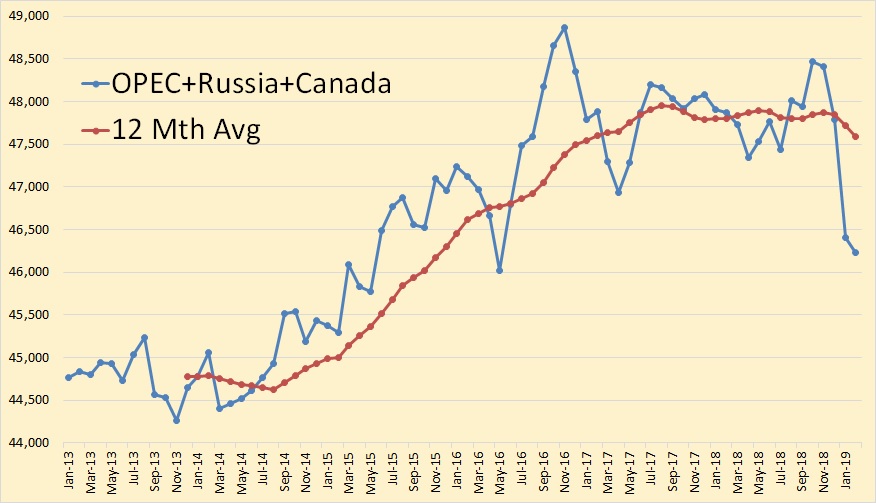
OPEC + Russia + Canada, about 57% of world oil production.
If anyone finds any typos or other errors in the above post please post them and I will make the necessary corrections.
” Iraq and Nigeria seem uninteresting in any compliance ”
uninterested obviously 🙂
Corrected it, thanks
“I am now of the opinion that 2018 will be the peak in crude oil production, not 2019 as I earlier predicted”
I’m curious as to how you see the post peak curve looking, will we have a long plateau & will we have a decline curve resembling the classic bell shape?
Anything I predict would just be a wild ass guess. However I think it will be a long, gradually declining plateau, lasting about a decade of so then a rather sharp decline.
Ron
Your track record has not been very good has it?
https://oilprice.com/Energy/Crude-Oil/Did-Peak-Oil-Arrive-in-2014.html
https://oilprice.com/Energy/Crude-Oil/2015-Could-Be-The-Year-Of-Peak-Oil.html
https://oilprice.com/Energy/Crude-Oil/Why-Peak-Oil-Is-Finally-Here.html
https://oilprice.com/Energy/Energy-General/Was-2018-The-Peak-For-Crude-Oil-Production.html
I think the calm and informed view of Fatih Birol to be very instructive. He has explained the challenges and potential of various sources of oil with a good deal of accuracy over the years.
Hey, what’s your track record? We have been on a plateau for several years now. Only US shale has kept peak oil at bay. And that last link, 2018 just may turn out to be correct.
Anyway, what’s your point. Have you made a more accurate prediction in the past?
Ron
My point is you were wrong in each of those years, so your data or interpretation of the data is flawed.
Some years ago I did some calculations based on reading many oil articles. I took the worst case scenarios and the most reasonable optimistic predictions for each country. For instance, Russian production is close to the best that was predicted. Iraq is in the middle. Mexico is doing better as the high decline rates have eased. Same with Norway and the United Kingdom.
My worst case prediction was 2016 and my best case was 2021. Adding in US shale oil predictions I think a global peak will be between 2023 to 2026.
The only way 2018 will be the peak is if we have another Venezuela somewhere.
Hugo,
Is someone pointing a gun to your head forcing you to read Ron’s Posts? If you disagree just state your reason. No reason to attack Ron for his own guess. No body ever has all of the facts and information, We try to make educated guesses to fill in the gaps.
TechGuy
The subject of peak oil has received a great deal of derision over the last 10 years. Mainly due to the spurious and unscientific claims of a number of obviously unqualified people.
The oildrum ended up being controlled by these people and anyone with less hysterical views were never allowed to publish their data.
As you said Ron views are nothing but guesses, which he makes unfailingly every single year.
I on the other hand did bother to go through exploration and discovery data for all oil producing countries.
A prediction based on a great deal of research is somewhat different to a guess.
One does credit to a cause and the other a disservice.
A prediction based on a great deal of research is somewhat different to a guess.
No, that is called an educated guess. And that is all anyone has done. That is what the EIA does, that is what the IEA does and that is what I do. I have researched OPEC production and non-OPEC production. I have researched production of Saudi Arabia in depth. I have researched Russian production. I reseaeched US production and US shale oil production caught me completely off guard, just like it did everyone else in the world.
So if you must despair my educated guesses Hugo, then please do so for the EIA. After all, they revise their predictions every month! A revision is just a way of saying: “We got it slightly wrong last month so here is our new educated guess as to future oil production.”
So do your research and give us your educated guess Hugo. Please do that or else shut the fuck up.
Ron
I have given my educated guess.
Hugo, you are being a pain in the ass. I admit, I have been, too, in my own way, in my frustration at wanting answers around the timing of peak oil. I ain’t gonna get them.
I am decidedly a non-expert in this. I have gone back and forth since about 2004 about this prediction business, and the more I learn, the more I despair of “knowing” anything.
We know Ron is guessing. He even says he is guessing. The fact that the original estimates of peak production circa 2010 failed is all the more reason to despair.
A beloved geology professor of mine, a sedimentologist, a follower of Hubbert, publisher of articles in Nature and elsewhere, told me back in 2007 that he “would be very surprised” if world oil production didn’t peak by 2013. I still respect him immensely. It just illustrates what a bitch this whole business is.
In the fable of “The Boy Who Cried Wolf,” the wolf actually arrives at the end. Never forget that.
Peak oil will arrive. We don’t know when, and we are not prepared for it.
Micheal B
It is quite right to point out errors in data and analysis in the hope that person looks again at their work. Hopefully they will see where they went wrong. Writing articles saying you believe peak oil is 2012, 2013, 2014 …….Is not analysis it’s laughable.
Here is a proper bit of analysis.
https://www.iea.org/newsroom/news/2018/november/crunching-the-numbers-are-we-heading-for-an-oil-supply-shock.html
Hickory,
Thanks. I certainly appreciate any reasoned criticism. Bottom line is we won’t know peak oil has occurred until well after the peak( maybe 10 years or so). So we will check back in 2028 or 2035 to see if Ron or I are close. 😉
If anyone wants 87% accuracy on the peak- here it is-
In the coming decade.*
* 13% chance it has already happened.
I am 100% sure that is a projection, and not intended to be used as ‘bankable’ event. Subject to change. Quotes are for sale. Sources confidential.
And also note that predictions coming from such people as Dennis and Ron are likely much more accurate, since they are much better educated on these matters than I. Hope that helps put things in perspective Hugo.
Of course, if you want to pay for a prediction, there are services that will gladly send you a monthly bill.
Hickory
Ron and Dennis disagree substantially on the Peak date.
Dennis predictions are quite sound, the same cannot be said for Ron.
Ron said in 2012 that he thought Saudi Arabia had peaked. Based on what?
http://theoildrum.com/node/9321
Saudi Arabia were producing 9.8 million barrels per day at the time. Since then they have produced nearly 11. He simply does not have the correct data.
Hugo, you had to go to a lot of trouble and research to dig up every post I ever wrote. I am beginning to suspect your motives. Did you post under another name on the OIl Drum?
At any rate, you have made your point, now move on.
True enough Hugo- “Ron and Dennis disagree substantially on the Peak date.”
And to me they are both correct. More so than I.
Hugo,
Ron expects URR will be considerably lower than what I expect, his estimate might be 2800 Gb (including tight oil and extra heavy oil) or perhaps less. If my estimate for World URR is roughly correct (3100 Gb), then 2025 is my best guess for the Peak in World oil, this could easily vary from 2023 to 2027 it will depend on the rate of resource development and the price of oil along with political and economic factors that are quite unpredictable.
If URR is closer to the 2800 Gb URR estimate of Jean Laherrere (who knows far more than me about the oil industry), my best guess for the peak would be 2022, this is not that far from Ron’s guess of 2018, note that both of our guesses may be wrong (for an assumed 2800 Gb URR for C+C) and perhaps 2018-2022 with a best guess of 2020 would be better.
Note also that I may not remember what Ron’s estimate for World URR is (or he may not have an estimate), I assume he would defer to Jean Laherrrere’s judgement, but he may think Mr. Laherrere s too optimistic.
Hickory,
Interesting, we cannot both be correct, but we can both be wrong and that may be the more likely scenario.
Oil peak predictions
Ron- 2018
Dennis- 2025
Reality, perhaps between these two.
Certainty is that peak oil will occur after 2017, if we define peak oil as the centered 12 month output of World C+C as reported by the US EIA. 2025+/-5 is probably a reasonable guess in my view.
Fair enough, but I still think you both are in the right range.
That makes my prediction highly accurate.
Seriously, I really appreciate the effort you both make to think out loud about this issue.
Hi Ron,
Oil prices have been relatively low for most of the 2015-2018 period (compared to 2011-2014). There may be more investment if oil prices rise which might keep World output rising. It is possible that 2019 average output might be lower than 2018, if so oil prices will rise and the 2018 output level will likely be surpassed in 2020 or 2021, a plateau at close to the 2018 level is also possible, but my guess is that rising oil prices will result and rising oil supply will follow up to 2025 or so.
Yeah, we will see who’s wild ass guess is closest to what actually happens. 😉
Hi Ron,
Yes it will be interesting, heck we could do a combined WAG of 2018-2025, with a peak somewhere in the middle (2021.5), but of course we both think our guesses are correct.
I think the 4 Mb/d of increased tight oil output from Dec 2019 to Dec 2025 may be enough to keep World C+C output increasing through 2025, this assumes oil prices follow the AEO 2018 reference case ($113/b in 2017$ for Brent crude in 2050) and that the USGS mean TRR estimates are roughly correct, economically recoverable resources are about 86 Gb for US tight oil through Dec 2050 in that scenario.
Dennis Wrote:
“I think the 4 Mb/d of increased tight oil output from Dec 2019 to Dec 2025 may be enough to keep World C+C output increasing through 2025, this assumes oil prices follow the AEO 2018 reference case ”
I am sure there is sufficient Oil in the ground to delay Peak production to about 2040, if the consumer demand can afford $300 bbl. Shale drilling is a lot like the housing bubble that began in 2003 and when bust in 2008. It made no sense to lend people with no job, no income and no assets, money to buy a home, but Lenders did it anyway and they did it for 5 years straight. While Shale Drillers aren’t Ninja home buyers they continue to fund operations using debt.
Shale growth is a function of credit available to shale drillers. As long as they can find a sucker^H^H^H^H lender to finance their growth, it will continue.
My wild-ass guess is that credit growth for shale drillers ends in 2021, because a lot of old shale debt comes due between 2020 and 2022. My guess is that the shale drillers will have trouble rolling over the existing debt will also finding lenders to provide them more credit. In the past I presumed that interest rates would rise to the point it cut them off from adding new debt. but the ECB & the Fed continue to keep rates low. Perhaps the Shale drillers will get direct gov’t funding to continue, pseudo nationalization as Watcher has proposed over many years on POB.
I don’t see much traction in significantly higher oil prices. with 78% of US consumers living paycheck to paycheck, already, I don’t believe they can absorb any substantial increase in energy costs.
Its also very likely demographics will start impacting energy consumption in the west as Boomers start retiring. A lot of boomers have postponed retirement, but I suspect that this will start to change in the early 2020s as age related issues make it more difficult for them to keep on working. Usually retired workers, consume considerably less energy as they no longer commute to work, and usually downsize their lifestyles.
When will peak oil happen?
Apparently you did not bother to read my post. The last paragraph stated:
I am now of the opinion that 2018 will be the peak in crude oil production, not 2019 as I earlier predicted. Russia is slowing down and may have peaked. Canada is slowing down and Brazil is slowing down. OPEC likely peaked in 2016. It is all up to the USA. Can shale oil save us from peak oil?
Of course that is just my opinion. Dennis has a different opinion. In fact there are many opinions out there. A few believe peak oil will not happen until two or three decades from now, if ever.
I am quite original in my opinion about Peak Oil. I think it took place in late 2015. I will explain. If we define Peak Oil as the maximum in production over a certain period of time we will not know it has taken place for a long time, until we lose the hope of going above. That is not practical, as it might take years. I prefer to define Peak Oil as the point in time when vigorous growth in oil production ended and we entered an undulating plateau when periods of slow growth and slow decline will alternate, affected by oil price and variable demand by economy until we reach terminal decline in production permanently abandoning the plateau towards lower oil production.
The 12-year rate of growth in C+C production took a big hit in late 2015 and has not recovered. The increase in 2 Mb since is just an anemic 2.5% over 3 years or 0.8% per year, and it keeps going down. This is plateau behavior since there was no economic crisis to blame. It will become negative when the economy sours.
Peak Oil has already arrived. We are not recognizing it because production still increases a little bit, but we are in Peak Oil mode. Oil production will decrease a lot more easily that it will increase over the next decade. The economy is going to be a real bitch.
Carlos Diaz,
Interesting thesis, keep in mind that the price of oil was relatively low from 2015 to 2018 because for much of the period there was an excess of oil stocks built up over the 2013 to 2015 period when output growth outpaced demand growth due to very high oil prices. Supply has been adequate to keep oil prices relatively low through March 2019 and US sanctions on Iran, political instability in Libya and Venezuela, and action by OPEC and several non-OPEC nations to restrict supply have resulted in slower growth in oil output.
Eventually World Petroleum stocks will fall to a level that will drive oil prices higher, there is very poor visibility for World Petroleum Stocks, so there may be a 6 to 12 month lag between petroleum stocks falling to critically low levels and market realization of that fact, by Sept to Dec 2019 this may be apparent and oil prices may spike (perhaps to $90/b by May 2020).
At that point we may start to see some higher investment levels with higher output coming 12 to 60 months later (some projects such as deep water and Arctic projects take a lot of time to become operational, there may be some OPEC projects that might be developed as well, there are also Canadian Oil sands projects that might be developed in a high oil price environment.
I define the peak as the highest 12 month centered average World C+C output, but it can be define many different ways.
So Dennis,
Our capability to store oil is very limited considering the volume being moved at any time from production to consumption. I understand that it is the marginal price of the last barrel of oil that sets the price for oil, but given the relatively inexpensive oil between 2015 and now, and the fact that we have not been in an economical crisis, what is according to you the cause that world oil production has grown so anemically these past three years?
Do you think that if oil had been at 20$/b as it used to be for decades the growth in consumption/production would have been significantly higher?
I’ll give you a hint, with real negative interest rates and comparatively inexpensive oil most OECD economies are unable to grow robustly.
To me Peak Oil is an economical question, not a geological one. The geology just sets the cost of production (not the price) too high, making the operation uneconomical. It is the economy that becomes unable to pump more oil. That’s why the beginning of Peak Oil can be placed at late 2015.
The economic system has three legs, cheap energy, demographic growth, and debt growth. All three are failing simultaneously so we are facing the perfect storm. Social unrest is the most likely consequence almost everywhere.
Carlos,
If prices are low that means there is plenty of oil supply relative to demand. It also means that some oil cannot be produced profitably, so oil companies invest less and oil output grows more slowly.
So you seem to have the story backwards. Low oil prices means low growth in supply.
So if oil prices were $20/b, oil supply would grow more slowly, we have had an oversupply of oil that ls what led to low oil prices. When oil prices increase, supply growth will ne higher. Evause profits will be higher and there will be more investment.
No Dennis,
It is you who has it backwards, as you only see the issue from an oil price point of view, and oil price responds to supply and demand, and higher prices are an estimulus to higher production.
But there is a more important point of view, because oil is one of the main inputs of the economy. If the price of oil is sufficiently low it stimulates the economy. New businesses are created, more people go farther on vacation, and so on, increasing oil demand and oil production. If the price is sufficiently high it depresses the economy. A higher percentage of wealth is transferred from consumer countries to producing countries and consumer countries require more debt. During the 2010-2014 period high oil prices were sustained by the phenomenal push of the Chinese economy, while European and Japanese economies suffered enormously and their oil consumption depressed and hasn’t fully recovered since.
In the long term it is the economy that pumps the oil, and that is what you cannot understand.
Oil limits → Oil cost → Oil Price ↔ Economy → Oil demand → Oil production
The economy decides when and how Peak Oil takes place. If you knew that you wouldn’t bother with all those models.
And in my opinion the economy already decided in late 2015 when the drive to increase oil production to compensate for low oil prices couldn’t be sustained.
Carlos,
Your reasoning is close to mine. See https://www.tse-fr.eu/publications/oil-cycle-dynamics-and-future-oil-price-scenarios.
Carlos,
Both supply and demand matter. I understand economics quite well thank you. You are correct that the economy is very important, it will determine oil prices to some degree especially on the demand side of the market. If one looks at the price of oil and economic growth or GDP, there is very little correlation.
The fact is the World economy grew quite nicely from 2011 to 2014 when oil prices averaged over $100/b.
There may be some point that high oil prices are a problem, apparently $100/b in 2014 US$ is below that price. Perhaps at $150/b your argument would be correct. Why would the economy need more oil when oil prices are low? The low price is a signal that there is too much oil being produced relative to the demand for oil.
I agree the economy will be a major factor in when peak oil occurs, but as most economists understand quite well, it is both supply and demand that will determine market prices for oil.
My models are based on the predictions of the geophysicists at the USGS (estimating TRR for tight oil) and the economists at the EIA (who attempt to predict future oil prices). Both predictions are used as inputs to the model along with past completion rates and well productivity and assumptions about potential future completion rates and future well productivity, bounded by the predictions of both the USGS and the EIA along with economic assumptions about well cost, royalties and taxes, transport costs, discount rate, and lease operating expenses.
Note that my results for economically recoverable resources are in line with the USGS TRR mean estimates and are somewhat lower when the economic assumptions are applied (ERR/TRR is roughly 0.85), the EIA AEO has economically recoverable tight oil resources at about 115% of the USGS mean TRR estimate. The main EIA estimate I use is their AEO reference oil price case (which may be too low with oil prices gradually rising to $110/b (2017$) by 2050.
Assumptions for Permian Basin are royalties and taxes 33% of wellhead revenue, transport cost $5/b, LOE=$2.3/b plus $15000/month, annual discount rate is 10%/year and well cost is $10 million, annual interest rate is 7.4%/year, annual inflation rate assumed to be 2.5%/year, income tax and revenue from natural gas and NGL are ignored all dollar costs in constant 2017 US$.
You do incredible work Dennis and I believe you are correct. Demand for oil is relatively inelastic which accounts for huge price swings when inventories get uncomfortably high or low. If supply doesn’t keep up with our needs, price will rise to levels that will eventually create more supply and create switching into other energy sources which will reduce demand.
You don’t seem to be aware of historical oil prices. For inflation adjusted oil prices since 1946 oil (WTI) spent:
27 years below $30
13 years at ~ $70
18 years at ~ $40
10 years at ~ $90
5 years at ~ $50
https://www.macrotrends.net/1369/crude-oil-price-history-chart
And the fastest growth in oil production took place precisely at the periods when oil was cheapest.
You simply cannot be more wrong about that.
And your models are based on a very big assumption, that the geology of the reserves is determinant for Peak Oil. It is not. There is plenty of oil in the world, but the extraction of most of it is unaffordable. The economy will decide (has decided) when Oil Peak takes place and what happens afterwards. Predictions/projections aren’t worth a cent as usual. You could save yourself the trouble.
Carlos,
I use both geophysics and economics, it is not one or the other it is both of these that will determine peak oil.
Of course oil prices have increased, the cheapest oil gets produced first and oil gradually gets more expensive as the marginal barrel produced to meet demand at the margin is more costly to produce.
Real Oil Prices do not correlate well with real economic growth and on a microeconomic level the price of oil will affect profits and willingness of oil companies to invest which in turn will affect future output. Demand will be a function of both economic output and efficiency improvements in the use of oil.
Thanks Mario.
Carlos,
Also keep in mind that during the 1945-1975 period economic growth rates were very high as population growth rates were very high and the World economy was expanding rapidly as population grew and the World rebuilt in the aftermath of World War 2. Oil was indeed plentiful and cheap over this period and output grew rapidly to meet expanding World demand for oil. The cheapness of the oil led to relatively inefficient use of the resource, as constraints in output became evident and more expensive offshore, Arctic oil were extracted oil prices increased and there was high volatility due to Wars in the Middle east and other political developments. Oil output (C+C) since 1982 has grown fairly steadily at about an 800 kb/d annual average each year, oil prices move up and down in response to anticipated oil stock movements and are volatile because these estimates are often incorrect (the World petroleum stock numbers are far from transparent.)
On average since the Iran/Iraq crash in output (1982-2017) World output has grown by about 1.2% per year and 800 kb/d per year on average, prices have risen or fallen when there was inadequate or excess stocks of petroleum, this pattern (prices adjusting to stock levels) is likely to continue.
There has been little change when we compare 1982 to 1999 to 1999-2017 (divide overall period of interest in half) for either percentage increase of absolute increase in output.
I would agree that severe shortages of oil supply relative to demand (likely apparent by 2030) is likely to lead to an economic crisis as oil prices rise to levels that the World economy cannot adjust to (my guess is that this level will be $165/b in 2018$). Potentially high oil prices might lead to faster adoption of alternative modes of transport that might avert a crisis, but that is too optimistic a scenario even for me. 🙂
Dennis,
I use both geophysics and economics, it is not one or the other it is both of these that will determine peak oil.
Well, the geophysics of the planet is beyond our control. As for economics, it is mostly an artificial construct. But I’m really curious, does anyone on the petroleum side of this blog have any understanding of the ecological implications of the continued use of fossil fuels to to planetary ecosystems?
Without functioning ecosystems there is no economics! We have pretty much already broken every ecosystem on the planet. So arguing about whether peak oil happened in 2013 or will happen in 2025 is a bit like arguing about how many angels can dance on the head of a pin! It really doesn’t matter!
Fred,
If we can get people to realize that peak fossil fuels will be upon us shortly (in about 11 years by my estimates), perhaps we can get them to consider moving beyond fossil fuels to EVs, wind, solar PV, HVDC transmission, more efficient appliances, more well insulated and sealed buildings. more heat pumps (ground source in colder climates), cities that are designed for less car use, more pubic transport, electrified rail.
By itself these will not be adequate to solve all environmental problems, but it is a start and a realization that we cannot make this transition overnight and should begin today might start with the realization that peak oil is near.
Such an argument does not rely on the reality of climate change, which unfortunately many refuse to take seriously.
Dennis,
Such an argument does not rely on the reality of climate change, which unfortunately many refuse to take seriously.
Ok, forget climate change and the environment. Quite frankly I don’t see people taking peak oil seriously either!
Everywhere I look it’s still a drill baby drill kind of world (by that I just mean a status quo mentality, not necessarily that actual drilling is really increasing all that much).
The US is now energy independent! Hooray! Let’s build more roads, airports and car factories. The POTUS wants GM to reopen a closed production plant in Ohio, etc, etc…
The economic system is already broken so let’s just keep piling it on, maybe a couple more trillion in debt across the board will finally fix the problem. Keep printing that fake money and lending it out!
Fred,
Fair enough, most people don’t take peak fossil fuels seriously either and won’t believe it until they see it (maybe by 2040 when we are about 10 years beyond the peak based on my best guess). The idea is to get people to at least consider the possibility and begin to make changes, install PV, insulate their house, seal air leaks, install heat pumps, buy an EV or hybrid, recycle, use less stuff, buy quality goods made to last a lifetime, share their car, lawnmower, or snowblower with neighbors in a sharing economy, buy organic produce, grow food in their back yard (or front yard or both). This list is probably very incomplete…
We need change, it starts with individuals.
China will be in outright deflation soon enough. Economic stimulus is starting to fail in China. They can’t fill the so called bathtub up fast enough to keep pace with the water draining out the bottom. So to speak.
Interest rates in China will soon be exactly where they are in Europe and Japan. Maybe lower.
In order to get oil to $90-$100 the value of the dollar is going to have to sink a little bit. In order to get oil to $140-$160 the dollar has to make a new all time low. Anybody predicting prices shooting up to $200 needs the dollar index to sink to 60 or below.
The reality is oil is going to $20. Because the rest of the world outside the US is failing. Dennis makes some nice graphs and charts and under his assumptions his charts and graphs are correct. But his assumptions aren’t correct.
We got $20 oil and an economic depression coming.
Peak Oil is going to be deflationary as hell. Higher prices aren’t in the cards even when a shortage actually shows up. We will get less supply at a lower price. Demand destruction is actually going to happen when economies and debt bubbles implode so we actually can’t be totally sure we are ever going to see an actual shortage.
We could very well be producing 20-30% less oil than we do now and still not have a shortage.
Oh and EV’s are going to have to compete with $20 oil not $150 oil.
You are assuming that the oil is priced in dollars there are moves underway that raise two fingers to that.
https://www.scmp.com/economy/china-economy/article/2174453/china-and-russia-look-ditch-dollar-new-payments-system-move
HHH,
When do you expect the oil price to reach $20/b? We will have to see when this occurs.
It may come true when EVs and AVs have decimated demand for oil in 2050, but not before. EIA’s oil price reference scenario from AEO 2019 below. That is a far more realistic prediction (though likely too low especially when peak oil arrives in 2025), oil prices from $100 to $160/b in 2018 US$ are more likely from 2023 to 2035 (for three year centered average Brent oil price).
HHH,
My assumptions are based on USGS mean resource estimates and EIA oil price estimates, as well as BIS estimates for the World monetary and financial system.
Your assumption that oil prices are determined by exchange rates only is not borne out by historical evidence. Exchange rates are a minor, not a major determinant of oil prices.
Dennis,
Technically speaking. The most relevant trendline on price chart currently comes off the lows of 2016/02/08. It intersects with 2017/06/19. You draw the trendline on out to where price is currently. Currently price is trying to backtest that trendline.
On a weekly price chart i’d say it touches the underside of that trendline sometime in April in the low 60’s somewhere between $62-$66 kinda depends on when it arrives there time wise. The later it takes to arrive there the higher price will be. I’ve been trading well over 20 years, can’t tell you how many times i’ve seen price backtest a trendline after it’s been broken. It’s a very common occurrence. And i wouldn’t short oil until after it does.
But back to your question. $20 oil what kind of timetable. My best guess is 2021-2022. Might happen 2020 or 2023. And FED can always step in and weaken the dollar. Fundamentally the only way oil doesn’t sink to $20 is the FED finds a way to weaken the dollar.
But understand the FED is the only major CB that currently doesn’t have the need to open up monetary policy. It’s really the rest of the worlds CB ultra loose monetary policy which is going to drive oil to $20.
HHH,
The Fed might choose to increase money supply if dollar becomes too strong. Also the claims that the US will become a net exporter of crude plus condensate is nonsense, if we ignore NGLs which are not useful for transportation needs, US C+C output will be no more than 15 Mb/d by 2025, as World oil price levels rise this will increase US trade deficits which tends to weaken the dollar. The Fed will adjust policy to keep the dollar index in its historic range as long as annual core US inflation rates remain below 3%.
Oil will not go to an average of $20/b for any 12 month period before 2030, and that will only be if poor monetary and fiscal policy is followed by most nations (similar to the European reaction to the GFC) when the next GFC hits around 2030. Otherwise, it will not occur until after 2045.
Dennis,
I wouldn’t count on the FED’s ability to weaken the dollar. They can certainly try. But look they can’t weaken it by just printing money alone or printing money an lowering interest rates. They already dropped the interest rate to near zero and printed $4 trillion or so.
During that time the dollar index has strengthened 2350 handles from lets just call it 72 all the way to 95.5 where it sits now.
Only way FED has to deal with dollar strength. Is if the dollar gets so strong. The world’s CB are forced to come together and scrap the current global monetary system.
That is exactly what i’m telling is going to happen and exactly why oil will be visiting $20.
Do you expect the ECB, BOJ, BOE, and the PBOC to stop printing money and raise interest rates so the dollar won’t rise any further? If so i got ocean front property in Arizona to sell you 🙂
Make no mistake there will be a lot of financial casualties. And some actual casualties as oil producing countries blow up financially.
Japan, Europe, China. and England since they have their own central bank and do share a common currency with other European nation are all trying to export their internal deflation via the printing press. SNB for the swiss should also be thrown in there as well.
Oil doesn’t operate in a vacuum. Neither stock market or bonds. FX markets move all of the above. That is why it’s hard to make sense of why sometimes markets go where they go. You got to understand the currency flows behind them to understand why they do what they do.
Price of money is everything and the price of money is changing all the time.
HHH,
Let’s run with some of your assumptions.
First let’s assume that at the current dollar index and price of oil that the Fed makes no changes in interest rates, but the rest of the World’s nations try to avoid deflation through QE and other means and drive the price of oil from $65/b to $20/b by weakening their currencies.
The current US dollar index is 92
https://fred.stlouisfed.org/series/DTWEXM/
So oil price falls to 20 or 20/65=31% of its current level, this implies the dollar index goes to 297=92/0.31.
Does that seem remotely plausible? Note that the highest level for the Dollar against major currencies was in Feb 1985 at 145 (1973=100). Your claims just don’t hold water.
And no I don’t expect the rest of the World’s central Banks will try to weaken the dollar, but the Fed could easily do so with monetary policy if necessary just as it did from 2011 to 2014. Very little evidence that a second GFC will occur in the near term, but peak oil and its aftermath may do it in about 11 years.
Dennis,
Dollar index only needs to make it to somewhere around 116-120 ish for oil to visit $20. not 297. The correlation isn’t 100% even on the weekly and month charts. it’s actually even less on Daily chart than it is on long term charts.
Dollar index does however define the range of price oil will trade within. That is what you need to be looking at. It’s not a tick for tick correlation.
When the dollar index is range bound so is oil and when the dollar breaks out of it’s current range oil is going to follow in the opposite direction. If the dollar were to fall out of it current range instead of breakout above that it’s been in for going onto 5 years. I’d be saying oil is going back to $80-90 in pretty short order.
Pull up the dollar index it’s been range bound since about 12/29/2014. Top of the range came on about 01/02/2017 in at about 103.78 Bottom of the range came in on 02/12/2018 at about 88.25
Oil doesn’t go to $20 without a breakout above call it 104 that reaches the 116-120 range. Oil doesn’t go back to $90-$100 without a breakdown below 88.25
Dollar index of around 81-82 should get us somewhere in the $90-$100 range for WTI.
FED also put further rate hikes back on the table today For later this year. Look there is a lot of misdirection going on here. And it’s intentional to keep people confused. POTUS comes out and says he want a weaker dollar. But the truth is a strong dollar is a weapon and a weak dollar isn’t.
There is going to be some collateral damage though. Shale oil being part of it. When the FED raises rates it creates a feedback loop where other CB’s are forced to print more than the would otherwise because their economies are blowing up due to a strong dollar.
We will refuse to sell oil at $20, wait until it gets back up to $40 before opening up a bit. But supply won’t be back to normal until it reaches about $70.
This is bizaare.
As I follow it, Dennis is saying that low oil prices means that producers cannot afford to invest and hence output slows.
Hugo is saying that the economy will decide how much oil it needs and hence 2015 was the peak as the growth slowed and peak economy was reached which is not necessarily defined by oil price but does define consumption.
It’s a bit like if I said the bar is 100m north and the grocer is 50m south. The statements are not necessarily contradictory.
Sean,
World real GDP has been fairly steady from 2015 to 2018
3.5, 3.3, 3.7, 3.7%. The explanation for low oil prices is quite simple, excess oil supply drove prices lower, other explanations such as exchange rates are a very minor part of the story.
In short HHH’s story is not vry convincing. YMMV.
Brinkman Asked: “When will peak oil happen?”
Godot knows the exact date. When he shows up he’ll tell post it.
I am sure Ron P. knows what I am mean 🙂
4/1/2019
@ Dennis Coyne
Just curious how high do you think the Bakken will peak at 1.5 and the eagle ford will peak at 1.4?
Then the next question is how long can they hold that?
Phatom,
Permian basin below, peak in 2028 at 7450 kb/d (Dec 2018 level about 3160 kb/d).
Phatom,
Bakken peaks in 2021 at about 1600 kb/d
Do you think the eagle ford is in decline?
Phatom,
Note these scenarios are only guesses, we do not know future well completion rates. If well completion rates are lower than I have assumed or new well EUR decreases earlier than I have assumed (I assume it begins in Jan 2019) or proceeds more rapidly than I have assumed then Eagle Ford may begin to decline.
In 2018 the output in the Eagle Ford increased from 1140 kb/d to 1274 kb/d, so lately there is no sign of decline (I ignore the EIA’s drilling productivity report, which is not a very good model in my opinion).
Eagle Ford has a secondary peak at 1300 kb/d in 2022, the peak was in 2015 and is unlikely to be surpassed.
Niobrara peaks in 2025 at about 560 kb/d, as always a guess at future well completion rates and future well profiles. For the Niobrara I assume new well EUR starts to decrease in Jan 2023.
The last scenario is for all other US tight oil plays and is highly speculative, I have very little information on well profiles, well completion rates, expected TRR, well costs, LOE.
So if my usual scenarios are WAGs, this is a SWAG (super wild ass guess), take it with plenty of salt and expect that it may be far from the mark (whether high or low I know not).
The US “other tight oil” peaks in 2022 at 820 kb/d, in Nov 2018 it was at 812 kb/d based on EIA tight oil data (not from the DPR model). I assume new well EUR starts to decrease in Jan 2022.
When we put the 5 separate scenarios (Permian, North Dakota Bakken/Three Forks, Eagle Ford, Niobrara, and US other tight oil) together we get a peak in 2025 at 10.35 Mb/d, in Dec 2018 US tight oil output was 7.06 Mb/d, so this is about 3.3 Mb/d higher output over a 7 year period or an average annual increase of 470 kb/d each year over that 7 year period. Tight oil output falls to under 7 Mb/d by September 2034. By December 2050 US tight oil output is about 1 Mb/d.
Eqinor have desided to sell all their shears in Eagle Ford looks Shale have not been the suxsess they tought it would. Shell also lately have sold some of their shale investment. Think the investors getting more sceptical . EIA sees now a very tight oil market ahead, think Saudi Arabia need to increase output as shale play without more borrowed money might be the next Venezuela. .
Freddy,
If tight oil producers reduce their rate of well completion they can operate out of cash flow. I did a Permian Basin model where I make this assumption from 2020 with completion rates gradually reduced over 2019 to a level where no new debt is needed. I assume interest on debt is at an annual rate of 7.5%/year in this scenario.
Dennis , I believe they will get a profit if they just compleate the DUC’ s. But in my world that is not a healthy Buisiness that will be susyainable as to drill that latherals was done by borrowed money and I believe in shale they need to incorporate all exspensives, rental fee of land , interest of loan. Than in a certain number of year this well with all child wells increased decline rate , frack hits need to pay the cost + dividend to shearholders and after all that is payed net profit of 15-20% to further investment in growth. But yes I agree for a limited time unthil all ducs are compleated they might deliver some profit I am very sure the banks and investors want a big shear off.
Freddy,
My analysis includes full cycle costs and uses the average well profile. The child well problem you reference may become a problem in the future, so far we can only guess at future well productivity. I have assumed this remains constant from 2018 to 2023 and then decreases. Coffeguyzz would argue this is far too pessimistic while others would argue the opposite.
Clearly we do not know the future.
Hi Ron,
Thanks as always for the valuable posts. I am curious about your opinion on something. Once oil production peaks and plateaus, then inevitably declines, do you think world GDP will start declining afterwards? I’d assume it would lag behind it by a short period of time possibly (obviously depending on country etc but overall).
If that was to happen and no energy source can cover the decline rate, wouldn’t the world be pretty fucked economically thereafter? Hence one can assume or take a wild ass guess that the decline after peak would resemble something like Venezuela. So not a smooth short % decline rate.
I hope what i am asking makes sense.
Mike, in all honesty, I have no idea. The problem is there are so many other things going on at the same time. The world is getting warmer, water tables are falling everywhere, rivers are drying up, fisheries are disappearing, and I could go on for an hour explaining how everything is falling apart. And now we hear that the insect population is declining very fast. Why?
So as fossil energy starts to decline and renewables will not help very much, what will happen. Will that exacerbate all our other problems. Yes, it most likely will. Look at Venezuela. Is that what almost every nation will look like in 50 years? Well, probably not every nation but a lot of them for sure.
So, the world is going to hell in a handbasket. But I am 80 years old. I will be safely dead when the shit hits the fan. Lucky me.
From http://fasterthanexpected.com Resource extraction responsible for half of CO2 emissins: http://www.fasterthanexpected.com/2019/03/12/resource-extraction-responsible-for-half-worlds-carbon-emissions/
Accelerating rise in greenhouse gas levels: http://arctic-news.blogspot.com/
Venezuela is an exceptional case, because it has huge hydroelectric resources (the Tacoma hydroelectric project has been under construction for almost 20 years, but it got hit by the corruption wave which impacted the nation after Chavez started nationalizing the means of production as per his socialist ideology). Venezuela also has enormous untapped gas reserves, and of course it has a lot of oil, and fresh water (the current lack of water in the cities has been caused by the regime’s corruption and ineptitude). And it has huge tracts of land with good soil and plenty of water. The problem is Socialism of the 21st Century and the huge sums of money they looted.
It’s amazing to live in the last century of progress of the most evolved/advanced species of the planet, which is 5 billion years old. IMO there won’t be enough time for other species to reach our current level in this planet’s future history, becuase the Sun will get too hot.
The Suns luminosity will increase as time goes on but we are talking around 1% every ~ 110 million years or so. I think at that rate life can evolve, who knows even cretaceous size monsters can evolve and adapt to the warming conditions (but i doubt there will be any intelligent life like our species). So yea like you said there will be a threshold one would think, that causes the end of all life due to extremely hot conditions.
It’s a race between higher temperature -> more precipitation-> more erosion -> more CO2 sequestration in carbonate rocks -> less CO2 -> lower greenhouse gas forcing -> lower temperature and the slow increase in solar radiation.
In 200 million years Earth could be warmer, more humid, with lower CO2 in the atmosphere, which implies grasses would evolve to take over from other plants and we could see 20 meter tall sugar cane plants in Scotland being harvested by 2 meter tall intelligent chimpanzees who use it to make Cuban rum, a prized beverage that would be the only surviving link they have to ancient human civilization.
I guess they could still call it “Scotch”, though.
The Earth will have thermal runaway when the next Pangea forms in about 250M. Global temperatures always soar when Pangea forms. The last Pangea killed of 95% all species. The Rising Solar output will be enough to exceed the Tipping Point.
Rising CO2 levels are not going to kill the planet. In the past Earth had much higher CO2 levels and life thrived. The only risk is flooding of coast cities, but that would happen regardless since Earth is still in recovery from the last IceAge. Sea levels rose about 6 Ft about 1 AD to 1800 AD (when the industrial revolution started, Sea Levels increase by about 120 meters since about 50K BC.
FWIW: We have a gross over population problem, If Humans stopped using Fossil fuels tomorrow, ecological damage will still increase & accelerate as humans cut down all the trees for fuel\timber and to use more land for crops, since fossil fuels provide fertilizers, pesticides, etc.
Well your generation probably had the rosiest existence on this planet.
In hindsight, you probably shouldn’t have reproduced. Your children and their children will suffer that decision.
Well, reproducing was not really a thought ought decision, it just happened. I was young and dumb and really just horney.
And in the late 60’s, if you used a small enough lens, you could make an argument that things were getting better.
By the early 70’s that delusion was gone.
In Ron’s defense, He had Children more than 40 years ago, before there was sufficient understanding of overpopulation.
FWIW: I have no kids. I am the youngest in my family and my entire family line will die out when I am gone. All my relatives are in there mid 60’s or older.
I have four children, and three “adopted” ones I helped when they hit hard times. Quite a few grandchildren, the oldest of which is 27. But as you know we tend to reproduce more and vote Republican. So I encourage you to stay childless and we righteous Cuban Americans will keep on fighting for freedom and the American way of life, which we think is much better now than in 1970.
Fernando wrote:
“which is 27. But as you know we tend to reproduce more and vote Republican. So I encourage you to stay childless and we righteous Cuban Americans will keep on fighting for freedom and the American way of life”
Fernando, you have me confused. I am conservative leaning, but also a realist. Too many people and too many nuts for this to end well. Freedom, Justice has been replace mob rule. Recall that it took a global war to restore some sanity after the rise of Socialism in Europe. This time will be difference with the world surrounded with nuclear and biological weapons. No one wins the next fight.
You asked Ron, but I’ll chime in uninvited. I think your scenario of the world declining in GDP after peak is very likely, but a big point is that it will be patchy.
Some places will do better than others.
Some will obviously have more fossil fuel and food for much longer than others.
Some will handle a big scale down better than others.
Ex- Japan is almost completely dependent on energy from imported fossil fuel. They import huge quantities of food, including massive worldwide ocean harvests. They are heavily industrialized, with earning coming from exported goods. They are massively overextended on any measure of sustainability. (If anything, its gotten worse since the 1930’s). They are getting old. Can they scale down the population fast enough? Can they keep GDP/person from plummeting?
Surely there could long and interesting discussions on scenarios and how they will vary from place to place.
That could be a whole other thread.
Japan and UK both face many similar predicaments. I think UK will go over the falls first. Nothing personal.
I agree—-
But I have spent much more time in Japan.
Iron Mike Asked:
“If that was to happen and no energy source can cover the decline rate, wouldn’t the world be pretty fucked economically thereafter? Hence one can assume or take a wild ass guess that the decline after peak would resemble something like Venezuela. So not a smooth short % decline rate.”
Energy is the economy, The economy cannot function without energy. Thus its logical that a decline in energy supply will reduce the economy. The only way for this not to apply is if there are efficiency gains that offset the decline. But at this point the majority of cost effective efficiency gains are already in place. At this point gains become increasing expensive with much smaller gains (law of diminishing returns). Major infrastructure changes like modernizing rail lines take many decades to implement and also require lots of capital. Real capital needed will be difficult to obtain do to population demographics (ie boomers dependent on massive unfunded entitlement & pensions).
Realistically the global economy is already in a tight spot. It started back in 2000 when Oil prices started climbing from about $10/bbl in 1998 to about $30/bbl in 2000. Then the World Major Central banks dropped interest which ended triggering the Housing Boom\Bust and carried Oil prices to $147/bbl. Since then Interest rates have remained extremely low while World Debt has soared (expected to top $250T in 2019).
My guess is that global economy will wipe saw in the future as demographics, resource depletion (including Oil) and Debt all merge into another crisis. Gov’t will act with more cheap and easy credit (since there is no alterative TINA) as well as QE\Asset buying to avoid a global depression. This creating a wipesaw effect that has already been happening since 2000 with Boom Bust cycles. This current cycle has lasted longer because the Major central banks kept interest rates low, When The Fed started QT and raising rate it ended up triggering a major stock market correction In Dec 2018. I believe at this point the Fed will no longer seek any further credit tightening that will trip the economy back into recession. However its likely they the global economy will fall into another recession as consumers & business even without further credit tighting by CB (Central Banks) Because they’ve been loading up on cheap debt, which will eventually run into issues servicing their debt. For instance there are about 7M auto loans in delinquency in March of 2019. Stock valuations are largely driven by stock buybacks, which is funded by debt. I presume companies are close to debt limit which is likely going to prevent them from purchase more stock back.
Probably the biggest concern for me is the risking risks for another World war: The US has been targeting all of the major Oil exporters. The two remaining independent targets are Venezuela & Iran. I suspect Venzuela will be the next US take over since it will be a push over compared to Iran. I think once all of remaining independent Oil Exports are seized that is when the major powers start fighting each other. However is possible that some of the proxy nations (Pakastan\India),(Israel\Iran), etc trigger direct war between the US, China, and Russia at any time.
Notice that the US is now withdrawing from all its major arms treaties, and the US\China\Russia are now locked into a Arms race. Nuclear powers are now rebuilding their nuclear capacity (more Nukes) and modernizing their deployment systems (Hypersonic, Very large MIRV ICBMS, Undersea drones, Subs, Bombers, etc.
My guess is that nations like the US & China will duke it out before collapsing into the next Venzuela. If my assessment is correct, The current state of Venezuela will look like the garden of eden compared to the aftermath of a full scale nuclear war.
Currently the Doomsday clock (2019) is tied with 1953 at 2 minutes:
https://thebulletin.org/doomsday-clock/past-announcements/
1953 was the height of the cold war. I presume soon the Doomsday clock will be reduced to less than 2 Minutes later this year, due to recent events in the past few weeks.
https://thebulletin.org/doomsday-clock/current-time/
“the world’s nuclear nations proceeded with programs of “nuclear modernization” that are all but indistinguishable from a worldwide arms race, and the military doctrines of Russia and the United States have increasingly eroded the long-held taboo against the use of nuclear weapons.”
” The current international security situation—what we call the “new abnormal”—has extended over two years now. It’s a state as worrisome as the most dangerous times of the Cold War, a state that features an unpredictable and shifting landscape of simmering disputes that multiply the chances for major military conflict to erupt.”
good post.
While China, the US, and Russia are re-arming, I expect future warfare will mostly be conducted digitally. Disrupting a country through hacking and cyber warfare is so much cheaper than invading.
If you can destroy a country’s financial, communication, transportation, and energy systems by messing up their networks, and if you can cause internal disruption via fake news, propaganda, and manipulation, you don’t have to wage war in a traditional sense. If you can trigger a collapse, you are on your way to control and dominance.
“I expect future warfare will mostly be conducted digitally. Disrupting a country through hacking and cyber warfare is so much cheaper than invading.”
Is that why China is building those Military bases in the South Pacific, or the developing all those new stealth fighters & bombers. Or the new aircraft carriers and Missile Subs?
Russia, China, and the US are all adding traditional weapons. I think those are more about displays of power, rather than planning WWIII.
In the meantime, China, Russia, and Iran are already conducting cyber warfare against us, and doing it pretty effectively.
Here’s a good article about future wars written by a Marine general.
“Twenty-first century war will not be a war of mass. It will be won by whoever best takes advantage of information and connectivity.”
“Tomorrow’s foes may defeat or destroy us before the first kinetic round is fired, because cyber attacks will render our systems inoperable or unreliable.”
“Artificial intelligence will have the greatest impact because it will transform the cognitive realm. Men and women enhanced by machines will be able to alter and shape perception, compress time, and accelerate decision-making. This condition, in turn, makes perception and time the decisive domains of future war.”
https://warontherocks.com/2019/03/future-war-not-back-to-the-future/
”I am now of the opinion that 2018 will be the peak in crude oil production, not 2019 as I earlier predicted. Russia is slowing down and may have peaked. Canada is slowing down and Brazil is slowing down. OPEC likely peaked in 2016. It is all up to the USA. Can shale oil save us from peak oil?”
IEA´s Oil 2019 5y forecast has global conventional oil on a plateau, i.e. declines and growth match each other perfectly and net growth will come from LTO, NGL, biofuels and a small amount of other unconventional and “process gains”.
Iran is ofc a jocker, since it can quickly add supply. Will be interesting to see how trump will proceed.
Any chance of getting a “World minus-USA” graph, or is it too soon since the last time you posted it?
Thanks.
The one I posted last month was the last one available. I will post another when the EIA updates the site toward the end of the month.
Table 11.1b World Crude Oil Production: Persian Gulf Nations, Non-OPEC, and World
Venezuela production is not only being hit by the blackout – which seems to have damaged their overall grid capacity – but by new sanctions. Their diluent supplier has just stated they will stop business.
https://www.reuters.com/article/us-india-reliance/reliance-halts-diluents-export-to-venezuela-not-raised-oil-buying-idUSKBN1QU240
Perhaps useful to note that Maduro was just as incompetent 6 months ago as presumably he is now. He was just as incompetent 9 months ago as presumably he is now. And indeed, he was just as incompetent three months ago as he is now. In fact we could take it back years.
Thus, it surely is just a coincidence that their blackout occurred at a point in time when a foreign coup attempt was underway, rather than 9 or 6 or 3 months ago. Sabotage could not be involved because we’re told that incompetence and corruption is responsible, of the sort that just happened to manifest itself at this point in time.
The 20 folks who are alleged to have died in hospitals from lack of power just coincidentally died at this particular point in time. Because it is merely coincidence, the saboteurs probably cannot be tried for murder.
Power has apparently been restored. Oil will resume its flow at whatever magnitude.
Rust doesn’t sleep. You ignore something long enough it’s gonna fail.
This is just their worst grid failure, far from the first.
Ahh, rust has a feel for coincidence, too.
Of course there are no coincidences, just the things that the CIA, the Illuminati, the freemasons, the jewish bankers and the Martians wanted to happen.
I remember one time they blamed a sloth for a large power blackout. The official report from the Guaidó organization is that the blackout was caused by a brush fire under the high voltage lines from Guri. The brush was there because as we all know Socialists don’t do even the simplest maintenance jobs, such as cutting brush along the critical high voltage lines.
Watcher should have explained to us, his amused audience, that Maduro explained the blackout was caused by CIA hackers allied with the National Assembly, who put computer viruses into the (analog) control systems.
A Maduro minister also said the US had giant drones able to fly all the way from Colombia and hover over the lines to make them overload by generating strong magnetic fields. But he added they asked the Cubans to come with their secret sonic weapon they used on US diplomats to strike the drone pilots.
“Thus, it surely is just a coincidence that their blackout occurred at a point in time when a foreign coup attempt was underway, rather than 9 or 6 or 3 months ago. Sabotage could not be involved because we’re told that incompetence and corruption is responsible, of the sort that just happened to manifest itself at this point in time.”
I am sure the US is trying to speed up the process. After all, those Aid buses were not torched by Mo or his supporters but by Western agents. Its difficult to know who is really to blame for the blackout, but the US has an agenda to take control over VZ. I would rule out the US causing it.
“Never believe anything until it has been officially denied”.
– Claud Cockburn
And the Venezuelans are very eager to let the US invade, kill all the Maduro supporters, then leave them all the surplus military equipment that’s useable for invading Cuba, so they can avenge their dead.
(Global) peak oil comes in phases. The 1st phase 2005-2008 caused the 2008 oil price shock and the financial crisis. Money printing was used to keep the system afloat and finance the US shale oil boom. The resulting high debt levels are now limiting economic activities. A lot of the problems we see in the world come from this chain of events.
I warned the Australian Prime Minister John Howard in 2004/05 but he did not want to listen.
Howard’s Energy Policy Failure 2004
http://crudeoilpeak.info/howards-energy-policy-failure-2004
As a result, Australia has built a lot of additional oil dependent infrastructure. Even Sydney’s new metro projects don’t replace car traffic:
11/3/2019
Sydney’s Immigration Metros (Part 1)
http://crudeoilpeak.info/sydneys-immigration-metros-part-1
As Art Berman said, shale oil is oil’s retirement party.
When we are down to fracturing rocks and drilling tens of thousands of horizontal wells that produce tiny streams of oil that decline by 70% in just three years we should instinctively know that we are reaching the bottom of the proverbial barrel, literally. Amazing how most people think just the opposite.
You just wait until we drill 10 thousand meter deep wells in Scandinavia to extract abiotic oil from fractured granite. Or something like that.
Just start sending Tankers to Titan. That moon has an ocean of Natgas\Propane.
Propane? I don’t think so. Only methane.
Yes Propane
https://en.wikipedia.org/wiki/Lakes_of_Titan
“is process leads to the formation of reservoirs of propane and ethane that may feed into some rivers and lakes. The chemical transformations taking place underground would affect Titan’s surface. Lakes and rivers fed by springs from propane or ethane subsurface reservoirs would show the same kind of composition, whereas those fed by rainfall would be different and contain a significant fraction of methane.[43]”
This write up from Do the Math talks about the energy balance of getting fuel from Titan
Interesting read, not particularly encouraging, in line with the whole blog.
The actual course of the subsequent 8 years has been far better than Prof Murphy had framed, but unfortunately we have invested very little of the excess energy extracted into building renewables
https://dothemath.ucsd.edu/2011/10/stranded-resources/
Wake posted:
“This write up from Do the Math talks about the energy balance of getting fuel from Titan”
It was a joke. Hypothetically it probably would be a 50 to 70 year round trip to get a tanker to & back from Titan. Not sure there is any feasible way get a NatGas\Propane cargo down from orbit, unless there is a pipeline from GeoSync to the ground.
I think the only realistic solution is massive population reduction (ie about 7.8B to less than 1B). That will probably happen in the not so distant future, but not in a nice way at all.
That is a dramatic decline? What is your estimated timespan this will occur?
1B is a bit high–
Optimal conditions, maybe 50,000.
But I’m a optimist.
from you a joke for sure, I just thought the math of space resource extraction was interesting. Elon could stand to read that blog a little
We will have to move to Calisto, it’s closer to Titan.
“We will have to move to Calisto, it’s closer to Titan.”
Too much radiation for me, or any human. No hydocarbons (or at least on the surface).
I had no idea Congo was part of OPEC.
OPEC countries in alphabetical order: Algeria, Angola, Congo, Ecuador, Equatorial Guinea, Gabon, IR Iran, Iraq, Kuwait, Libya, Nigeria, Saudi Arabia, United Arab Emirates and Venezuela. Qatar left OPEC on January 1st.
It is the Republic of the Congo, not the Democratic Republic of the Congo (DRC). Or the smaller one that borders Gabon.
Congo became part of opec because they wanted a better excuse to go shopping.
……………….Saudi Arabia
………………Quota…10,311
.Feb. Production…10,087
………….Difference…-224
Saudi Arabia produced 224,000 barrels per day less than their quota. Did not anyone notice this and wonder why? The rest of OPEC was 179,000 barrels per day over their quota. Iraq was the largest violator being 121,000 bpd over their quota.
Also, Saudi Arabia was the absolute driving force behind these quota cuts implemented in January.
Noticed, and you could argue that they are showing the way and taking the larger part of the burden since they want to be so nice to the rest of the opec members ?.
Or perhaps the level they have been producing at is unsustainable and they are really glad to officially have an excuse to cut back on production.
Your take?
Or perhaps the level they have been producing at is unsustainable and they are really glad to officially have an excuse to cut back on production.
You nailed it. That’s my take exactly.
They just hit the wall??
I think they can calculate. 200k / month less is 2% less and perhaps 5 or 10% higher prices.
Pumping for “market share” most times ends with empty wallets.
Nonsense. 200,000 barrels per day is about .24% of world production. That is one quarter of one per sent of total world C+C production . Are you actually claiming that would increase world oil prices by 5 to 10%? I don’t think so.
1 mb/day for a somewhat longer period surplus or deficit defines the oilprice between 40 or 100$. And contribution from SA counts double, since everone looks there, after looking to shale.
And 200k is round about 2% of their 10m/day. It’s 2% less raw money.
And contribution from SA counts double, since everone looks there,
Really now? A decline in Saudi production counts twich as much as a decline in Russia? Because everyone looks there? Oh my God? And you are serious!
The world oil price is determined by supply and demand, not by the tiny fraction of people who follow who’se producing how much.
Sorry – in medium term the price is set by buying and selling of oil futures at wall street.
In the long term, and at extremes it is supply and demand. When storage tanks are almost empty or overflowing.
You see it now: Everyone expects shale to continue to boom, so prices stay moderate, even outages give no dent to price action.
You don’t believe me?
The single most traded future(there are lots more), only on WTI, has a volume of 350,000 futures today, equivalent of 350 million! barrels of oil. Here prices are made. Real trade is only a tiny amount of this – there are round about 10 mb/day existing WTI oil (you know better than me).
Check here:
https://www.barchart.com/futures/quotes/CLJ19
And parts of these trades are done with robots, KI Hft trading systems. Inclusive headline scanners of news sites. As in stock market or bond market.
Funny to watch: The site has a life update. While I watched, another million barrel of oil changed it’s owner.
And parts of these trades are done with robots, KI Hft trading systems. Inclusive headline scanners of news sites. As in stock market or bond market.
I am sorry but this is pure baloney. Yes, there is computerized stock trading. That is when the physical stocks and their futures get too far apart, the computer will buy, (or sell), a bundle of stocks that represent the S&P 500 or Dow 30, then take the opposite position in the futures market. They may hold these positions for several seconds or several minutes, but seldom longer than that. Then as soon as the physical market and the futures market move closer together, the computer unloads both positions, pocketing the differnce.
They do not do this with the oil market because there is no way the computer can buy or sell the physical. (The oil spot market is not traded on any exchange.) And as far as the computer scanning the headlines… Oh give me a fucking break!
https://slate.com/business/2015/04/bot-makes-2-4-million-reading-the-web-meet-the-guy-it-cost-a-fortune.html
Watcher, this article is talking about a bot that can get rumors of a takeover in in the market. Then the computer buys stock options on the company being taken over. A huge gambel and as the article points out, millions can be made or lost. A gamble just as any stock trade is.
But Reuters said it was all bullshit. That the trade happened 19 seconds before the tweet was released. (Someone was frontrunning.) If I were forced to guess, I would agree with Reuters.
At any rate, this has nothing to do with oil futures, the oil spot market or the price of oil in general.
I dont think so, sure its “simple enough” on paper pump a little bit less and earn a lot more on the higher price.. while saving your resource right?
If that is the reason they are lower here, logic say they should go even lower right, cut of 2-3 mboepd more right and profit even more when price spikes on that news? Perhaps we will se that in Rons next monthly update? (I think not)
And why are they letting other opec nations take advantage of them? Saudi raising prices with their cut and the others continue to pump and basically profit on saudis cuts? Are the saudis content with that since they are so nice and really really like the other opec nations so much?
No, i believe Ron is spot on, they have been pumping every barrel they can for quite some time now, the peaks and dips we see are more or less defered scheduled maintenance and some storage draws to artificially create peaks before they “cut”, they are more or less on an undulating plateau since som time now in my opinion.
Today, March 15 (Ides of March), huge New York City utility – Con Ed – starts a moratorium on natgas hookups in Westchester county.
In a few weeks, if a new, short pipeline crossing Raritan Bay (NJ to Long Island), is not approved, another gas hookup moratorium for Brooklyn, Queens, Nassau and Suffolk counties will kick in by May, according to utility National Grid.
While these actions are seen as huge victories by anti fossil fuel advocates, the growing backlash may produce an entirely different, future scenario.
Already politicians across the spectrum are enraged at the looming developmental (residential and commercial) halt in their areas.
This unfolding narrative may provide excellent indications at how the various tensions will play out under the white hot spotlights of the New York media.
Not really big news since Westchester & Long island is already has set up for Oil heat. There are plenty of homes that use Oil for heat. For the same reason its no victory since new homes or business can simply use Oil.
NY biggest head ache is rich people and business leaving the state right when it needs them the most to prop up NY underfunded pension system. NY Governer has been freaking out that AOC and Mayor de blasio killed Amazon, and any any change of any major company setting up an office in NY state.
“wealthy clients are fleeing New York like never before”
https://www.crainsnewyork.com/letters-editor/his-wealthy-clients-are-fleeing-new-york-never
“Greg David’s most salient point in “Millionaires tax: Kill it, extend it or raise it?” was that 0.6% of taxpayers pay 40% of the state’s personal income tax.”
Tech guy
The cost differential to heat water, cook food, warm buildings, and dry clothes – to list just a few applications – using natgas versus oil or electricity is very significant.
The competion for Ultra Low Sulfur Diesel and Fuel Oil due to the new shipping regulations will ensure that this price spread increases.
These moratoria are guaranteed to affect future building as both the business communities and the real estate developers (joined by the politicians who forsee vanishing tax rolls) are already loudly raising a fuss.
The new hockey stadium in Belmont Park is the most prominent project looking to be cancelled sans natgas supply.
CoffeeGuyzz Wrote:
“The cost differential to heat water, cook food, warm buildings, and dry clothes – to list just a few applications – using natgas versus oil or electricity is very significant.”
Lots of homes in NY use Oil heat.
“These moratoria are guaranteed to affect future building as both the business communities and the real estate developers ”
The best risk is that residents and business will leave NY, do to the high tax rates. In Long Island, the property taxes can exceed $20K\yr for a very modest home. The cost difference between NatGas and Oil is tiny compare the costs Property owners pay in Property Taxes.
It’s not just the wealthy who are fleeing New York. Middle class people, defined as those who earned a good living, regardless of their actual profession, and lower class plain old working people are apparently leaving in droves. My personal theory is that the lower class workers, defining them as the ones who were in about the bottom quarter of income in New York , are holding on, as best they can , there, in order to qualify for the best pension and social security check they can qualify for, and moving out within months of signing up.
About a dozen of these economic refugees have landed within spitting distance of me. Rents are cheap here, real estate is cheap, by New York standards, and crime and taxes are low, by New York standards. The environment is pristine, compared to New York, except ” upstate” New York.
Basically factors of this sort make places like Southwest Virginia and Northwest North Carolina the new Florida and the new California, when discussing the flow of people and money into and out of communities.
All you guys with money and careers in the oil patch might want to give such trends some thought, if you are thinking about getting out of the oil biz.
Mac
” … holding on as best they can … to qualify for the best pension check …’.
That succinctly describes at least half a dozen people I know in the New York/New Jersey area who are, literally, becoming desperate to stay in their jobs and houses until they can qualify for lifetime benefits.
The guaranteed medical insurance is another large – and increasingly expensive – aspect to this situation.
People such as the former governor of Maine and even Ocasio-Cortez’s mother make no bones about the high taxes driving them from the area.
The recent warning from the NYPD to their Long Island based membere to be aware of threats from the growing MS 13 gang is but one example of the shocking deterioration of the overall social fabric of what was once a great place to live.
OFM Wrote:
” My personal theory is that the lower class workers, defining them as the ones who were in about the bottom quarter of income in New York”
Many Lower class workers don’t have the mobility to leave, or they have family obligations that make it difficult to leave. It always easier for wealth people to leave than poorer people.
Some international inventories week/week changes (million barrels)
Total Distillates: -2.96
https://pbs.twimg.com/media/D1uv0GfWwAI_EEx.png
Light Distillates: -4.44
Middle Distillates: -0.12
Heavy Distillates: +1.59
https://pbs.twimg.com/media/D1uxOZzXgAcMoEt.png
Japanese inventories should be close to a seasonal low
https://pbs.twimg.com/media/D1uxa9nX0AE6_BR.png
US inventories week/week change (million barrels)
Crude Oil: -3.86
Total Distillates: -5.82
Propane & NGPLs: -1.84 (not shown)
SPR: flat (not shown)
https://pbs.twimg.com/media/D1u6P5OWsAEUkMn.png
2019-03-15 (S&P Platts Global) “Azerbaijani oil production has already entered a period of natural decline, so additional exploration and development is needed but that is expensive in a landlocked country like Azerbaijan compared to more accessible oil regions of the world,” said Alp Coker, a senior analyst at political risk consultancy GPW Group.
S&P Global Platts Analytics forecasts Azerbaijan’s crude and condensate production will stay roughly flat up to 2021, with rising condensate output from Shah Deniz continuing to act as a counterbalance to declines at its mature fields.
Beyond that, however, the outlook is less promising. Independent energy expert Ilham Shaban noted that, since it gained independence from Russia in 1991, Azerbaijan has not discovered a single new oil field.
https://www.spglobal.com/platts/en/market-insights/latest-news/oil/031519-azerbaijan-hosts-opec-non-opec-jmmc-as-it-courts-new-oil-investment
2019-03-11 Daily oil production in Azerbaijan amounted to 806,000 barrels in February. Of this, 722,000 barrels of crude oil and 84,000 barrels of condensate. Last year, average daily oil production totaled 792.6 thousand barrels/day.
Just want to add my name to those who’ve already thanked you for the great links you consistently provide us Energy News.
Question: Is U.S tight oil the only tight oil that will ever be extensively developed? Shouldn’t Middle East and Russian tight oil be figured into all these swags about peak oil? If the U.S. is unique, even in outlooks to 2050, why is it so? Thanks.
“Question: Is U.S tight oil the only tight oil that will ever be extensively developed? Shouldn’t Middle East and Russian tight oil be figured into all these swags about peak oil?”
US Shale Drilling is driven by Cheap credit not geology or economics. None of the Drillers make any money, and ME exporters need money to support their subsidized economies. Shale Works in the US at a loss because the Dollar is the worlds reserve currency. The US can print trillions (already did) without collapsing its value. I doubt a small nation like KSA, Iran, etc can do the same. Also the US gained since Shale Production crushed Oil prices and the US still imports a lot of Oil.
One also has to consider that Oil resources for these small nations is becoming more of a liability than an asset, since it points a huge Bulls-eye for a US takeover.
That said, KSA is using Shale Drilling for Natgas, since It uses Natgas for electricity and other domestic uses.
https://www.bloomberg.com/news/articles/2018-03-07/saudis-seek-to-tap-shale-gas-basin-rivaling-texas-eagle-ford
Richard,
In the US the mineral rights are privately owned, in most other nations they are owned by the government and must be leased from the government, this is the main reason that there is much lower numbers of oil wells drilled in most other nations relative to the US. It is unlikely that tight oil resources will be developed extensively outside the US. If they are developed at all it may not happen nearly as quickly as it has in the US and different nations will develop the resources at different times and at different rates. Keep in mind that the EIA estimates of World tight oil resources are probably not very good, economists don’t know a lot of geophysics in most cases and often just assume resources can be recovered by making magical technological assumptions (they assume a can opener as the old joke goes.)
Also keep in mind that based on USGS mean estimates and “reasonable” economic assumptions, US tight oil economically recoverable resources are likely to be about 85 Gb, this total is very small relative to World proved plus possible resources of about 1500 Gb to 2100 Gb (mean estimate of 1800 Gb including future discoveries and reserve growth). If World tight oil resources were double the US estimate (170 Gb and 85 Gb from nations that are not the US), it would not be enough to move the needle considering that it will not be developed as rapidly as has been the case in the US.
If we consider the hypothetical case where World tight oil minus US tight oil output follows a curve similar to the US moved forward by 13 years (2006 output for the US that same as 2019 output for World tight oil minus US), we get the curve below. This moves the peak forward from 2025 to 2028 and peak output is about 4 Mb/d higher than a case where no tight oil output is assumed from nations other than the US.
Scenario with tight oil output from other nations in the hypothetical case above results in a plateau from 2025 to 2035, dotted line shows original scenario with no tight oil output assumed from nations other than the US. Note that I consider the higher scenario highly unlikely.
In this graph the solid line (world plus US tight), you can see that the pP90% is at about year 2040.
pP90% standing for postPeak 90% level.
It is time to start thinking in terms of quantifying the downslope.
This thought is amplified in the following article from a Russian point of view:
https://www.mdpi.com/2071-1050/11/6/1627 – Global Shale Revolution: Successes, Challenges, and Prospects
It includes estimates for new production from China and Australia.
Richard:
It works like this: the US lucked into phenomenal “shale” geology in Texas and North Dakota , the same way Saudi Arabia lucked into having supergiant reservoirs in high quality carbonates, Canada and Venezuela supergiant extra heavy oil stratigraphic traps in magnificent sandstones, and Qatar/Iran got hyper giant gas reserves in one single reservoir at North Dome.
And of course the economic and regulatory environment in the US allow aggressive companies with cheap financing to go nuts developing what we consider really low quality rocks with very expensive wells which produce very light crudes refineries have trouble refining.
Other nations have some potential, for example Argentina. And when oil prices go above $100 per barrel and stay there we should see other countries produce oil using long horizontal wells fractured by pumping thousands of tons of sand. But the US situation is unique.
Fernando,
Any guess as to how much economically recoverable tight oil for the rest of the World for the oil price scenario below, any WAG by you would be better than mine as you know petroleum engineering and I do not. Does a guess of “rest of World” (excludes US) tight oil similar to US URR of about 85 Gb seem in the ballpark, too low, too high?
Director’s Cut for January just released.
Over 1,400,000 bbld again, just a touch under December’s record high.
A huge increase in North Dakota Bakken/Three Forks output in January. Up by 259 barrels per day from the December level. 🙂
Dec 1346480 b/d
Jan 1346739 b/d
https://www.dmr.nd.gov/oilgas/stats/historicalbakkenoilstats.pdf
Yeah, and that huge increase was offset by an even greater decrease in all North Dakota production. 😉
Dec 1,402,741 b/d
Jan 1,402,402 b/d
difference -339 b/d
2019-03-15 The recent increase in Australian crude oil & condensate production is due to an increase in condensate production
January (C+C) 315 kb/day
Average 2018 (C+C) 291 kb/day
Baker Hughes
18 gas rigs
4 oil rigs
Australian production split: crude oil and condensate and also LPG is on the chart too
https://pbs.twimg.com/media/D1xeKhlXcAApy70.png
Australian natural gas production
https://pbs.twimg.com/media/D1xexc4XQAAp2rB.png
25/7/2018
Australia is exporting itself gas poor, plans LNG import terminals
http://crudeoilpeak.info/australia-is-exporting-itself-gas-poor-plans-lng-import-terminals
For any of you number crunchers,
Which countries are expected to morph from net exporters to net importers within the next five to ten years, or even sooner?
Thanks in advance!
I used to like this site for looking at those trends, however it has not been updated lately.
http://mazamascience.com/OilExport/
My guess is Mexico will shift to net importer soonish if not already.
This link might help determine where exporter to importer might occur next
https://en.wikipedia.org/wiki/List_of_countries_by_net_oil_exports
mazamascience used BP’s world stat review, you can get the Excel spreadsheet from their site. I don’t think mazama updated when their new data came out, June each year.
I’ve been a fan of Ron’s (Darwinian) work back from the Oil Drum days.
I find that he is generally on the money with his ideas, and I certainly have learned ALOT from him.
For that I am grateful.
I guess one of the struggles of running a Peak Oil blog is coming up with fresh and new material.
When South Africa was “oil embargoed” by the United Nations.
They successfully turned to Coal to Liquids. SASOL.
I am 100% with climate scientists on climate change. I want a transition to renewable energy as well.
It would be great to get some articles on the feasibility of converting to CTL or GTL.
I have no doubt this is where we are going. The first time humans experience petrol rationing, climate change concerns will go out the window.
Any Coal to Liquid experts out there? Karl Denninger (has an energy plan involving thorium and coal….maybe a guest post)? SASOL?
US$120 per barrel will get you CTL.
Any other variables involved?
or is it like flipping a light switch?
Articles on CTL
https://www.ft.com/content/8c2f17fc-a137-11e7-9e4f-7f5e6a7c98a2
https://www.sciencedirect.com/science/article/pii/S0301421518301174
Cost estimates are hard to find.
It would nice to know long it would take to ramp up.
What would be the limiting factors ( skilled employees, water, politics).
What countries would this work in (USA, Australia,…)
But I guess no one really knows because it has never been done at this scale.
I think Robert Rapier has done some work with GTL and CTL.
Would great if he could do a post on it.
Denninger might be another interesting post (but controversial).
Denninger wants to build thorium nuclear reactors that use the thorium in the coal to liquify it the coal itself.
He believes that would solve energy problems in USA.
He is a climate change denier.
“Any Coal to Liquid experts out there?”
There are two common ways:
1. Gasifers that burn coal in a furnance mixed with steam to product CO (Carbon Monoxide) & Hydrogen. These gases are passed through column using a metal oxide catalyst (rust works), Generall CTL produces waxy type hydrocarbons (OK for diesel but poor for Gasoline). The best efficient process is Coal to DME (Dimethyl Ether) which could be used to power vehicles. The issue with this process is that its difficult to scale up since there is a practice limit to the size of the furances, and you need to feed coal into it (mine, transport it, crush into the approapiate size). You also need to periodically remove slag build up.
2. In-Situ Coal seam gasification. In this process the coal sean is ignited and feed pressurized steam. However once a Coal seam fire is started its virtually impossible to put out, and it destroys the environment. there is a imfamous coal fire in Rural Pennsylvania that’s been burning for about 60 years. Towns have been abandoned when the fire reaches the seams under the town.
Thorium is a fools errand: First off, Good luck in finding volunteers willing to work in Thorium mines or process ore into fuel pellets. Fissile Thorium used in a reactor produces U-232 which decays with a very nasty high energy gamma, Its extremely difficult to work anywhere near it, and it requires at least double the shielding compared to Uranium or Plutonium fueled reactors. Thorium was abandoned back into the 1960s since there is no practical way to address the U-232 problem.
It would be more practical to just use Uranium breeder reactors that convert fertile U-238 into Pu-239. However economically this is doomed since its still very expensive.
I really appreciate that response. Thanks!
Would love to see a debate between people who know what they are talking about.
I am not one of them! LOL!
CTL is already economically viable for aviation fuel. The problem is double. It requires a huge up front investment, and it runs into problems with anti-CO2 emissions policies, but China, that is exempted from CO2 control, is going into it full throttle right now.
The Germans were huge on CTL during WWII, producing half of their liquid fuel from it, but they were forbidden from continuing doing it at Postdam, so they had to dismantle what was a very efficient industry.
The moment Peak Oil starts biting we might turn to CTL and climate change can go to hell… quite literally.
Doesn’t CTL use lots of water which China doesn’t really have? I’ve read a little bit about the process but need to go back an refresh my memory.
Is CTL scalable? if you have the coal, like the USA has……..
How many barrels a day could you produce from it?
forget about political concerns or climate change.
How long would it take to produce as much as you could?
Germany was in a pan-European war yet it managed to produce half of its liquid fuel needs with 1930s technology. I am not aware of any limitations as long as you can afford it and procure the coal. The US army has done a lot of research on it. It should be cheaper and more efficient now than 75 years ago. It is more expensive than conventional oil, but I am not so sure about deep-sea and shale. The problem is that the volume of oil we use in the world is humongous. The up front cost of conversion necessarily has to be too. The main problems in my opinion is that we are in denial about Peak Oil and in climate panic mode. Under those conditions the transition will only be started by China, that is keenly aware of its oil needs and doesn’t give a damn about climate.
Also Peak Coal appears to be closer than we once thought. Even if successful it would only buy us a few decades at best. But I have little doubt that it will be part of the answer to Peak Oil when we finally accept it.
https://www.rigzone.com/news/wire/exxon_hits_the_brakes_on_19b_project-15-mar-2019-158388-article/
Looks Exxon are loosing money on their oilsand project in Canada , as always they stop or selling shears if they start loosing money because fundamentals changes. Permian might be next when full impact of child wells increased decline rate, frack hits, polution cost and change in structures outside sweet spots.
1978 — France: Amoco Cadiz runs aground near Portsall, releasing 223,000 tons of crude oil.
Some arguments in defense of Ron estimates
1. When something is increasing 0.8% a year based on data with, say, 2% or higher margin of error this is not a growth. This is a number racket.
2. We need to use proper coefficients to correctly estimate energy output of different types of oil We do not know real EROEI of shale oil, but some sources claim that it is in the 1.5-4.5 range. Let’s assume that it is 3. In comparison, Saudi oil has 80-100 range. In this sense shale oil is not a part of the solution; it is a part of the problem (stream of just bonds produced in parallel is the testament of that). In other words, all shale oil is “subprime oil,” and an increase of shale oil production is correctly called the oil retirement party. The same is true for the tar sands oil.
So the proper formula for total world production in “normalized by ERORI units” might be approximated by the equation:
where coefficients (I do not claim that they are accurate; they are provided just for demonstration) reflect EROEI of particular types of oil.
If we assume that 58% of the US oil production is shale oil and condensate then the amount of “normalized” oil extracted in the USA can be approximated by the formula
In other words 17% of the volume is a fiction. Simplifying it was spent on extraction of shale oil and condensate (for concentrate lower energy content might justify lower coefficient; but for simplicity we assume that it is equal to shale oil).
Among other things that means that 1970 peak of production probably was never exceeded.
3. EROEI of most types of oil continues to decline (from 35 in 1999 to 18 in 2006 according to http://www.euanmearns.com/wp-content/uploads/2016/05/eroeihalletal.png). Which means that in reality physical volume became a very deceptive metric as you need to sink more and more money/energy into producing every single barrel and that fact is not reflected in the volume. In other words, the barrel of shale oil is already 1/3 empty when it was lifted to the ground (aka “subprime oil”). In this sense, shale wells with their three years period of the high producing are simply money dumping grounds in comparison with Saudi oil wells. Again — this is a subprime oil.
4. The higher price does not solve the problem of the decline of EROEI. It just allows the allocation of a larger portion of national wealth to the oil extraction putting the rest of the economy into permanent stagnation.
5. If we assume average EROEI equal 3 (or even 5) for shale oil then rising shale oil production along with almost constant world oil production is clearly a Pyrrhic victory. Again, putting a single curve for all types of oil is the number racket, or voodoo dances around the fire.
NOTES:
1. IMHO Ron made a correct observation about Saudi behavior: the declines of production can well be masked under pretention of meeting the quota to save face. That might be true about OPEC and Russia as a whole too. Exceptions like Iraq only confirm the rule.
2. EROEI of lithium battery is around 32
You have no idea what the EROEI is for anything. There’s no clear methodology.
Likbez,
EROEI of a specific energy source is not important, it is the EROEI of all sources of energy used by society that matters. Energy inputs to the oil production, refining and distribution process can come from oil, coal, natural gas, solar, wind, nuclear, hydro, and geothermal energy sources. Note that the EROEI estimates are not very good and the ranges in the literature are quite wide.
Far simpler to just look at C+C output.
The argument about Saudi output has been made since 2008, eventually it might be correct. We won’t really know until oil prices increase to $85/b or more (Brent price in 2018$), if Saudi Arabia fails to increase output when oil prices rise above $90/b then it may be that they have reached peak output. Before that we don’t really know much.
A battery has an EROEI? I wonder what the EROEI of my BBQs propane tank is?
I would think that what is perhaps most important about a battery is this: what is the EROEI of whatever it is that is making the electricity that is going into the battery? For after all, batteries are not a source of energy.
https://en.m.wikipedia.org/wiki/Primary_energy
https://en.m.wikipedia.org/wiki/Energy_carrier
Even eating your lunch has EROEI. Animals have to get sure they expend less energy obtaining their food than they get from it. Otherwise they starve. That’s how prey preferences work many times. Foxes will go after smaller prey than wolves (even solitary ones) due to their smaller energy requirement.
Celery is calorie negative for us. It has negative EROEI, as munching and digesting it will consume more calories that it produces. That’s why it is a good diet food.
Countries that have reported their January production (shown on the chart)
OPEC14 -822
Alberta -268
Mexico -87
Russian Federation -78
Brazil -60
Norway -48
Total -1,429 kb/day
Chart https://pbs.twimg.com/media/D12BlLBW0AEDR6G.png
So far for February: Russia, OPEC14, Norway
Total: -330 kb/day
Chart for December which includes the big increases from the USA
https://pbs.twimg.com/media/D12IDSNW0AE18u1.png
China crude oil production
February: 3,813 kb/day
Average 2018: 3,788 kb/day
https://pbs.twimg.com/media/D12PhtXWsAALxTw.png
As the UK struggles to replace declining gas production from the North sea the onshore exploration for shale gas continues, with so far poor results.
One of the best hopes is the large Bowland shale formation in the North. This is a core sample from the newly drilled well at Springs road operated by Igas.
https://youtu.be/dnZDrTLWiyQ
Pretty good piece on Tesla and its competition
https://www.forbes.com/sites/billroberson/2019/03/17/its-the-tesla-model-y-versus-the-competition-now-that-there-actually-is-some-finally/#53d7afe1786b
The Model Y will be viewed more as a sports coupe along the lines of the BMW X4 and X6 rather than an SUV like the X3 and X5. I see more X3s and X5s on the rode. Just saying.
Ovi,
The X3 has 63 cubic feet of space inside, the Model Y has 66 cubic feet. We don’t know about the ground clearance for the Model Y, it is probably less than the 8 inches for the BMW X3. The Tesla Model X only has 5.4 inches of ground clearance. The Model 3 has 5.5 inches of ground clearance. The Model Y will have all wheel drive available, the Toyota RAV4 (best selling SUV in US in 2018) is front wheel drive only, it also has 8.4 inches of ground clearance and 69 cubic feet of cargo space behind front seats.
The hatchback design of the Model Y may sell well. My Model 3(AWD) worked very very well this winter in Snow in northern New England.
Dennis
The numbers are good.
I was a consultant to the Cdn affiliate of Global Automakers USA. There were many discussions of the difference in preferences of US buyers vs Cdn. In particular, Canadians were content with Hatch back cars/designs while Americans weren’t. There were car models sold in Canada that were not sold in the US.
So my comments reflected primairily on styling and buyer preference and I was wondering how that TSLA style would sell in the US, knowing that the more common square back style SUVs do sell well in the US.
Yes square backs are popular in US not very good aerodymanics though. For an EV it is not a good design.
Tesla does look like it is getting ripe for bankruptcy.
http://coyoteblog.com/coyote_blog/2019/03/the-apparent-cash-crisis-at-tesla-is-the-tsla-thursday-model-y-reveal-really-just-a-stealth-emergency-financing-gambit.html
It seems that both OPEC+ and the IEA are waiting to see what happens in regard to oil production/export from Iran and Venezuela. The deadline for the US decision on Iran sanctions waivers is 3rd May. And OPEC+ have delayed their JMMC meeting from April to May. And the IEA have only forecast world demand/supply to 2Q 2019
IEA latest chart https://pbs.twimg.com/media/D15jDJVWkAAv5i-.png
Pennsylvania just released its January production numbers.
At slightly under 565 Billion cubic feet and over 18.2 Bcfd, these are both new records.
Ohio released their 4th quarter numbers numbers last week showing an average per day rate now over 7 Bcfd, another new record.
The three Appalachian Basin states of West Virginia, Ohio, and Pennsylvania now produce more gas than any other country in the world with the exception of Russia and the US at over 11 Trillion cubic feet (almost 400 billion cubic meters) per year.
Coffeeguyzz,
At a natural gas spot price around $2.80 per MCF, I wonder how profitable the Appalachian Basin wells are?
What is the average well cost in these Basins (all costs, including land, facilities, and drilling and completion, as well as plugging at end of life)?
Also do you know if average lateral length has increased from 2016 to 2017 ? I ask because Marcellus average well productivity over first 13 months has cumulative output increase by 33% from 2016 to 2017 for the average Marcellus well. In the Permian basin these types of improvements were caused by increases in average lateral length and pounds of proppant per 1000 feet of lateral. I don’t have data for Marcellus, except the article linked below
https://www.aogr.com/magazine/editors-choice/best-practices-extend-lateral-lengths
this piece focuses on Range Resources and suggests average lateral length increased about 35% from 2016 to 2017. Based on recent investor presentations D+C cost is about $9 million and when land and other costs are added, full cycle costs would be at $10 million per well. Recent range resources presentations suggest they net about 75 cents per MCF at $3/MCF. So about 13 BCF would pay for the well. Note that the average 2017 well looks like it will have no more than 7.3 BCF of cumulative output after 60 months, which is typically where one would see a profitable well payout. Note that for Range Resources cumulative output for the 2017 average well looks like it will be less than the basin average (6.6 BCF vs 7.3 BCF for the basin average for cumulative at 60 months). The investor presentations often use very optimistic estimates for future output which are unlikely to pan out.
Dennis
Addressing a few of the points you mentioned …
Lateral length continues to increase a bit, but the fact that these states do NOT have pre-set lease/Drilling Units in place prompts a wide range of available drillable acreage and, thus, lateral length.
One consequence is that 9 to 10 thousand foot laterals may be the vast majority of wells far off into the future.
The big increase in wells’ early output starting about 2016 in this region (as in the Bakken, also) coincided with the successful implementation of diverters in this industry.
Both near wellbore and far field diversion products have allowed a far higher percentage of the rock to be stimulated in a somewhat controlled fashion than earlier completions.
This is the main reason that all these wells are using so much sand.
WAY more of the rock is being fractured and is then in need of propping.
Your statement of 13 Bcf cum being needed to pay for a well is something that even Coffeeguyzz’ atrocious math skills cannot justify.
Using a $3/mmbtu price point for rough example, that would mean a well would need a gross revenue of nearly $40 million to pay.
Nah.
The suit from Chesapeake, when asked about the McGavin 6 well, said it cost under $9 million to D&C and would pay out in 8 months, if I recall correctly.
(McGavin 6 is now just under 14 Bcf – 13.9 – in 18 months – 550 days – online.
At $3/mmbtu, gross revenue would be over 40 million … 18 months.
Expressed in terms of oil energy, this well has produced almost 2 and a half million barrels of oil-sourced energy. 18 months. Under 10 million bucks).
There are producing gas wells in Pennsylvania that are almost 100 years old.
This is one of the little- recognized advantages that the gas wells will have over the oil wells as the years/decades roll on.
Operating expenses for the gas boys are small versus their oily brethren’s costs.
Southwest Pennsylvania – where Range primarily operates – is far wetter than the mighty northeast PA wells.
While the NGLs have historically been more profitable than the pure dry, logistic constraints continue to play a role.
Again, when using Enno’s site, the calendar monthly figures are used, as opposed to the actual days online parameter.
When wells are offline for weeks as nearby wells are frac’d, misconceptions can arise surrounding the geologic potential of these wells.
2019-03-18 (JODI Data) Saudi Arabia crude oil closing stocks fell by -4.5 month-on-month to a decade low of 200.8 million barrels. While its total oil products closing stocks rose by +1.85 to an all-time high of 96.6 million barrels in January.
JODI Data chart https://pbs.twimg.com/media/D18MbgsWoAAmP4f.png
Dennis
Time permitting, I usually get a kick out of interacting with you on this site as your questions/input/skepticism invariably prompt me to do a little ‘digging’ before I respond.
This, primarily to be as accurate as possible but – more commonly, of late – to keep me ‘up to speed’ in this blindingly rapid pace of unconventional development.
Attacking head on your use of $2.80/HH mmbtu … this is a great starting point for unhedged, dry gas producers (think Haynesville and North East Pennsylvania especially).
However, keeping Range Resources in the spotlight, SWPA (Southwest Pennsylvania) will be the focus.
Starting with today’s spot pricing or prompt month futures for Mont Belvieu, gives us …
(all per gallon pricing converted to barrels for illustrative purposes)
Ethane $47/bbl
Propane $117/bbl
Butane $132/bbl
Pentane $208/bbl
As the rich and so called super rich gas (>1200/1400 btus per 1k cubic feet) are comprised between 40 to 60 per cent of the total product stream as liquids (described as amongst the highest percentage in the world), effectively capturing and marketing these products have an enormous impact on a well’s overall profitability.
There are various other factors involved. Think handling, transporting, processing that come into play, but I will leave you with this for now …
This ‘gas world’ can be very different from the ‘oil world’ in so many ways.
Apply that reality to the 3 Appalachian Basin states – covering an area larger than the entire state of North Dakota – with sub units consisting of the Dry Marcellus, the Wet Marcellus, the Wet/Condensate Utica, Dry Utica, Deep Utica, at least 5 producing Upper Devonian formations (Antero just announced a pair of 12 MMcfd UD wells in West Virginia … a first), one may start to get a sense of the vast scope of what is unfolding here.
I’ll address some more of your questions later, but your cum #s are, as usual, way low.
Where did you get your prices?
Ethane is for sure not 47 dollars a barrel
It is more like 13 dollars a barrel
Phatom
You are correct.
All my above numbers are improperly inflated by a factor of 4.
Ethane, propane, butanes, and pentanes should be 12, 29, 33, and 52 bucks per barrel.
Thanks for pointing out the error.
(Prices are available at weekly intervals on EIA site).
Coffeeguyzz,
The cumulative production numbers are pulled from shaleprofile which is based on data reported by state agencies.
Perhaps you believe the well profiles claimed in investor presentations. You need to read all the fine print in those presentations which say in effect don’t believe anything you read in this presentation. 😉
Dennis
If you go to Enno’s site and punch in just 2 operators – Hilcorp and Cabot – you may see what I keep referring to when I say averaging can offer highly skewed assumptions … all the more so when dealing with the Appalachian Basin region.
The well profiles, especially the cums, when inputting both companies is way different than when either Hilcorp or Cabot alone are viewed.
Lest one think Hilcorp’s results indicate poor company performance, (their rock in northwest PA is way inferior to Cabot’s northeast position), Hilcorp is the privately run company that gave each of its several thousand employees a $100,000 bonus a few years back.
Their shallower, wetter, cheaper-to-drill wells apparently work for them.
Few of we ‘armchair analysts’ can put forth the tremendous amounts of time delving into the minutia of this stuff (even the pros disagree and are frequently wrong), but the prodigious nature of the hydrocarbon potential of Appalachia is one of the more under recognized stories in this Shale Revolution story, IMHO.
A quick look at Asia. Vietnam is also an oil producer but they have stopped reporting their data to JODI.
(Updated to January, kb/day).
Oct 24 2018 (Reuters) – Vietnam’s crude oil output is expected to fall by 10 percent a year through to 2025 due to declining reserves at existing fields, Vietnam Oil and Gas Group, or PetroVietnam, said on Wednesday.
https://uk.reuters.com/article/vietnam-energy/vietnam-crude-oil-output-to-fall-10-pct-a-year-through-2025-petrovietnam-idUKL3N1X42HG
The high was during 2004 with an average of, 409 kb/day
February 2019: 232 kb/day (7.3 barrels per tonne)
Mr. Woods
Don’t know how many readers will download and read your linked pdf, but I did … hoping to catch up on the world wide status of LTO.
Big disappointment.
Right off the bat, the omission of Argentina (arguably right behind Canada and the US regarding LTO evolution) struck me as odd, but the propaganda tone became overwhelming on pages 11 and 12.
(Argentina, BTW, just set up the world’s fourth FLNG to process Vaca Muerte natgas. Their unconventional production is rapidly displacing conventional sources in that country).
To repetitively regurgitate fallacious environmental claims regarding fracturing can only be assumed to attempt to impact the ignorant.
(If you are unacquainted with the 2016 EPA report on fracturing – a meta study of 1,200 previous studies – good place to start).
The data in your linked report may be somewhat informative, but it lacks the objectivity one would yearn for in a truly unbiased appraisal.
“Perfect Storm” Drives Oil Prices Higher
“The latest Brent rally has brought prices to our peak forecast of $67.5/bbl, three months early,” Goldman Sachs wrote in a note. The investment bank said that “resilient demand growth” and supply outages could push prices up to $70 per barrel in the near future. It’s a perfect storm: “supply loses are exceeding our expectations, demand growth is beating low consensus expectations with technicals supportive and net long positioning still depressed,” the bank said.
The outages in Venezuela could swamp the rebound in supply from Libya, Goldman noted. But the real surprise has been demand. At the end of 2018 and the start of this year, oil prices hit a bottom and concerns about global economic stability dominated the narrative. But, for now at least, demand has been solid. In January, demand grew by 1.55 million barrels per day (mb/d) year-on-year. “Gasoline in particular is surprising to the upside, helped by low prices, confirming our view that the weakness in cracks at the turn of the year was supply driven,” Goldman noted. “This comforts us in our above consensus 1.45 mb/d [year-on-year] demand growth forecast.”
https://oilprice.com/Energy/Energy-General/Perfect-Storm-Drives-Oil-Prices-Higher.html
https://www.ft.com/content/75e6d166-90f5-11e8-9609-3d3b945e78cf
Argentina.
Shale oil and gas.
Read it carefully to understand the reality that the Argentinians have stumbled across and that the rest of the world will eventually be forced to embrace.
If you need to produce something and the price is not high enough to produce it then declare a different price.
EROEI
The energy return on solar is really really bad.
The EROEI of solar is totally different from the EROEI from coal, oil and natural gas.
A gas or oil well can be drilled in a couple of weeks, oil wells in the Middle East can return the energy invested to drill the well in 2 or 3 weeks of production. After that the global economy gets usable energy to build roads, buildings, transport goods etc. Some wells have produced oil for decades.
According to the most optimistic estimate solar panels have an EROEI time scale of between 1 and 4 years.
https://cleantechnica.com/2018/02/03/solar-power-can-pay-easily/
At first one might think… That is not too bad, a solar panel can last for 30 years, so will produce between 8 and 30 times as much energy as it took to make it.
Unfortunately that is the wrong way of looking at EROEI. Energy is used within a timescale and it is not just the energy return that matters. It is the time it takes to make the return that is the most important consideration.
Imagine a factory producing solar panels, with a capacity to produce 10,000 per month.
It builds 10,000 solar panels and puts them on it’s roof. In order to be 100% reliant on renewable energy it would have to wait between 1 and 4 years before it would build the next 10,000 panels.
Of course it would go out of business. So what it does is it carries on building solar panels at a rate of 10,000 per month but uses electricity produced by burning coal and gas.
https://www.globalenergyinstitute.org/china-coal-consumption-rising
At the end of year one, it has used between 12 and 48 times as much energy as it’s solar panels have produced.
The coal and gas burned can never be put back in the ground.
The next year it produces another 120,000 panels, again burning huge amounts of coal and gas. The panels it has made by the end of year 2 produce enough electricity for the first 2 months of year 3 production. The rest comes from burning vast amounts of coal and gas.
Most importantly! Not a single spare watt of electricity is available to the rest of society. The factory is using all the electricity from the solar panels and a vast amount more.
Only at the end of year 12 at the most optimistic energy calculation is the factory energy neutral.
Unfortunately modern society cannot wait 12 years to get a positive energy return on anything.
There are many people who will not want to understand the timescale importance but it does go a long way to understanding why China is burning more coal.
and vast amounts more gas.
https://www.ceicdata.com/en/indicator/china/natural-gas-consumption
Add to that, that electricity from solar panels is intermittent by clouds, and nights, so you have to add energy storage systems. Battery to hold as much energy, as one rail wagon of coal, costs 50 million dollars.
In case of fossil fuels, it is the nature that concentrated, and stored the energy for us for free, during millions of years. In case of renewables, it is us, that have to concentrate, and store very dispersed energy. It’s a colossal difference.
Hugo-
“Unfortunately modern society cannot wait 12 years to get a positive energy return on anything.”
OK, so assume you are in the ballpark with the gist of your message here (I’ll let others debate those particular points if they wish),
then all the more reason to deploy PV solar on a massive scale now, before we are on the downslope of fossil fuel supply. For example, In about 6 more years the array on my roof will be paid back. The next 30 plus yrs will be beautiful gravy. We should be doing that on a global scale. The more we do of it now, the less the severe pain will be as oil, etc becomes unaffordable.
The problem is when renewables are displacig fossil fuels investments, because it brings forward the date of collapse.
name- that is one way to look at it, or that renewable energy sources will prolong the lifespan of fossil fuel availability. I believe that is more likely, as long as they remain cost competitive at the marketplace.
Hickory
The solar panels on your roof produce electricity some time and at other times you rely on the grid. I am talking about a factory that is using power 24/7 as they do in China. Can a factory producing solar panels ever supply all it’s own power without burning fossil fuels.
China not only increased consumption of coal but also natural gas, obviously something is not working.
True enough, and thus I am one who is very skeptical that renewables can be scaled up to the degree that everything will be just fine.
At this point I see renewable as fossil fuel extenders.
Not many choices, other than rapid downsizing.
We need to both, as I see it.
Renewables are just going to use up more fossil fuels. Renewables aren’t going to extend anything. It will be the exact opposite. We will have less fossil fuels sooner if we choose to continue building renewables. Not in the way some have envisioned it either with renewables replacing fossil fuels. We will get renewables that can’t be maintained due to insufficient fossil fuel inputs.
You can’t build and maintain renewables without a ton of fossil fuel inputs. Talk needs to be about how we downsize our population. Nothing else is going to cut it.
But nobody wants to have that talk. They too busy trying to make whatever country they happen to live in great again.
Can you imagine a politician coming out and saying hey there is going to be less and less for everyone. No more healthcare for everybody. Can’t have any kids unless you make $50,000 per year per kid. And oh yeah by the way you can eat only every other day. Or something like that. It’s not going to go over too well. That is why nothing is going to change. Right up until physics forces less on everyone.
I think we will have a global economic contraction. Demand will go down in some fashion. What will be left for a quality of life, I am not sure. Many uses of energy could be scaled back. Much airline travel isn’t essential. Life could be reconfigured so that personal auto driving is slashed. High energy agriculture could be cut. Homes can be made significantly smaller and more efficient. We can go back to a life without air conditioning. Etc.
HHH- I think you are far far wrong on that whole subject.
In any case, my province is building out renewables at a slow steady pace. And after another decade or two, we will be pretty far along the path to being much less vulnerable to a loss of fossil fuel. Certainly much better off than if we just continued to import and burn.
Another way of thinking about it- say we only had 3% of fossil left in world for use. I would advocate that every single bit of it be used for building out renewable sources. Others would prefer building cemeteries.
I keep thinking about Jimmy Carter’s “Cardigan Sweater” speech in 1997.
He basically said the same things and the world ignored him.
And did not re-elect him!
Most people have no interest in going to extremes over Peak Oil, but Climate Change…that is already getting violent.
When was the last time you saw a violent protest to prevent/mitigate Peak Oil?
Climate Change narrative just works a lot better…
Same end result.
Humans have to be emotionally engaged to do things….
“Properly motivated” people will go to extremes and believe they are perfectly justified doing ANYTHING.
Just look at history….
Correction- 1977…
“Imagine a factory producing solar panels, with a capacity to produce 10,000 per month.
It builds 10,000 solar panels and puts them on it’s roof. In order to be 100% reliant on renewable energy it would have to wait between 1 and 4 years before it would build the next 10,000 panels.”
Huh? So you take one month’s production and expect it to run the factory? Sounds like a stupid plan to me.
Let’s assume 2 years energy payback on a solar panel, even from inefficient fossil fuels.
Produce two years worth of panels and use those to power the factory completely for the next thirty. Over the next thirty the factory would produce 15 times as many PV panels as it needs to replace it’s own so another 14 factories could be built from that. The doubling time for new factories would be two years meaning there would be over 32000 factories running on solar energy producing 327 million panels a month by the time the first factory needed new panels.
All from an initial use of fossil fuels to run one factory for two years and then no more fossil energy needed.
Of course we would not need that many factories or that many panels so we could be quickly providing global energy in 10 years or so from a meager start of FF energy. . If we wanted.
We could also build and run 5 or 10 initial PV manufacturing plants from FF and run them for two years before becoming independent. That would cut the time dramatically and produce lots of excess panels for global use even faster.
Get it?
It doesn’t work that way, because panels made in December of the second year are 23 months away from being eroei positive.
Hugo’s example shows that solar panels give energy too slowly, to power own production.
At 30:1 eroei and 30 yr life, a year’s panel output will equal the energy required to make it (the previous year). Let’s say factory’s energy consumption is x MWh per year:
year 1: zero solar MWh produced, x MWh of coal/gas consumed
year 2: x MWh of solar energy produced, x MWh consumed => zero coal/gas
year 3: 2x MWh solar, x consumed => zero coal/gas + x MWh surplus solar
year 4: 3x MWh solar, x consumed => zero coal/gas + 2x MWh surplus solar
Hugo is wrong! IMHO 🙂
Hey name, you are dead wrong. Net energy has nothing to do with it. I said the factories do not have to use any fossil fuel power after two years.
Panels start producing power as soon as installed. At the end of the second year there would be enough panels to completely power the factory. No need for fossil power after that. In fact if panels were installed as they were produced, the initial burst of FF power would even less.
Get it now?
How were those gizmos to be shipped? Ditto the raw materials. Ditto the commute for workers.
This kind of stuff is going to get far more people killed than the minimum necessary.
diesel hybrid train of course
Now you are being infantile. bye.
Gonefishing
No I did not think you would understand
-.75, -.25, +.25, +.75, +1.25, +1.75, …
Alberta can increase production now
Chart: https://pbs.twimg.com/media/D2AziI5WoAA92Az.png
2019-03-18 Alberta monthly production limits, in million barrels per day:
January – 3.56
February – 3.63
March – 3.63
April – 3.66
May – 3.68
June – 3.71
Press release https://www.alberta.ca/release.cfm?xID=63730BFFBD008-C647-6E53-4A2CBCBBDA0CA39F
The curtailment does not include pentanes (condensate) or natural gas liquids.
India PPAC – Consumption of (Light + Middle) Distillates (kb/day)
February year/year increases…
Lights +154 kb/day or +16.4%
Middles +53 kb/day or +2.6%
(Light+Middles) +207 or +7%
Chart https://pbs.twimg.com/media/D2BioTCW0AIr8mN.png
India daily retail prices for petrol & diesel
https://pbs.twimg.com/media/D2BkW4vW0AMMntK.png
India is a pretty big deal. 4.7 mbpd and these numbers above indicate a triple on last year’s growth rate (which we all knew was an aberration).
Useful to know if LPG is in the Lights number. Lights is usually heavier than LPG and India burns a LOT of LPG for motorbikes.
Hello, I didn’t include LPG. Lights are: Naphtha + Motor Spirit (Gasoline)
…and Middles are
ATF (Kerosene Jet Fuel)
SKO (Kerosene)
HSD (Diesel)
Big push for smoke free cooking in India…
March 5, 2019 (Business Today) India is now the second largest consumer of liquefied petroleum gas (LPG) in the world, with LPG consumption in the country posting an average growth of 8.4%. And a lot of the credit goes to the government’s push to provide clean cooking fuel to every household through the Pradhan Mantri Ujjwala Yojana (social welfare scheme).
Indian Oil Corporation, Bharat Petroleum Corporation, and Hindustan Petroleum Corporation – have collectively set a target of adding 42.5 million customers by the end of this month.
https://www.businesstoday.in/current/economy-politics/india-is-consuming-lpg-like-never-before-what-is-driving-this-phenomenon/story/324554.html
Man, do they need it. The air pollution is BAD over there.
Not even remotely survivable—
Solar to power a Nation.
Germany has installed more solar power per capita than any other nation. Looking at where Germany is now gives us a view of where the United States could be in 10 years time..
Germany has a peak electricity consumption of 80Gw and an installed solar capacity of 46Gw.
https://www.energy-charts.de/power_inst.htm
Does Germany get half of it’s electricity during the day from solar?
https://www.energy-charts.de/energy_pie.htm
Many people will be surprised that an installed capacity of half the maximum demand, solar only produces 5% of Germany’s electricity needs.
Between 5pm and 7am wind will make up some of the shortfall, but wind power is extremely erratic. Integrity of supply remains with burning coal and gas.
https://www.energy-charts.de/power.htm
Even if Germany increase solar installation 10 fold, winter production is dismal.
https://carboncounter.wordpress.com/2015/08/11/germany-will-never-run-on-solar-power-here-is-why/
Germany’s gas consumption has never been so high.
https://www.bp.com/content/dam/bp/business-sites/en/global/corporate/pdfs/energy-economics/statistical-review/bp-stats-review-2018-full-report.pdf
It is not working is it?
Hugo -“Germany has installed more solar power per capita than any other nation. Looking at where Germany is now gives us a view of where the United States could be in 10 years time..”
Not quite. USA solar potential is huge compared to Germany. We put most of our solar in places that are extremely sunny. Germany solar strength is equivalent to the worse state in the lower 48.
Anyone who a lot of solar in 10 yrs will be a happy camper.
Thanks Hugo. Your second link shows German renewables at 45.8% of production. Excellent! This is up 13% from 2018. Bring it on 🙂
John
Climate change is not driven by percentages. It is driven by CO2 and other greenhouse gas emissions.
The graphs do not show natural gas consumption nor oil consumption either
https://www.cleanenergywire.org/news/significant-drop-energy-use-pushes-down-german-emissions-2018
Only 14% of Germany’s energy comes from renewable sources and half of that is from burning stuff.
From above. Argentina. Vaca Muerta shale gas. Production rising via locally declared price.
Life expectancy in Argentina is hard to pin down. I found several different numbers. They’re all in the upper 70s. Which is pretty much what it is for the US, so posturing that it is a country that is backwards and primitive in daring to sneer at NYMEX doesn’t really hold water when people live there as long as anywhere else.
Bolivia produces gas. Bolivia’s gas production is falling. Argentina is likely going to provide them what they can’t produce. There is also apparently preparation underway for Argentina to provide quite a lot of South America with fracked gas through pipelines. This does not bode well for US LNG exports.
A tad surprising that YPF knows how to frack, but all of the projections for what will be produced are focused on gas. Not even NGLs or condensate or anything like that you could pretend is oil. Even Exxon projects their output as BOE.
Asian business sentiment is down at lows due to the trade tariffs and the rise in interest rates
Reuters charts: https://pbs.twimg.com/media/D2FlbwoUwAA2v99.jpg
Coal and LNG prices
https://pbs.twimg.com/media/D2FldU0VAAACUGd.png
A quick look at Argentina. JODI Data figures for crude oil including lease condensate
According to the EIA international statistics Argentina also produces 100 kb/day of NGPLs. And 80 kb/day of other liquids which I guess are biofuels/ethanol.
The FT Argentina article above looks like it restricts access. My free access must have run out. I can’t get back to it. Googling the title found this, which looks mostly the same:
http://noticiasagricolas.com.ar/?p=15036 It auto translated.
Quoting what looks like 15ish m cu meters/day for this year. That doesn’t have the instinctive understanding barrels/day provides. It appears to be 15% of Argentina’s consumption. Lots of cubic ft to meters conversion and total billions per year vs per day so the numbers are fuzzy. The number is 11 m cu ft/day now and expecting 17 by end of this year. That’s growth, but expecting words mean nothing. The phrasing is . . . in low consumption season, they will have surplus.
There is another quote about oil but trivial 50K bpd. Probably can double or triple that after they decide NGLs are actually oil and mix it in with crude.
Oh, and thematically there is talk of 60% interest rates. But they still are getting out 15% of domestic consumption. That’s another parameter a govt can ignore if they need the oil or gas. Just make it happen. Don’t let numbers on a screen obstruct.
Big draw this week, crude oil imports from Venezuela are said to be down to zero
U.S. Petroleum Balance Sheet
Inventories: Crude: -9.6, Gasoline: -4.6, Distillate: -4.1
http://ir.eia.gov/wpsr/overview.pdf
Saxo Bank chart summary
https://pbs.twimg.com/media/D2G-5uAXgAAVnAi.png
Oilytics https://pbs.twimg.com/media/D2HWhFcWsAEUSxk.jpg
https://pbs.twimg.com/media/D2HYcIhWkAENlEe.jpg
Kazakhstan
2019-03-19 (S&P Platts Global) The resignation of Kazakhstan’s first president Nursultan Nazarbayev marks 30 years of an energy policy that has seen Kazakhstan open up to international oil company investment and triple its oil output to nearly 2 million b/d.
Oil accounted for 54% of Kazakhstan’s export revenues and 36% of tax revenues in 2017, according to the IMF.
With the world’s 12th largest proved reserves – around 30 billion barrels – oil output has more than tripled since 1991, to 1.9 million b/d. Three fields account for over two thirds of this: Kashagan – on stream since 2016 – has touched its initial target of 370,000 b/d, Tengiz produced 625,000 b/d last year and is set to reach 900,000 b/d in 2022, and Karachaganak produced around 230,000 b/d. Platts Analytics expects output to exceed 2.2 million b/d by 2025 and 2.5 million b/d by 2030. Other fields are declining; onshore state oil producer KazMunaiGaz EP reported a 2% drop in crude output in 2017 to some 250,000 b/d.
Kazakhstan accounts for nearly 30% of global uranium output, through London-listed Kazatomprom, with production of 23,000 mt in 2017.
https://www.spglobal.com/platts/en/market-insights/latest-news/oil/032019-factbox-kazakh-leaders-departure-marks-commodity-sector-transformation
There’s a lot of maintenance/upgrades planned for this year
(OPEC MOMR) Oil production will be halted in the Kashagan field for 45 days from 14 April, in Tangiz from 1 August for 42 days and in Karachaganak for 28 days from 15 September.
The chart is mostly from the EIA International statistics but the last few months are averages taken from the Ministry of Energy daily production figures.
Oil Keeps Pushing Higher as OPEC Output Drops for a Fourth Month
The 14 OPEC members pumped 295,000 barrels less of oil a day in March than in February, restricting total output to 30.385 million barrels. Saudi Arabia cut production to a four-year low of 9.82 million barrels a day, according to a Bloomberg survey of officials, analysts and ship-tracking data.
Question: Has Saudi Arabia peaked?