The latest OPEC Monthly Oil Market Report is out with production numbers for December 2017. All data is in thousand barrels per day.
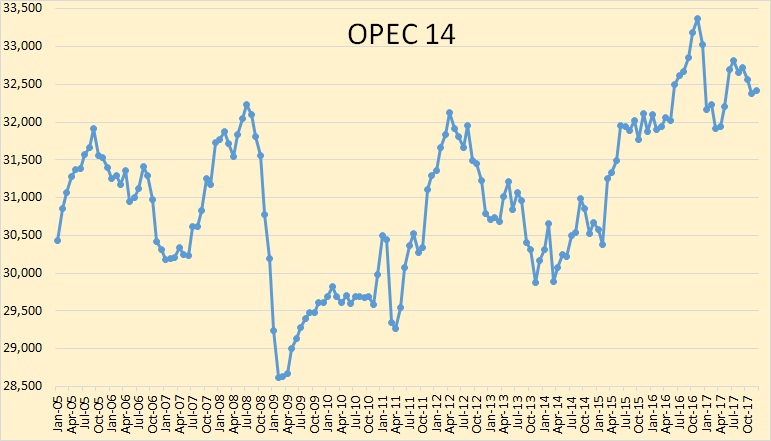
Total OPEC crude only production was up by 42,400 barrels per day in December. However, that was after November production was revised downward by 75,000 bpd. So OPEC production was actually down 33,000 bpd from what was reported last month.
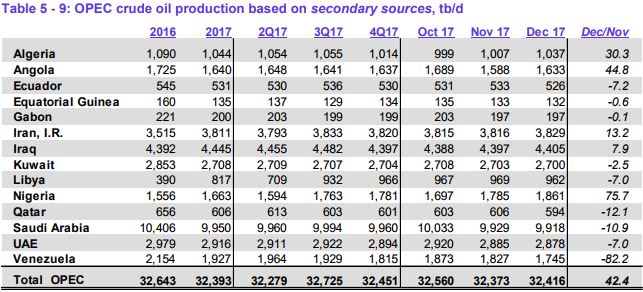
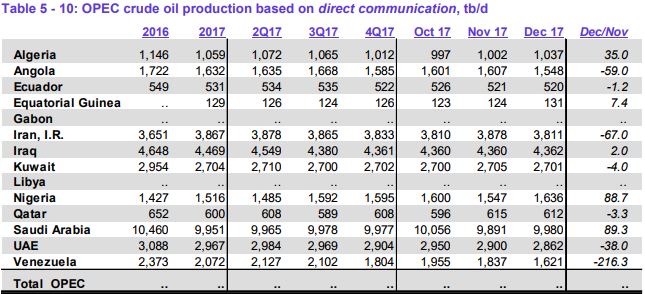
I have posted OPEC production according to “secondary sources” as well as OPEC production based on “direct communication” in order to show what Venezuela said they were producing when called by the editors of the MOMR. More about that below Venezuela’s production chart.
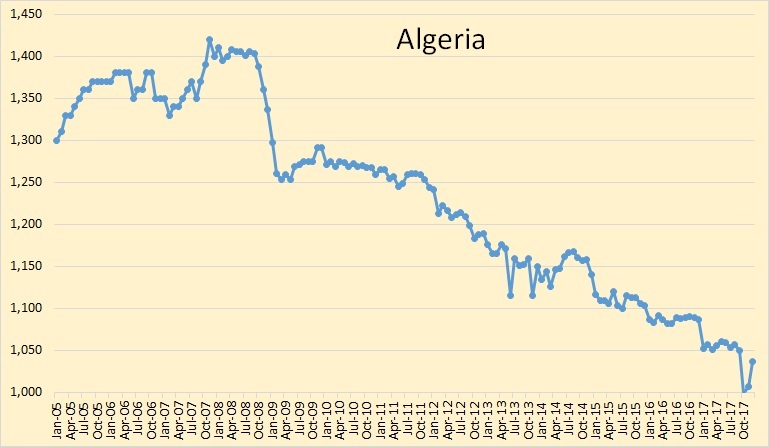
Algeria was up 30,000 bpd in December but the downward trend continues.
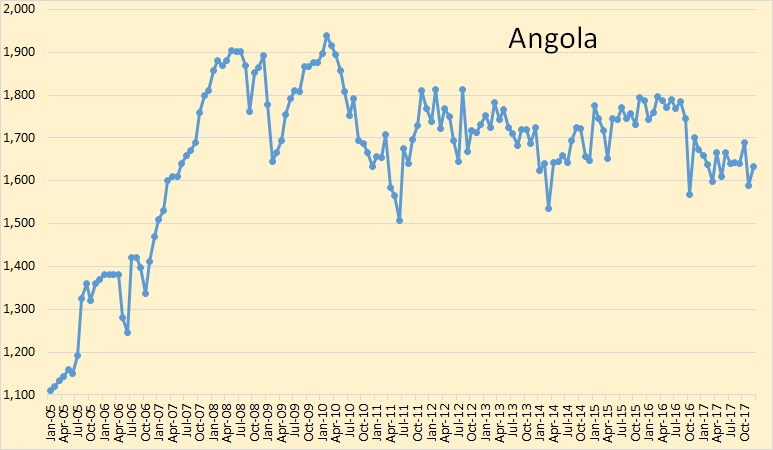
Angola’s crude oil production is holding steady.
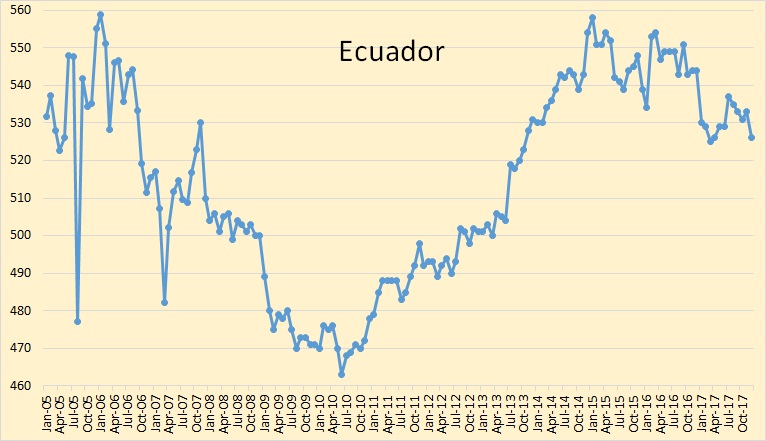
Ecuador’s latest peak was in 2015 and they have been in slow decline since then.
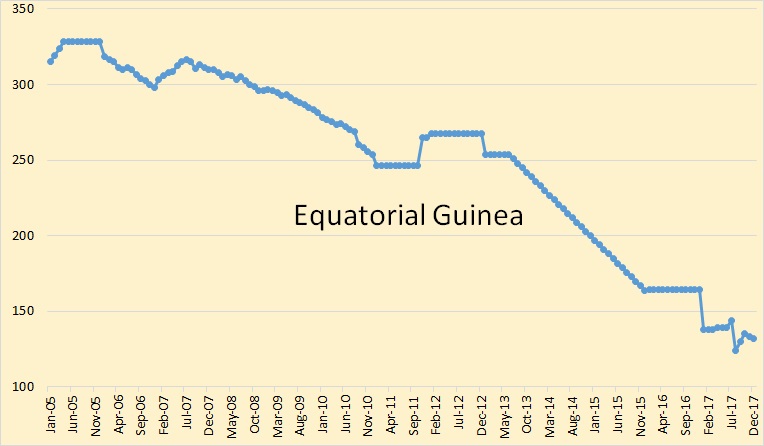
Production out of Equatoria Guinea is in slow decline though it is too low to make much difference in overall OPEC production.
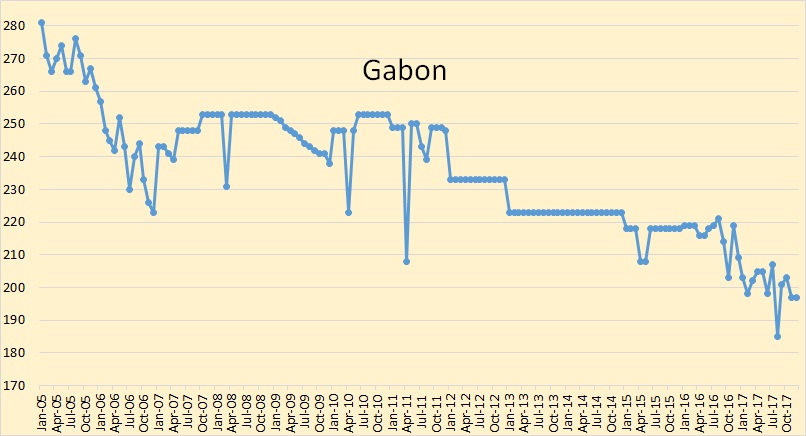
Gabon is also in slow decline.
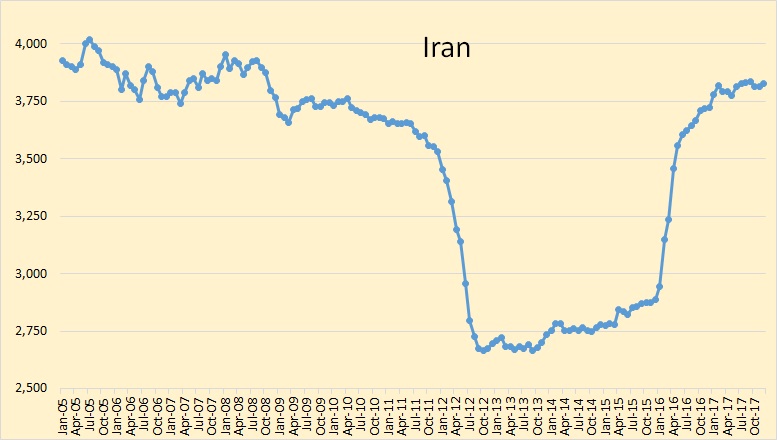
Iran is producing flat out and perhaps because of their recent sanctions they feel no need to comply with any OPEC cuts in production.
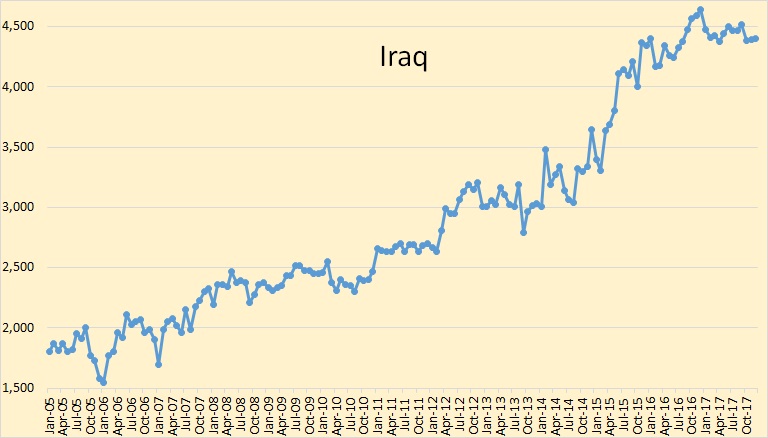
Iraqi crude oil production is holding steady at near their all time high.
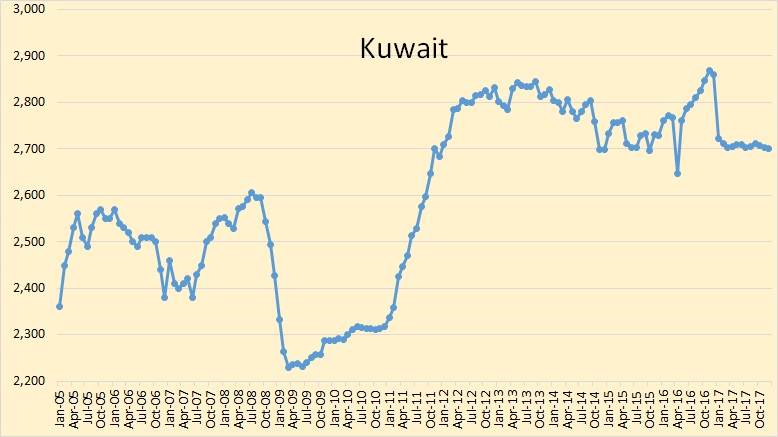
Kuwaiti crude oil has held remarkably steady for one year now.
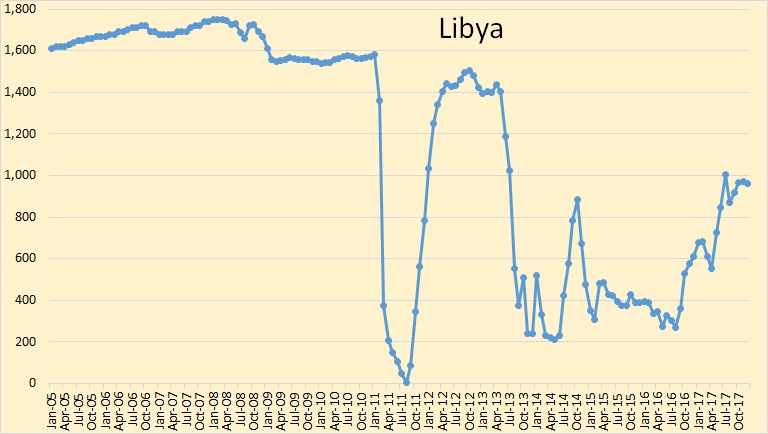
Libyan crude production has held steady for six months. They still have serious political problems.
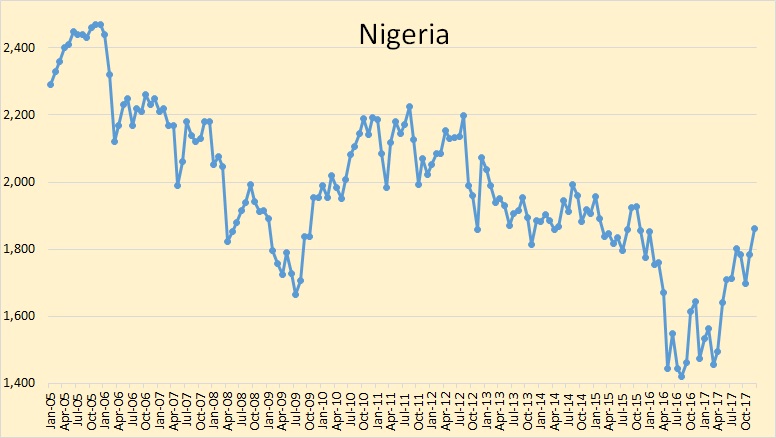
Nigerian crude production increased by 75,700 barrels per day in December.
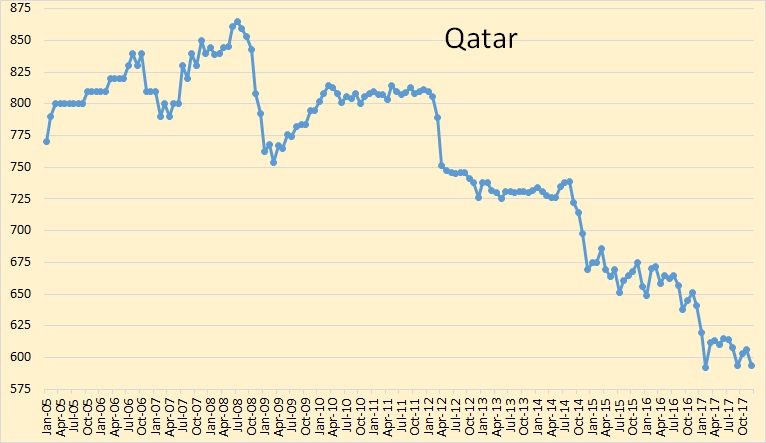
Qatar continues its slow decline.
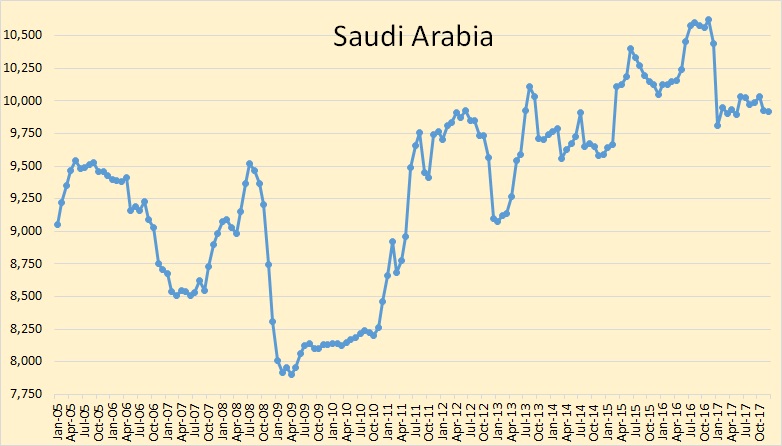
Saudi Arabian crude production was down 11,000 bpd in December but that was after November production was revised down by 67,000 bpd.
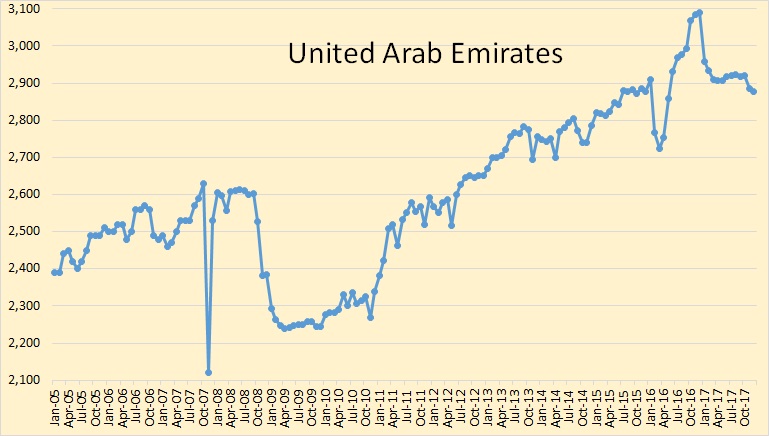
UAE crude production was down only slightly in December.
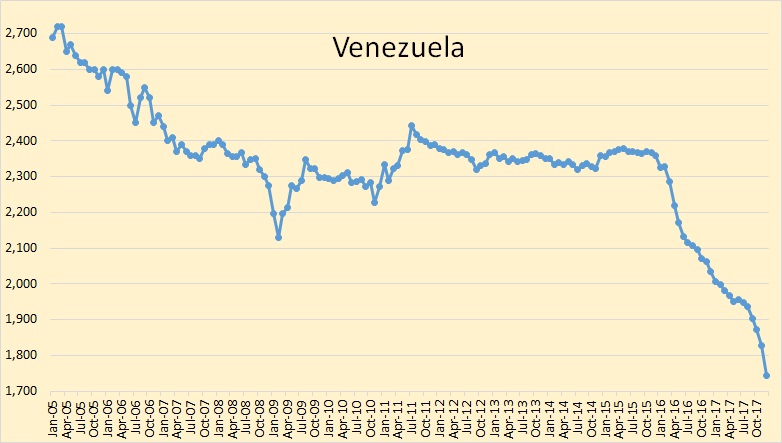
The collapse of Venezuelan crude production is obviously increasing. Their production, according to “secondary sources” dropped over 82,000 barrels per day in December. But according to “direct communication” their production was down far more. When called by the OPEC MOMR they said their production was down a whopping 216,000 bpd to 1,621,000 barrels per day. However:…
Venezuela oil production recovering, near 1.9 mln bpd, minister says
CARACAS (Reuters) – Venezuela’s oil production has increased to near 1.9 million barrels per day (bpd) after hitting a historic low last year, according to Manuel Quevedo, oil minister and head of state oil firm PDVSA [PDVSA.UL], who vowed 2018 will see output rise to more than 2.4 million bpd.
And if you believe that then I have a bridge I would like to sell you.
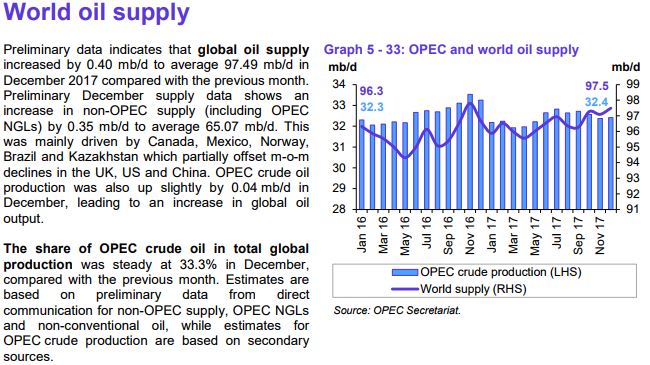
World oil supply here is total liquids and based on “direct communication” which I think is unreliable. However, it is the best we have at the moment.
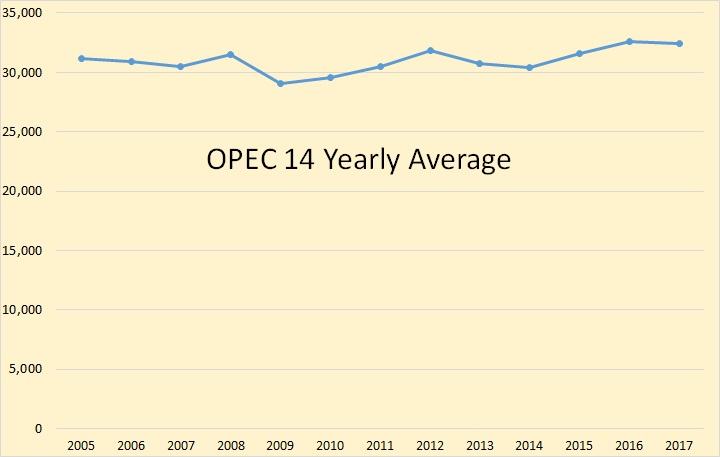
The above zero-based chart gives us a better view of what OPEC crude only production has done since 2005. Since then their total production has been up 1,241,000 barrels per day. That is just under 4% or, on a yearly average, that is one-third of one percent per year.
The lions share of the increase in oil production since 2005 has come from Non-OPEC countries, primarily the USA and Russia.
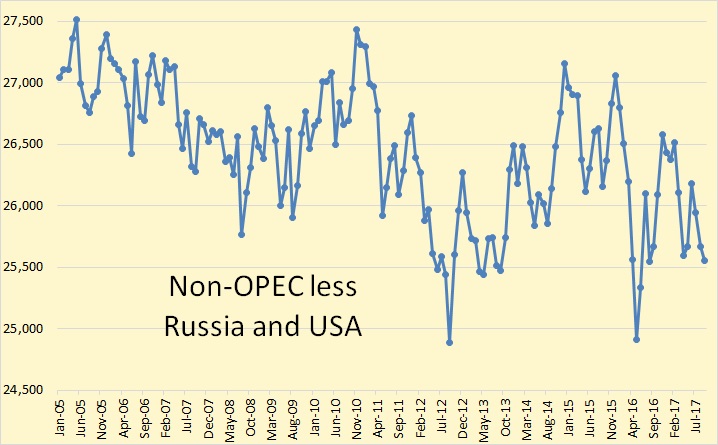
The data for this chart and the one below is from the EIA and is through September 2017.
Non-OPEC less Russia and the USA, yearly average, is down 1,142,000 barrels per day or .35% per year since 2005. World oil production, less Russia and the USA, has been almost flat since 2005, up less than 100,000 barrels per day.
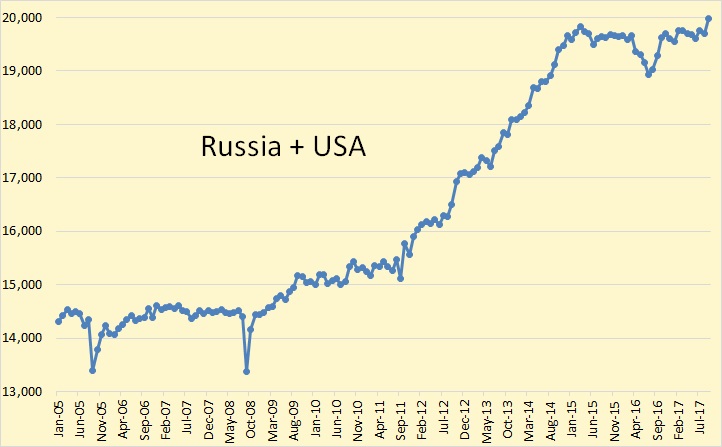
Here is where almost all the crude oil production gain comes from, Russia and the USA. Russia+USA annual average production is up 5,495,000 barrels per day since 2005. That is 38.62% or 3.22% per year.
159 responses to “OPEC December Oil Production”
The interesting question over the next couple of years is ‘how much spare capacity does OPEC actually have?’ Is the production cut intended to avoid revealing a lack of spare capacity?
I expect OPEC production to be flat to slightly down over the next two years. They have little to no spare capacity. There was a burst of new production in the last quarter of 2016 when each country was positioning for “cuts”. Most of this increase came from delaying annual maintenance on fields.
My guess is flat to slightly up, much depends on oil prices, with a rise in oil prices to $85/b or more over the next two years there might be a slight increase in OPEC output, but whether decline in Venezuela, Libya, and Nigeria continues and whether those declines can be offset by increased Saudi and Iraqi output is a big question mark.
Flat output is the better guess in my opinion and if OPEC output goes down or up the 12 month average output is likely to be within 500 kb/d of the 2017 annual output estimate (32,400 kb/d), in my opinion for 2019 average crude output (as reported by OPEC in the secondary sources chart).
So the only large increases are projected to come from imaginary sources from Venezuela and the EIA. At least, the EIA has finally found a country to compare imaginary numbers with.
Hi GuyM,
My guess is that Russia, Brazil, US, and Canada will all increase output from 2018 to 2022, after that I expect a peak in World output from 2023-2027 (possibly an undulating plateau for those years). Could be sooner or later by 5 years as much is unknown, call it (2025+/-5).
I agree that EIA forecasts are too optimistic (AEO 2017) and it is very doubtful we will see increases in Venezuelan output in the next 5 years.
Agree with all.
My guess is that Russia, Brazil, US, and Canada will all increase output from 2018 to 2022,…
No, no, no, I cannot agree with that at all. These four countries may indeed increase production in 2018 and possibly 2019, but not all four after that. Not even two of the four after that. Total production from those four countries will begin to decline no later than late 2019.
The EIA doesn’t report Brazi anymore but the total of those other three countries have been on a bumpy plateau for three years. Not likely to increase very much anyway soon.
Hi Ron,
I stated that incorrectly, my guess is that the total output of those 4 nations will increase, Russian output might be relatively flat (slight increase to 2020 and then a slight decrease until 2025).
I expect oil prices will be higher so the 150 kb/d increase in annual output from Jan 2015 to Sept 2017 (slope of trendline) will become steeper with higher oil prices, rising to 500+/-100 kb/d for the annual rate of increase in output from 2018-2020, maybe falling to 300 +/-100 kb/d from 2020-2022.
The price where oil supply and demand are in balance (stock draws near zero) is difficult to predict. It might be $110/b or it might be $150/b, difficult to guess.
Also when oil prices were high (2010-2014), Russian, US, and Canadian C+C increased at an annual rate of 1375 kb/d each year. So my 500 kb/d guess is fairly conservative (36% of 2011-2014 annual rate of increase).
Note that my 500 kb/d annual increase estimate includes Brazil as well (I cannot locate decent data on Brazil for C+C, IEA includes all liquids and BP includes NGL).
Dennis, we are going to have to agree to disagree. Our difference is based on what controls future oil production. You believe future production will be based on price, or perhaps 90% on price and 10% on supply. I believe future oil production will be based primarily on supply. Or perhaps 90% on supply and 10% on price.
But you are exactly right on one count. The price of oil is destined to rise. As supply declines the price will rise. But that will not help a lot. As the saying goes, “You can’t get blood from a turnip.”
I’ve wondered how price is going to stimulate more production if the supplies aren’t there.
Hi Boomer II,
There is oil in the ground, how much of it is produced depends on the profitability to do so, higher prices, ceteris paribus means higher profits so more of the resource is produced at a higher price than at a lower price.
Supply is the amount that is produced, reserves and/or resources are not the same as “supplies”.
But Ron said this. And it is more my view.
“You believe future production will be based on price, or perhaps 90% on price and 10% on supply. I believe future oil production will be based primarily on supply.”
I think we are seeing depleting resources that will make getting more oil from those areas hard no matter what the price.
And here’s an example where price may not be the determining factor.
Let’s say getting oil out of the ground means using scarce water, or polluting a fishing area, or causing earthquakes. And stakeholders affected by those developments say, “No drilling here.”
Rising oil prices do not necessarily mean more oil will be produced.
Hi Boomer,
I agree. For those areas where oil can be produced from a technical perspective, only the oil that is profitable to produce will be produced, for a given reservoir where 1 Gb of technically recoverable resouces exist, only those resources that can be recovered profitably(economically recoverable resouces) will be extracted.
Listen to the comments of shallow sand and mike. Oil price matters for decisions to drill or not to drill.
“Listen to the comments of shallow sand and mike. Oil price matters for decisions to drill or not to drill.”
I pay very close attention to them.
But your interpretation of their comments is different than mine. I think they are saying that drilling without regard to price is poor business, not that it isn’t happening.
Boomer, thank you ! I actually agree with you that the “price” of oil and gas will ultimately become less of a determining factor in our hydrocarbon future than is being suggested here.
Technically recoverable reserves are wild guess that may not be recoverable at any price; people put far too much faith in guesses. The USGS and EIA, for instance, are government entities whose job it is to make guesses. It does not mean they are right.
Unconventional shaley resource beds to frac and cram sand into are all we have left in America, short of ultra-deep offshore resources that will require much higher prices. Shale resources are depleting, as you suggest, at an alarming rate now because, essentially, of greed and poor long term planning.
World hydrocarbon resources are in the hands of nationalized entities who must make business and economic decisions on behalf of their citizenry and whose production plays a primary role in its society.
Not so in the US where our hydrocarbon resources are in the hands of private enterprise and those entities must be profitable to succeed. I am remiss to say I absolutely do NOT understand why people do not get that.
Regarding the shale phenomena, it is not profitable and it is not succeeding. Because it is “there,” and still growing, does not mean it is succeeding. I think I can make a case that shale oil was not going to succeed even at $100 oil prices and in fact, it did not. It is a mistake to think that a business model to extract shale resources that involves credit and ensuing debt is sustainable. It is not. It is a mistake to believe what has happened in the past will continue to happen in the future; for instance that the debt bubble will never pop and the shale industry will simply keep on keeping on using OPM.
And finally, I think you are also right; there are a number of extenuating circumstances involved in shale growth that people ignore. Water, for instance. A very angry very anti-oil public, politics; the decade old explosion of shale oil and shale gas, using credit, has now left us with so much of the damn stuff we can’t do anything with it…other than export it, flare it, or shut it in without takeaway capacity, or stupidly spend $4B of OPM on DUCs’ that will sit there and earn nothing. Demand(!), notice how demand always gets left out of the higher price begets higher production theory. The world simply cannot cope with $100 oil, so it won’t. Technology. People put way too much faith in that BS; the oil business is not like the tech industry; stage frac’ing and HZ drilling is old stuff. What is happening now, for the most part, is merely a natural extension of old methods to squeeze oil out of really shitty rock.
Personally, I think the shale industry in America is going to get a big wake up call in exactly 3 years. We are at the end of the fossil fuel era and have a decade or so of easy, fairly inexpensive stuff to use, then it is Katy bar the door.
Hi Boomer and Mike,
I am talking about oil resources in general at the World level.
I believe I said that oil needs to be profitable in order to be produced in the long term.
Quick question for you both.
For a given oil field would you expect that profits would be higher if the price of oil doubled?
If the answer is yes, would you expect for that given field that more oil or less oil would be produced if the oil price was 2 times higher, assuming for simplicity that the cost to produce the oil rises by only 50% or less?
From another perspective, why did US output decrease when the price of oil fell from $110/b to $40/b?
On the exports, we export the lighter stuff that we don’t have the refinery capacity to refine efficiently and import oil with lower API gravity which is better suited to Gulf Coast refineries (where the bulk of US refinery capacity exists.)
Free trade (on a level playing field) is smart economic policy. It tends to benefit the US economy as a whole.
Traditionally free trade was the Republican orthodoxy for about 68 years. Though I am not a Republican, this is one of their bedrock policies that I am in full agreement with.
Also note, by technically recoverable resources, I am talking about the estimate a petroleum engineer would make for a major oil company for a given oil field, not USGS estimates.
I think we are talking past each other here.
I am not suggesting that for the World oil supply that higher oil prices means higher World supply.
It depends on the available resources(geology), existing technology, and oil price (economics).
For given levels of resources and technology, lower oil prices generally will result in lower levels of oil production and higher oil prices, higher levels of output (relative to output at the lower price level).
I don’t agree with Ron that one can put a 90%, 10% split or whatever on it, all of these factors are important.
Consider F=ma, which is more important in determining F, is it m or a ?
I don’t think that question can be answered and the best answer is that there is no answer.
But if one wanted to speculate one could say a 50/50 split.
Many factors affect oil output, such as politics, geology, technology, and economics (this list is no doubt incomplete). We have no way of even guessing at which of these is the most important, but I would guess each is equally important, maybe 25% for each, and if there is some “other” category for stuff I have forgotten, call it 20% for the first 4 categories and 20% for “other” factors.
Dennis, US shale has disrupted the entire world oil order and because of its affect on prices it belongs in any discussion about the world.
You have said oil needs to be profitable (in the US) but you have also said, repeatedly, that higher oil prices will make it profitable. I do not agree with your higher oil price theories and that is the automatic answer to the worlds scarcity problems.
In existing ‘fields’ higher oil prices will not necessarily increase production, no. Not from existing wells. The increased revenue from higher prices would have to be used to drill wells within that field that will exponentially increase the rate of depletion. That’s not a gimme, not in my mind. In this example, I might side with Ron; there are physical limitations to consider.
“From another perspective, why did US output decrease when the price of oil fell from $110/b to $40/b?”
Because $40 dollar oil allowed the US shale industry only to service its long term debt. If it’s breakeven prices are actually what the shale industry says, it would have kept drilling wells at $40. As I have said to you repeatedly, the shale industry is not the master of its universe, lenders with OPM are. The 18 months the rig count collapsed after oil prices collapsed, resulting in production collapsing, is an indication of how capital intensive that industry is. Wall Street re-grouped, threw more money at the shale industry to save its ass, and shale oil started to grow again. Its been growing using OPM. The price of oil has increased only within the past 3-4 months.
In the shale oil patch, prices mean very little…low interest credit, and an abundance of OPM is ALL that matters.
Lastly, your theory of “free trade” implies it is OK to export our remaining resources away. Why is that? Do you think we have enough of it and won’t need it back in 15 years? Or do you simply want to get rid of all of it as fast as possible so we can get on with getting away from the stuff completely. You have said, often, you want off fossil fuels ASAP. If we have limited resources left in America isn’t it the American thing to do to conserve those resources? And by the way, there is nothing free anymore about free trade; the shale oil industry for instance is competing with the entire rest of the world using money from a messed up monetary system in America that, like you, seems to not care too much about debt. If left to its own financial resources the shale oil industry would not be producing the same amount of oil as Ecuador.
Hi Mike,
I believe an oil producer should be free to sell their oil to whoever they choose.
It’s not my theory of free trade it’s David Ricardo’s.
I don’t think higher prices result in higher output from existing wells, I believe it results in a higher rate of well completion.
So you don’t believe in free trade?
It has been a cornerstone of US international policy for a long time.
After oil prices decreased, service costs decreased, drilling was focused on sweet spots and average new well productivity increased, LTO output has indeed increased and I agree that seems to be a bad idea.
In a capitalist system, it is up to individual businesses how to best allocate their capital.
Debt is fine if it is not overdone.
Well run LTO companies like EOG, had positive net income in 2017 (first 3 quarters).
https://finance.yahoo.com/quote/EOG/financials?p=EOG
Pioneer has also had cumulative positive net income for the past 4 quarters.
https://finance.yahoo.com/quote/PXD/
Dennis, America is the largest hydrocarbon consuming nation in the world by a wide margin. Exporting our remaining, incredibly expensive, here today, gone tomorrow hydrocarbon resources away, extracted with borrowed capital, sold at big discounts to world prices, while flaring associated gas in the process, is stupid. Its not good for America. If its not usable oil we are exporting, lets build refineries that will render it useable.
There might be only two reasons for someone to think that selling America’s oil, now, so we can buy it back for 3 times the price, later, is good: a) they believe we have 100 years of the stuff laying around or, b) they want us to run out, completely, ASAP, so we can all start driving Flintstone cars.
You’ve picked two of the largest shale oil producers in the world as an example of profitability. Good for you. That makes up for the six years they weren’t. How are they doing with debt? Can they keep growing shale oil production according to your models, or might they eventually run out of all those drillable locations? What about the rest of the shale oil industry? What if prices start back down again because of another round of LTO oversupply?
I believe in free trade. The only thing free about the “free trade” example you used is that the US shale oil industry does not the finding costs the rest of the world has because it is using borrowed money. The rest of the world does not think of it as “fair” trade, does it?
Its hard to follow your position on things, Dennis; is there a flow chart or something you can send me?
Hi Mike,
If the nation decides free trade is a bad idea, laws can be passed to make it so.
Generally I believe businesses should be free from interference from government unless their products (or their production process) do harm to others and in that case those businesses should be subject to government regulation.
Fossil fuels should be regulated due to the carbon pollution they emit, it would be best to do this through a carbon tax.
Note that such a tax would tend to conserve fossil fuel resources.
The US government could choose to join OPEC and regulate US oil output levels, as the RRC once did for Texas.
My point was very simple, for any given oil field, profits will be higher, (or losses will be lower if oil prices are higher).
Do you dispute that?
Yes many LTO producers lost money when oil prices fell.
This is simply the flip side of what I claim above.
If oil prices are lower for any given oil field, losses will be higher or profits will be lower.
This applies to all oil producers majors, LTO, and stripper wells.
Hi Mike,
You believe in free trade, but you do not think US oil producers should be able to export the oil they produce.
Do I have that right?
Also you think LTO producers produce too much oil.
I agree, but in a market economy I don’t see a solution short of government interference.
Not the kind of solution most conservatives would prefer.
What do you suggest?
Ron,
We have very different estimates of recoverable resources, but whatever the “correct” estimate of ultimately recoverable resources is more will tend to be produced at $100/b (2016$) than at $50/b, wouldn’t you agree?
Your estimate of conventional C+C URR might be 2000 Gb or less, mine is 2700 Gb (I exclude both extra heavy oil and tight oil from the “conventional” category, but I include polar oil and deep water offshore oil).
Note however that the 2700 Gb estimate assumes high oil prices that remain high long term.
If EVs become ubiquitous (perhaps by 2050), then oil prices may fall and far less of the oil resource will be extracted.
Also we are not very far apart, you have now revised your “peak oil” estimate to 2017 to 2020, and I suggest 2020-2030, best guess 2025 with conventional resources (C+C) 2700+/-300 Gb.
A Hubbert linearization for World conventional suggests 2400 Gb (those estimates tend to be on the low side), USGS estimates about 3000 Gb.
You said above that you believe future oil production will be based primarily on supply,
I would say that the oil produced is supply and thus would agree.
Oil reserves are based on geology, technology, and oil price, geology and technology change relatively slowly (especially in a mature industry like oil where most innovations have been thought of), prices fluctuate a lot over relatively short periods of time and have a big effect on profitability and investment over the short term, especially onshore, so yes I do focus on price.
We saw the effects of a drop in price from 2015-2017 (investment decreased), likewise we saw how rapidly production can rise with sustained high oil prices from 2011 to 2014.
We agree that oil will peak regardless of oil price at some point, I think it will be 5-10 years later than you, so we simply disagree on the timing.
Based on my recent reading on well spacing in the Permian, I am going to go with Ron on this one. Permian production is vastly over stated. US may increase some, but mostly they will be trying to keep up production with increasingly higher capex. Russia will just keep trying to maintain, as it isn’t a real capitalistic country. Canada, not sure, probably higher, but not by a great deal. Declines are now the great factor.
Guym,
Texas output may be overestimated by the EIA by about 3% in recent months, it is not clear if this is in the Permian (at least to me).
Ron thinks flat to down, I think flat to up.
My guess is World output at 83 Mb/d by 2022, flat output to 2027 and then decline,
Years +/-2 and output +/- 2 Mb/d as there are multiple factors which are difficult to predict.
Venezuela’s discrepancy between official (reported to OPEC) and secondary sources is rumored to be a gimmick by new military management, which under reported production so they could “increase it” in January.
This is easily accomplished by undercounting oil in field storage. An increase can be reported in January moving barrels they hid into the sales stream. I also heard the military gave orders to open up chokes and ignore water and sand production problems. This will give a small surge which will see production collapse even faster in subsequent months.
Maduro seems to be running forward deeper into a communist control structure, repression is discussed on tv openly (for example, he called for the investigation and arrest of Catholic bishops who criticize the regime because people are starving).
Three days ago the dictatorship sent 500 military to supposedly capture a small insurgent group led by Oscar Perez. Six men and a woman were hiding in a small house in El Junquito, a wooded hilly area close to Caracas, the regime surrounded the house, and when the guys inside were negotiating their surrender the military started spraying the house with what appears to be heavy machine gun fire and RPGs. While this was going on the guys inside the house made short videos explaining they weren’t being allowed to surrender, saying goodbye to their families, etc. eventually all seven were killed. The regime is refusing the families the ability to see the corpses. During the shootout the leader of a regime execution squad (they use civilian thugs to murder people they think are being unruly) was shot and killed. What’s not clear is why an execution squad from downtown Caracas was sent all the way to El Junquito when they already had 500 men surrounding the house. So this event is shrouded in mistery, and the resistance has a new set of heroes. Hopefully we will find out more about the Junquito massacre in the future.
I wonder as to what piece(s) of information makes you claim that countries such as KSA, Kuwait, UAE, Iraq & Iran are pumping at (or near) capacity?
Their long-term production profiles (along with Russia) suggest that they have substantial room for growth (if and when global industry conditions allow for it)
As for all other producers, I agree with peak-oilers, in that they are clearly marginal which require at least one of two factors in order to increase or even maintain their production levels: a) an extremely high-price, and b) extremely loose monetary conditions (US & Canada)
I wasn’t referring to long-term trends, I was looking at the short-term burst in production in the last quarter of 2016. And I thought I explained that. Spare capacity is what they can produce right now, not in the long-term future.
The countries you named may indeed increase production in the long-term future. Though I seriously doubt it. Though my argument had nothing to do with their long-term trend. Spare capacity is how much they can increase production in the next 30 days and hold for 90 days.
Of course, any of those countries could just do no maintenance for 30 days, and none for the next 90 days after that. However, they would eventually have to shut even more wells down for maintenance. That would cause a sudden drop in production and just make matters worse.
Anyway, look at the long-term trend of total OPEC production. That profile increases, on average, one third of one percent per year. What that means is that any long-term increase in production from the countries you named are likely to be offset by long-term decline from all the other OPEC countries.
The decline in the already declining countries will continue. However the long-term increase in the other countries must, sooner or later, turn from a long-term increase to a long-term decline.
In the short-term (and what you are referring to is extremely short-term) you are definitely correct, there’s no way any country on the planet can increase production in any substantial way.
But on the long-term side of the equation, what makes me believe that these 5 or 6 countries have significant potential for growth is a ton of circumstantial evidence. First of all, these countries have been steadily producing massive amounts of oil for decades on end. Secondly, these countries seem to have a strategy for the very long-haul as they rely on oil production for a massive chunk of their FX income. Third, these exact same countries seem to be in they eye of the storm for just about all and sundry geopolitical crises. In other words, these countries form the “strategic ellipse”
https://energeopolitics.com/category/strategic-energy-ellipse/#jp-carousel-932
First of all, these countries have been steadily producing massive amounts of oil for decades on end.
Well, what the hell does that mean? Were you of the opinion that producing massive amounts of oil for decades past means that they have a source of oil that never peaks? Or does it mean that their very tired old fields are reaching the end of their days?
Aging giant fields, not new discoveries are the key to future oil supply
Now, here’s the key insight from the study. An evaluation of giant fields by date of peak shows that new technologies applied to those fields have kept their production higher for longer only to lead to more rapid declines later. As the world’s giant fields continue to age and more start to decline, we can therefore expect the annual decline in their rate of production to worsen. Land-based and offshore giants that went into decline in the last decade showed annual production declines on average above 10 percent.
Then they started creaming!
These countries all depend on very old supergiant oil fields for the lions share of their production. Most of these fields went into decline in the first decade of this century. Then they discovered that they could drill massive amounts of infill wells with laterals that just skimmed the top of the reservoir. The result was that they slowed the decline of these old fields from 10 percent down to 2 to 3 percent. It’s called creaming. They massively decreased their decline rate while dramatically increasing their depletion rate. But when they start to decline in earnest again, the decline rate will be astronomical.
Yes indeed Ron and when Aramco publishes their audited reserves and production figures prior to ipo we will be able to observe the water cut of Northern Ghawar first hand. Lol
What are the chances of them obfuscating the reports – how will the SEC monitor their honesty? (I’m not trying to be stupid here).
Third party audit
Where is new Russian production going to come from? What price are you assuming?
Fernando,
It is not clear who you are asking. Maybe the group?
Russia cut back output by about 250 kb/d from 4Q2016 to 4Q2017 based on Russian Energy Ministry data (assuming 7.3 barrels per tonne).
Do you believe there have not been any production “cuts” in Russia,
AlexS who used to post here had suggested Russian output could be maintained for quite a long time.
Note also that I claim that the sum of US, Russian, Brazilian and Canadian output will increase.
The report linked below suggests a small increase in Russian output to 2020 followed by a small decline through 2025 (see figure 12 on page 15 of the report).
https://www.oxfordenergy.org/wpcms/wp-content/uploads/2017/02/Russian-Oil-Production-Outlook-to-2020-OIES-Energy-Insight.pdf
Most of the output increase will be from US, Canada, and Brazil, probably about a 400-600 kb/d average annual rate of increase from 2018 to 2022, a peak in World output might be reached as early as 2020 or as late as 2027, potentially we could see an undulating plateau from 2020 to 2030, much will depend on oil prices and politics.
I assume oil prices will increase by $2/b each month on average from $60/b in Jan 2018 to $108/b (2016$) by Jan 2020 as oil supply will not keep up with oil demand and the stock draw will continue. At $108/b I expect supply and demand may balance, but that’s a guess, higher prices may be needed to balance supply and demand.
Dennis, Stavros wrote “Their long-term production profiles (along with Russia) suggest that they have substantial room for growth (if and when global industry conditions allow for it)”
I know a bit about Russia (worked studying their fields for 8 years), and I don’t see “substantial room for growth”. I seriously doubt they can offset the decline from existing wells AND increase production by say 1 mmbopd.
The problem I see is that the old giant fields have been drilled and infilled and had water injected for decades. There are areas where they can drill and frac horizontal wells, but I just don’t see those areas adding 500,000 BOPD year after year (that’s needed to offset the decline). So they need new conventional fields, say from East Siberia, which are very remote. Or they need to develop the gas/condensates from the reservoirs below the Cretaceous gas sands (which means they need to change their strategic gas marketing), or develop offshore oil in the Kara Sea, off Sakhalin, etc. and those developments take a bunch of time and high prices. So while I do see production holding steady, I don’t see an increase even to 11.5 mmbopd. It just doesn’t make sense to run so hard.
Thx Fernando.
I agree. They might be able to get back to 11 Mb/d, probably flatish output through 2025.
U.S. Petroleum Balance Sheet, Week Ending 1/12/2018
PDF file: http://ir.eia.gov/wpsr/overview.pdf
Saxo Banks chart https://pbs.twimg.com/media/DT1fn2mWkAAFsBI.jpg
Will be interesting to see US shale production in response to increasing frac hits, increasing costs, mounting debt wall. These are all legitimate issues which IEA seems to overlook when issuing rosy predictions. Three Stooges thought they could repair a hole in a pair of pants by cutting it out….same logic as IEA.
Yeah, it’s those items and more. The biggest they overlook is declines from production. The past two years, they have concentrated in sweet spots, to keep their chins above water. In doing so, they have miraculously brought production back up to 2015 highs, and not much more, although the EIA is reporting imaginary oil. Underneath all that production, wells are declining at a rapid rate. The biggest rates are what they drilled last year. Those wells will produce less than half of what they produced last year. So, how many wells would need to be completed to increase production over a million barrels in 2018? More than current capacity, that’s for sure.
Hi Guym,
I agree.
Although tight oil output has increased at an annual rate of close to 1000 kb/d over the past 12 months (Dec 2016 to Nov 2017), I doubt that rate of increase will continue, probably about half that unless oil prices rise more than I expect (and I expect we might get to $85/b by Jan 2019).
I’d say it’s a crap shoot as to whether it goes up, or down with about the same number of completions in 2018 as 2017. Ok, let’s say we have more completions, I still can’t say it will go up 500k barrels. While people place statistics on depletion rates, I haven’t seen a well, yet, that can comprehend statistics. As a matter of fact, they defy statistics.
There are 180k producing wells in Texas. There were about 5400 completions in 2017. That’s about 3% of total producing wells.
Guym,
I expect the number of completions will be higher in 2018. If I am wrong, my guess is likely to be too high.
My model continues to show $63 per barrel. But i probable need to plug in new data. Does anybody have an inflation index for industry costs? My guess is about 15% per year in recent months
IEA OMR January: https://www.iea.org/oilmarketreport/omrpublic/
IEA has raised their forecast for US supply growth in 2018, from 870 kb/d to 1.1 mb/d.
IEA continues to assume the market will balance for the year as a whole: “If OPEC countries plus their non-OPEC supporters maintain compliance then the market is likely to balance for the year as a whole with the first half in a modest surplus and the second half in a modest deficit.”
Ron is absolutely right about the creaming issue. Major oil producing countries, Saudi Arabia chief among them, are using technology to stave off production declines. These YouTube videos are a perfect example
of the extreme lengths being employed to continue production:
https://www.youtube.com/watch?v=axjEk8zDvy8
https://www.youtube.com/watch?v=C7MH9MhOpRk
These videos underscore how uniquely valuable oil is as an energy source and how no other substitute will ever come close to matching its utility.
When the decline kicks in, these technologies will ensure that the cliff will be steeper. While I believe we are living at the absolute peak of world production and that decline will kick in soon, I’m not so concerned about specific predictions. It will happen soon enough and when it does the impact will be severe.
I think of this problem in personal terms — my son was born in 2000. He will live to see a world of diminishing oil production (as well as sea level rise, resource conflicts, and many other problems). Does anyone doubt that by the time he is 30 (2030) world oil production will be in decline? Does anyone doubt by the time he is 50 (2050) the world will be a drastically different place than it is today? I have lived through the peak period. I cannot envision what comes after. I can only hope that my son finds a way through it.
“Does anyone doubt that by the time he is 30 (2030) world oil production will be in decline? Does anyone doubt by the time he is 50 (2050) the world will be a drastically different place than it is today?”
Perhaps.
But such sentiments were very common ten, fifteen years ago, and they were directed toward today, not 2030. So, yes, I do “doubt” it, but that’s not saying much, as it’s a subject I find interesting but useless to speculate about.
I’m checking in here for the first time in about 9 years. I’m an old-time peaker, who jumped ship in 2009 when it became clear the dire predictions of Campbell, Deffeyes, et al., were failing to materialize.
This doesn’t mean I think oil is infinite or anything. I do think our capacity to predict doom is much more circumscribed than our abilities to avoid it.
(I like the new editing feature on this site.)
I guess we just need to find something equivalent to the Bakken, Eagle Ford and Permian Wolfberry as soon as oil price hits $100 per barrel. Any ideas where we can find it?
Silicon Valley Observer,
Oil prices will increase and use of hybrids, plugin hybrids and EVs will increase as the cost of these newer technologies fall and the price of oil, natural gas and coal increase due to depletion.
In addition, coal and natural gas prices will increase while the cost of wind and solar continue to fall and much of the electricity produced by coal and natural gas may be replaced by wind and solar output, along with hydro, geothermal, pumped hydro, batteries, fuel cells, and vehicle to grid.
If these substitutes are adopted at the speed with which smartphone adoption occurred. We get a “fast” energy transition.
Also keep in mind that a lot of “energy” in fossil fuels is wasted as thermal losses (roughly 60%), much of this loss is eliminated using wind and solar and EVs (the combustion losses in steam turbines and internal combustion engines are eliminated).
In 2015 the World used about 11.5 Gtoe/year of fossil fuel, but roughly 4.6 Gtoe/year of useful energy was used with the rest wasted as heat of combustion (not used for heating purposes.)
Wind, solar, EVs and heat pumps (ground source in cold climates) cut energy use by 50% minimum.
Fast Energy Transition below, EVs, wind, solar, and heat pumps are adopted at a rate similar to smartphones.
I don’t see a fast transition like smart phones because the masses to be moved are so much more.
Smartphones where on production side only gadgets as many gadgets before, personal organizers, disk mans, Mp3 players … you get it.
Here it’s about building a multi trillion $ new energy infra structure, together with new mining and not yet developed tech (batteries need a few additional groundbreaking improvements only in the pipeline so far, especially leaving Lithium in 10-15 years in favour for something abundant).
Hi Eulenspiegel,
Perhaps it cannot be accomplished, but we already have the infrastructure to build cars and certainly have the resources to expand solar output, not sure about wind. There are also lots of opportunities to improve energy efficiency simply by eliminating combustion losses through the switch to wind, solar, and EVs, as well as a boost by using heat pumps rather than boilers and furnaces.
Energy use can be cut in half, as prices of fossil fuel rises and wind, solar, EVs and heat pumps fall the change can happen in 20 or 30 years, gradual at first and accelerating until most fossil fuel use is eliminated, then the production will slow to replacement rate.
You keep forgetting Indians, Pakistanis, Kenyans and Colombians.
I believe the oil price will be extremely volatile over the coming decade. There are major developments in both the supply and demand for oil that are very independent of each other and unlikely to move in tandem, with the likely result that there will be ebbs and flows of both supply and demand that have little relationship to one another, causing wild price swings.
I would summarize these as follows:
SUPPLY: The development of medium- and long-term supply appears to be severely curtailed by fracking and a limited supply of suitable sites for new exploration. CEOs are likely worried that any developments will not be profitable because shale will overproduce and knock down prices again. Until a clear picture of this phenomenon is apparent, it will curtail the willingness of oil companies to tackle bigger and more expensive projects. Possible new medium-term supply appears to exist in Mexico’s Gulf, Guyana, South China Sea, off-shore Brazil, Canadian Tar Sands, possibly the Arctic. The problem with developing these resources is fracking.
Fracking leads to a quick hit of oil, based primarily on debt infusion, that quickly dissipates – hence I like the term “frack cocaine”. It prioritizes rapid expansion of oil supply in the short term to the detriment of medium and long term investments. What Wall Street giveth, Wall Street can also taketh away. The shale oil industry has a similar profile to developing countries like Mexico in 1994 and Argentina in 2005. The flow of money can halt abruptly, and the consequences could be disasterous. The short-term oil will quickly go away, but the investments for serious longer term oil supply will likely be too little, possibly much too little.
Political trouble will likely lead to disruptions in Venezuela, Nigeria, and Libya. The cold war between Iran and KSA will likely remain cold, but if proxy wars get out of hand, massive oil supply disruptions will likely ensue.
DEMAND: The outlook for short and medium term demand is quite good. Global growth is strong, and entrenched systems of car production that favor ICEs will continue. Longer term, EVs and self-driving EVs in terms of taxi systems pose serious threats (perhaps least of all to the US, where distances tend to be longer, density is lower, and gas taxes are cheapest). GM is deploying self-driving cars as a taxi service next year based on the EV Bolt. Developing countries have a big incentive to embrace this technology for their populations: small diesel engines that primarily power scooters and taxis and larger bus engines lead to horrible air pollution, and electricity can be generated within borders rather than imported (whether by coal, gas, wind or solar doesn’t matter, so far as oil demand is concerned). Europe’s love affair with diesel cars is over and gas taxes (and parking prices) remain high, making EVs and EV-based taxi services very appealing. Battery technology is about to enter a new wave, with solid-state lithium ion batteries that are basically dendrite-free (hence much longer life), super-safe, easier to charge, and 2-3 times the range of current technologies now in production. Specifically I am looking at Toyota, who has promised such a vehicle by 2022. All other manufacturers better be able to match Toyota by then or very soon after, or they will leave everyone in the dust just like they did with hybrids. Lithium-based batteries and lithium itself could see major price swings based on this rapid increase in demand.
Or, of course, the global economy could fall off a cliff at any moment. Fwiw, I see a price range for oil over the next decade as between $25-$250, with very little pattern to its rise and fall. Volatility will be key. Oil may peak and fall several times based on fracking and other short-term trends – a very bumpy plateau. I reckon by 2030 the peak in oil will be obvious, although some will call it from supply while others will call it from demand, based on their preferences. By that date, little to no investment in oil will likley make financial sense, and it will begin to whither away as a global industry. This will be from a combination of reduction in demand due to an EV technological wave that will unstoppable by then, and political collapse that occurs in the interim in countries heavily depending on exporting or importing oil.
Should be an interesting decade!
I think you are absolutely right on your comments for supply and demand. The “frack cocaine” conundrum will continue to dissuade any meaningful investments in mid to long term production which will come back to bite as Ron has pointed out that OPEC spare capacity is limited. Demand destruction is years away and LTO alone will not be a sufficient bridge. A super spike seems inevitable.
Hi SVO,
Interesting, I agree oil prices will be volatile. It will quickly become apparent that the LTO resource will not be sufficient to cause another oversupply and oil investment might proceed in an orderly fashion.
It is not clear that things will get much worse in Venezuela, Nigeria, and Libya. A war in the Persian Gulf between Iran and Iraq and other Shia States and Saudi Arabia and Kuwait and other Sunni States would certainly cause a super spike in oil prices, just as the Iran-Iraq war in 1980-1984 caused a large spike in oil prices.
The higher that oil prices spike, the quicker the World may transition to non-oil energy for transportation. Though it is likely to reduce economic growth in the short term (just like the 1980s).
Did you name him Max?
https://www.bloomberg.com/news/articles/2018-01-19/tanker-carrying-russian-gas-for-boston-makes-mid-atlantic-u-turn
IEA total OECD inventory including their preliminary December number
OECD commercial stocks declined for the fourth consecutive month in November, by 17.9 mb, with a large fall in middle distillates. Preliminary data for December suggest a further fall of 42.7 mb.
Global crude oil markets saw an exceptionally tight 4Q17 as the large draw in OECD crude stocks coincided with a decline in Chinese implied crude balances. The combined draw is estimated at 1 mb/d.
https://www.iea.org/oilmarketreport/omrpublic/
Venezuela’s Oil Production Is Collapsing
Sharp drop in output increases the odds of a debt default, worsens economic crisis
CARACAS, Venezuela—Venezuela’s oil output is collapsing at an accelerating pace, deepening
an economic and humanitarian crisis and increasing the chances the country will default on its
debts.
Crude production fell 11% in December from the month before, according to government figures
released Thursday. Over all of 2017, output was down 29%, among the steepest national declines
in recent history, driven by mismanagement and under investment at the state oil company, say
industry observers and oilmen.
The drop is deeper than that experienced by Iraq after the 2003 war there—when the amount of
crude pumped fell 23%—or by Russia during the collapse of the Soviet Union, according to data
from the Organization of the Petroleum Exporting Countries.
“In Venezuela, there is no war, nor strike,” said Evanán Romero, a former director of
government-run Petróleos de Venezuela SA. “What’s left of the oil industry is crumbling on
its own.”
Oil is critical to Venezuela’s state-led economy. Petroleum sales bring in 95% of the country’s
foreign-currency earnings, so declining output will make it harder for the government to
import everything from machinery to food and medicine.
Over the past four years, the country’s economy has shrunk by about 40% and inflation has
surged—topping 2,600% last year, according to the National Assembly. Nearly one in four
factories didn’t reopen after Christmas, according to a local industry association.
Malnutrition is spreading among the young and elderly, while health officials report a resurgence of illnesses ranging from malaria to diphtheria. Meanwhile social stability is fraying. At least four people have died during outbreaks of looting in recent weeks. The government is already resorting to barter—seeking to trade diamonds and other valuables—in an effort to bring in sorely needed supplies as President Nicolás Maduro prepares for elections this year.
Do you remember all the chavista touters and admirers who used to pop up in here chanting in rhythm about the greatness of 21st century socialism and the bright future Venezuelans would enjoy? What happened to them? Are there Chavistas running around in the USA, or are they a dying species?
When any country elects a power hungry, narcissistic, ideologue like Hugo Chavez, Nicolas Maduro or Donald Trump then that country starts to go down the road to decay, despotism, and ultimate collapse. The only saving grace the USA has is that we have the ability to throw the sonofabitch out after four years. Hopefully that will be in time to save the country.
We’ve all heard that the lack of infrastructure spend since the downturn would lead to increased production decline rates but other than Venezuela there seems to be no clear case. Can anyone explain why the general lack of capex has not yet materialized in production decline?
Hi John,
What has changed is that output has stopped increasing, as stocks reach lower levels prices will rise and investment will increase and output will continue to increase for a few years (3-8 years in my opinion, then it will plateau and decline by 2025-2030.)
US LTO can respond pretty quickly to price increases and may be able to fill the gap along with increases from OPEC at higher prices. After 5 years or so longer term projects like oil sands and deep water may come online in response to high prices, but those projects have long lead times.
The deepwater and oil sands projects that were started during high prices up to 2014 that were being completed over the 2015-2017 period are part of the reason for little decline in World output.
Thank you…that makes some sense…still wonder how overall production has been maintained when consensus seems to imply world declines at 4-5% on avg. All the predictions that the world needed to discover the equivalent of 4 new Saudi Arabia’s to keep production flat have yet to materialize…no new major discoveries so how far off can a tipping point be?
Hi John,
At the end of 2016 there were about 1300 Gb of proved conventional oil reserves in the World according to the BP Statistical Review. As those reserves are developed (only a fraction of the existing reserves have been developed, maybe 600 to 700 Gb of the 1300 Gb of proved reserves), the new output from newly developed fields offsets the decline from existing producing wells.
Also there is a tendency for the estimates of existing reserves to be revised higher as more knowledge is gained from drilling and as technology improves, this is called “reserve growth”.
In the US from 1980 to 2005 reserves “grew” by about 168%, I don’t have data for the rest of the World, but my guess was that reserve growth was more than zero over the same period.
I expect that the rate of reserve growth will gradually fall to zero, but the timing is highly uncertain.
Paul Isaacs
1300 giga barrels world conventional reserves.
0.1 giga barrels used per day.
13000 days supply.
36 years to zero conventional oil at today’s rate of consumption. Back of the envelope calculation only 2 numbers and the daily consumption is likely good to within 10% or less. Not much wiggle room here. No model necessary.
About 3% per year decline. Between 2 and 3 million barrels per year decline. The “economy” is unlikely to be able to stay on its feet at that rate.
Hi Paul,
There could be discoveries, there is likely to be some reserve growth and there is about 600 Gb of unconventional oil (oil sands and LTO), which might also grow a bit over time.
Many things can change, the rate that resources are developed ab increase or decrease (depending on oil prices, politics, and technology.)
It is not very likely that output will remain flat until there are no resources left, that’s why creating a scenario for how things might play out can be useful in my opinion.
Hi John,
The concept of time lag will throw a lot of light on your question as to why production is holding rather than falling.
Most of the new oil coming to market now is coming because of investment decisions finalized some years ago. A lot less new oil than might be expected otherwise will be coming to market five six seven years from NOW because investment is down.
I have often repeated my remark that the time frame involving investment decisions and production are very similar for apple growers and oil producers, lol.
I will never plant more than a handful of new trees again, because there’s an excellent possibility I won’t live long enough to see them produce enough to cover the investment, between five and ten years, depending on how you compute it.
There are other reasons production is holding up better than one would otherwise expect. Ron has often mentioned one of them, the very large number of new infill wells being drilled between old ones, which keeps production up NOW but at the expense of a much faster decline later.
See my comment at the bottom of this thread ( for now) about some other factors that come into play in determining the price of oil.
That’s right. When we are half way on a large project and prices drop we tend to keep on and cross our fingers. As you know my personal model said oil prices should be $63 in the medium term. And many companies must have had something similar. So the typical approach is to get contractors to come in, ask them to cut prices, and improve efficiency.
I went over this issue several years ago with you guys, explained that OPEX and CAPEX were going to drop, that it was fine to drill but not complete wells, etc. what has been happening was to be expected. The only thing I didn’t expect was the idiocy of bankers lending so much to shaky companies.
I would say the easiest way to think about it is two-fold:
1) Reduction in exploration doesn’t necessarily mean reduction in drilling and development (i.e. production). Capex numbers always seem to bundle the two, because they are “upstream”, but they are not the same.
2) We are swapping long term development (conventional) for short term development (LTO). The costs are less intense and the payoff is much quicker.
Any look at “discoveries” over the past several years will confirm either peak oil or reveal where all the capex cuts have gone to:
http://www.chron.com/business/energy/article/Oil-discoveries-in-2017-hit-all-time-low-12447212.php
How much has LTO capex dropped during the 2014-2017 period? I know their Capex to Cash flow seems to continue rising even despite the fall in prices, but it’s a bit harder to find a chart that shows overall Capex spending by LTO for the period 2011 – 2017.
What if discoveries/extensions for LTO fields have also dropped off and there really isn’t as much of them left as everybody says – this month’s EIA 2016 reserve numbers (assuming they do eventually come out, given the shutdown) might show further, but in June the E&Y review of the top 50 E&Ps showed a decline for US reserves and it’s likely to be worse once the smaller companies are included as the larger ones where gaining reserves through acquisitions in 2016.
Once I realized how reliant reserves are on price I sort of stopped paying attention to them. Plus I think there’s a lot of lying. I mean in the mind of the industry if prices go high enough you could mine asteroids for oil – never mind that the world economy would go up in flames long before that point. in other words – the day that global economy grinds to a halt from insufficient flows of oil – reserves will be “infinite”
There is actually so much lying it is shameful, be it from a government entity like the EIA, or the USGS, or privately by in house reservoir engineers. In house, they are TOLD which type curve to use in the EUR calculations; they need a job, they will do what they are told. Everybody lies, about everything these days. That is not cynicism, that is just fact. In America we have criticized the ME for the past 40 years that I can remember, for exaggerating reserves, etc. … what we are now doing in the US is pitiful. And I am an SPE member! Take the E in BOE calculations, at 5.8 to 1. That is the biggest bunch of dung heap ever invented in the (shale) oil industry.
And lots of people buy into it.
Hi Mike
The equivalence is in energy,
Clearly in financial terms gas to oil is more like 18,000 cf gas to 1 barrel of oil.
Just looking at some historical year end stuff.
Our oil price for 2015, 2016 and 2017 was below all prices for years 2005-2014.
If the current price holds, 2018 would still be lower than all years 2005-2014 except 2005, 2009 and possibly 2006 (very close).
Note, this is our well head price, not WTI, and our basis to WTI has fluctuated.
For even more perspective, the average price for the years 2015-2017 was less than half the average price for the years 2008 and 2011-14.
Remarkable that US shale producers have kept going gangbusters during much of this price weakness. Testament to tremendous liquidity. Making me nervous, as are the likes of Bitcoin, Tesla, Netflix, Amazon etc.
Hey Shallow, watch what you say about Netflix and Tesla — they’re my neighbors! 🙂
The reality of Silicon Valley is way different from how it looks from back east — I know because I relocated here from NY a few years ago. Life here is a drag for the vast majority. I know people making close to $100K per year who have to rent a room in someone’s home. I know people who commute two hours EACH WAY to work in order to find a home they can afford. Their finances are ruled by the price of gasoline. I live a quarter mile from tech complex that includes Google, Amazon, Juniper Networks, Microsoft, LinkedIn and a bunch of others. But take a look at the neighborhoods nearby and they look like dumps because there is no incentive to fix them up. A 1200 square foot ranch in crappy condition easily goes for over $1 million in Sunnyvale. California’s property tax laws discourage moving so tons of houses are rented out to unrelated people. I bought my first house here after it was completely redone, but previously it was rented by three mexican families — one family lived in the garage. This is normal here. And this is in a fairly nice area.
Now that Apple has built their mega-grandiose-we’re better than you headquarters complete with a visitor’s center across the street, houses in the area have skyrocketed in price and traffic is getting even worse, if that’s even imaginable. Same thing in Seattle pretty much.
And now cities across America are competing for the next Amazon or Google location. In the meantime, these companies are building a future of fewer jobs, and most of them will be crappy jobs. Like the Uber driver I had recently who is also a firefighter in a town one and a half hours away from here — he comes to Silicon Valley on his “days off” to drive people around and make ends meet. Even the good jobs for programmers and such won’t pay enough to live the kind of life I and my parents could afford. Desperate times, but man that iPhone is great!
PS, I’m planning on heading back to western NY.
California is as close as you can get to European socialism, the distortions are feathered as long as the USA doesn’t fall in the claws of Sanders-class politicians.
Again, will give the example of the one horse operator (not me, but have several friends who do this) who works 365 days a year, and tries to support his family on a few leases.
6000 net BO sales x $42 = $252,000
LOE $30 per BO = $180,000
Net before income taxes $72,000. Take home assuming 3,000 hours worked is $24 per hour.
In 2011-14 average price of $90.
$540,000 – $240,000 = $300,000 or $100 per hour. (Raised LOE $10 per BO due to high oil prices resulting in higher LOE, as is always the case).
Imagine going from $100 per hour to $24 per hour. Not too many of us out there would stand for that. Small oil producers (and farmers) have to just accept it.
Further, my example is too simplistic, because in 2015, LOE would not have went down to $30 right away. So my hypothetical one horse operator probably made about $5 per hour, after he and family got used to $100 per hour.
Then, there is the first quarter of 2016, where the hourly rate was negative. Working your butt off an losing money doing it.
I do agree, however, there is high reward potential for the high risk undertaken in both oil and farming.
Shallow, I assume you were using something like 10 hour days in your terrific example; for me it is more like 14 hour days, plus the three hours a night I lie awake worrying about stuff, less self employment tax, etc. etc., health care costs, including jugs of Advil from being stove up all the time, etc. etc., I’d say I make less than somebody gluing tennis shoes together in India.
Why? Because, essentially, the American shale industry cannot keep its credit cards in its purse and, with NO regard whatsoever for the rest of an oil producing world that is actually trying to STABILIZE world oil prices, with NO regard whatsoever for the entire rest of the domestic oil and gas industry in America, and their families, it keeps spending money it does not have. Why? To export our last remaining hydrocarbon resources to China and to flare billions of cubic feet per day of associated gas into the sky in the process. Its a revolution alrighty. Of complete and utter stupidity. Nobody governing America in the past 20 years, or managing it’s energy policies, can think past next week.
Mike. Just trying to give a very simplistic example, of course.
The problem is there can be very large unexpected expenses that arise. Gear boxes on pumping units wear out, injection pumps fall apart, lightening hits a tank battery (which insurance does not cover typically) pick up trucks need replaced, someone slips on the ice on a tank walkway, rods part, tubing gets lost down the hole, farmer hits injection lines, flow lines, electric lines when he uses his ripper tool, water meters quit working, stock tanks springs a leak (although I have seen “Texas patch jobs on stock tanks last a long time – just need to find the right sizes twig, LOL).
These things are a pain in the butt, but keep things interesting. And from the joint interest bills I have reviewed, these things and more happen to those horizontal shale wells, and cost tens or hundred of times more to fix.
SE taxes are a drag. 15.3%. Health insurance spikes almost every year it seems.
Maybe you should become a tennis instructor!!
Mike, I think the explanation for irrational investment in LTO is simple — American’s expect sub $3 per gallon gasoline. Politician’s understand this. Think about how it makes news when the price of gasoline “spikes” twenty or thirty cents during some event -it’s like the end of the world. So there is a desperate racket going on to keep gasoline prices low at any cost. That’s why they can’t increase the federal gasoline tax since 1993 even though our roads are falling apart. Also, many American’s are buying into the “Energy Dominance” concept making the rounds today.
I have a feeling things are going to change in the next year or three. The new tax cut will create a deficit that will raise interest rates and if they go up enough that could kill the LTO industry right there if it doesn’t collapse under its own weight. Higher interest rates could also kill the very fragile recovery we’ve been nurturing for the past ten years. But, hey, if people see a few more bucks in their take home today, who cares, right?
SVO, I agree with you 5 x 5 on everything you’ve said. For conservation reasons the Federal gasoline tax should be twice what it is; they won’t do that, because of votes. And the shale industry has done a masterful job of propagandizing its drillable locations and exaggerated EURs, all of which has led America’s into a false sense of security about its energy future. I also agree that interest rates are headed up and with regard to reserve base lending methods the shale oil industry exists on, higher rates will slow it waaaayyyyy down. There are enough debt maturities coming up within the next 15 months to choke a big horse; close to $90B by 2020. Don’t tell me the shale industry isn’t puckered up about that.
Denial is the ultimate tool in the human emotional tool box. It works wonders for a lot of things, like a Swiss Army knife; “to hell with the future, I am in a bind, NOW!” We’ll worry about tomorrow, tomorrow.
Rising oil price not only hits prices at the pumps. Slowly and inexorably the cost of EVs will rise, with subsidies becoming less affordable. Grid electricity will continue its upward trend. Diesel may well remain the best deal in town.
Hi Jonathan,
Electricity prices may rise, but they will rise at a much slower rate than oil prices.
Price of solar, wind, and EVs are all likely to fall while fossil fuel prices will rise. Wind and solar will eventually replace most coal and natural gas electricity production and EVs will be far cheaper from a total cost of ownership perspective within 5 years.
Diesel will not be the best deal when the World oil price is $100/b or higher in 2022.
For the present, diesel is not a bad deal.
I believe civilized nations will eventually turn to nuclear baseload. Wind and solar aren’t cutting it in Europe.
Hi Mike,
I agree on the higher gas tax, that is probably the best way to conserve US resources in my opinion. I believe the Federal fuel tax should be tripled and made a percentage of pre-tax fuel price so that the tax increases with inflation.
This would raise the tax to roughly the 1993 level in percentage terms.
Politically it is not likely to happen, even though the fuel tax does not cover road and bridge repair as it is supposed to do.
Also EVs should be taxed at registration to help pay for roads. It would be mileage based.
I prefer a tax which delivers a nation wide MINIMUM price X, say $4.00 per gallon. This target price would go up with inflation plus 1% per year. If the pretax price goes up the tax would go down by half the change to cushion the impact. Fuel sellers would be free to charge above and below the NATIOWiDE AvERAGE MINIMUM depending on local taxes and costs.
So let’s say the gasoline price is 2 per gallon. The tax is 2 per gallon. The price goes up from 2 to 3, then the tax goes down from 2 to 1.50, thus the price seen by the retail buyer is 4.50, not $5
Mike Wrote: “I also agree that interest rates are headed up and with regard to reserve base lending methods the shale oil industry exists on, higher rates will slow it waaaayyyyy down”
Interest rates cannot rise much without crashing the global economy. While they might increase a bit, I don’t believe they will ever normalize. Currently CB’s (Central Banks) are still printing about $2T to $4T a year to avoid a global depression. If they stop is very likely going to cause another recession. Once the global economy begins to decline or there are economic warning signs, CB’s will lower rates and print more currency (QE) to stablize the economy. World Debt is above $217T (or about 327% of global GDP) which does not include underfunded obligations like pensions & gov’t entitlements. Its not possible to maintain a stable economy with this enormous debt load. Consider that the interest payment on $217T at 1% is $2.1T. Thus higher rates will make it very difficult to service the debt.
I don’t believe energy prices will ever rebound above the $70/bbl (except for spikes caused geopolitical problems). If energy prices increase its likely to cause significant demand destruction. The combination for cheap energy & low interest rates is enabling consumers, Businesses & gov’t to service their debt.
Mike wrote:
“There are enough debt maturities coming up within the next 15 months to choke a big horse; close to $90B by 2020.”
Yup, but my guess is that these shale companies will be bailed out with lower interest rates, either Wall Street or CB’s will bail them out by rolling them into new bonds as the come do. I don’t think CB’s will permit shale companies from defaulting on their debt. That last think CB’s want is energy company defaults that creates a perfect storm of higher interest rates & higher energy prices which would knock the feet from under an very feeble global economy. That said, those running the CB’s aren’t the smartest crowd, and their hubris could very well trigger another economic/energy crisis.
Eventually the lack of investment in Oil production will come home to roost. I think when it does, coupled with aging populations that have huge pension & entitlement obligations that its going to cause a long term global economic depression & probably result in another World War, just as the Great depression did.
The ORB WTI spread widened last August, seems to be another sign that the oil market tightened around then. (ORB = OPEC Reference Basket Price)
Chart on Twitter https://pbs.twimg.com/media/DT-qkwaXcAAo0fZ.jpg
U.S. shale spoiling the rally in oil prices
https://www.upi.com/Energy-News/2018/01/19/US-shale-spoiling-the-rally-in-oil-prices/9911516371547/?utm_source=sec&utm_campaign=sl&utm_medium=1
Can’t keep their pants on.
Saudi Energy Minister Khalid Al-Falih speaking at OPEC JMMC in Oman
The 5-yr average of oil inventories is not the best target going forward on oil cut deal. Could shift metric to days of cover or inventories by region and crude grades… We also look at investment levels.
The oil market is entering the period of seasonal low demand. “We are uncertain that the pace of inventory drawdown will continue at the same pace in the months to come.” Sees rebalancing in late 2018 or early 2019
Cooperation could be extended beyond 2018. Not necessarily the current cuts, cooperation might be in the form of a freeze deal/collective ceiling?
https://www.oilandgasinvestor.com/midland-evolution-1671051#p=full
Interesting read on spacing in the Permian. Makes sense why there are accumulation of DUCs. 14 well spacing per section is about 45 acres per well. Hit them with a zipper frac at one time to avoid degradation from parent/child type wells. Ok. How does that affect the adjacent sections? Yeah, we ain’t got that far, yet.
I don’t know shit about science or geology, but don’t molecules of oil like to stay together?
Guym. Thanks for the link.
What I am reading between the lines is that formation pressure drops very fast, not just in the producing well, but for a fairly large area around it.
I am going to make a comment which may show my ignorance. Is it correct in the Permian that there really are not “stacked pays” like a “layer cake” that are sealed off by impenetrable rock, but instead the shale zone is continuous and is just very thick? The reason for the question is discussion of well interference between the Wolfcamp A, B and C, and other discussion that, “we don’t think” there is communication between the Wolfcamp and Spraberry, but “we know there is” between the Upper Spraberry and the Lower Sprayberry.”
Also, interesting to see recovery rates boosted from less than 10% of oil in place to the low teens. Still a pretty low recovery rate. Wonder if companies will figure out ways to increase this further or not. If not, it looks like as early as three years from now PB will hit its limit, and the oil markets could get very interesting.
Given the complete collapse of conventional discoveries and large drop in CAPEX outside the US and Canadian shale basins, once shale hits its limit, we could be in for another oil price induced Great Recession similar to 2008.
Like I said, I have very little knowledge in geology. What has been discussed frequently, is a 40% drop when child wells are added later. That’s significant, and even more of a drop discussed in close spacing in the Eagle Ford. I am guessing that means, either the first well got more of it, or it is migrating outward. I am guessing migrating outward. Different than the Eagle Ford. So, the question then becomes, how far away can you begin to drill the next 14 pad extravaganza?
Migration of oil is not unique. It even happens in the Eagle Ford, over hundreds of thousands of years. It is pretty well believed, now, that the Eagle Ford is the source for most of the Buda, and Austin Chalk finds. It is also why the sweet spots of the Eagle Ford are in geological traps, like the Karnes Fault. But migration within a few years puts a new spin on things.
I keep reading more articles on the suspicion that PB will hit its limit in 2020, or 2021. There is plenty more oil that can come out of the Eagle Ford, or many more places (including the Permian) at close to a $100 oil price. But, not at $60.
https://www.forbes.com/sites/christopherhelman/2014/10/15/the-oil-patch-prince/amp/
Old article indicating vertical drilling in the Permian. Most were in the “wolf berry”, or combination wolf camp/sprayberry. If you can do that, it means the formation is more permeable than Eagle Ford shale, and can migrate, some. Because the cost was only 1.3 million, then the flow could be lower at $100 a barrel. My guess.
And, I really get confused as to why if it was this permeable, why is all the sand used for fracking?
Managed money (speculators) have bought over 1 billion paper barrels…
Saxo Bank, The combined (WTI+Brent) net-long in crude oil reached a new record of close to 1.1 billion barrels in the week to Jan 16. The main contribution came from a 45k lots addition to net-long in WTI
Chart on Twitter: https://pbs.twimg.com/media/DUEda43X0AEuvUs.jpg
If Russia and OPEC do stick to their production cut agreement, then oil prices could remain in the $60 – $80 range.
http://www.telegraph.co.uk/business/2018/01/21/opec-ties-oil-allies-will-stretch-2019/
Global oil demand is expected to increase by 1.5mbd, which is pretty much what it has been for the last few years.
The question is how much tight oil can the US increase in that time?
It will be very interesting to see how thing pan out in the next year or so.
I have read everything published here with great interest since day one. Nearly all the comments about the price of oil coming from people in the industry, and people like Dennis, seem to be rock solid to me, and in good accord with what I was taught in Econ back in the dark ages.
BUT…. a few things that are relevant are seldom mentioned, at least not directly or often.
ONE. The price of oil is MOSTLY determined on the world market, with those people who have lesser quality or greater shipping expenses getting less than the often mentioned ” price” and those who have the advantage in terms of quality and easy shipping getting more.
The world market itself is incredibly complicated due to political and military and economic alliances, security and supply questions, foreign exchange issues, etc, etc.
Guys like Mike and Shallow Sand often mention this, but seldom mention that it applies to the WORLD market just as much as to the domestic American markets where they sell. I believe Mike has said within the last few days that his discount to the” WTI price” is around three or four bucks, he gets that much less per barrel he sells after paying shipping, etc. He hasn’t said if it’s shipping or quality that means he has to sell for less, I’m just guessing it’s mostly or all shipping.
Then there’s the obvious fact, which is seldom mentioned in so many words, that the price that the PRODUCER gets, or EXPECTS to get, is the price that really matters, in terms of ANY GIVEN producer deciding whether to invest or not to invest, or even to produce short term.
Now it doesn’t matter a whit whether the producer gets all of his money from his buyer, with the buyer getting a subsidy, or if he the producer gets a subsidy. And in the real world, subsidies, AND INCOME as well, can come in OTHER forms than actual cash money.
Consider the fact that the light oil industry in the USA has for some reason been able and continues to be able to borrow gazillions of bucks at ridiculously low rates. This easy money IS a defacto subsidy, just the same as if I were to get it to farm via a very low interest government loan of the sort often made to farmers.
Or consider the obvious fact that the people that run countries that have nationalized oil industries, or that keep privately or corporately owned industries on a tight leash, derive substantial NON MONETARY income due to producing oil, regardless of the price. This income is in the form of political stability, of the support of the people of their countries, who like life to be reasonably steady and predictable , with large numbers of them earning a living directly from the oil industry as employees or the employees of businesses that serve the oil industry, or in the form of checks or property channeled to them, with the money originating in the oil industry, coming into the possession of the government, and being disbursed to a large extent as the government pleases. It pleases the Saudi royal family to keep it’s members living like they are, lol, namely princes and princesses. Cutting back on oil revenue, even if it means making bad decisions from the pov of managing the industry like a BUSINESS isn’t an option. A civil war within the family would probably mean most of them would have to flee the country, and a good many of the rest murdered by each other’s security people. The ones left might not be able to maintain control, and have to leave as well.
The princes and princesses MUST have their London and Paris apartments, and their jets to get back and forth as well. Otherwise….. royal family civil war.
For Maduro, maintaining production as best his nut case crowd can manage is a life and death question. If he can’t, he will wind up like Mussolini or Saddam Hussein unless he manages to flee the country. All decisions are based solely on getting the money, in Venezuela NOW , as far as oil is concerned. Next year is a century away to somebody in Maduro’s shoes.
On top of all this, the managers of the big independent oil companies, any that are traded on the stock market, know that their fucking jobs, and their obscene salaries and bennies, ( just envy on my part showing! ) depend on maintaining production in the short term, no matter WHAT, because if they allow production to decline noticeably, they’re going to be out on the street looking for new jobs within a year, due to the stock market working the way it does. There aren’t very many openings that pay a quarter million and up, lol, and especially few that pay well into the millions. So they make damned sure production STAYS up, no matter how much long term damage they may do to the company, and the stockholders thereof, over the longer term. The long term matters NOT AT ALL to people in their position…..UNLESS they survive the short term, a fact often pointed out by Mike. Long term, they’re retired or dead, or moved on while the moving is still good.
I could go on, but I ought to get off my ass and quit lecturing people who forgot more about the oil biz by the time they were sixteen than I will ever dream of knowing. They know all this stuff.
The thing is , they seldom if ever mention these things, so I’m doing it for them, lol.
India blurbs:
Oil import dependency now 83%, up from 82% 2016. Very mild domestic oil production increase, most of the dependency growth is consumption increase. Oil consumption growth on track for well over 6%.
Natgas production up 1% 2017. LNG imports fell as a result of this, which is odd given population increase.
LNG source 50% Qatar, 13% Nigeria. 15% Singapore, conduit from wherever.
If LNG is used for heating, remember the bulk of India has warm weather.
Ya maybe, not a big bump regardless.
My estimate for November Texas production is 3800k a day. Pending shows 682, but it was adjusted upwards 130k for Oct, so I am adjusting upwards 140k, plus another 226 for normal late posting. Initial is 2752. Pending file of over 800k will give any estimates just on initial production fits. I agree Oct 914 is within about 100k, but September still looks about 250k over. Production is definitely trending up, already.
Thanks Guym.
Not too concerned about September, eventually we will have a better drilling info estimate for Sept 2017 (at the end of February). It will be interesting to see the 914 survey data for Nov at the end of January.
Is this higher output than you expected? I thought you were guessing 3500 kb/d through the end of the year, but may not be remembering correctly.
Just for the funny of it here are my estimates for this year by my method to EIA. We can match up drilling info later to see which one is closer.
Month. Guy. EIA
11. 3798.
10. 3680. 3767
9. 3353. 3574
8. 3445. 3381
7. 3459. 3482
6. 3488. 3451
5. 3390. 3434
4. 3440. 3360
3. 3311. 3316
2. 3326. 3321
1. 3199. 3202
That’s right, so far this year, there is no discernible difference. Except for September. Bet EIA for Nov is in the 3850 range.
Hi GuyM,
Your method seems to work well for 11 months, does it also do well further back in time? Say 2014-2016?
Developments in ICEs over the last year that could boost efficiency 30%. Maybe it’s not dead yet!
Diesels (Achates):
https://www.greencarreports.com/news/1114896_achates-engine-in-ford-f-150-pickup-targets-37-mpg-with-saudi-oil-company-backing
Gas (Mazda):
http://autoweek.com/article/technology/7-things-you-need-know-about-mazdas-new-compression-engine
Blowout in Oklahoma
http://www.startribune.com/emergency-official-5-missing-after-oklahoma-rig-explosion/470534823/
Jodi data is out again and Saudi inventories have dropped again. We are now 45 MM BBL below the 5 year average and the gap seem sto be accelerating (was 24 MM BBL in January)
Yes I’m still watching their numbers but I’m wondering how relevant this is now that they have cut production as part of the OPEC agreement, I don’t know.
I think it is very relevant. Production down, export down and still inventories are shrinking. Something seems to ot match up here…
Yes. I wonder if what we are seeing is the beginning of the decline of ghawar. As others have pointed out, due to EOR that’s gone on it could be an accelerated decline similar to Cantarral.
Rystad Energy articles: http://www.rystadenergy.com/NewsEvents
Bloomberg – 2018-01-22 – There are still 104 big projects awating approval, Rystad says
The global oil industry’s backlog of big drilling projects is starting to shrink as prices improve.
From production vessels tapping Brazil’s deep-water reserves to pipes connecting rigs to underwater wells in China, the number of ventures delayed since the oil crash that finally got approval to get off the ground totaled 18 last year, according to a report by consultant Rystad Energy. That compares with only five in 2016 and two in 2015.
That’s a start, but there are still 104 delayed oil and gas projects waiting for investment approval, according to Rystad.
https://www.bloomberg.com/news/articles/2018-01-22/big-global-oil-projects-are-starting-to-get-off-the-ground
2018-01-17 – Rystad – Global well market outlook
Nearly 60,000 new wells were drilled and completed globally in 2017. This is a 14% increase compared to 2016, which represented the turning point following the downturn
North American shale activity is the primary mechanism driving growth globally, only slightly offset by declining drilling activity in Asia. The number of new wells completed in North America increased 40% in 2017 and we expect 11% average annual growth towards 2020.
http://www.rystadenergy.com/newsevents/news/newsletters/OfsArchive/ofs-january-2018/
Figure 1: Number of wells drilled and completed by continent
That doesn’t quite square with RRC data. Oil completions 2016 were 7813, and in 2017 we’re 5394. Can’t see a 40% increase in that. Unless, you only count wells that were drilled and completed in the year, leaving out DUC completions, which is meaningless. They are a Norway Company, not Texas, so maybe it has more significance to them.
Presumably that Bloomberg article is intended to be good news for Bloomberg readership and indicate that the oil industry is coming out of the doldrums, but I don’t think it shows that. Taking out Russia and USA wells (mostly on shore) the others, which will be the higher producing offshore ones, especially deepwater, show a significant decline.
The 18 FIDs actually included a lot of smaller tie backs in GoM and Norway and most of the bigger projects were gas.
A backlog of 104 projects, which are mixed oil and gas, will probably only give about 5 or 6 mmbpd new average oil production, and coming from the difficult projects that were bottom of the queue in the high price years. On top of that thee’s about 5 mmbpd which is under construction and discoveries since 2014 are only abour 13Gb oil, which would support maybe 3 mmbpd (some of which is in the stuff already having been approved). So without further discoveries the conventional oil development industry (i.e. non XH or LTO) has maybe 13 mmbpd of projects left, which is about 5 years of decline only or 3 years of decline and normal growth. I think that really represents the beginning of the end rather than a turn around.
Hi George,
Does that include OPEC, or is it mostly non-OPEC?
Aren’t there some projects that might become feasible with higher oil prices (say $100/b or more)?
I don’ know exactly what is in the Rystad number, I ws just taking an average based on recent projects. I know of very few greenfield projects for OPEC in the ME, let alone any that were cancelled, but there are a few in Nigeria and Angola.
I don’t know of any projects that were not being considered at all because of price, if there were some they might be in relinquished leases, but I don’t know the details, I think most companies would hang on to the lease if they thought there was a reasonable chance that prices would move enough for it to become economically viable within a few years, but I don’t know the details of all relinquished leases (there have been surprisingly few to my mind in the areas where there is good data – GoM, UK, Norway – since the price crash, but I can’t speak from a lot of experience). I think there are about 200 to 250 projects under appraisal, which would include most of the Rystad 104 plus a number in the discoveries since 2015 and a few that would have been in FEED at the price crash. I only know three conventional that were cancelled outright at the time without cancelling the lease, which I guess could come back if prices went up enough (Bay du Nord, Bressay and one in Nigeria which had corruption issues, but there were probably others).
Thanks George.
I should add those 200 to 250 projects include a lot of oil sands.
Dean’s charts for Texas RRC
Texas RRC data for crude oil and natural gas production up to November 2017:
my corrected data for crude oil only (all vintage data)
Chart on Twitter: https://pbs.twimg.com/media/DULQSm2X0AQubW6.png
my corrected data for crude oil + condensate vs EIA data
https://pbs.twimg.com/media/DULQdlwX4AEkO5x.png
my corrected data for (total) natural gas vs EIA
https://pbs.twimg.com/media/DULQlQ_WAAAS61J.png
Dean: https://twitter.com/DeanFantazzini
Dean’s estimate is based on historical performance of the initial Texas production. Complicating that is the fact that Pending Leases have grown from around 300k a day to around 800k a day since April. Probably pending because RRC has no idea, yet, how to classify some of these Christmas trees being drilled in the Permian. My guess.
My estimate is based on adding pending leases plus initial production. I add an estimate of 224k barrels of actual late reporting plus an estimate of how much the pending data file will increase one month later. After that first month, there is no significant increase in reporting due to potential RRC penalties, which can shut down late reporters. Still, my estimate can be off 100k barrels up or down, because I use an average to add.
Some history on this. I always have understood that RRC does not like late reporting to a large extent, and would shut down habitual late reporters. That never squared with the fact that Texas actual production took nine months to become close. Then I found out from discussions on this board about the pending lease file. It was not included in the current production, until it was reclassified with a lease number. This was in November of last year, and when I looked on the RRC site, they indicated you could buy to file for $10. Better, starting in Dec 1, the file would be in text form off the FTP site. Previously, you would have had to have some expensive software, and technical ability to use it. So, I decided to try it, and my sole goal was to be able to use it much like Dean uses the initial production to estimate production with the initial lease file plus the pending lease file. My initial effort I share with Dennis, who was expecting much more from the pending lease data which could ever be accomplished. I went back to 2015, and compared current RRC data to what the total of the pending lease file plus the initial production to see a comparison. Complicating that, I found the pending lease file increased the month after. No significant adjustments were noted on the months previous to that. From what I have read, RRC gives a pass on one month late reporting. As a consequence, I think most of the late reporting occurs in the month following the due date, both to the current production, and to the pending lease file. More occurs after that, but not in the scale that I think most people previously thought looking at current Texas production. The 224 average I use is, no doubt, on the high scale, because it included months that had high completion numbers. Since 2016, it has been around the 400-500 amount, and not 1200. Dennis still thinks I am nuts for doing this, but I say the proof is in the pudding. Look at the numbers I posted above compared to EIA monthlies, and compare that to Dean’s numbers which reflect estimates from historical numbers from initial RRC data. That is with Dean using much better mathematics than what I used.
Anyone can do this, with spending $10 and a lot of initial time. Following months take a lot less time. RRC can walk you through some setup, but basically you take the pending production file and copy it from the FTP site to your desktop. Then you have to unzip the file. The text file can be uploaded to excel by using } as the delimiter. Then it is a matter of sorting the excel file by date, which can take a while to set up, as the files go all the way back to 2005.
Sounds like you have been very busy.
Only takes about two hours a week, now.
Thanks Guym,
Feel free to write something up, if you care to, email it to me and I will post it.
The only part that I didn’t agree with is using the “initial” RRC data, but the problem with using more current RRC data is sorting out how much of the pending lease data has moved over to the PDQ, I agree your method seems to work well for the most recent 11 months, before that we can use the drilling info data (which seems to be pretty good except the most recent 4 months or so).
I would be the first to say that it is a very mathematically imperfect estimate. It only adds one additional feature that Dean doesn’t use, yet. No doubt, he could do a better job with it than I can. Then again, I am only interested in seeing the correct trend. I know I can’t hit the stake with horseshoes, so I settle for hand grenades.
As for one million barrel increases, I am pretty sure EIA did not plan their trip right. It could be done with massive capital input, but then the question of profit and cash flow rears its ugly head, again. Mike is definitely correct, in that regard.
Enno’s update: North Dakota – update through November 2017: https://shaleprofile.com/
The EIA, IEA and OPEC have all revised their US production forecasts higher.
These are their year over year production growth forecasts, they all forecast growth of over 1 million barrels per day, year over year in 2018.
Chart from Scotiabank on Twitter: https://pbs.twimg.com/media/DUPdSKcW0AEWhTD.jpg
Non-US supply growth forecasts
https://pbs.twimg.com/media/DUPdSlpW0AEOT8N.jpg
World oil demand growth forecasts
https://pbs.twimg.com/media/DUPdR4qW0AEzKXg.jpg
Supply and demand market balance forecasts
https://pbs.twimg.com/media/DUPdS_aXUAE3sOC.jpg
Yeah, we will be competing with these guys to see which gets a million more, first.
https://oilprice.com/Energy/Crude-Oil/Venezuela-Claims-To-Be-Able-To-Boost-Oil-Production-By-1M-Bpd.html
Not sure which will get there sooner.
Guym,
Higher oil prices might get us to a 1 Mb/d increase in US output in 12 months, but my guess is that $85/b by Jan 2019 might be needed to accomplish it.
Of course that big an increase in output makes high oil prices less likely, so am highly skeptical of the 1 Mb/d increase in US output stories, 600 kb/d maybe and it will still require higher oil prices, maybe $75/b by Jan 2019.
Lower oil prices (say less than $60/b in Jan 2019) so basically flat from today, maybe we will see a 300 kb/d increase in US output.
A significant (1 million barrel) increase has a multitude of obstacles to get past which don’t include oil price. Dearth of fracing crews, drivers, water source and disposal, lack of gas lines, capital, and ad nauseum. Underneath all those factors is serious decline rates. Which are all reality.
Peak production won’t increase. How close are we to peak? Bakken is close, Eagle Ford can maybe get back to its peak, and there is some noise in the Permian that indicates some problems, at hand.
I remember getting involved in studying the Eagle Ford back in 2010. The maps and discussions indicated you could drill anywhere within the “oil window”, and make serious money. It took years for the fact that it was really not so homogeneous to become common knowledge. They have a bunch of maps for the Permian, now, and are singing the same song. That is, if you ignore some recent sounds of discord.
Goodness knows that I am deficient in my soothsaying abilities. But, I have learned to question others’ projections, as well.
“Argus Media reports that the Permian — where much of the shale growth will be concentrated — could face pipeline bottlenecks at some point in late 2019 or 2020 (they already exist, big time !). While there is ample room right now, producers are “going to run into another wall for infrastructure capacity,” Robert Barnes, the head of commercial crude for Magellan, said at the Argus Americas Crude Summit in Houston. That sentiment was echoed by Brent Secrest of Enterprise Product Partners, who said that at some point, there is “going to be a day of reckoning.”
No one interested in the outcome of the shale phenomena in America should take anybody’s opinion on face value, not mine, not Shallow’s, not Berman’s or Likverns, most certainly not the ridiculous, self-serving stuff you read in investor presentations; you more or less have to do your own arithmetic and come to your own conclusions. When you are able to do that…it becomes obvious it is not a sustainable situation. Hoping for higher prices to make a well, field, project, play model, economic calculation or press release work is a fools game, a game for only those that do not have anything to lose. Guessing is easy. Suffering the consequences when those guesses are wrong is the hard part. There are a dozen reasons that shale growth might not occur the way some think, starting and ending with there is simply too damn much of the stuff, sandwiched in between two slices of higher interest rates: https://oilprice.com/Energy/Crude-Oil/The-Biggest-Year-Yet-For-US-Shale.html.
Well, none of these are as bullish as some of the SA fracking cheerleaders. They think US blows through 11 million BOPD in 2018, not 2019.
I really don’t know, but I think passing 11 million BOPD and sustaining it will require many more active rigs, frack crews, water trucks, etc. The higher you climb the mountain, the tougher it gets.
Guym, Mike and Shallow sand,
I agree. Those are more reasons why a 1 Mb/d increase is not very likely.
Keep in mind my guess is for all LTO plays in the US and is 600 kb/d+/-100 kb/d. This is less than the previous 12 months where US output increased by about 700 kb/d at a lower average price level ($49/b) from Nov 2016 to Oct 2017.
Currently oil prices are about $58/b and for the past 6 months (June 2017 to Dec 2017) WTI has been rising at an annual rate of $26/b, should that rate of increase continue, WTI would be $84/b in Dec 2018. If the rate of increase falls by 50% the price would be $71/b in Dec 2018. My WAG is $77.5/b+/-$7/b for the Dec 2018 average monthly WTI oil price and an increase in US output to about 10,300+/-200 kb/d in Dec 2018. My estimate for Dec 2017 US output is 9700+/-100 kb/d.
On the other factors which get in the way of an increase, higher oil prices generally means higher wages, more investment, etc which tend to eventually remove some of the bottlenecks.
As I have said, repeatedly, there is so much shale product now, everywhere, stuffed in every empty 5 gallon bucket one can find, takeaway is a major problem in the Permian. I’ve seen it. https://rbnenergy.com/help-on-the-way-when-will-the-permian-need-new-gas-takeaway-capacity. Will they keep drilling LTO wells that are getting lighter, to export, while the TRRC turns a blind eye to its own flaring regulations? So far, yep.
The Permian shale play is now completely out of control, like the other two were years ago, you know, the two that are now pretty much both pooped out. Some operators out there are having to wait two days to get a vacuum truck full of water on location to work with. $4B of non revenue producing DUC’s were drilled in 2017…because there is nobody to frac them. They are scraping the sand off all of West Texas to shove back down into those wells and EACH one them now uses enough usable fresh water to satisfy the daily needs of 200,000 human beings. EACH WELL ! Essentially all this is occurring in an arid desert.
Dove said yesterday that his company and 15 others can drill 100,000 wells, costing 1 trillion dollars, in coming years. To sell it to China and Canada. America’s remaining resources are now being raped.
At least the USA still doesn’t really export oil – they import oil in brutto. For exporting there is even more fracking madness needed.
This exporting light stuff / importing heavy stuff is only a swapping, otherwise expensive investments would be necessary.
Like it or not – the future remains all about oil
‘Art Berman, 40-year veteran in the petroleum production industry and respected geological consultant, returns to the podcast this week to talk about oil.’
Headlines selling the “shale miracle” have sought to convince us that the US will one day eclipse Saudi Arabia in oil production. In short: cheap, plentiful oil is here to stay. How likely is this?
https://www.youtube.com/watch?v=gWC5SJjBdqc
Mostly spot on I think with one thing I don’t agree with: his position on difficulty in finding refinery capacity for light shale oil – I think he misses that a lot of the rest of the world is getting heavier so LTO is a good balance. I was surprised at how low he had Permian LTO reserves at 3.75 Gb, but that agrees almost exactly with EIA for 2015 (although they might have increased over the last two years). He quotes EF at 5Gb but that is quite a bit higher than EIA have (and likely to have fallen by another 1Gb by now).
Nate Hagens’ lecture at KAUST (Saudi Arabia). https://www.youtube.com/watch?v=2DpfsqjQbP0
Brazil production figures up to November were issued mid-month. They are still in slight decline. Campos decline is accelerating as the water cut increases and some of the older Santos fields are also coming off plateau. The decline should dramatically reverse this year as they have eight FPSOs due plus the Libra extended test FPSO production showing in the numbers. IEA have lower growth for Brazil than I would have thought likely so maybe they expect accelerated decline in the mature fields, or more likely slower ramp-up. The new FPSOs drop to only 2 in 2019 and none (I think) in 2020, so I can’t see how they’d be able to maintain a plateau through there, and ANP indicate still rising production, unless the ramp up on this year’s FPSOs takes a long time. That may well be the case if the subsea well completion rate controls the production rate rather than having a lot of pre-drilled subsea wells (predrilling that number would be difficult especially given PetroBras financial issues and cut bucks, and certainly the number of offshore rigs has been in slight decline).
Norway Production:
http://www.npd.no/en/news/Production-figures/2017/December-2017/
Preliminary production figures for December 2017 show an average daily production of 1 932 000 barrels of oil, NGL and condensate, which is an increase of 26 000 barrels per day compared to November.
Average daily liquids production in December was: 1 538 000 barrels of oil, 363 000 barrels of NGL and 31 000 barrels of condensate.
C&C production was down on last year and slightly down on forecast, probably mostly because of the Forties pipeline issue as some Norwegian production goes to the UK.
Hi George.
First cargo from Catcher.
http://www.premier-oil.com/premieroil/media/press/catcher-operational-update
One interesting thing for Norway is how fast some of the recently started fields have declined. The detailed field data is a month behind so this is only through November, and Goliat has a significant impact as it was shut down because of safety issues and has now restarted, but nevertheless there are some pretty short plateaus and quick decline rates here.
About 1.7% decline in crude oil production for 2017. Ramp up of small greenfields has had less pace than expected. Gina Krog (+ 13 kbd), Edvard Grieg (+ 20 kbd), Ivar Aasen (+38 kbd) and Goliat with all its problems (-10 kbd). Some aggressive drilling campaigns in some brownfields (Alvheim, Grane) has increased production with + 50kbd, and kept the total decline in production from being larger. Infill drilling in super mature Ekofisk and Oseberg was done mostly in 2016 and production is flat for these fields in 2017. I expect more or less the same total decline for 2018 (for crude oil) as there should be a potential for 100 kb ramp up from mentioned greenfield developments also including Maria (50 kbd), but less aggressive infill drilling (or maybe tiebacks is the right word) in mature fields should be visible in production numbers. I may have missed some smaller projects, most likely a few of them will come online in 2019 rather than 2018.
Decline rates are steep on most fields no doubt about that. The largest fields that are in tail production phase are much more stable than the smaller fields though.
Thanks – I don’t know anything due this year except maybe Orman Lange subsea pumping, which would be for gas – and welcome here in the UK – but I haven’t heard much about it for some time so could be wrong. Next year there’s a few: Oda, Fenja, Martin Linge (delayed from this year and biggest at 80 kbpd), Hanz and Trestakk. They normally find one or two smaller fields that get tied in immediately, but don’t add much to the overall numbers.
In the news today
Weekly Petroleum Status Report
Saxo charts: https://pbs.twimg.com/media/DUURoSoW0AAORKP.jpg
EIA pdf file: http://ir.eia.gov/wpsr/overview.pdf
China and India – year/year demand growth – Scotiabank
https://pbs.twimg.com/media/DUT9nCAXkAEYYid.jpg
FT – Cushing draws are due to the ramp up of the Diamond pipeline drawing approx 200k b/d extra from hub or 1.4m barrels a week
Looking at monthly inventory changes, January usually shows an overall build of crude + products.
US ending stocks, week ending January 19th
Crude oil down approx -1 million barrels
Oil products up approx +3.5 million barrels
Overall total, up approx +2.5 million barrels
Chart on Twitter https://pbs.twimg.com/media/DUVJfUnWsAASWd1.jpg
January 2018, the overall total (crude + products), is up less than +5 million barrels, so far, for the month. It’s a small build for the time of year.
And Brent jumped above $70 this morning.
Yeah, the light yellow line (2018) is not in there, but I can draw my own. Significant.
The dollar freefall since start of year is doing things to oil.
Saudi energy minister says 4 to 5 million barrels per day of incremental oil supply needed each year (demand growth + decline rates). Speaking at Davos2018
With about 1% per year increase in consumption, that number suggests global decline rate of only about 4%. Net, not gross. Includes infield drilling.
4 mbpd is about 5% of 92, minus the 1% annual consumption increase, leaves 4%.
About 1% lower than previous quotes.
Platts – 24 Jan 2018 – Smaller operators push Bakken output outward
rising prices, along with the start of the Dakota Access Pipeline and well productivity improvements, have pushed new companies, mainly smaller operators backed by private equity firms, into acreage long ignored by the state’s prominent producers.
Relatively smaller operators, either unable or unwilling to acquire so-called Tier 1 acreage in the core of the core, are looking at less costly Tier 2 and even Tier 3 areas and considering adding rigs on the outskirts of the Bakken’s most prolific plays.
“Their business model is to prove up acreage, drill some great wells, show that the acreage works on a consistent basis and then have some company buy them out,” said Jonathan Garrett, director of US upstream research with Wood Mackenzie.
And while operators are moving to new areas, the wells they are likely to drill are expected to have a lower initial production rate, according to the North Dakota authority’s study. For example, in 2016, operators would not produce wells which average below 900 b/d for peak 30-day production. Operators in 2018 are expected to operate wells with initial production rates as low as 500 b/d, according to the analysis.
Platts: https://www.platts.com/latest-news/oil/washington/smaller-operators-push-bakken-output-outward-27908502
This is no different than the Eagle Ford. Big operators have sold some of their “non core” assets to small producers backed by stupid money. Very similar to the Austin Chalk scams during the ‘80s. Oil produced to put in their presentations, but they will wait forever, or never, to get it back. I am sure that is happening in the Permian, too.
A method to continue writing red ink, when there is a danger of writing a black 0 while drilling in the core area?
Not really sure of the question. To summarize, lets assume their are three tiers of oil leases. Tier one, lets say, would break even or make a profit at $40-50, which the large operators are drilling in currently. Tier two would probably be good at anything above $70, and they are not drilling there much. Only enough to hold acreage per lease terms. Tier three would be questionable, or not close to good at $100 a barrel. There is no reason for the large company to drill wells to hold these leases, as they are dead ends, unless oil goes to 150-200 a barrel. That’s a bad bet, so they sell off these properties to smaller companies, who have funds who invest in it. Or, stupid money, because they are not likely to get it back.
My WAG is that there is a very small area of tier one in any field. Tier two would not be much bigger, leaving the vast majority in Tier 3.
There are signs that fracking capacity is increasing, but what would 8% growth be in terms of oil production?
Bloomberg – January 14th – Fracers arise from oil-price rout on a course to dominate 2018
North American fracing capacity will probably grow 8% this year to 24 million horsepower, according to Tulsa-based industry consultant Spears & Associates.
Prices charged for fracing climbed nearly 30% last year and are on pace to grow another 5% to 10% this year, said Samir Nangia, a director at industry consultant IHS Markit Inc.
http://www.worldoil.com/news/2018/1/14/fracers-arise-from-oil-price-rout-on-a-course-to-dominate-2018
Houston Chronicle – By Jordan BlumJanuary 25, 2018
ProPetro, a Midland oilfield services company, said it could double its number of fracking crews from 10 at the beginning of 2017 to 20 by the end of this year. ProPetro’s 17th fracking fleet is about to come online. Each fracking fleet requires a crew of about 30 people, about 15 for each 12-hour shift. ProPetro has tripled its workforce in less than 18 months, from 400 to 1,200 – all working in the Permian.
http://www.houstonchronicle.com/business/energy/article/Sand-water-and-horsepower-Welcome-to-the-year-12524642.php
Houston Chronicle – By Jordan Blum – January 22, 2018
Miller said that Halliburton recently built a “handful” of new fracking fleets to help meet the growing demand, but he argued that the company will remain disciplined and will not overbuild.
http://www.houstonchronicle.com/business/energy/article/Halliburton-adds-its-optimism-to-oil-industry-s-12516388.php
Sounds like a shoot out between E&Os and frackers of who gets the benefits of the oil price increase.
Canada NEB – January 2018 – Canada’s Energy Future 2017 Supplement: Oil Sands Production
2.3 New and Legacy Bitumen Production
Due to its near-zero decline rate, nearly all of the bitumen production that is currently online, whether mined or in situ, will remain so for the majority of the forecast period.
Production in 2016 averaged just under 2.6 MMb/d from mining, in situ and primary/EOR. Figure 2.3 shows that the volume from current projects increases slightly over the projection period because of process and technology improvements and the ramp-up in production from projects that have yet to reach full capacity, reaching 2.9 MMb/d by 2040.
The largest contributor to growth in the oil sands will be expansions to existing in situ facilities. At 1.2 MMb/d, expansions will account for 28% of all oil sands production by 2040.
Entirely new projects (greenfield projects) will also contribute to growth, although they are more costly to construct than expansions and as such are expected to account for a much smaller share of the growth, reaching only 0.4 MMb/d or 9% of all production by 2040.
http://www.neb-one.gc.ca/nrg/ntgrtd/ftr/2017lsnds/index-eng.html
Prices and interest heating up worry me, so I dumped my leaps for a little over 100%. Sit back and wait to see what happens for awhile.