All OPEC data for the charts below are from the OPEC Monthly Oil Market Report https://momr.opec.org/pdf-download/
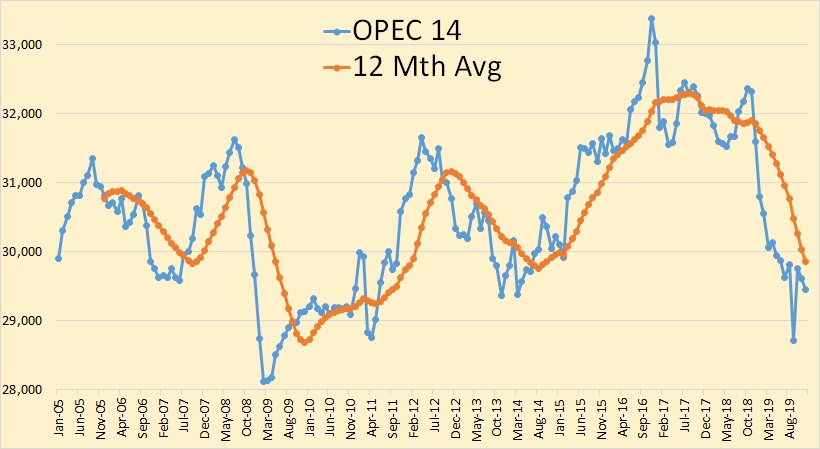
OPEC crude oil production continued to slide in December.
OPEC production was down 161,000 barrels per day in December but that was after November production had been revised upward by 54,000 barrels per day.
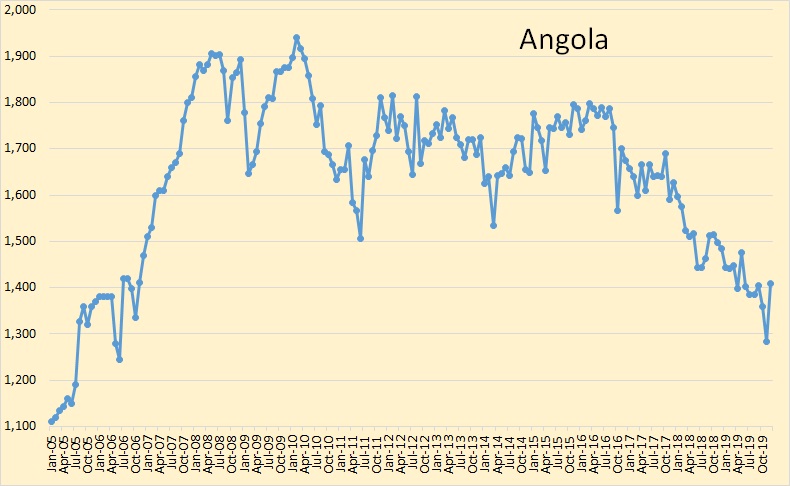
Angola had the largest gain in December, up 125,000 barrels per day.
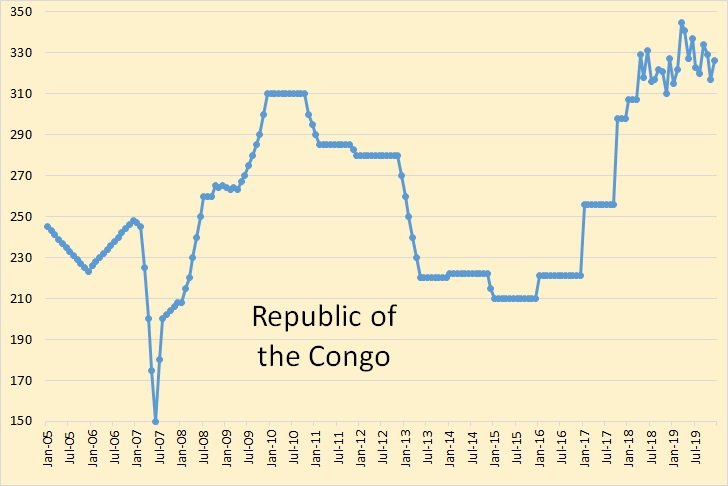
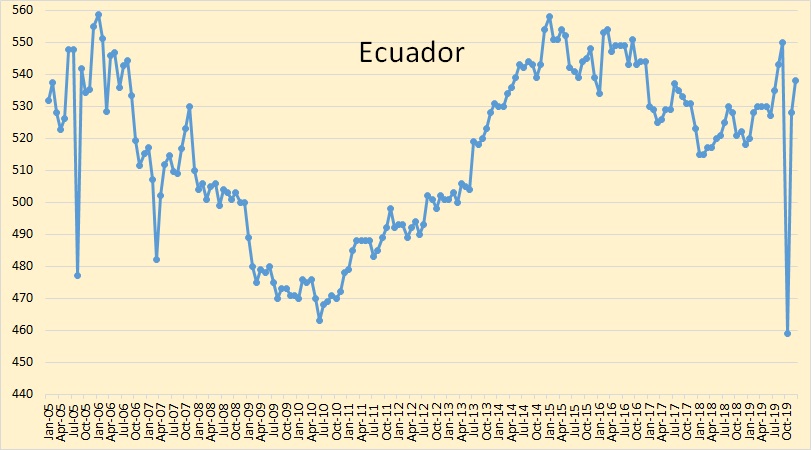
This will be Ecuador’s last month with OPEC. In January it will be the OPEC 13. This will not cause a drop in OPEC production as Ecuador’s historical production will be removed from all OPEC data.
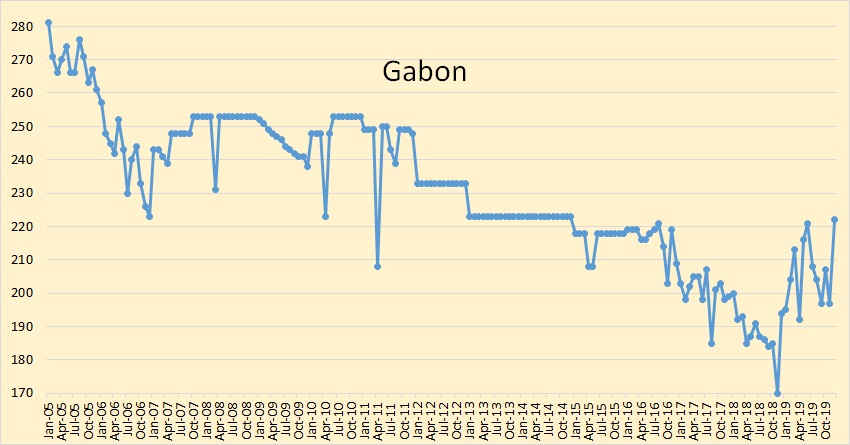
Gabon was up 22,000 barrels per day in December, a big jump for them.
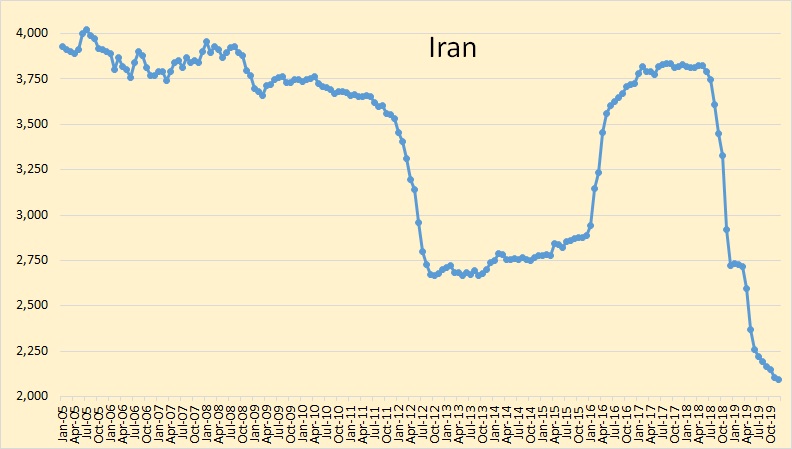
Iran continued its slow decline. Political problems have increased in the area but I expect they will have little effect on oil production.
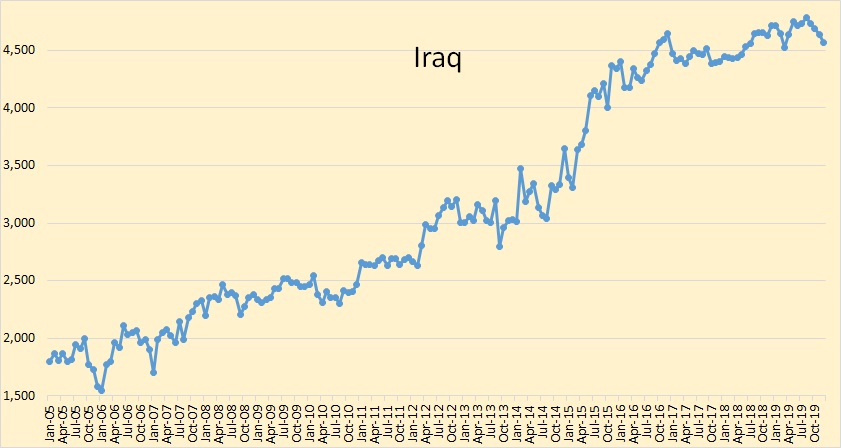
Iraq is still producing flat out. They reached 4,642,000 barrels per day in December 2016 and have been close to that number every month since.
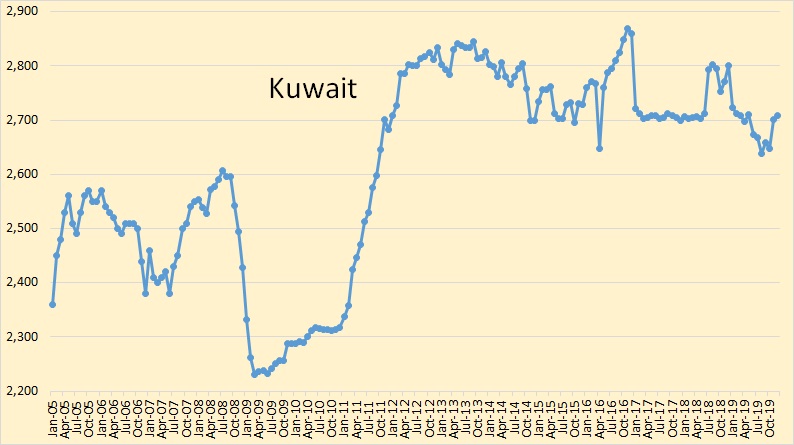
Expect Kuwait to hold at close to this level until their share of the Neutral Zone comes online. Whenever that might be.
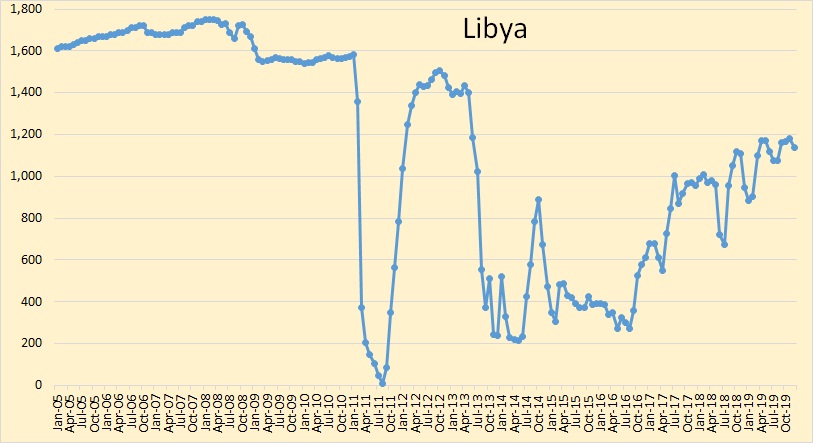
Libya is exempt from OPEC quotas due to political problems. However I doubt they could produce much more if they didn’t have any such problems.
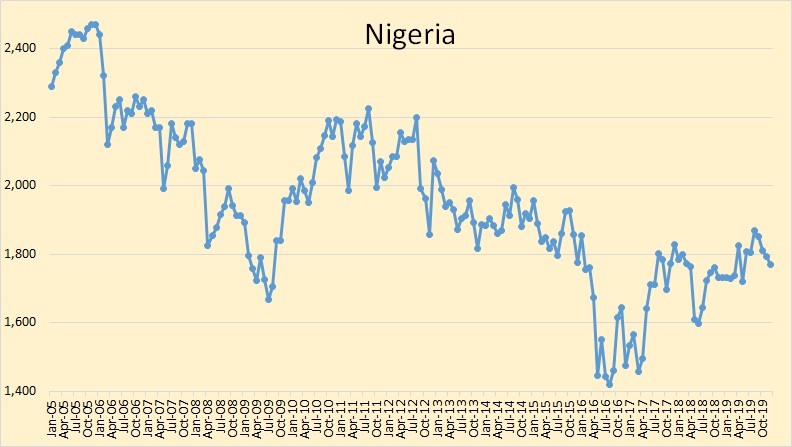
It’s hard to tell what’s going on with Nigeria.
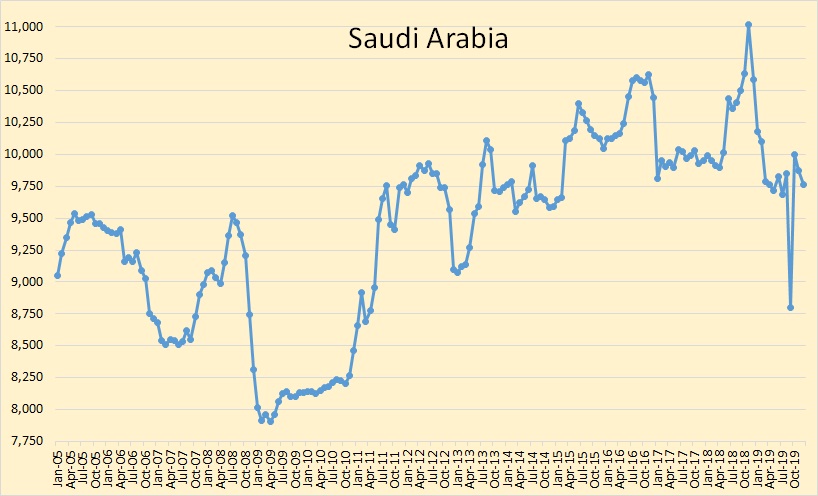
Saudi Arabia seems to be settling at around 9,750,000 barrels per day, a point which they reached in April 2019. They were down 111,000 barrels per day in December.
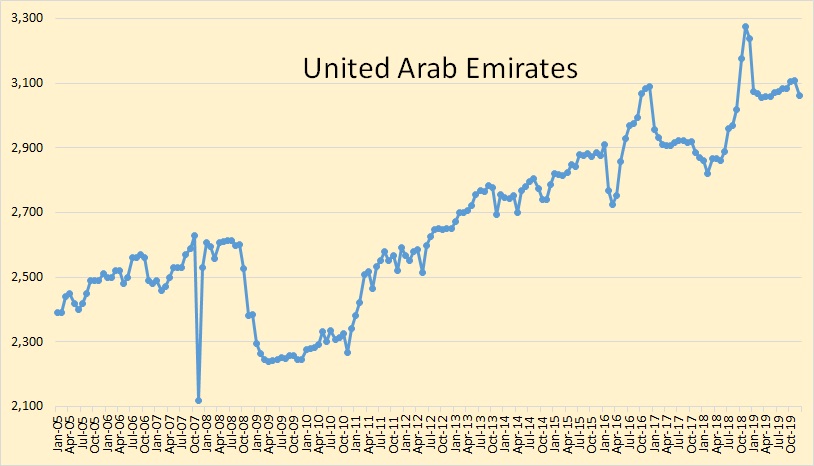
The UAE was down 46,000 barrels per day in December.
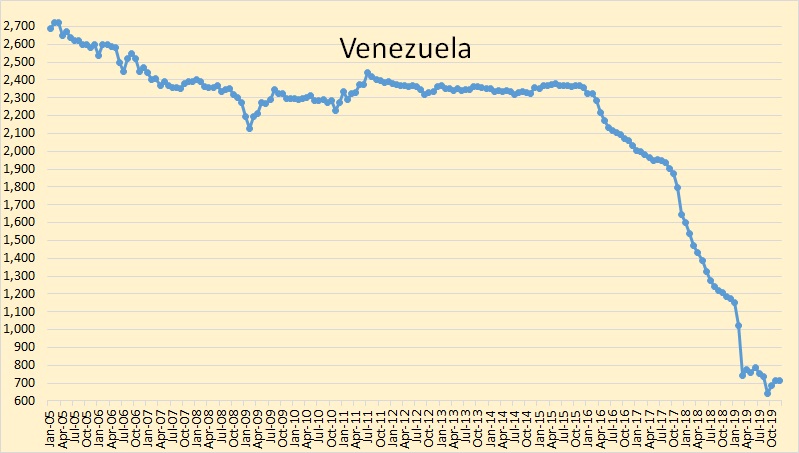
Venezuela has been holding fairly steady at around 700,000 barrels per day, a level they fell to in March 2019.
According to the OPEC Secretariat, World oil production saw a huge increase during the last three months of 2019. They say December 2019 total liquids production will be 1.55 million barrels per day above December of 2018. We only have World data through September 2019 so it’s hard to see where this increase will come from. This would require over a 4 million barrel per day increase over September production. And they got this information via direct communication from the UK, Norway, Canada, Mexico, and the US. I don’t believe it. But we shall see.
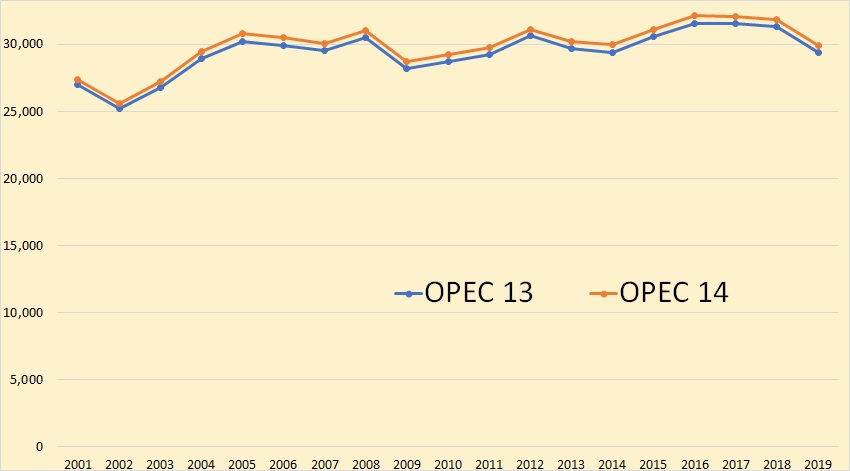
The above OPEC 13 is just OPEC yearly average from 2001 less Ecuador. Not much difference. But you can see that OPEC has been relatively flat since 2005. In fact, they are now well below their 2005 level. Yet they claim to have almost 80% of the world’s proven reserves.
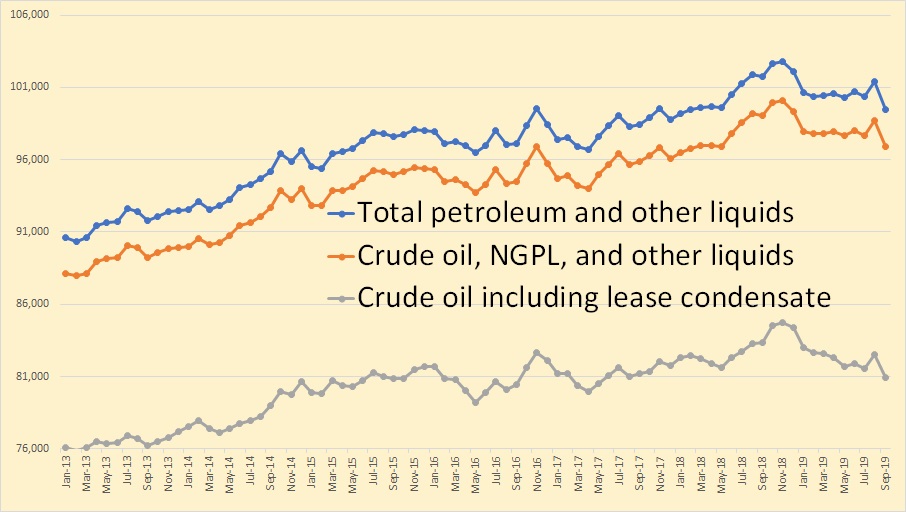
The above chart is from the EIA and is through September 2019. C+C has only a small increase since the last quarter of 2015 but is now below that late 2015 level. Total liquids have had a slightly better increase.
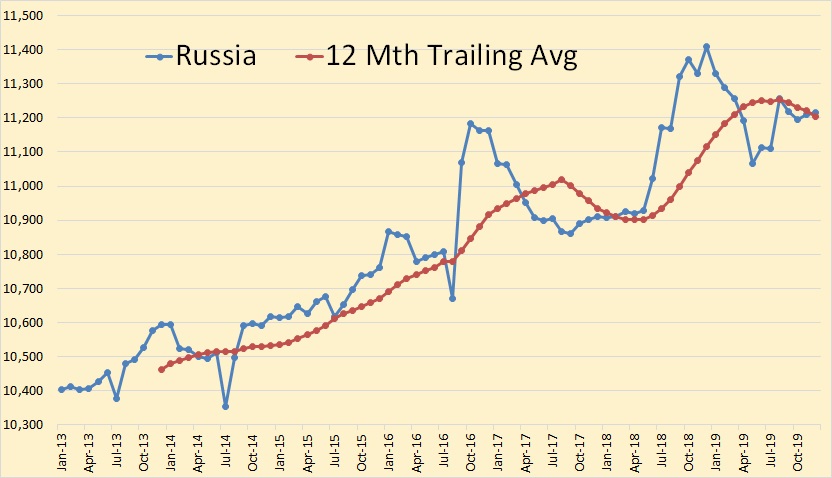
Russia through December 2019. They are at the point they said they hope to hold for the next 4 years.
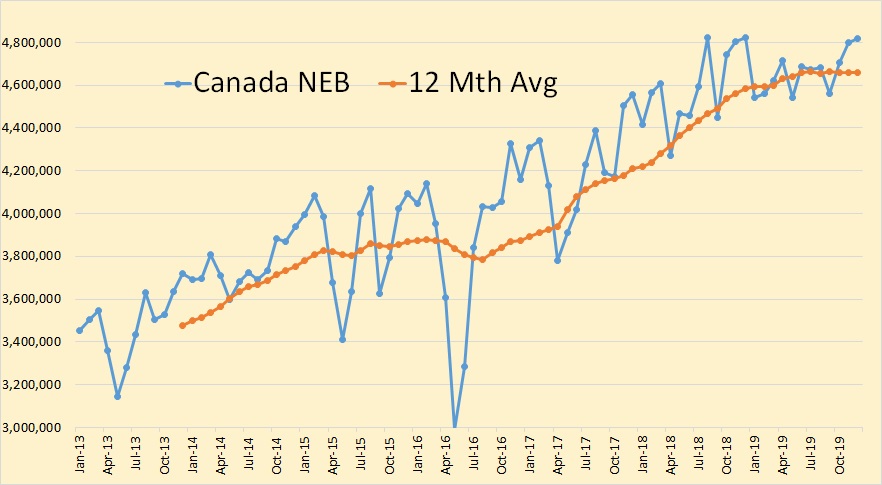
Canada according to their National Energy Board. The last few months are a projection made in November 2019.
285 responses to “OPEC December 2019 Oil Production Data”
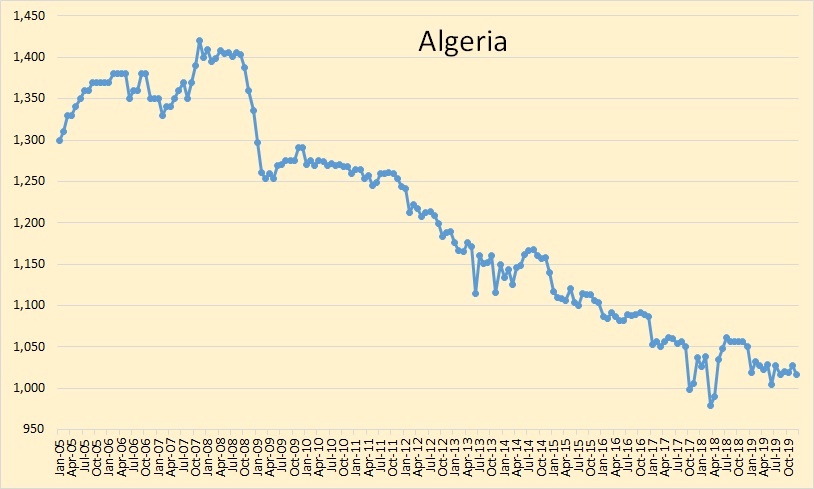
“Algeria had the largest gain in December, up 125,000 barrels per day.”
Did you mean Angola?
Yes, corrected. Thanks.
And Britain?
I understand they have increased a lot their production in 2019, from the North Sea.
Yes, I said OPEC got its information through direct communication from the UK, Norway, Canada, Mexico, and the US.
OECD stocks in days of forward consumption (left axis) and real WTI Oil Price in 2018$/bo (right axis).
We can see a rough correlation between OECD stock levels and WTI Oil prices.
You could do a simple two-way linear regression with time for one independent (x) variable and OECD stocks as the other, and price as the dependent variable (y).
Might clarify the strength of the price effect.
Nick,
Hard to chart that, but looking a price vs OECD stocks shows the stocks are only a partial explanation, with perhaps 40% of the change in price explained by changes in OECD stocks (in terms of days of forward consumption). A lot may depend on market expectations, as peak oil approaches the market may start to expect higher oil prices for a 5 to 10 year period, then as EVs grow in number and demand growth for oil stops and eventually decreases faster than crude supply, price expectations will fall again.
Expectations are difficult to measure.
Chart
Nick,
If the chart is split into two periods (2Q2013 to 2Q2016 and 3Q2016 to 3Q2019), where we might hypothesize a shift in market expectations, we find R^2 is 88.35% for the early period and 62.03% for the later period for the regression of OECD stocks in days of ford consumption vs WTI oil price in 2018$/b.
The hypothesis for the shift in market expectations would be the belief that the US tight oil miracle would lead to a general glut of oil supply for the long term.
This market expectation is incorrect, but if one reads the mainstream media, it is what is believed by most market players who affect the price of oil.
It would be handy if there were years (or at least the last digit of the year) on the data points. And in terms of your analysis breaking it into two ranges, including the tight oil production on the data points would make your analysis stronger.
OPEC Oil monthly report has been pessimistic in it’s oil supply predictions
https://www.opec.org/opec_web/static_files_project/media/downloads/publications/MOMR%20January%202018.pdf
They predicted non OPEC oil production for 2018 at 56.7 mb/d in fact production was 60.1 mb/d
https://www.opec.org/opec_web/static_files_project/media/downloads/publications/MOMR%20June%202019.pdf
Their 2019 prediction was for non OPEC production to reach 61.88, now they believe production averaged 62.2 mb/d.
It is amazing to think non OPEC oil production has increase by over 7 mb/d in 4 years.
Wayne,
The numbers got revised. Another way to look at it is the expected increase in non-OPEC output in Jan 2019. For 2019 they expected an increase in all liquids non-OPEC output of 2.1 Mb/d from 2018 to 2019 in the Jan 2019 MOMR. The estimated change in all liquids output from non-OPEC producers for the Jan 2020 MOMR is 1.86 Mb/d, so from this perspective the Jan 2019 outlook was optimistic rather than pessimistic. Likewise it seems highly likely that the Jan 2020 MOMR forecast that 2020 n0n-OPEC output(all liquids) will be 2.35 Mb/d higher than 2019 output will also be optimistic.
Another problem with OPEC forecasts is they use all liquids, NGPL and processing gains should be excluded, the important number is C+C output. If NGL and biofuels are to be included, an adjustment should be made for their lower energy content, on average those barrels contain about 78% of the energy of an average barrel of C+C.
Dennis
MOMR 2019 figure is still an estimate. 2018 figures were confirmed through 2019. We will have to wait a while to see final stats.
At the moment they believe non OPEC increase in production will exceed increase in global demand. Prices suggest supply is plentiful at the moment.
It will be interesting to see how close their prediction is for this year.
Tom Whipple writes a weekly blog for the Post Carbon Institute. For those who do not know Mr. Whipple, he is a retired CIA analyst and reads this site. My question to you and Mr. Whipple is that “we evidently are approaching the real Peak Oil. Daniel Yurgen talks about an undulating plateau and I seen comments here talking about increasing and decreasing oil prices as higher prices bring more production which helps to lower prices etc. Are we approaching that undulating plateau?”
PeterEV,
Always difficult to predict. It also depends on how the plateau is defined. If we say the plateau in World C+C output is 84 Mb/d+/- 2 Mb/d, then we may be at the start of a plateau that lasts from 2018 to 2032, but much depends on future oil prices as well as the price of alternatives to oil, the price of batteries, natural gas, wind, solar, etc along with public policy demand for transportation and energy, adoption of greater efficiency in the use of energy, etc. The problem is multifaceted, complex, and likely non-linear, and the answer will only be known 10 to 20 years after it has occurred ( and even then history is often understood in different ways by different observers).
My guess is a peak around 2023 to 2027, and we won’t really know until 2037 or so, if that guess is correct. Others of course will have different guesses than mine.
Hi Ron
Thanks for the post. What do you make of this.
https://twitter.com/TrentPJacobs/status/1217561358511804426?s=20
That is all just hearsay by people like you and I. I have seen nothing official one way or the other on ARAMCO shale. I rather doubt it but we shall see.
Shale Oil barely is hardly economic in the Permian, Bakken and Eagle Ford basins in the USA, with all the advantages of infrastructure, technology, market access, and business friendly regimes that those areas possess. How it can work in Saudi is beyond me, unless they happen to have super boomer shale wells.
BP Statistical Review of World Energy 2019 cites proved reserves of 303.3 billion barrels for Venezuela vs 297.7 billion barrels for Saudi Arabia. Part of source for: “Yet they claim to have almost 80% of the world’s proven reserves.”
https://www.bp.com/en/global/corporate/energy-economics/statistical-review-of-world-energy.html
That probably does not include US Kerogen (aka oil shale)
USGS: “Estimated total in-place resources are about 1.5 trillion barrels of oil for the Piceance Basin, about 1.3 trillion barrels of oil for the Uinta Basin and 1.4 trillion barrels of oil in the Greater Green River Basin. ”
https://www.usgs.gov/centers/cersc/science/oil-shale?qt-science_center_objects=0#qt-science_center_objects
David,
In place resources are very different from recoverable resources, not an apples to apples comparison.
Very little of the resources you cite are likely to be recovered.
See section 3d of paper linked below where they caution that the large “TRR” attributed to kerogen oil by the IEA (1073 Gb in figure 9 of paper below) is not likely to ever become economically recoverable. Quote from paper below (but the whole paper is very good):
This is not simply an issue of the steeply rising production costs of poorer quality resources because technical and net energy constraints may make some resources inaccessible and some production rates unachievable regardless of cost. Kerogen oil is especially constrained in rate and net energy terms and may never become economic to produce, yet it accounts for 19% of the IEA estimate of remaining recoverable resources (figure 9). Hence, a critical evaluation of future supply prospects must go beyond appraisals of aggregate resource size and examine the technical, economic and political feasibility of accessing different resources at different rates over different periods of time.
David L Hagen,
Well done on the U.S. Kerogen oil shale reserves. This idea of Peak Oil is all MUMBO-JUMBO. Keep up the excellent work. We need more smart people like you RUNNING THE SHOW.
Don’t let these Peak Oil Conspiracy Theorists influence your thinking. Truth be told, I get my info straight from the TOP. When someone asks me what sort of “TOP” people, I just say, “We got TOP MINDS working on it.” Just take my word for it.
However, while there might be a few trillion barrels of oil shale reserves in the United States, that’s peanuts compared to the massive amount of Methane Hydrates. According to some estimates, there are upwards of 18,000 trillion barrels of oil equivalent reserves held in the world’s Methane Hydrates.
18,000 trillion barrels of oil equivalent in Global Methane Hydrates
2+ trillion barrels of oil equivalent U.S. oil shale
298 billion barrels of Venezuela oil reserves
Thus, we can plainly see here that oil shale and Venezuela’s oil reserves are just mere “Pussies” compared to Methane Hydrates.
We have tens of thousands of years of CARBON BURNING RESERVES in the world. However, once we run out of those reserves, there is plenty of geothermal heat we can tap into from the Earth’s core. Of course, it might be important that the center of the Earth’s Core stay very hot, but I doubt the drive for FREE MARKETS and CORPORATE PROFITS should keep us from tapping into and exploiting all these energy reserves.
steve
They have been trying to extract gas from Methane Hydrates for 20 years.
Do you know how much gas they succeeded in producing so far?
https://www.cbc.ca/news/technology/canada-drops-out-of-race-to-tap-methane-hydrates-1.1358966
Japan has admittedly done better, it has produced as much in 7 years as the world uses in 10 seconds.
Wayne,
While you may bring up some “RELEVANT” data, it’s just a matter of time before we are pumping out trillions of Cubic feet of Methane Hydrates. You watch.
All we have to do is “TURN ON” the massive methane hydrate spigot, and all our troubles will be over.
So, let’s stop wasting time on the PEAK OIL CONSPIRACY THEORIES and start pumping out the Methane.
Steve
Wayne, . . . dude . . .
Yes SR, natural gas will be produced wherever it can. Russia is looking toward dominance in the LNG business which will also be pursued by others.
As far as methane hydrates go, the resource is huge and drilling is proceeding to study ways to unlock the methane.
https://www.alaskajournal.com/2019-05-14/fire-ice-research-advances-unlocking-methane-hydrate
https://www.prnewswire.com/news-releases/the-methane-hydrate-extraction-market-is-projected-to-reach-66-901-8-thousand-cubic-meter-by-2025–growing-at-a-cagr-of-6-3-from-2021-to-2025–300950582.html
GoneFishing,
Agreed about the massive Methane Hydrate Resource potential. You are someone else with their HEAD SCREWED ON CORRECTLY.
The only unfortunate aspect of Methane Hydrate mining or resource exploitation is that some “Environmental Wackos” are saying it will destroy the fish estuaries or fish breeding grounds.
Well, the hell with the Fish, or most wild animals. We don't need fish, we need E-N-E-R-G-Y. We can create fish farms and manufacture all the fish protein we need. Wildlife is just in our way of TOTAL EARTH EXPLOITATION.
So, I let's start TEARING UP these Methane Hydrate deposits and the hell with the fish.
steve
Just because I can see what will probably be pursued does not mean I agree with it. One would have to be totally insane or mentally incompetent to even attempt to exploit the methane clathrate resource.
“Well, the hell with the Fish, or most wild animals. We don’t need fish, we need E-N-E-R-G-Y. We can create fish farms and manufacture all the fish protein we need. Wildlife is just in our way of TOTAL EARTH EXPLOITATION.”
Steve, you are cheering on the destruction of your own species and much life on Earth. Enjoy your part in the First Great Extermination of life on Earth.
GoneFishing,
LOL.. ah. I see. Please reread my past three comments and insert the word, S-A-R-C-A-S-M.
I was waiting to see if someone finally CAUGHT-ON.
steve
No thanks.
Spouting the attitude of business and financial leaders in the world is not sarcasm.
I caught yout sarcasm even as far as from France. 😀
Amazing that people did not get it.
/s – end of sarcasm would have helped for people who don’t know him.
That would be like putting a WARNING sign on a rattlesnake.
LMAO!!
These 2 posts compare BP’s Statistical Review with Rystad’s
24/10/2019
Uncertainties following the Abqaiq attack have shrunk the world’s safe oil reserves by around half (part 2)
http://crudeoilpeak.info/uncertainties-following-the-abqaiq-attack-have-shrunk-the-worlds-safe-oil-reserves-by-around-half-part-2
16/10/2019
Uncertainties following the Abqaiq attack have shrunk the world’s safe oil reserves by around half (part 1)
http://crudeoilpeak.info/uncertainties-following-the-abqaiq-attack-have-shrunk-the-worlds-safe-oil-reserves-by-around-half-part-1
Now more uncertainties are added with more missiles flying
US troops sheltered in Saddam-era bunkers during Iran missile attack
https://edition.cnn.com/2020/01/13/middleeast/iran-strike-al-asad-base-iraq-exclusive-intl/index.html
“When Iran admitted Saturday that its military shot down a Ukrainian airliner, killing 176, a high-ranking officer stated that the plane was misidentified by an air defense battery as a cruise missile. If that’s true, that’s not the end of the soldiers’ poor judgment. A tragic irony, defense experts say, is that if they really believed they were facing a cruise missile, they fired from a distance at which they most likely would have missed such a small, maneuverable target, throwing their interceptor missiles away”
https://www.forbes.com/sites/jeremybogaisky/2020/01/15/if-iranian-troops-really-thought-ukraine-flight-752-was-a-cruise-missile-they-made-a-hail-mary-shot/#27663e282270
https://www.zerohedge.com/energy/norway-suffers-setback-quest-arctic-oil-discoveries
A down tick in estimated Arctic reserves.
Number Of DUC Wells Plunges In Latest Sign Of Shale Distress
Over the past six months, the number of drilled but uncompleted (DUC) wells across the U.S. shale patch has been steadily declining in a fresh sign that shale producers have stopped the relentless drilling of wells.
The slowdown in drilling is expected to weigh on the fourth-quarter results of the world’s major oilfield services companies working on well completions in the key U.S. shale regions, Bloomberg reports, citing analyst forecasts.
The number of DUC wells in the seven key shale regions dropped to 7,574 in November, down by 131 from the October DUC well inventory of 7,705, according to the latest data from the U.S. Energy Information Administration (EIA).
According to Bloomberg estimates based on EIA data, the number of DUC wells dropped from a recent high of 8,429 in May 2019 to 7,574 such wells in November. This drop in just six months was the steepest fall in DUC wells numbers for the past three years, Bloomberg has estimated.
Analysts now expect the largest oilfield services providers to report in their Q4 earnings later this month continued decline in fracking and completions activity. This would be yet another sign that U.S. oil producers have slowed drilling as investors want returns from the U.S. shale patch, not crude oil oversupply.
Halliburton is expected to report a fall of 29 percent in its earnings in Q4, according to analysts who spoke to Bloomberg. Baker Hughes, which spun off its fracking services business, on the other hand, is seen reporting higher earnings.
The slowdown in U.S. drilling and completions services is expected to be in sharp contrast to recovering international and offshore oilfield services segments.
The world’s biggest oilfield services provider, Schlumberger, started flagging last year the evident slowdown in North America’s drilling growth. For Q3, Schlumberger said that international activity and its greater exposure to drilling outside U.S. shale drove its revenues higher, while North American revenues declined.
By Tsvetana Paraskova for Oilprice.com
Ron
The rig numbers in the article include gas ones. Attached is a chart for primaryly oil producing basins. The oil DUCs peaked in May 19 at 7,617 and in November 19, they were down to 6,885. The trend is the same, down.
Is it possible to estimate the viability of the remaining DUCs?
One ‘analyst’ on my twitter feed is forecasting that “6.5-7k DUCs are non viable”.
doodles,
Not really possible without a ton of work. Doubtful in my opinion that the 6500 to 7000 DUC number is correct for tight oil plays, that would imply none of the DUCs left are viable, a new DPR will be out on Jan 21, if the DUC count is unchanged perhaps that estimate is correct, I think perhaps there are a number of DUCs that may not be viable at current prices, perhaps as many as 25% of the 6900 remaining as a WAG.
Doodles, I do not agree with Dennis on this. Chunks of the source rock always come up with the mud. All they have to do is examine it. They have engineers trained to do that. They have a pretty good idea of how productive the well will be. So naturally, the most promising DUCs will be fracked first.
However I seriously doubt that many DUCs are non viable. I would expect some but that just sounds like way too many. But, I really have no idea how many are non viable.
Ron,
Do you have the information on the core samples? As far as I know that data is not publicly available. if someone had the information for all 6900 DUCs, they could perhaps easily do this. As I do not have the information, it would not only not be easy, it would be impossible.
Dennis, I have been hearing about core samples for years. I was mistaken about the mud. Samples are taken separately and not taken from the mud. There are many articles online about the process but here is the best one I could find.
How Does Core Analysis Work?
A way of measuring well conditions downhole by studying samples of reservoir rocks, core analysis gives the most accurate insight into the porosity and permeability, among other characteristics, of the well.
A core is a sample of rock in the shape of a cylinder. Taken from the side of a drilled oil or gas well, a core is then dissected into multiple core plugs, or small cylindrical samples measuring about 1 inch in diameter and 3 inches long. These core plugs are then dried and measured.
In order to complete a core sample, drilling must be halted at the top of the subsurface of the reservoir. The drillstring is removed from the wellbore, the drillbit removed and a rotary coring bit is attached in its place. Similar to a drillbit, the rotary coring bit consists of solid metal with diamonds or tungsten for cutting at the reservoir rock; but unlike a drillbit, a rotary coring bit has a hollow center.
SNIP
After the core sample has been cut from the well, the drillstring is raised, and the rotary coring bit, barrel and catcher are removed — and the core sample is retrieved. The drillbit is reattached, and drilling can commence again.
As the article indicates, samples are taken several times during the drilling process. This article talks about reservoir rock where shale wells are in the source rock, but I am sure the process is the same. Also, they would take samples at several places along the lateral.
No, I do not have any data from any DUCs and I am sure no one has data on all the DUCs. That data would be confidential to each individual company that owns the DUC.
However, it would only be common sense that there are many DUCs that are not viable, at least not at current prices. When any given area is drilled up and a company moves to a new location, they would only a vague idea as to how profitable that area would be. They would have to drill a well, take samples first. If a well looked to be only marginally profitable, they might abandon it or just let it stand hoping the price of oil would go up high enough to make it profitable.
Ron,
I am fairly sure that with tight oil plays is is more complicated than just taking core samples, not saying it is not one piece of the puzzle, only that it is different than conventional wells. I believe they need more information than core samples to judge the potential EUR of a well.
I agree some proportion of DUCs might not be profitable at current oil prices, whether the proportion is 10%, 25%, or 50% we can only guess.
The answer to doodles original question is:
No.
Doodles question was:
Is it possible to estimate the viability of the remaining DUCs?
An estimate is all you can hope for. They would never drill or frac any well unless they had an estimate that the well would be profitable. The core sample gives them a damn good estimate.
The answer to Doodles question is:
Yes.
But as I said, we disagree on that point. And it is clear we will continue to disagree. 🙁
Ron,
We are interpreting the question differently.
I understood the question as, “can anyone at Peakoilbarrel make an estimate of the viability of existing DUCs?”
I will answer only for myself, and that answer is no.
In principle someone might be able to make such an estimate for all remaining DUCs, but my guess is that the estimate would be proprietary and would require a stiff price in order for it to be shared.
If you find such a report let us know. 🙂
And we certainly do disagree that the core sample will be the key factor, for conventional wells probably this is the case.
It is likely that the productivity of nearby completed wells gives the best estimate of the productivity of DUCs. Using data from the shaleprofile premium service, it might be possible to make such an estimate with a considerable amount of work.
I do not have access to that service, it costs about $279/month for the premium service, too expensive for me.
I understood the question as, “can anyone at Peakoilbarrel make an estimate of the viability of existing DUCs?”
I understood the question to be: Is it possible to estimate the viability of the remaining DUCs?
That is a verbatim quote of Doodles question.
My answer to that question is “Yes”, the owners of the DUCs definitely have an estimate of the viability of the DUCs they own. And I clarified my position with this quote from one of my posts above:
No, I do not have any data from any DUCs and I am sure no one has data on all the DUCs. That data would be confidential to each individual company that owns the DUC.
I hope this makes my position clear. Please accept my apologies for any misunderstanding my posts may have caused.
Ron,
No apology necessary. I was reading something that wasn’t there.
Many things are possible in principle,
I thought he was asking if we have such an estimate, I do not.
Using DUC data from EIA for tight oil regions only we get the following trailing 12 month average completion rate for tight oil wells.
https://www.eia.gov/petroleum/drilling/
Vaca Muerta news. New Argentine Prez will submit legislation for February’s sessions of Parliament that will define VM policy and smooth procedures for further investment. Mostly blah blah, but it does put a date on when the new govt will have an official position.
The Oil Workers Union is making noises about strikes if even one person is laid off by any of the companies. The union supports the new president and the new president can shut this off whenever he wants, and probably will. The Union leadership seems to be looking for attention.
Will The Permian Peak This Year? Bold mine.
Ticker: Just a few years back, the U.S. shale industry was drowning in a sea of hubris, with pompous experts making outrageous claims such as the Permian Shale is a near-infinite resource thanks to the basin’s explosive production growth in the latter half of the last decade.
Investors are now learning the hard way that the key to prognostication is to sound certain even when you know very little.
Analysts and investors who still harbor the “Too Big to Fail” mentality as far as U.S. shale is concerned are, sadly, mired in a depressing cognitive dissonance. The signs of the time are everywhere, and the question is no longer whether shale production can continue indefinitely but rather how much longer before it finally gives out.
One big investor has a rather depressing answer to the latter.
Adam Waterous, CEO at Waterous Energy Fund, says US shale production will peak in 2020 and then begin a steep decline thereafter. He argues that the financial position of Permian oil has clearly become untenable and production is much closer to peaking than many current forecasts suggest.
Waterous has told Bloomberg that few investors are still eager to touch the sector after nearly a decade of underperformance, including negative free cash flow and disappointing returns.
He certainly has a valid point.
SNIP
According to Waterous, analysts and investors who don’t believe that the shale bust has already begun are going through the first phase of grief: Denial.
There is a lot more to this article but this is enough.
My take is really an oszillation of a violent pork cycle:
When Permian (and rest of shale) really goes into a steep decline, we’ll see 100-120$ oil fast. A few mb/day missing, together with the story will ignite an epic oil price rally.
Then you can earn real money in Permian, and get lot’s of credit to start it. New greedy investors will come (This time anything is different) Production will go up, fast. The firstmovers will earn money.
Oil price will fall…
Rinse and repeat…
We have seen this before. It can continue until oil is dry or replaced. Cycle length should be anything between 5 and 10 years.
It’s just my crystal ball view.
Eulenspiegel,
Eventually investors learn from past mistakes. It is doubtful the rise will be as fast and the money will be lent so freely this time. The oil producers that spend capital out of free cash flow will grow more slowly and the boom/bust will be less violent in my view.
The peak will arrive in 2026 or so and the decline will be fairly gradual maybe 3 %/year at first and gradually completion rate will fall as saturated sweet spots gradually reduces new well EUR and the tight oil plays gradually become less profitable.
That’s what my crystal ball says, but hey it’s been on the fritz, so who knows…. 🙂
My crystal ball says that a recession can easily bust shale and when it recovers, the Red Queen will be running like mad and who knows who’s gonna win …
Westtesxasfanclup,
I cannot predict future recessions, even with a crystal ball. They happen when they happen.
Dennis, recessions do have a pattern. Just watch the last decades. Expansion periods in the post-war economy lasted about five years. The actual expansion already lasts over a decade, a new all-time record. I don’t believe economists found a wonder pill to evade an economic downturn. Just taking into account the economic history and ignoring any kind of divination device, we’re very, very close to a recession. Will it be cataclysmic or just a hiccup after an opulent dinner at Mar al Lago? Well, NOW pass me the crystal ball, please.
My claim is simply that the timing of future recessions is impossible to predict.
A prediction that there will be a recession in the future is an easy one to make, note that my focus is the World rather than individual nations and for serious recessions or depressions Worldwide we have 1875, 1930, and 2008 in recent history, a relatively long cycle of about 60 to 80 years. So we may be due in 2068 to 2088, if history repeats, for a serious Worldwide economic downturn in real GDP per capita.
Worldwide we have 1875, 1930, and 2008 in recent history, a relatively long cycle of about 60 to 80 years. So we may be due in 2068 to 2088, if history repeats,
I don’t think there is anything in world economics that determines cycles of recession, especially cycles of that length. Recessions do not happen because they are due, they are caused either by human actions or by the scarcity of certain natural resources.
A scarcity of liquid fossil fuels and the elevated price that scarcity causes could very easily cause a worldwide recession.
At any rate, recessions are not a serious worry. What we had in the 1930s was a depression. A worldwide depression would be a serious problem, especially now that the world population has more than tripled since the last depression. You could see massive riots and political turmoil all over the world, such as we are seeing right now in Venezuela.
Don’t let’s confuse recession with depression. I referred to a recession, which occurs about every five years and now didn’t show up in over ten, which is a historic long-time record. Also, have in mind that recessions nowadays usually don’t occur in a single nation. Economies are intertwined and normally European and US economic cycles go hand in hand. My point is that even a mild recession can wipe out quite an amount of fossil fuel demand and if such a recession coincides with peak-oil, the peak could easily disappear in that additional noise created by a recession. And yes, I’m willing to take a bet that we will have a recession within the next 1000 days.
Ron,
No claim was made for any causal mechanism, it was simply an observation of what has happened over the 1870 to 2019 period of history.
See
https://en.wikipedia.org/wiki/Global_recession
I define a severe recession as a decrease in real GDP per capita, since 1900 this has happened on two occasions.
By IMF’s current definition there have been 4 global recessions from 1970 to 2009 and by an older definition there were 6 global recessions from 1970 to 2009, in both cases this looks only at the period from 1945 to 2019. Note that my definition of a severe recession is only satisfied by the 2008/9 recession in the 1945-2019 period.
No Global recession from 1945 to 1970 (or 1975 by current IMF definition) so about 30 years. By my definition (no decrease in real GDP per capita for the World) it would be 1939 to 2009 or 70 years.
Edit:
Looking at the data there have been several individual years where there has been a small decrease in World real GDP per capita (1975, 1982, 1991, and 1993). The severity of the 2009 recession was much larger than the other cases at -2.87%. Other years were -1.24%, -1.34%, -0.18%, and 0.04%.
See https://fred.stlouisfed.org/series/NYGDPPCAPKDWLD
So my definition of a “severe” Global recession would need to be more than a 2.5% decrease in World real GDP per capita in any given year. Note also that the 2009 recession was more than twice as big as the next biggest downturn over the 1960 to 2019 period.
I think the standard economic theory is that the business cycle is caused by inventory overshoots. After a period of growth, companies get too much inventory and hit the brakes, and that snowballs into a slowdown of the entire economy.
This happens to fit the idea that oilmen have that inventories play a key role in the oil price, as discussed above. As inventories increase, the market signals producers to cut production and costs.
Currently there is some feeling that a recession is “overdue”, since the world economy has seen an unusually long stretch of uninterrupted growth. One explanation for that is that lean manufacturing has reduced inventories, so they have less influence on the economy. If true, then the usual business cycle should be smoother in the future than it was before the 1990s.
Alimbiquated,
Interesting idea. My thinking was that different economies in different nation states may be on different cycles so that for the World economy things may be smoother in most cases (minor recessions in some nations are offset by better growth in other nations).
This coupled with your idea might explain the lack of a recession for many years.
Also when unions were stronger in the US, there was a tendency for wage push inflation as higher prices led to higher wages which led to higher inflation in a positive feedback loop which eventually led to poor profits and lack of investment and a downcycle.
Since the fall of union power in the US, this effect has been reduced. As the US is a fairly large economic player on the world stage, this may have also reduced the peaks and troughs of the economic cycles Worldwide.
Some worldwide financial crisis might effect all nations worldwide in the future. my WAG is this hits around 2030 to 2035 if my peak oil estimate for 2026 is correct.
I expect the World will muddle through on a rough plateau for C+C output from 2026 to 2032, but eventually the World will realize that peak oil has arrived. That Minsky moment might trigger a financial crisis and another sever economic downturn (like 2009 or perhaps worse).
Dennis,
It’s not my idea, it’s textbook economics.
About the unions, you are too focused on America. The US is turning into Brazil, but that is a local problem. I would look to Asia (and Eastern Europe) to explain downward price pressure.
Tens of millions of people enter the world labor market each year from much less productive working conditions. This has been exerting huge and steadily downward pressure on prices since the eighties, and it’s growing.
To me, Asia is a giant deflation machine. Eastern China will eventually run out of labor, but South Asia is much bigger.
That is why the panic about stagflation no longer makes sense. Older folks remember the seventies and worry about central banks “inventing money”, but as long as that deflation machine is churning out cheap, productive labor, inflation just won’t happen.
The flood of cheap labor is why interest rates are now negative. Wages just can’t rise, or even stay flat. Technical innovation adds to deflation, as we are seeing in the crunch of the car business, but it is the rapid growth of the labor market that is currently playing the key role.
Ron,
If oil prices fall he might be correct, but only until such time as the lower output results in falling stock levels and oil prices start to rise along with profits in the Permian basin, then completion rate increases and tight oil output will increase as well. One such scenario is presented below.
See spreadsheet at link below (row 4 is new wells added each month)
https://drive.google.com/file/d/1vi9sRRBq2GFO07kuCOHNVkCCUyxhpi_P/view?usp=sharing
Well hell, Dennis, I don’t know if you are an investor or not, but you are definitely an analyst.
According to Waterous, analysts and investors who don’t believe that the shale bust has already begun are going through the first phase of grief: Denial 😉
Hi Ron,
The analysis points to this, you agree with me that oil prices are unlikely to remain low. Note that the average 2017 Permian basin well breaks even at a wellhead price of $49/bo for the oil, $1.50/MCF for the wellhead price of natural gas and $12.25/b for NGL from the average MCF of natural gas produced. This assumes full cycle cost for the average Permian well od $10.5 million and uses an annual nominal discount rate of 10% for the discounted cash flow analysis and a $13/bo LOE over the life of the well.
Assume for a moment that Permian output stagnates at 4100 kb/d from 2022 to 2024 as the scenario above suggests, in addition in a low oil price scenario the rest of US tight oil output (excluding the Permian basin) will be falling.
In that scenario what would be your expectation for the price of oil?
My guess is that it would be considerably higher than $49/bo in 2018$.
My guess could be wrong, but when I have asked your expectation in the past about oil price, it was not very different from mine.
The scenario presented above is very conservative and could be met even in a scenario where oil prices remain at $60/bo until 2023 and then rise gradually to $70/bo (these are Brent prices in 2018$) by 2027 and remain at that level until 2031 (end of scenario presented above). In my view that is a very conservative oil price scenario, my expectation is that in a low tight oil output scenario (say a plateau of about 8 Mb/d from 2020 to 2024) oil prices are likely to be considerably higher than $60 or even $70/bo in 2018$ for Brent crude. (WTI would likely be $5 to $7/bo lower than the Brent price).
Ron,
Another quote from the piece you linked to:
Certainly not everyone shares Waterous’ “Peak Permian in 2020” view, with BloombergNEF analyst Tai Liu saying the shale oil pessimism is overdone.
Indeed, the general consensus is that the US shale industry still has some room to run, with production in the current year expected to continue to rise, albeit at a slower pace.
Nevertheless, it’s also noteworthy that Waterous is hardly alone in his gloomy shale outlook.
In 2017, Simon Flowers, Chairman and Chief Analyst at Wood Mackenzie, predicted that a slowdown in Permian production would begin in 2021 as drillers hit a cost efficiency ceiling.
There are a variety of opinions on how things might play out.
Interesting article on how Iran is selling diesel to its neighbours. It makes me wonder if they can also do the same with crude, ship crude to Iraq and then sold by Iraq. Could this lead to confusion on the real Iraq crude production.
LONDON (Reuters) – Iran is relying on its neighboring countries to sell a surplus of gasoil it has created at home due to U.S. sanctions, trade documents and industry data showed.
Iranian oil products, like its crude, fall under U.S. sanctions, but Tehran has significantly increased exports of gasoil in recent months, to some countries in the region including Iraq and Syria, by offering massive discounts.
Exports of gasoil, a refined product used in heating, power generation and transport, surged to around 95,000 barrels per day (bpd) in the fourth quarter of 2019, more than 80% higher than the previous quarter and nearly four times higher than the first quarter, data from consultancy FGE showed.
https://www.reuters.com/article/us-iran-oil-products/defying-us-sanctions-iran-boosts-gasoil-sales-to-neighbors-idUSKBN1ZF1XU
Been going on since the Obama years. North. Ship via Caspian and intermixed with other oil and sold.
Discounts don’t really matter when the substance in question is pegged by the Chinese, who buy rather a lot of oil.
Bakken update at Shale Profile.
https://shaleprofile.com/blog/bakken-monthly-update/north-dakota-update-through-november-2019/
“On average, each rig drilled almost 2 wells per month.” I wonder if this is generally true for all shale basins or does it depend on things like “depth of oil zone” and “hardness of sandstone” to drill through.
North Dakota oil production was flat m-o-m in November, at 1.5 million bo/d, while natural gas production set a new record at over 3.1 Bcf/d. The horizontal rig count has stayed just over 50 during the past year. On average, each rig drilled almost 2 wells per month. In November, more than 1 million bo/d was produced from the 3.5 thousand wells that began production since 2017.
Well productivity is basically unchanged from last year, as you can find in the “Well quality” tab. Although initial production rates have steadily increased over the years, decline rates have as well. The 1,800 oil wells that began production in 2012, produced on average 220 bo/d in the first year and 110 bo/d in their second year, a 50% decline. In comparison, the 1,000 wells that came online in 2017 produced 440 bo/d and 180 bo/d in their first and second year, respectively, a 60% decline.
When Bakken API started changing, the measures of oil production became somewhat meaningless, certainly in comparison to history. With their recent gas capture infrastructure, odds would seem high it is wet and that wetness finds its way into oil production quotes.
I never have and probably should go look at Texas and NoDak tax revs and compare them to quoted bpd production. Not gonna be surprised if there is no match.
Watcher,
Historically there has always been many different grades of crude, this is nothing new.
Well I don’t think you understand. It’s not different grades of crude. It’s the same grade changing its definition.
Which, by the way, has happened to WTI.
Definitions have also changed over time. In general the average barrel of crude produced worldwide has been getting heavier, so refineries adjusted to handle heavy grades of crude at great expense. Now there are fewer refineries in the US capable of handling lighter crude as those grades were very expensive when these changes to refineries were made.
10 years ago nobody expected (or very few) tight oil output to grow to 8 Mb/d by 2019. It is also not worth the expense to build new refineries because output will not remain at this level for more than a decade.
Jeffrey Brown just sent me this link. There is a lot more to it than I have quoted here. Great reading.
Oil’s Minnows Need to Start Earning Their Keep
This is a big year for the U.S. oil and gas industry. If the past five have constituted a reckoning with the old frack-it-till-you-make-it model, then this one is where we find out if the reckoning stuck.
The new mantra espoused by many energy companies is that returns are king. They are. The chart below, which I have adapted from one used by Kimmeridge Energy Management Co., shows the close relationship between return on capital and stock performance. It compares how share prices moved in the five years through the end of 2018 with an implied change in the market cap based on that period’s cumulative economic value added, a measure of value creation or destruction. 1 The sample consists of 55 U.S. oil and gas companies with a market cap of at least $250 million (as it runs through the end of 2018, it includes a couple of companies acquired since then, Anadarko Petroleum Corp. and Carrizo Oil & Gas Inc.).
Present at the Destruction
Ron, good to know that Jeffrey Brown is alive and well. I appreciated his enlightening posts back in those days of the Oildrum and owe him my pseudonym.
Yeah, he posts me about once a month with a link he finds interesting. And we chat via email occasionally.
Please encourage Mr. Brown to start writing articles here again. He must have updated opinions about peak oil.
He’s one of the few respectable voices from the bad old days.
Jeff Brown stated in this presentation that he believed Russia would reach zero net oil exports in 2024, is that really likely?
https://www.youtube.com/watch?v=O7h4VjZhe_w
according to BP statistical review, Russia’s oil production was higher than ever in 2018.
I have been told that Saudi Arabia oil production did not peak in 2005 but I am not sure of the data for 2005
I have been told that Saudi Arabia oil production did not peak in 2005 but I am not sure of the data for 2005.
Errr… you were told Saudi dif not peak in 2005 but you are not sure about which date it did not peak? Well, I am sure. It did not peak on any date in 2005. Or should that be “it did not peak on every date in 2005”? 😉
Saudi’s average production in 2005 was 9,416,000 barrels per day. The yearly peak, so far, was 2016 at 10,388,000 bpd. In 2018 it was 10,310,000 bpd and in 2019 it was 9,779,000 bpd. The peak month was November 2019 at 11,021,000 bpd.
Their peak month in 2005 was September at 9,530,000 barrels per day.
I wonder why Jeff Brown though Saudi Arabia had peaked at 9.5mb/d in 2005?
Perhaps Saudi Arabia does actually have the reserves that independent auditors have confirmed?
https://www.spglobal.com/platts/en/market-insights/latest-news/oil/061219-saudi-arabias-oil-reserves-jump-30-billion-barrels-after-data-review-bp
Net Russian exports to 0 by that year . . . not likely but certainly possible.
A naval blockade. Surgical strikes on pipelines heading to the coast, or to borders. A decision to save it for the grandchildren.
Three credible mechanisms to make it happen.
Considering Russian oil is vital to Europe and China, anyone bombing Russian pipelines would risk war with both.
Thankfully Russian oil production has increased over the last 15 years and has helped to keep prices low.
Libya export down by 800 000: https://mobile.reuters.com/article/amp/idUSKBN1ZH0CN
Thanks Jeff. The content of that link:
(Reuters) – Libyan state oil firm NOC has declared force majeure on oil exports from the eastern ports of Brega, Ras Lanuf, Hariga, Zueitina and Es Sider, a statement said on Saturday.
The NOC said forces loyal to Khalifa Haftar, who controls eastern Libya, had ordered the closure of the oil ports, which will result in loss of 800,000 bpd in oil output.
Were out of here.. Dying prospects for US E&P?
https://www.wsj.com/amp/articles/schlumberger-plans-u-s-pullback-as-shale-oil-drillers-struggle
You may have to search for Article.
SLB.. Buy Sell or Hold?
Broken link
This one works
https://www.morningstar.com/news/dow-jones/202001175453/schlumberger-plans-us-pullback-as-shale-oil-drillers-struggle
“ Going forward, Schlumberger will reduce its operating locations by 25%, focusing on only three hubs near the largest shale basins. In addition to the dramatic cuts to its fracking fleet, the company has laid off more than 1,400 employees in North America, and Mr. Le Peuch said Friday that further workforce reductions are possible.”
That’s a serious pullback. Could that be why that frac spread number is falling off so quickly?
Thanks Gary.
A good piece. Explains why frac spread count has dropped.
Thanks, thats the most important statement – 50% !! reducing of the US fracking fleet:
“The company is positioning itself accordingly, he said, restructuring its business in the U.S. and reducing its fracking fleet there by 50% while diverting spending abroad.”
There are a lot of Dead DUCs out there.
A Guide To American DUCs (Drilled Uncompleted Wells) June 2016
What about DUC wells drilled prior to October 2014? This may be included in deferred completions, but I often refer to these as “dead DUCs.” If wells were not completed when oil was $90-$100, there is a good chance these will never be completed. We have 42 in the Eagle Ford during the period March 2014 through September 2014, as shown in Figure 5.
That article is quite dated. But it tells us that there some DUCs that will never be completed.
Ron,
Agreed on the large amount of DUC’s that won’t be completed. While the DUC’s completed prior to October 2019 are now longer than the five-year reserve requirement, the other factor is that they were likely drilled in NON-CORE LOCATIONS. When the oil price was north of $100, many of the shale companies drilled DUC’s in SHYTE NON-CORE AREAS with shorter laterals. This is probably the more critical factor.
The problem with the Shale Industry today is that they burned through a lot of Acreage, and a good bit of the acreage remaining is in NON-CORE AREAS.
steve
But it tells us that there some DUCs that will never be completed.
This makes sense as you find out a lot about the source rock (oil density, oil quantity, ….) after the drilling is complete. But why are they so many DUCs ?? You would think that you’d want to frac as soon as the drilling is complete to have some money coming in.
But why are they so many DUCs ??
I really have no idea. Perhaps some oilfield guy can give us a hint. But I can speculate.
Fraking is a huge and very expensive operation. It takes fleets of trucks, men, and equipment. And I suppose a lot more wells can be drilled than fracked in a given period of time. So the drilling teams would naturally get way ahead of the fracking teams.
But that is just my guess. If someone has a better answer then Frugal and I would love to hear it.
Ron,
Speculating here but i assume it works the same way for shale and frack crews as with conventional production companies and hiring drill rigs, and some companies i follow in conventional hire drill rigs for extended periods of time way ahead of drilling to be able to secure rig, a good price and of course you can estimate costs for future.
Anyway they then have a number of prospects lined up for the rig to work with to minimize down/move time and to get as much drilling done as possible within the time slot, it also gives flexibility if they hit a reservoir that contains oil they can then decide to extend current drilling operation and drill a side track and perform production tests directly and then just afterwards rearrange the previous “line” of drilling until all their time is spent on lease.
Now fracking probably more or less never do production tests and such, what would be the point to test a month in a shale well.. but same principle should apply you can have more frack targets close to each other lined up and have the frack crew work more effective with shorter moves or perhaps even fracking multiple wells from the same location. Should save a lot of money compared to doing one at a time. Of course this requires that the companies also have liquidity to drill a bunch and then frack a bunch in batches and dont need money yesterday.
On a side note i recently read a press statement from a company i follow, they performed the first offshore single trip multi frack operation on a well of theirs apparently tech from the recent shale boom modified for offshore use and it saved them a lot of time per well operation. They stated previously they used 2-3 days to frack one zone of the reservoir and now they frack two zones in one day.
So that might be something to the decreasing frack crews perhaps but i have no idea when this was implemented in regular onshore frack operations.
Drilling efficiency is improving, according to the industry, so the number of wells should grow. But the more efficient you are at drilling, the less likely you are to be fussy about where you drill, because dead ducks are less of a loss.
What I don’t understand is this: When a well that’s not worth completing is drilled, when does it disappear from the DUC list? If there is no “official” way to remove the DUCs, their number will keep growing. As the quality of the new wells declines, DUCs as a percent of wells would increase.
I think the DUC would be removed from the list if it were permanently abandoned (aka plugged). Not sure of this though.
That’s a little tricky. My recall is there are some regulatory requirements for holding a lease only via production.
It seems reasonable to expect that some of the DUCs changed hands as a consequence of failing to produce. So they may get completed by the new owner. Their failure to complete for the original owner might not say that the price of oil has to be higher. Rather, the new owner may just need to borrow some money, since there doesn’t seem to be an imperative to earn a profit, given that so many do not and still produce.
Watcher, you missed the point entirely. The wells will not be economical at prices below $90-$100 a barrel. They will not be economical for any producer no matter how many times they changed hands. If there is a time limit and the well would still be a huge money loser if fraked, then the well will simply have to be plugged if that is what the law requires.
The DUC issue is a new one in the United States as far as I am aware.
Is there any data on how many shale wells have been plugged? Maybe companies are just trying to delay plugging and abandonment expense as long as possible? And hoping high prices will someday bail them out.
Is there any data on how many shale wells have been plugged?
If you are asking me you are asking the wrong person. We desperately need a shale oil expert on this list to answer all these questions about shale drilling, fracking, DUCs, and production.
shallow sand,
According to https://shaleprofile.com 775 horizontal wells have been plugged in the major tight oil basins as of Sept 2019 (Bakken, Permian, Eagle Ford, and Niobrara.) This is out of roughly 72,000 wells that are inactive or producing in these basins, so a little over 1% of completed wells.
DUC counts also available at shaleprofile under well status.
My guess is that the DUC counts at shale profile through Sept 2018 would be far more reliable than those produced by the EIA. The EIA tends to take regional counts of all wells drilled and completed, where shale profile focuses on horizontal tight oil and shale gas wells.
In Dec 2018 for major tight oil basins (Bakken , Permian, Eagle Ford, and Niobrara) shaleprofile has DUCs at 5259, with a peak at 5551 in March 2019 (after that incomplete data may make the count unreliable.) In Sept 2016 the DUC count was 3504 and in Feb 2014 the DUC count was 3513, in Jan 2012 it was 1651, and Jan 2014 it was 3323. The EIA has the count at 2746 in Jan 2014 (same 4 basins) and 6126 in Dec 2018 and 5452 in Sept 2018, shale profile has DUC count at 5182 in Sept 2018, EIA is probably over counting because it is including conventional vertical wells in the drilling numbers. The completion numbers in the EIA’s DUC data may also suffer from inclusion of conventional completions which muddies the picture for those like me who would prefer to focus on tight oil output.
In any case, https://shaleprofile.com has the best data by far.
https://www.worldoil.com/news/2020/1/16/decline-in-duc-backlog-shows-scale-of-us-shale-pullback
Seems the best in US shale is history.
It will be very interested to read the ballance sheet 4th quartile of Exxon and Chewron. If they estimated with Break even price of 40 usd but are not able to earn money on 55 their assets in permian should be decreased that again will reduce equety. Than they need to sell more assets abroad, take loan to fund dividends.
FREDDY,
Yeah, Exxon pulled a fast one and borrowed $7 billion in August 2019 without mentioning it in their press releases. Some poor slob loaned Exxon Money for 30 years…LOL.
steve
At 3%, with most used to retire commercial paper with essentially overnight maturities at 2.75%. It’s not a big debt bump, because so much of it is being used to retire short-term paper with damn near the same rate.
None of Moody’s, Fitch, nor S&P have XOM rated below maximum.
Last I knew, S & P lowered XOM credit rating to AA+ in 2016. Was it raised?
Moody’s still has XOM at Aaa, but changed its outlook to negative in November, citing unsustainable cash burn.
I have been an XOM shareholder for about 25 years. I am concerned. It has underperformed during a long bull market. I attribute this to its XTO acquisition and drilling a lot of shale wells during a time of low oil prices (2015-19).
I bought stock in XOM around the same time as I bought stock in two gas utilities, EGN and ATO.
EGN was a great low risk stock most of the time I owned it. Then it decided to transform itself from a gas utility to a shale company. It’s credit rating dropped from in the A range to the C range. It was bought by FANG, and I bailed right after that transaction was completed.
ATO remained a gas utility and has been a good performer over the years given the relatively low risk compared to the market.
Shale will only work with high prices. High prices will only come with falling shale production.
It is a catch 22 for XOM and all the rest drilling shale. Low prices no earnings. Falling production, you aren’t a growth company.
Then there are the environmental matters. Oil companies are the new tobacco companies, in case you haven’t heard.
Shallow,
Many years ago, I was contacted (via my website) by an individual who worked for Mobil before it merged with Exxon back in 1998. This individual was in upper management. He retired after the merger.
He stated in our brief email exchange, that the “Higher Ups” knew that the end of the oil age was coming (discussed privately, not publicly). The Merger of Exxon & Mobil allowed these two individual companies to last longer as a merged corporation.
I don’t believe ExxonMobil had a choice in the matter to get into Shale, via its XTO acquisition. ExxonMobil had to increase its reserves and production, come HELL OR HIGH WATER.
Now, the Falling EROI of Shale & Tar Sands is starting to wreak havoc across the entire E & P Industry.
At some point, this highly leveraged FED INDUCED BUBBLE ECONOMY will have to correct to something more realistic. This will not be good for oil prices. Thus, that next downward phase will likely put the KABOSH on U.S. Shale Industry for good.
And, unfortunately… I don’t see how ExxonMobil survives this without drastically cutting CAPEX & DIVIDENDS… the two key factors for shareholders.
steve
“Since 2010, the five largest oil majors have spent vastly more than they have generated when including shareholder payouts. ExxonMobil, BP, Chevron, Total, and Royal Dutch Shell have dished out a combined $536 billion in dividends and share buybacks since 2010, a figure that far exceeds the $329 billion in free cash flow over the same period, according to a new report from the Institute for Energy Economics and Financial Analysis (IEEFA).”
You called it Steve.
https://oilprice.com/Energy/Energy-General/Is-This-The-End-For-Big-Oil-Dividends.html#
Stephen,
Thanks for the link. I hadn’t realized it was that bad. Looks like the IEEFA states that Exxon is the worst performer in the bunch:
“ExxonMobil had the largest deficit, totaling nearly $65 billion. BP was in the hole by nearly $50 billion, but the others were not far behind – Chevron’s deficit hit $43 billion, Total’s was $27 billion and Shell was short by $22 billion.”
I don’t believe individuals or the market is prepared for what’s coming in regards to the ENERGY CLIFF. While we continue to see the Private and Public Industrial Energy Analysis focus on “BARREL COUNTING OF OIL RESERVES”, a past time that will provide futile, the Falling EROI seems to be picking up speed.
Lastly, with the Fed going ALL IN with its Repo Market Operations and $60 billion a month in U.S. Treasury purchases, at a time when there is NO RECESSION, people better be prepared for the CURVE BALL that no one sees coming.
steve
But for Guyana, Exxon is a dead man walking.
You’re mostly right, a little bit wrong. I’m a little bit right, mostly wrong.
S&P did lower in 2016. Fitch and Moodys did not.
But.
The US government Treasury instruments are the by definition “riskless rate of return”. In 2011 S&P lowered the US credit rating to AA+. They were sued by the US government immediately thereafter but to date (as of 2018, didn’t check further, but at $1T deficit can’t see an upgrade) they have held that rating. That is the same credit rating they gave XOM. They evaluated XOM as the riskless rate of return.
There may be other companies with AAA, but those have been hand waved . . . for example Microsoft is AAA long term and several notches lower for short term debt.
Anyway with XOM the same as US Treasuries it is marginally legit to call that max. But only marginally. I thought they had undone that.
BTW as I recall XTO was a gas fracking firm in the northeast when bought.
Watcher. You are correct regarding XTO. XOM bought it late 2009, closed 2010.
Story I read said XOM paid $2.96 per MCF of proven reserves for XTO. Considering how much it costs to get those reserves out of the ground, I would say that deal didn’t turn out so good for XOM.
XOM isn’t helping itself any by running so many shale oil rigs that natural gas is well below $2.96 Henry Hub, and at the well head is way below. They and the other shale drillers who have wreaked havoc on the entire upstream industry.
I will believe XOM is doing the right thing when I see it. Thus far, per shaleprofile, they don’t seem to have the best acreage, and per their 10K and 10Q, they seem to not be doing so well in North America. I bet shale is losing money North America, while maybe making money on the rest of North American upstream.
How can a company with XOM’s overhead make money drilling shale wells with mostly substandard acreage?
XOM has drilled a lot of wells that will never payout onshore lower 48, starting in 2015.
I just checked my subscription service real quick. I am sure this could be checked on shaleprofile.
I see 4,955 horizontal wells drilled in the states of TX, NM and ND by XTO (XOM drills shale wells under this name) since 1/1/2005. 801 have hit 200K BO cumulative. Of those 801, only 251 produced 3,000 BO in the last reported month. 1,841 of the 4,955 wells made under 3,000 BO in the last reported month, 732 of those made less than 450 BO in the most recent month reported.
So, about 15% of XOM’s shale oil wells are already stripper wells. $5-$10 million stripper wells. Sure, they are making money hand over fist on these.
SS, do we have an XOM CAPEX breakdown of where they spend? They have Guyana coming up. No doubt elsewhere, too.
I have noticed there is rather a lot of analysis focused on return from CAPEX, and that has never really been a necessity. CAPEX can purchase assets. The return on assets might be weak or deferred, but as long as the asset hasn’t lost value it is a form of spending that is not really spending. It’s a transformation of asset.
Shallow sand,
Shaleprofile now lists XTO wells under Exxon Mobil.
In Jan 2008 they had only 36 wells operating in the Bakken, Eagle Ford, or Permian basins (no wells in Niobrara).
Month year- total cumulative wells for that date
Jan 2011-277 wells
Jan 2013-580 wells
Jan 2015-888 wells
Jan 2016-1160 wells
Jan 2017-1336 wells
Jan 2018-1518 wells
Jan 2019-1810 wells
Sept 2019-2279 wells
So from Jan 2011 to Jan 2019 the average annual increase in Exxon’s tight oil horizontal wells in the three largest tight oil plays (Bakken, EF, and Permian) was about 200 wells completed per year. From Jan 2019 to Sept 2019 (and counts for last few months may be incomplete) we had wells completed at an annual rate of 703.5 wells per year an increase of a factor of 3.5 compared to the average of the 2011 to 2018 period (200 wells completed per year).
XOM wells counts for Bakken, Eagle Ford, and Permian
About 19% of the 2265 wells produce less than 10 b/d. 17 wells have been plugged (not included in 2265 well count). These are horizontal tight oil wells in Bakken, Eagle Ford and Permian basins operated by XOM. About 0.744% of the XOM tight oil wells completed since 2007 in the Bakken, Eagle Ford or Permian basins have been plugged.
Dennis. XTO drilled a lot of wells in TX prior to merger with XOM that are predominately gas. XOM still owns the wells it appears. Lots of wells that aren’t making much gas or oil at this point.
XOM operates lots of stripper wells. Not sure how that works for a company that likely pays among the highest in salaries.
The long term model of shale drilling is to be the operator of thousands of deep horizontal stripper wells. That is the end game for all shale companies.
XOM is moving fast towards being a stripper well operator upstream. Yes, they have many other projects worldwide. But they are investing billions of dollars each quarter into $5–10 million dollar wells, many of which won’t have cumulative oil of 200K BO after 5 years.
If NRI’s are below 80%, makes things even tougher.
I see lots of wells with cumulative of under 150K BO and most recent months production under 3,000 BO. I’d like to know how XOM makes those work. No one else does.
Shallow sand,
It probably does not work very well at these prices, perhaps XOM did not expect the prices to go down when they bought XTO at the end of 2009.
I imagine when the output of the wells gets too low, they will try to sell the wells to smaller operators with lower costs.
shallow sand,
I am focusing on the tight oil plays. I left out the shale gas plays, those wells are probably a lot of dead weight, but perhaps there are fewer operational problems? You would be better informed than me on that. Certainly the current natural gas price would make profits a challenge.
Does anybody know the company Petroteq and whether their technology is viable? and maybee prolong peak significantly
Martin,
LOL… Petroteq has offered one and only one thing to investors… DESTROYING SHAREHOLDER VALUE.
PETROTEQ ENERGY UPDATE: Situation Goes From Worse To Horrible: https://srsroccoreport.com/petroteq-energy-update-situation-goes-from-worse-to-horrible/
steve
Interesting that output was 200 b/d over a 6 day period or a total of 1200 barrels produced, this will not move the needle. Kerogen oil is not likely to ever be profitable to produce in a world with oil prices less than $150/bo, and it is not clear that even higher oil prices would be necessary to turn a profit.
The company trades at 12 cents per share, and is likely overvalued at that price.
Short answer to Martin’s question, “Is the technology viable?”, answer is no.
Naaa, I really don’t think this will prolong the peak significantly.
Petroteq is a scam.
Many companies have come and gone in the continuous pursuit of tar sands and oil shale “billions” in the remote Tavaputs Plateau of Eastern Utah. Much of this land is part of the Uncompahgre Reservation. SITLA is controlling and leasing this land on behalf of the beneficiaries who are Utah School Children.
The people who really benefit are SITLA board members and the companies they run. The Governor Dirty Herbert (who appoints the board and the director of SITLA) and his friends also benefit. Many of the Utah State legislators and their friends benefit. Local politicians benefit in Vernal and Uintah county. The list is long.
So much money has been invested in foolish and wasteful efforts to turn rocks into oil. Certain people have made a lot of money from this fraud. Most folks have lost and local communities have suffered bust and boom cycles in addition to corrupt politics, pollution and failed strip mines.
MCW energy recently changed names to Petroteq They have a lot to hide.
I thought the guys using lemon juice as a solvent had much higher comedy value.
Thanks for your input. I Think I Will sell my shares again.
An extraordinary graph to behold.
https://www.eia.gov/dnav/pet/hist/LeafHandler.ashx?n=pet&s=mttntus2&f=m
15 years ago many people rightly feared US oil imports would be reaching 20 mb/d in 2020. Would there be enough oil on the global market to feed China, Europe, India and the US.
The fact that the US has attained the ability to be a net exporter of crude oil and oil products is remarkable.
That’s weird.
US production, about 13 million barrels per day:
https://www.eia.gov/dnav/pet/hist/LeafHandler.ashx?n=pet&s=mcrfpus2&f=m
US consumption, just north of 20 million barrels per day:
https://www.eia.gov/outlooks/steo/report/us_oil.php
Last time I checked, 20 was a bigger number than 13. But I could be wrong.
I was wondering that also—
13 is greater than 20?
We must all be in Trump land?
There is nothing weird here. The 20 million barrels is total liquids, including NGLs, refinery process gain, ethanol, and anything else you can call think of. The 12+ million barrels is C+C only.
Also, Ever-increasing LNG Exports must be in the EIA Chart. Can’t build LNG Export fast enough – Henry Hub is below $2. http://www.gasprocessingnews.com/news/freeport-lng-achieves-start-of-commercial-operations-for-second-liquefaction-train.aspx
Longtimber,
No LNG (liquid natural gas) is not included, note that NGL (natural gas liquids) is very different from LNG.
LNG=methane at low temperature and high pressure
NGL=pentanes plus(C5), butane (C4), propane (C3) and ethane (C2) which are removed from natural gas in a natural gas processing plant leaving “dry gas” which is relatively pure methane (C1).
Dennis
Small point. LNG is stored at low temperature, -162º C, its boiling point, and at low pressure, i.e, around five atmospheres. The gaseous phase is typically then used in the engines of the ship or sent back to a liquefier.
On the other hand, Compressed Natural gas is stored at high pressure, typically 3000 psi. Hydrogen for Fuel Cell cars is stored at 10,000 psi.
Ovi
Thanks for the correction.
By high pressure I mean higher than 1 ATM. Yes the low temp is the main means of creating a liquid state for the methane. I did not know the pressure was only 5 ATM.
It’s actually much less than that. LNG is stored at about 1PSIG which is basically at Atmospheric pressure. Most LNG tank relief valves will lift at around 2 PSIG.
Michael B
You are quite correct. 20 is larger than 13. However the United States imports oil and converts it into finished products which it then exports. such as diesel, petrol, aviation fuels, car tyres, bicycle tyres, dyes,
https://www.innovativewealth.com/inflation-monitor/what-products-made-from-petroleum-outside-of-gasoline/
It is not the final consumer of many of the goods made from the oil.
The United States has gone from a net consumer of 13 mb/d to zero in 15 years.
I think that is wonderful news for Americans.
Wayne,
If you look at the total produced in October 2019 and deduct the 10% of gasoline that comes from ethanol and ignore the Hydrocarbon gas liquids (mostly NGL not used for most products made from crude oil) and also ignore petroleum coke and still gas which are just intermediate products that are reused by the refinery (these are not final consumer products) we get about 15655 lb/d and the crude input to refineries and blenders was 15681 kb/d, US output of C+C was 12655 kb/d, so consumption minus production was 15655-12655=3000 kb/d, this 3000 kb/d deficit came from imported crude oil. Also note that if US crude input to refineries remains unchanged, the US may never have zero net imports of crude oil, because tight oil output may peak at about 2600 kb/d above today’s level (around 8100 kb/d) in 2025 or 2026. Then output will decline fairly rapidly over the following 10 years.
The myth of US energy dominance will be done by 2030. This will be the case even with very high oil prices, a low oil price environment would lead to a lower tight oil peak between 8500 and 9000 kb/d, and it might be reached by 2023.
Dennis
Is that taking into account the 3.3mb/d of oil exports?
https://www.eia.gov/dnav/pet/hist/LeafHandler.ashx?n=PET&s=MCREXUS2&f=M
plus other fuels
https://www.eia.gov/dnav/pet/pet_move_exp_dc_NUS-Z00_mbblpd_m.htm
Wayne,
I use these two,
https://www.eia.gov/dnav/pet/pet_pnp_inpt_dc_nus_mbblpd_m.htm
This gives crude input to refineries. See second line, crude oil.
Then for output I use
https://www.eia.gov/dnav/pet/pet_cons_psup_dc_nus_mbblpd_m.htm
I focus on finished petroleum products, but discount petroleum coke, a by product used to fuel the refinery and still gas also a by product mostly used to fuel the refinery, and I deduct 10% of the gasoline output which is ethanol blended into the gasoline rather than crude oil.
If you look at the net exports you will see 1800 kb/d of NGL is exported and 560 kb/d of petroleum coke. Neither is really related to crude oil or the products produced from crude oil. In addition if one looks at finished products and other oils there were 2144 kb/d of imports and 3531 kb/d of exports for net exports of 1387 kb/d, the petroleum coke should be deducted from this (as it is a byproduct of little value) so net exports of products and other liquids is 827 kb/d. For crude net imports the total was 2861 kb/d, so if we deduct the 827 kb/d of products and other liquids net exports we are left with 2034 kb/d of net imports of total petroleum plus products (ignoring the NGLs).
Basically we have NGL and petroleum coke net exports balancing most of the crude and products net imports. The US is an exporter of NGL and petroleum coke ( a waste product of the refining process) of 2360 kb/d. This more than balances the net imports leaving net exports slightly positive at 326 kb/d.
Not really anything to get excited about as petroleum coke has very low value and NGL sells at about one fourth the value of a barrel of crude.
This is enough to drive one nutty. Does anyone estimate actual import/export energy flows in Mass or units of Energy? What is the Range of Energy for a Barrel of “Oil”? Think a Barrel of Oil Equivalent or million/barrel/day is a mess. How about CMO? https://en.wikipedia.org/wiki/Cubic_mile_of_oil
Wind+Photovoltaic+Solar thermal = 0.005 CMO/yr
That puts into perspective how far away we are from being carbon neutral
.005 CMO/year from renewables in 2006 – 14 years ago – almost prePV. What is our destiny? Burn millions of years of concentrated Sunshine yearly till we poison all life forms or figure out this energy Balance thingy.
According to Meadows, that is already in the rear view mirror:
Dennis Meadows: The Limits To Growth
https://www.peakprosperity.com/featuredvoice/
Longtimber,
see https://www.eia.gov/totalenergy/data/monthly/pdf/flow/total_energy.pdf
in 2018, petroleum imports (crude and petroleum products) was 21.48 quadrillion BTU and petroleum exports was 14.42 quadrillion BTU so net imports of 7.06 quadrillion BTU of crude and petroleum products in 2018.
If we look at all energy sources (petroleum, natural gas, coal, biofuels, coke, and electricity in 2018 imports were 24.84 quadrillion BTU and exports were 21.19 quadrillion BTU, for net imports of energy = 3.65 quadrillion BTU. The 2019 estimate will come out in April 2020.
Wayne,
about 3000 kb/d of those “product net exports are LPG”, not really something that is in short supply,
it is the liquids that do not need to be pressurized (gasoline, diesel, jet fuel and residual oil) to remain liquid that are important.
We have reduced crude imports significantly, but we still have net imports of 3000 kb/d of C+C.
LPG=liquid petroleum gas (butane, propane, and ethane and various iso forms, which are structurally different, but have the same CxHy formula where x and y are equal.
Propane is C3H8. Butane is C4H10. no?
Yes, that’s correct. The formula for hydrogen in carbon polymers twice C plus 2. Ethane is C2H6, Methane is C1H4, Pentane is C5H12, Octane, (gasoline), is C8H18.
Longtimber,
I worded that poorly. What I meant is that x and y will be the same for butane and isobutane, instead what I wrote looks like I mean x=y, which is clearly not correct
we also import uranium
Iraq’s Kirkuk field is not living up to expectations. I suspect others are also having similar problems.
“BP Quits Iraq’s Kirkuk Oilfield As Studies Disappoint”
https://oilprice.com/Latest-Energy-News/World-News/BP-Quits-Iraqs-Kirkuk-Oilfield-As-Studies-Disappoint.html
BP provided technical assistance to Iraqi state-held North Oil Company to help it with the redevelopment of the Kirkuk field. Kirkuk is estimated to hold some 9 billion barrels of recoverable oil remaining, according to BP.
But after the contract expired at the end of last year, BP told Iraq that it was withdrawing its staff from the Kirkuk oilfield, Reuters’ sources said.
So 9 billion barrels of recoverable oil isn’t worth it?
Frugal,
Depends on the deal negotiated, could be no money would be made because of large fees paid to the Iraqi government to access the oil field. No profits means no production, the aim is to make money. There is a difference between technically recoverable oil and economically recoverable oil, the 9 Gb is not economically recoverable at current oil price levels.
EIA DUC update is out.
Snowback,
Permian DUC count is up but https://www.eia.gov/petroleum/drilling/#tabs-summary-2 says DUC count drops in other regions bring total DUC count down 50 to 7,573.
EIA DPR shows a tiny estimated increase in crude oil production across the regions from 9,178 kbd to 9,200 kbd in Feb 2020, an increase of only 22 kbd or 0.24%.
EIA released the December DPR today with well completions and production by each US shale basin. Our conclusion to this report is that “the shale treadmill has arrived.”
We have alluded to this in the past, but as US shale continues to ramp up oil production, the higher the existing the base, the higher the decline.
As the total production needed to replace the declining base increases, US shale producers have to run faster on the treadmill just to stay in the same place.
We have estimated 12.5k wells completed for 2020 and this gets us a total growth of +450k b/d y-o-y with all of it coming from the Permian.
And if the Permian only completes 5.5k wells in 2020, then exit-to-exit growth may be flat.
https://seekingalpha.com/article/4318184-oil-shale-treadmill-arrived
Thanks Tony,
If we assume 5K wells added each year from Dec 31, 2019 to Dec 31, 2029, I get the following for Permian basin output, based on the mean USGS TRR with new well EUR starting to decrease after Dec 31, 2018. New well EUR starts at 379 kbo in Dec 2018 and falls to 321 kbo by Dec 2029, for this scenario (55,000 wells completed from Dec 2019 to Dec 2029), I assume 458 wells are completed each month from Jan 2020 to Dec 2029. Scenario in spreadsheet at
https://drive.google.com/file/d/1fP5flIsmjvKzEm-i4eZRJCecVKTe4wHB/view?usp=sharing
Permian basin output rises by 235 kb/d from Dec 2019 to Dec 2020 and by Dec 2025 output increases by 846 kb/d for this exceedingly conservative scenario, if oil prices remain at $60/bo (2018$) at the wellhead or lower for the Dec 2019 to Dec 2029 period, this scenario might be correct. I doubt oil prices will remain that low.
Note also that using the DPR is a mistake, better numbers for tight oil output from
https://www.eia.gov/energyexplained/oil-and-petroleum-products/data/US-tight-oil-production.xlsx
December 2019 Permian tight oil output is likely to be about 4000 kb/d and with the 5500 assumption for Permian tight oil well completions in 2020, Dec 2020 tight oil output is likely to be about 4230 kb/d for the Permian basin. The DPR includes conventional oil output from the Permian basin region.
Dennis
If the United States production growth really slows down that much, it will make OPEC very happy. Not only will prices start rising but they will be able to reverse some of their cuts.
Wayne,
I agree. Note that I do not expect production will slow to this degree, probably US tight oil output will grow by 400 to 600 kb/d in 2020, at current oil price level or higher (say Brent at 60 to 70 per barrel). Several oil CEOs have predicted about 400 to 500 kb/d growth in tight oil output in 2020 (Mark Papa and Scott Sheffield, I believe), they would have better insight than me, but my models agree with their assessment (when using reasonable completion rates).
The low scenario presented above would likely lead to higher oil prices which makes the scenario itself implausible in the absence of a major economic recession Worldwide, my crystal ball sees no major recession before Dec 2020, after that the picture is fuzzier. Also my guesses about the future are often incorrect as is true of nearly all scenarios of the future.
Dennis
400 to 600 is reasonable, it still allows OPEC To increase production and allow oil prices to increase to a reasonable amount.
Wayne,
Keep in mind a rise in oil prices might allow tight oil output to grow somewhat faster, the 500 kb/d increase assumes oil prices remain in the 50 to 60 range for WTI in constant 2018US$/bo.
If we see oil prices rise like they did in 2018, the increase in US tight oil output might be 600 to 800 kb/d from Dec 2019 to Dec 2020.
Hi Dennis,
When I see the dynamic in the EIA chart, combined with the declared spending reductions of almost all shale companies – together with the still falling oil price I can imagine completions falling back to 300 / month for the year before bouncing back on then finally rising oil prices.
The falling DUC count is a one time effect (perhaps someone in the oil field can help out with the theory):
Permian was pipeline restricted until mid / late 2019. So I think, many companies not only drilled but even prefracked some wells to set them online fast after they got the capacity (and the finishing materials: Tanks, pumps, separators, the whole stuff you need to get the oil).
So this artificial effect should be over now, and again drilling and finishing comes more together.
Eulenspiegel,
So far they have fallen to 438 in Dec., if we assume the y fall by 45 wells per month until reaching 300 and remain at that level for the rest of 2020 and then rise back to 500 new wells per month by 2023 (due to rising oil prices), we get the following scenario. Also note there are over 3000 DUCs in the Permian, at 300 per month they would last for 10 months, if drilling rate fell to zero, which is highly unlikely. Also despite the claims of others, the frac spreads that do not get stacked are the best equipment with the best crews and they will operate more efficiently than the average frac spread when counts were higher.
This is rather obvious from the lack of change in the rate of increase in output from June to October even though frac spreads have been decreasing since June. Eventually there will be some decrease in completion rate, a decrease from 550 to 300 seems an over estimate to me. The chart below shows what your scenario might look like.
Scenario below seems a bit more likely, wells completed fall to only 400 new wells per month (note that the average rate in 2019 was about 500 per month, so this would be about a 20% decrease in the completion rate, in addition, the completion rate will probably fall by more than this in other basins because they may be less profitable than the Permian basin which can break even at $55/b). In any case it is an alternative scenario, among an infinite number of possible futures.
This scenarion would be enough for a falling production 2020 (slightly, but falling) – and then the oil price increase after this “shock” healing some of the shale companies finances.
Eulenspiegel,
That is correct, but my expectation is that even this scenario is not very likely because falling tight oil output would quickly lead to rising oil prices and the completion rate would respond pretty quickly in my opinion, it is however more likely than a scenario where the completion rate in the Permian basin falls to 300 new wells per month for many months in a row.
The falling oil price now suggests that at least the 400 well model for this year can come true – nobody is earning anymore anything but on the best of the best spots. Time to reduce drilling if you live on cash flow.
Let’s see if Exxon get’s grilled for sinking so much money into shale.
Eulenspiegel,
Prices are about where they were for most of 2019. If tight oil output stops growing prices will rise pretty quickly imo.
So doubtful completion rate would be 400 for very long, perhaps 3 months.
Agree fully Tony.
I am trying to post an image of the overall L48 plot but it keeps giving me an error message.
Does anyone know if there is size limit on image files?
image size limit = 50KB
Snowback,
Yes 50 kilobytes is the limit, some times you can reduce file size by cropping or using paint to reduce resolution.
Here is the error message – if this posts, then I’ll know it’s my 94kb file JPG that it doesn’t like.
I have the same problem. I always post as a GIF. I have a lot more success with GIFs.
Thanks Ron – I’ll try GIFs going forward.
GIF at 57 kb
DPR L-48 data on a plot – good for indicative views and fun to look at that stellar legacy decline chipping away at prod growth each month.
Excellent chart.
Keep in mind that the DPR estimates of legacy decline are not very good, in addition if the completion rate decreases due to cutbacks in frack spreads, drilling rigs and capital investment, the legacy production change will change its slope to approximately zero (see Dec 2014 to May 2015 in chart above) or possibly the slope will become positive (see May 2015 to Aug 2016 in chart above).
In short trends can change. The completion rate will be a key factor.
I agree Dennis. Legacy decline will continue to grow as production grows and will shrink as overall production turns the corner at some point. When that happens over more than a few months we’ll know an overall decline is setting in.
See my first comment up above for the chart that indicated an apparent decrease in Permian completion activity over the past few months. DPR numbers are not the best, but they’re the best we can access. I’ve noticed when making updates that they are continually adjusting the volumes as far back as 10+ years. Small changes, but they continue to honor new data that comes in. The stars are aligning insofar as a possible slow/low growth 2020. (Not certain we’ll see a decline – that will depend on the global macro view with Oil Price being the major catalyst of change up or down.)
It is possible that this seasonal drop in frac spreads will reverse in the coming months, but being FCF positive is a major goal for the public operators. We have squeezed a lot of efficiency out of existing crews and there may be room for a bit more that could cause completions to go back up without material increases in frac spreads, so we need to watch for that too.
Thanks to all of you for sharing thoughts. I really like this site.
Snowback,
Thanks for your charts, the key for me is the completion rate (note that the completion numbers reported in the DUC spreadsheet may include conventional wells which confounds the analysis in my opinion).
I agree tight oil output will increase more slowly in 2020 than it did in 2019, but I am skeptical of the DPR forecast for November 2019 to Feb 2020, the EIA’s tight oil estimates by play is not perfect, but will be much better than the DPR.
One approach to compare with DPR legacy production change is to look at shale profile data. Use the peak production for 2017, 2018, and 2019 well profiles (from US update, Sept 2019) along with completion data from the DUC spreadsheet to find output from new wells (exclude anadarko completions because shale profile excludes Oklahoma data). Then use production change from EIA tight oil production estimates by play (and again exclude oklahoma basins and other lto) and combine to find legacy production change. Then add aback the DPR Anadarko basin legacy production change estimate to the total using the alternative method described above for the Bakken, Eagle Ford, Permian and Niobrara basins.
I get the chart below (where I have used the absolute value of the legacy production change).
Data from https://shaleprofile.com below
2017 avg well peak=578.6 b/d
2018 avg well peak=638.5 b/d
2019 avg well peak=679.3 b/d
WhatGraphing Software is used to make that Chart?
Hi Longtimber – I just used Microsoft Excel… The EIA provides their DPR data in a spreadsheet and I just downloaded it and then added and new tab to aggregate the data.
Then I added additional columns with summations and deltas to generate that chart view. Hope it’s useful to you all.
Any idea if any of the DUC wells are SWD wells?
With the number of wells growing plus increasing water cuts, I suspect more SWD wells are being drilled also.
Hi Shallow
Can you look up this well on your site if you get time. 04-013-20386 Venturini-Ginochio 6 it is the third well recently drilled in the largely abandoned Brentwood field California. The flow rates of the first 2 are extraordinary.
shallow sand,
Not sure. I assume SWD means “salt water disposal” (guessing at the “S”). The internet suggests SWD is indeed a salt water disposal well used to get rid of all the water produced in the frac operation.
I would think the “drilled” wells would be only tight oil wells, and disposal wells would be counted separately.
I have asked Mr Peters about his counts at https://shaleprofile.com
Dennis. Sorry about that.
Yes, SWD stands for salt water disposal.
It would be interesting (to me at least) to know how many of these wells have been drilled in the shale basins and how much water is disposed of daily in each of the shale basins.
shallow sand,
That data might be available on https://shaleprofile.com in the premium service, you might ask Mr. Shellman because he may have access to that service as Mr. Peters might have consulted with him. I only have access to the blog, which does give water per barrel produced.
See advanced insight presentation and slide all the way to the right
https://shaleprofile.com/blog/us-monthly-update/us-update-through-september-2019/
For the chart below I chose only the 4 major tight oil basins (Bakken, Eagle Ford, Permian, and Niobrara). The water oil ratio has climbed from about 1 bw/bo at the start of 2012 to 1.5 bw/bo from Nov 2015 to Feb 2017, then climbed again to 2 bw/bo from Nov 2018 to Sept 2019, this is the average for all 4 basins.
Ron & Dennis et al,
What do you guys think of the possibility of U.S, Saudi Arabia, and Russia all peaking between now and say 2025? Could be an interesting scenario if it was to occur in my opinion.
A very interesting scenario. And it will very likely happen well before 2025. The US will likely peak in 2020. Russia has already stated they hope to hole production around 11,2 million barrels a day for the next four years, through 2023. And you heard it here first, something very serious is going on in Saudi Arabia.
Nuff said.
Iron Mike,
I would disagree with Ron on the US peaking in 2020, I believe that only would occur if oil prices remain at $60/bo or less in 2018$ for WTI from 2020 to 2030 which is in my opinion a highly unlikely scenario in any case, but even more so should US output peak in 2020.
As to what serious things are going on in Saudi Arabia, I just do not see it. KSA is restricting output in an attempt to boost the price of oil. If other OPEC members continue to cheat, KSA may lose patience and might boost output for a time to punish other OPEC members and US tight oil producers and get some tweet love from the orange man.
Time will tell.
My guess remains that the World peaks when the US peaks and the US peaks when US tight oil peaks, my best guess remains 2026 for the US tight oil peak. With a scenario where WTI oil prices in 2018$ rise gradually from today’s level (about $55/b as I write this) to $85/b in June 2027, if we assumed a linear rise in oil price that would be $4.28/b annually and prices in July 2025 would be about $78.60/bo in 2018$.
I’m in the Coyne camp and a believer 90 to 100 dollar Brent will rise shale production about 3 million bpd from were we stand today.
Iran, Venezuela and Libya are all wild cards and have the ability to rise their production as much as 10 mbd. At least two of them today are having their production suppressed by America. All three of them have production costs far below shale. Today politics is a bigger constraint on peak than geology.
Huntingtonbeach,
The three nations you mention might be able to raise output by 5 Mb/d, 10 Mb/d I doubt. Also Venezuela is very unlikely, Libya probably will not see a resolution in the near term (but perhaps by 2025), perhaps another 1 Mb/d from them at some point (at most), Iran is the most likely place we might see an eventual increase, but no more than 1.7 Mb/d. A realistic expectation might be at most 2.5 Mb/d, because Libya probably wont increase by more than 700 kb/d, and Venezuela will probably be 2030 before they increase output significantly, by then the will just be reducing the rate of decline a bit.
In fact I expect at most, OPEC might be able to reduce the decline rate a bit, at best they will keep the World on plateau for a year or 2 before decline in US tight oil and other nations of the World overwhelm OPEC’s ability to increase output enough to keep World output on a plateau. By 2032 this will be very apparent.
Iran and Venezuela are both untapped Saudi Arabia potential. It’s just a matter of capex and politics. Without the American strangle hold on them. American production would be a third of what it is today.
That’s not a natural depletion rate below of Iran’s historical production. It’s suppression. I think 10 mbd are viable for a meaningful period of time.
https://www.bing.com/images/search?view=detailV2&id=401862C82DD2944A19381F16B27AE249868A4C85&thid=OIP.9nghI9oYe-4PTT3fEjxrKAHaFu&mediaurl=https%3A%2F%2Fwww.alternatehistory.com%2Fforum%2Fattachments%2Firan_oil_production-png.342312%2F&exph=1700&expw=2200&q=iran+oil+production+history&selectedindex=12&ajaxhist=0&vt=0&eim=0,6
Huntington beach,
I disagree on Iran. Doubtful they will be above 3 Mbpd in future. Venezuela has problems of their own making.
The US sanctions are a minor part of the problem. No idea when Libya problems will be resolved.
Iran has twice the reserve of the U.S. and it’s not shale. More reserves than Russia and maybe the Saudi’s. With pipelines, ports and wells it’s nonsense they couldn’t produce 10 mbd. It’s the reason the oil industry lead American government has been at war with Iran for the last 40 years. Venezuela is a simular story after kicking out American major oil companies.
10 years ago you would have called me nuts if I would have said the U.S. would be producing 13 mbd today.
Huntington beach,
Iran’s reserves are likely overstated. They may match Iraq in terms of output. I doubt they ever get to 5 Mbpd, but you are right I would not have believed even 8 years ago that the US would surpass the 1970 peak. If all nations produced flat out, nobody would bother producing oil because it would be too cheap to make a profit. At some point OPEC may flood the market and try to drive everyone else out of business.
If they keep the cartel together they can make more money restricting supply.
Ron
something very serious is going on in Saudi Arabia.
Hear say or something more tangible?
Hey, I said you heard it here first. That means it’s hearsay. 😉
?
More hearsay evidence. From an email I received on Oct 27, 2018. The author will remain anonymous. I think the BBO figure he and Art Berman came up with as of February 2016 was a little too low but not that far off. The 3.4% decline rate he uses is a little conservative at this point. That is, I think it’s higher.
Hi Ron,
Further to your post on the Giant Oil Fields of the World, it was interesting to see that not one commenter including the oil guys bothered to do the sums and show what was left for Saudi Arabia and to take into account five further years production since the report was made at the end of September 2013. Not one person made the connection about where Saudi might really be and in fact, over half the comments were on other issues not related to your post. Even so-called oil aware people don’t really get it.
Using the 3.4% scenario which is very conservative and taking gas out of the figures Art Berman and I calculated they had 32.886 BBO at the end of February 2016. Take another 8+ billion off for 2 1/2 years further production and things don’t look too good.
If that’s remotely near the truth then Aramco is a penny share.
KSA HL from Oct 2019
URR 330 Gb, cumulative production at end of 2018 is 153 Gb, leaving remaining reserves at 177 Gb.
Note that the Hubbert Linearization (HL) method has historically tended to underestimate the eventual URR. So this would be a conservative estimate. In 2012 the HL suggested a URR of about 250 Gb, this is in part because output rarely follows a Hubbert curve, so the method is flawed. It might give us an indication of a minimum URR, that is we might expect KSA URR to be no less than 330 Gb.
Older KSA HL circa 2012 (I misremembered the URR, it was 224 Gb).
Uses annual data from 1993-2011. The problem is that we are fitting a straight line to a curve that keeps flattening over time.
Dennis, Hubbert linearization was a valid form of analysis during the day of King Hubbert. That is, it was before reservoir top creaming with horizontal wells that skimmed the oil from the top of the reservoir was implemented. Now, for giant and supergiant reservoirs, we will no longer see a linear decline curve but a Seneca Cliff.
Hubbert Linearization is now worse than useless, it is absolutely deceiving. Reservoir top creaming with horizontal wells dramatically slows the decline rate. Until, until… we hit the Seneca Cliff. That is because reservoir top creaming also dramatically increases the depletion rate.
I have made that point many times before but apparently folks around here don’t believe a damn word of it. I have nothing more to add concerning Hubbert Linearization.
Hi Ron,
Still waiting for data to back up your theory.
Have you seen the Seneca cliff for US L48 (excluding GOM) conventional output?
Me neither. 🙂
Dennis, those fields peaked in 1970, or a few years either side of that year. They all had a linear decline rates. because top of the reservoir creaming with horizontal wells was not used in those days. Also, we are only talking about giant and supergiant fields.
Ron,
The same technology has been applied to US fields as has been applied to the Saudi fields.
So far, no cliff.
We could also look at Alaska North Slope, no cliff.
How long has this Seneca cliff been predicted? It seems since about 2005, perhaps we will see it some day.
Also keep in mind there are many fields, all will not see the steep decline you envision simultaneously (or the odds are extremely low).
So I will go with Laherrere’s estimate, which has tended to be very conservative, that estimate is 300 to 350 Gb for KSA URR.
See page 98-99 of
https://aspofrance.files.wordpress.com/2018/08/35cooilforecast.pdf
Are there any examples of giant or supergiant onshore fields that have experienced the Seneca cliff you are claiming?
The same technology has been applied to US fields as has been applied to the Saudi fields.
No, it has not. This creaming practice was not implemented in giant and supergiant fields until early this century. I will post more on this a little later, down below.
But if you have any evidence that this creaming practice was implemented on US fields before, at, or shortly after peak, then please post that link and you will receive my most sincere apologies.
Ron,
In twilight in desert Matt Simmons mentioned one field where that was the case for early in the 21st century. It is far from clear this is wide spread or that it began at the start of productio for many of these giant fields, my point is that this was probably applied worldwide to all giant fields. KSA is not unique except that they have more giant fields than most.
It is far from clear this is widespread or that it began at the start of production for many of these giant fields,…
Errr… are you serious, or are you just trying to be funny? At the start of production for Ghawar? In 1951? No, creaming with horizontal wells did not start in 1951.
I don’t know what else to say Dennis because I am so baffled by your assertion that this started with the start of production for these giant fields.
Dennis, read the post that I posted below that Saudi wrote in 2006. This all started early in this century and not before. They said so. Dammit Dennis, take their word for it. You believe them when they say they have 266 billion barrels of reserves but you do not believe them about what they say about this new drilling process that got their decline rate down from 8% to just over 2%?
Of course this process of infill drilling with horizontal wells along the surface of the reservoir has spread around the world. Russia has been doing it for about 15 years.
No giant or supergiant fields has come on line in this century. Kashagan Field, discovered 2000, may be an exception but they have other serious problems there. Jupiter Field in Brazil is close to a giant field but that may turn out not to be so productive after all. That will be very expensive oil.
see pages 316-317 of Twilight in the Desert, the field I am talking about is Shaybah, which started producing in 1998 and changed to MRC wells in 2002.
Older fields would have had such technology implemented around the time you suggest, rather than 1951. Not all Saudi fields are Ghawar.
The various giant and supergiant field would have had such technology applied long after they started producing. This would have been applied in the US, Russia, and other nations, not only in Saudi Arabia, they do not have unique technology.
Shaybah is a new field, far from peaking. No, not all fields are Ghawar. But half of Saudi’s production has traditionally come from Ghawar. And the decline of Ghawar is a really big deal. And most of Saudi’s other giant fields are well past peak also. Only about 25% of Saudi’s production comes from fields that have not yet peaked. That’s just a guess of course, it may be slightly smaller or slightly larger than that.
But as Ghawar goes, so goes Saudi Arabia. If Ghawar is dying, if the largest oil field in the world is dying, this is a big deal, I mean a really big fucking deal.
Chart below shows all data 1973 to 2018 with a power law trendline.
This gives a better feel for the curved line, note that using an exponential trend line is not as good a fit with R squared =0.6183 vs 0.7719 for the power law fit. The main point is that the data fits a curve, not a line.
I doubt the power law is the best way to model this, the best way is a geophysical estimate, but we do not have such an independent estimate. Bottom line, we do not know how much oil will be recovered in Saudi Arabia, but my guess is that it will be 350 to 450 Gb.
Jean Laherrere estimated about 300 to 350 Gb for KSA URR in October 2018, he chose 2005 to 2017 for the data to use for his HL (result of 350 Gb for URR.) If an HL on 2006-2018 is done, the URR is 447 Gb in that case. That is the basis of the 350 to 450 Gb URR estimate for KSA, which would suggest 200 to 300 Gb of remaining reserves at the end of 2018.
Dennis,
I am quoting wikipedia here so take this with a grain of salt. It states that:
The proven oil reserves in Saudi Arabia are the 2nd largest in the world, estimated to be 268 billion barrels.
As of 2016, Saudi Arabia cumulative oil production reached 143.97 bbl
Wouldn’t remaining oil reserves = reserves – cumulative production?
If that is the case ~124Gb
Proven reserves is the remaining reserves, it does not include cumulative output.
At the end of 2018 cumulative production was 153 Gb.
URR is reserves plus cumulative production.
Note that the 268 Gb is likely 3P reserves. 2P is the best guess estimate which would be 172 Gb at the end of 2019 based on the estimate of Jean Laherrere.
In my view Jean Laherrere’s estimates are very good, historically they have been conservative.
Ron
Do you think that things have changed in SA since Nawaf Obaid made his presentation in 2006 and said the following:
“The oldest field, Abqaiq, is 74% depleted, and the world’s largest
field, Ghawar, has produced just under 50% of its reserves. By
contrast, Shaybah, one of the Kingdom’s youngest fields, has 95%
of its proven reserves remaining.
• Without “maintain potential” drilling to make up for production,
Saudi oil fields would have a natural decline rate of a hypothetical
8%. As Saudi Aramco has an extensive drilling program with a
budget running in the billions of dollars, this decline is mitigated to
a number close to 2%.
• These depletion rates are well below industry averages, due
primarily to enhanced recovery technologies and successful
“maintain potential” drilling operations.”
To go from 2% decline to 3.4% would suggest a major reduction in “Maintain Potential”, possibly due drilling fewer wells or new wells not being as productive as they were in 2006
“What do you guys think of the possibility of U.S, Saudi Arabia, and Russia all peaking”
It seems likely, or very close.
Which begs the questions-
What is the shape of the global production downslope- how steep/how long?
How do countries of the world react to shortage?
Assuming people behave, and major producing regions do not fall into ‘failed state’ situations [like Venezuela, Iran, Libya this decade], the tail of production after peak can be fat and long, and thus give time for adjustment to some degree. Such as electrifying transport, living smaller and more local.
But if people act as people tend to, the majority will fail to be proactive at scale, and will face shortage. People fight over shortage of important things, like food or energy. How many USA aircraft carriers have been trolling off the Persian Gulf over the last 5 decades? What is China doing building a road and port system to Iran/Iraq?
I suspect that beyond peak, there will be a major ‘freak out’, and scramble to control access to the affordable crude still up for sale. Big shuffle in geo-political alliances. Some prosperous areas may become zones of poverty.
Example. S.Korea imports over 90% of its energy needs, to keep it warm and support the very big industrial economy. Will they be able to compete with China, Japan, India, and other big sources of demand. Their ports are farthest down the sea-lanes from the gulf.
Example, will Europe be able to stand up to Russia when she takes Latvia, Lithuania, Estonia, and the rest of Ukraine, if she is the source of their energy supply?
Best hope is for things to deplete slowly. And for people to change, their expectations and demand for it.
Hickory,
An alternative to the freak out (similar to your “optimistic” scenario) is that the rise in energy prices leads people to buy more efficient products to save money, to insulate their homes, perhaps purchase a Passivhaus to save money over the long run, or to buy a plugin hybrid or EV, perhaps install solar panels. Perhaps government implements energy policies that expand alternatives to fossil fuel as quickly as is feasible, when they realize the alternative is a severe energy shortage.
Peak oil might have the tendency to focus the minds of people on solutions to the problem, including simply using less energy, huge reductions in energy waste are possible, that is the first step, then replace the remainder with wind and solar.
It will be a challenge no doubt.
Agree.
The challenge will be getting it done at scale, and quickly.
By my measure we are far behind schedule, although the low oil price would argue against me on that.
For the moment.
There is vast amounts of natural gas which can easily bridge the shortfall of oil for 20 years.
https://www.iangv.org/
cars, trucks and ships are already using LNG and natural gas
and electric vehicles will help considerably also
Wayne-
“vast amounts of natural gas which can easily bridge the shortfall of oil for 20 years.”
Well, not so easy, the numbers just aren’t there.
Percentage of global primary energy consumption-
Oil 33%
Coal 27%
Nat Gas 24%
If we consider the 20 year timeframe you suggest, and assume no global energy supply growth (meaning on average less energy /capita since by 2040 the population will be more than 15% higher than it is today = 9.2 Billion),
then Nat Gas will need to replace the lions share of the depleting oil and coal (which today equates to 60% total global energy).
Nat gas will be peaking in this timeframe as well.
To be sure, Nat Gas will be useful as a ‘Transition’ fuel, but it is a rearguard action at best.
Transition means that you are changing to a new state of affairs.
Do we get that?
I’d say no. Not yet.
Not til we are shorthanded (and far far behind schedule).
With the amount of new NatGas power plants under construction, I doubt we will have much spare capacity of NatGas. Also NatGas requires a lot of infrastructure (ie Piplelines). While there might be a lot of NatGas, a lot of it is inaccesible to to lack of piplelines.
Coal would have been an option if it wasn’t taboo. Coal can be transported using rail lines as well as cargo ships and barges.
But “Transition” really does exist since there is no energy resource to transition to. No way will replacing a high density energy source like oil with very low density\intermittent & high infrastructure costs like solar and wind.
That said it not just energy that is a problem. Its also Debt & the Demographic cliff that is going to hit the global economy this decade. Oh and we are also now locked into a new cold war between the US, China & Russia, which is going to suck on a lot of resources that could be used for mitigation projects.
What really would be the most practical:
1. A lot more Mass transit in the US & also a lot more rail freight infrastructure.
2. Much more energy efficient housing & commerical buildings. Even modest improvements for insulation and replacing inefficient HVAC & appliances would help
3. Stop turning the US’s best farm land into urban sprawl. The Midwest has some of the best farm land in the US and also had ample rainfall which didn’t require much irrigation.
Dennis,
While as we both agree, predictions are hard, especially about the future, and i also agree that the scenario you presented to Hickory, has some probability it could come to fruition, I disagree with it.
The buck stops when economic growth stops. The scenario you presented assumes money has the purchasing power you give it. I don’t believe it will.
Without sustained cheap energy —–> economic growth (rinse and repeat), money will start to lose its value, and people will start to lose confidence in the system. I know it seems like a ridiculous scenario, but for me currently it seems plausible.
Iron Mike,
The idea that loss of cheap energy supplies will result in economic contraction is one that I and many others agree with, wholeheartedly in my case.
Sure we can squeeze out the fat (waste and poor efficiency, and frivolous use), but that will only go so far.
Transition/adaptation takes a lot of capital, at a personal level and countrywide. Between debt, demographics, poor spending priorities, most countries are very poorly composed to handle a massive transition, even without an economic contraction on hand.
I think your concern is not only plausible, but spot on.
Iron Mike Wrote:
“The buck stops when economic growth stops. The scenario you presented assumes money has the purchasing power you give it. I don’t believe it will. ”
Real economic growth died about 20 years ago. Since then, growth has been artificial driven by ultra low interest rates and piling on debt to the moon. If interest rates where to be normalized the global economy would quickly fall into an economic depression.
The 2020s will be a struggle:
1. Global Oil production will peak (or already has)
2. Consumers & companies are drowning in Debt. Just about every major US company has debt ratings just above junk, as the borrowed trillions to fund stock buybacks. Consumers are struggling with 78% of americans living paycheck to paycheck, and would end up homeless in a few months if they lose their job. Consumers are switching to long duration auto loans (10 years or more) and often roll the debt from their old vehicle onto the new auto loan.
3. Demographics cliff is going to hit in the mid 2020s as the majority of boomers head into retirement. It probably would have happened sooner but a lot of boomers continued to work well past retirement age. But age related issues will likely prevent most from working into their mid to late 70s.
4. Lack of skill sets of younger workers needed for the 21st century economy. They need Tech\STEM Skills in order to obtain good paying jobs. Most younger workers also avoid trademen jobs, even though the pay considerable more than retail & office jobs.
Iron Mike
The difference is you believe there will be a lack of energy,
I do not. Prices will change so that available energy will be adequate. Population growth will slow alternatives to fossil fuels will ramp up, and energy will be used more efficiently.
It will be a challenge and perhaps economic growth will be slower, in OECD nations that would be good for the environment, as nonOECD nations catch up their growth will slow as well.
In any case, the fact is we can only speculate, maybe Malthus will be proven correct, I am skeptical.
Dennis Wrote:
“Prices will change so that available energy will be adequate. Population growth will slow alternatives to fossil fuels will ramp up, and energy will be used more efficiently. ”
Price increases just ration a resource. If cost of staying in a 5-star hotel or eating at the finest restaurants was low, there wouldn’t be any dive hotels & restaurants.
High energy costs will send employment soaring as consumers and business cut back spending. Already the global economy teters on the edge and another recession will send it plunging. Central Banks & gov’ts are using every financial gimmick just to avoid a global depression.
Central Banks & gov’ts are using every financial gimmick just to avoid a global depression.
I have to agree with you here. The amount of liquidity the Fed is pumping into asset classes is something never been witnessed. The market distortion and the discord between the real economy and the stock market has never been greater in my opinion.
High energy costs will send employment soaring as consumers and business cut back spending.
I guessing you mean unemployment. Actually, high energy prices will shift spending from spending on operating costs for energy to investment in energy efficiency.
Whether this shift is disruptive depends on how quickly prices rise. That is why, for purely economic reasons, as opposed to ecological reasons, it make sense to tax all commodity consumption.
Historically, commodity markets suffer from wild price swings compared to manufactured goods. As a result, they make the booms and busts of the business cycle more intense, because the value of inventories change less when no commodities are involved.
Business cycles have been losing intensity in recent decades, probably thanks to leaner supply chains. Another factor is the reduced dependence on commodities. As a percent of total GDP, commodity demand has been steadily falling. This includes energy consumption but also metals and agriculture. Reducing the total (relative) value of commodities reduces one of the key drivers of economic instability.
“Population growth will slow, alternatives to fossil fuels will ramp up, and energy will be used more efficiently. ”
All very true Dennis, but the timing and magnitude of these factors are very unlikely to be in sync.
For example, over the next thirty years, the global population will grow to 9.8 billion, according to the UN. That is the equivalent of a adding a new China, USA, Japan, and Philippines combined.
In the meantime, global primary energy supply from fossil fuel will decline significantly. You can probably estimate by how much as well as anyone.
It is doubtful that ‘renewables’ can be ramped up globally to significantly slow the energy decline/capita in these decades.
Maybe a nice equilibrium of sorts will be achieved somewhere further down the road.
But in these coming decades the ingredients are already in the pot for a sharp decline in energy/capita, as I see it. And the ‘world’ seems generally unaware of it coming.
note- some locales will ramp up renewables at scale and quickly, and some will still have fossil fuel. Some will be blessed in both ways, and will have water, and good land well above sea level. They will be desirable areas.
Dennis,
If population growth slows (which is currently happening) then consumption will decrease (which is what is happening) then growth will slow (which is what is happening).
Without cheap energy everything stops.
Again i totally agree, we can only speculate.
Hint:
We added 83 million people to the planet last year, the population of Germany.
But agree, we will have a negative population in this coming decade–
if my analysis is correct (however, I have been wrong before)
Black Swan of the Month Part 2: Coronavirus in China (after near war with Iran first half of month)
Airline travel is likely to fall steeply in the coming months across Asia, curtailing oil use by hundreds of thousands of barrels a day.
Also, the blow to China’s economy may be the pin that pricks their debt bubble, finally pushing their economy into recession and sending oil price down by $10-$30/barrel.
Or I’m overreacting and nothing will happen…
A recession in China is growth falling from 6% to 4.5%.
As for the horrors of Chinese debt, it’s 46% of GDP. The US is 103% of GDP.
The PBOC’s infinite money is no less than the Fed’s infinite money.
Total Chinese debt = 303% of gdp
https://www.reuters.com/article/us-china-economy-debt-idUSKCN1UD0KD
After not having had a recession for 40 years it seems likely to happen at some point.
Also oil prices fell about 20% for several months during the SARS outbreak 02-03.
Nah, the statistics have been going on for decades. Total US debt, measured the same way they are measuring, has to include consumer, corporate, non-incorporated businesses, mortgages, state, local, nonprofit, and the national debt. That adds up to about 500% of GDP. It’s not really relevant to anything.
Numbers, who needs em?
Total Chinese debt = 303% of gdp
You are confusing total debt with government debt. As your link states:
>i>China’s total corporate, household and government debt rose to 303% of GDP in the first quarter of 2019
Watcher’s 103% refers to federal government debt only.
A good benchmark is the EU, which sets a goal of 3% government deficit, and 60% total debt.
America’s real problem is foreign debt, mostly private. As a whole Americans save too little. Foreign debt happens when domestic investment exceeds domestic savings.
This is another reason why oil should be heavily taxed at the pump. The money could be used to pay off the national debt, and it would shift transport investment (public and private) to more fuel efficiency.
Among OECD countries, America has among the lowest fuel prices, the least energy efficient transportation system, and the highest foreign debt per GDP.
Americas complain a lot more about slight changes in oil prices a lot more than other OECD countries. The reason is clear: Since so much of the cost of fuel at the pump is the cost of the raw material, it is almost impossible for American consumers to plan their investments wisely. They complain not because they whiners, but because they are caught out in the cold without a blanket.
In rich countries with high fuel taxes, consumers are faced with much less intense swings in fuel prices, thanks to high taxes. So their planning seems more intelligent than American planning. Actually they have a much easier calculation to make, so the do a better job of it, never getting caught out with gas guzzlers in times of high oil prices.
Stephen
This coronavirus would have to get much worse to do that sort of damage.
Seasonal Flu can kill up to 650,000 in a year.
https://www.ifpma.org/global-health-matters/flu-can-cause-up-to-650000-deaths-a-year-globally/
And its a moving target—
As anyone can see.
Hi Wayne, it’s not the number of deaths that matter so much as the fear generated by the novelty of the virus threat, along with government restrictions on travel to contain it.
Dennis wrote above: Still waiting for data to back up your theory. (Seneca Cliff).
Theory or common sense? I give you this post from an ARAMCO agency from November 2006. Please check it out for yourself.
Saudi Arabia’s Strategic Energy Initiative: Safeguarding Against Supply Disruptions
Scroll down to “Saudi Oil Field Depletion Rates”. Bold mine.
• The Kingdom’s average state of reserve depletion for all its fields is
approximately 29%.
• The oldest field, Abqaiq, is 74% depleted, and the world’s largest
field, Ghawar, has produced just under 50% of its reserves. By
contrast, Shaybah, one of the Kingdom’s youngest fields, has 95%
of its proven reserves remaining.
• Without “maintain potential” drilling to make up for production,
Saudi oil fields would have a natural decline rate of a hypothetical
8%. As Saudi Aramco has an extensive drilling program with a
budget running in the billions of dollars, this decline is mitigated to
a number close to 2%.
• These depletion rates are well below industry averages, due
primarily to enhanced recovery technologies and successful
“maintain potential” drilling operations.
Ignore the fact that the author of this piece, in that last paragraph, confuses “decline” with “depletion”. They got their decline rate down to almost 2%, not their depletion rate.
Okay, we have fields that are declining, in the early part of this century, at an average rate of 8% per year. Then a massive infill drilling program was implemented. They plugged all their vertical wells at just above the waterline. Then they drilled many horizontal wells with their laterals just below the very top of the reservoir. Then they managed to get their decline rate down from 8% to almost 2%.
Question: What will be the ultimate result when the water hits these horizontal laterals at the very top of the reservoir? A linear decline from that point? I think not.
I ask again, theory or common sense?
Dennis wrote above: Are there any examples of giant or supergiant onshore fields that have experienced the Seneca cliff you are claiming?
I would suggest the northern two thirds of Ghawar, the fields Ain Dar, Shedgum, and Uthmaniyah.
Ron
Funny. I should have scrolled down a little further before posting above.
No problem Ovi. I am glad you are aware of this Saudi document. It says far more than most people realize.
I think the decline rate in Ain Dar, Shedgum, and Uthmaniyah is far greater than 3.4% per year. I would guess closer to 10% or higher.
Okay, the idea the shit is about to hit the fan in Saudi Arabia is just a hunch of mine, based on a lot of data that I have collected over the years. And if I am mistaken, please feel free to remind me of it later, as I am sure others will do also. 😉
Ron,
Can you define natural decline rate?
Can you define natural decline rate?
Shocker: Yes I can. A natural decline rate is a decline rate that takes a linear or almost linear path from maximum production to zero. Look at the decline path of Prudhoe Bay, or almost any of the North Sea fields that are in decline. Almost all deep-sea fields will have a natural decline rate.
A given percentage decline will have a long tapering tail. This is all part of the natural decline rate even though the percentage will naturally change as production gets lower and lower.
Saudi Arabia knows what a natural decline rate is. Their own words:
• Without “maintain potential” drilling to make up for production,
Saudi oil fields would have a natural decline rate of a hypothetical
8%.
An unnatural decline rate would happen if you managed to keep the decline rate at near zero, or unnaturally low until the water hits the horizontal laterals at the very top of the reservoir. A Seneca Cliff would be an unnatural decline rate.
Important Edit: All shale wells will have a natural decline rate. They have no water drive. Their production will just naturally taper off. So just look at any of Enno Peters’ charts and you will see a natural decline rate. Legacy decline of shale wells is the very definition of a natural decline rate.
Ron Asked:
“Question: What will be the ultimate result when the water hits these horizontal laterals at the very top of the reservoir? A linear decline from that point? I think not.”
1. The now use smart ports along the lateral so that they can shut them off when the water level rises above the port.
2. The redrill the laterals above the old ones so that the can avoid high water cuts. However this becomes more of a problem as the oil column shrinks. Also, due the topology, a lot of oil can get caught in pockets that they need to drill new vertical wells to extract the trapped oil.
Saudi Americo used to post annual tech articles on their website, but they removed them all. That’s how I got the above information (probably in 2014 or 2015 when they last posted them on the website).
Hey, they are fighting declining production in every possible way. I am proud of them. But there is just so much oil left in those old supergiant reservoirs. The inevitable is happening right now. The problem is, and it is a very serious problem, that a lot of people still believe that very stupid propaganda that Saudi has about 267 billion barrels of oil still left in the ground. When the truth finally comes out, that will be the shock felt around the world.
Ron Wrote:
“When the truth finally comes out, that will be the shock felt around the world.”
I am not sure the truth will ever come out. My guess either the global debt crisis unfolds first, or they just start another global war.
I don’t see how the global economy will be sustained beyond the 2020s.
Perhaps they have even 267 billion barrels – but it’s trapped in a billion small pockets…
So it’s not possible to get without investing trillions of $ and drill even more wells than the avarage US C quality fracker.
I think they have created much damage in the early 50s and 60s when tapping the fields with a few big producing gushers, creating big water channels separating trapped rest pockets of oil.
Ron,
By Laherrere’s estimate at the end of 2018 2P reserves were 147 to 197 Gb.
He is a very wise man in my opinion.
If that were true, if they had 200+ gb of easy acessible reserves they would have hit thier 12mbd target they set wath 10+ years ago?
Also they would not build artificial islands to tap offshore.
They would not go to the negotiate table about the neutral zone if they had all the cards, then time would be on their side and their position stronger the longer they waited.
Ill post a link later as from a previous discussion originating here i did manage to find alot of stuff that supported “common sense” about the state of the northern part of ghawar including images of water saturation development with dates included.
Baggen,
Ten years ago, nobody believed the US would be producing 12.7 Mb/d in 2019, the reserves were not developed because the market was over supplied.
Note that nobody claimed these reserves were “easy” to produce.
Northern Ghawar is likely very depleted, last I heard Ghawar was at only 1500 kb/d, most of the decline likely was in the northern part of Ghawar.
Ron,
In 1981 those three fields were producing about 5700 kb/d, in 2018 estimates are that Ghawar was producing about 1500 Mb/d, if we assume 850 kb/d was produced from these three fields (a guess as we do not have the breakout). That would imply a 5% decline rate over the entire period.
Alternatively Simmons estimated about 4500 kb/d from Ghawar in 2000 (we will assume all of this was from these north Ghawar fields), if we assume in 2018 about 1000 kb/d was still being produced by these fields ( another guess) we would have an average annual decline rate of 8%.
We do not have the production history for these fields, but my main point is that a Seneca cliff for all of Saudi Arabia is not very likely.
For UK + Norway from 2003 to 2011 the decline rate was about 7.3% per year on average, but we would expect offshore fields to decline more quickly because the tail gets cut off more quickly for expensive offshore rigs.
As to what happens with giant and super giant onshore fields as a group remains to be seen, I maintain the odds are low they will all experience steep decline simultaneously.
In 1981 those three fields were producing about 5700 kb/d, in 2018 estimates are that Ghawar was producing about 1500 Mb/d,
Good gravy, where did you get that estimate. The ARAMCO IPO put Ghawar production at 3.8 million barrels per day in 2018.
if we assume 850 kb/d was produced from these three fields (a guess as we do not have the breakout). That would imply a 5% decline rate over the entire period.
You assume that Ghawar or these three fields began to decline in 1981? Now that is even more alarming. Where on earth did you get this information? No, these three fields likely began to decline somewhere between 2009 and 2012. (The other two Ghawar fields are not declining at all.) Ghawar, in the first decade of this century produced an average of 5 million barrels per day.
Dennis, you are just making way, way, too many erroneous assumptions. So many that I have no idea how to continue this conversation.
Ron,
If you were forced to make a rough estimate of the remaining reserves in Saudi Arabia, what would be the figure ?
Not more than 50 billion barrels and not less than 30 billion barrels.
Hi Dennis, This comment is in regard to the exchange you had with Ron about how much is left in Saudi reserves, Hubbert Linearizations, least squares, Seneca Cliffs, and saltwater disposal wells.
I’ll start off by saying that of course none of us know what’s left in the Saudi “tank”. That is their most important state secret. I remember when I first read Dr. Nansen Saleri’s 2003 aapg article describing the well technology they had developed. Maximum reservoir contact multilateral wells, geosteering, downhole intelligence, these were super-wells, and they were drilling them in some of the best reservoirs known. It was clear that they would effectively recover more of the downhole resources, quicker and more completely than before. These wells were gamechangers. Ron calls this creaming. They have been drilling these wells for almost 20 years now, and I am sure they have gotten even more efficient.
There is really just one drawback. After that expertly placed horizontal lateral in the very top of the formation in the modeled and monitored field waters out you are done. Most of their fields have been using water injection as a pressure support and sweep for years, there is no secondary recovery, and apparently tertiary techniques such as CO2 or polymers have not worked well due to the nature of the reservoirs.
There were articles a few years ago that inferred Abqaiq was close to done, with parts of Northern Ghawar severely depleted. The USA has massive oil resources over a large geographic area which vary from very good to poor in quality, and when one plays out the industry has been able to find other area’s to produce. KSA has a much smaller geographic area of oil production.
Even though it may not fit your model correctly, I believe many knowledgeable people expect KSA to have big declines at some time. Of course the 64 dollar question is when. It could be that recent cuts in their production have been to hide declining production capabilities, or it could be that they are just cutting to aid Opec and ease the glut. You decide which makes the most sense, and which fits your curve best.
By the way, salt water disposal wells (SWD) have been an essential part of the oil business basically forever. Some wells produce much more salt water than oil. About 40 years ago I had a client who had a plant near Snyder, Texas which concentrated brine then used electrolysis to produce magnesium. Their technology wasn’t great, and when they lost power they had chlorine gas releases. They issued you a gas mask when you went in. AMAG was not profitable, but it might have eliminated some SWD’s if it had been.
Dclonghorn,
Agree we do not know what is left,
We can only speculate.
Jean Laherrere’s estimate for a URR of 300 to 350 Gb for KSA seems reasonable, my guess is 330 Gb minimum.
Note also that recent reports put Ghawar at 1.5 Mb/d, so it does not dominate KSA output as was true in the past.
Note also that natural decline rate of a field is mostly theoretical, it is the rate of decline that would be observed if all new drilling and well maintenance ceased. In practice this never occurs until a field reaches the end of life.
Are potential March OPEC cuts by Saudi Arabia voluntary or involuntary?
DUBAI- Saudi Arabia’s Minister of Energy Prince Abdulaziz bin Salman Al-Saud said all options are open at an OPEC+ meeting in March, including further cuts in oil production, Al Arabiya television reported on Thursday.
https://www.zawya.com/uae/en/markets/story/Saudi_Arabia_says_all_options_open_at_OPEC_meeting_including_further_cuts-TR20200123nD5N260027X2/
A clue to Saudi Arabia remaining oil reserves is to assess their behaviour. If a country’s oil in its tank is decreasing then energy diversification would be an expected behaviour. This is exactly what happened in Davos this week as Saudi energy minister stated.
https://www.msn.com/en-ae/news/other/saudi-arabia-a-e2-80-98pioneer-e2-80-99-in-energy-transformation-minister-tells-davos/ar-BBZdYeW
or
https://www.arabnews.com/node/1616771/business-economy
On a panel titled, “The Future of Fossil Fuels,” with other energy industry leaders, the prince told delegates that Saudi Arabia was a “pioneer” in many areas of clean energy production and usage, and that it had taken big steps toward diversifying its energy mix.
We are converting our power sector and its energy mix to a point where by 2030 I am confident we will become one of the top producers of solar energy and renewables.
He spoke of the embryonic nuclear industry in the Kingdom, where Saudi policymakers were seeking international partners for the peaceful use of nuclear power. “We’re also getting involved in nuclear, because we want to have all our options open.”
Thanks, Tony. A few months ago, when Saudi made dramatic cuts in production, way below their quota, I began to suspect something was going on there. Then a few weeks ago I thought: “Damn, this is serious. Saudi is having serious problems.” Now, I am of the opinion that a person would have to be stone ass blind to think everything is fine and dandy in Saudi Arabia and believe they are just navigating for higher prices.
Ron,
Aramco’s share price has also fallen about 10% from its high last year.
https://www.tradingview.com/symbols/TADAWUL-2222/
Ron,
We will find out if your hunch is correct when oil prices rise to $80/b.
Tony
Why did Saudi Arabia continue to grab market share in 2015 and 2016 driving prices down to $25 per barrel. Why try and grab 10.5 mb/d of market share at massive cost if you could not produce that much for more than a few years.
Driving the price of oil down that much cost Saudi Arabia over $700 billion over 3 years.
They could easily have cut production in 2015 and kept oil prices at $100 plus. and hauled in vast amounts more money for doing much less.
I don’t know how much oil KSA has or can sustainably produce but their production boost managed to kill offshore exploration as well as many other long term projects (e.g. oil sand). That is where the bulk of new supply was supposed to come from to offset decline… Most people focus on the short term budget balance and if/how they affected LTO. KSA is in this for the long term and the lack of upstream investments will be felt in the 2020’s. If, and this is a big if, their production is at a plateau or has peaked than severely wounding the biggest competitor just before their own production peaks makes sense, at least to me.
Jeff
Saudi Arabia could have had a high price of oil for the last 6 years and the next 20 also.
Oil was over $100 for 4 years and the world economy grew quite well.
$30 per barrel x 10.5 million barrels per day x 365 = $115 billion per year
$80 per barrel x 9 million barrels per day x 365 = $262 billion per year.
$110 per barrel x 8 million barrels per day x 365 = $321 billion per year.
Personally I would take $321 billion for selling 8 million per day.
take a look at what happened in the 80’s when they opted for that strategy. Spolier alert: lower demand and higher supply from competitors.
Jeff,
Where would we expect the supply to come from? In the 80s we had North Sea, Alaska, West Africa, GOM deepwater. We would be likely to see far less growth today, though we would probably see some growth at $110/bo and some cheating at OPEC.
I think the main difference in a high price environment would be lower demand (lower economic activity, faster adoption of alternative fuels and a more fuel efficient fleet).
I don’t think it would be that much additional supply but it would be more than what is the case now. Rigs that are cold stacked or even dismounted find less oil than those that are put into work. Exploration and investments that have not occur in the last 10y or at a slower pace, but perhaps would have in a high price environment: GTL and CTL, Canada’s oil sands and their pipelines (Keystone, Trans mountain, Line3), Barents Sea, Brazil, Arctic (?).
Jeff
Spoiler alert. This is not the 80s.
Alaska is depleted, the North Sea is 70% depleted. During the last 20 years of relatively high oil prices global discoveries have averaged 12-15 billion barrels per year. Considerably less than consumption.
Improvements in directional drilling and fracking have allowed for production of tight oil in the US.
There is no threat to Saudi Arabia from some great new oil frontiers, the best in the last 20 years has been Brazil pre-salt which holds a fraction of what the North Sea had.
We will see what higher oil prices bring
Kuwait to resume oil output from the neutral zone by March 2020
Fields in the so-called neutral zone can produce as much as 500,000 barrels a day—more than each of Organisation of Petroleum Exporting Countries’ (OPEC) three smallest members pumped last month.
Kuwaitis and Saudis alike have said a resumption would be unlikely to add significant amounts of oil to the market within the current duration of the OPEC’s production cuts deal, which runs until the end of March 2020.
It looks like both Saudi Arabia nd Kuwait are desperate for more oil production. Restarting the Neutral Zone will only add 250,000 barrels/day to each country’s production.
It’s reducing costs for them. Tapping this not very depleted field is much cheaper than squeezing their old ones hard.
Agree
Production from these ranked 25 top US pubic shale oil companies should slow as shown by decreasing quarterly crude oil production changes in chart. ExxonMobil (XOM) & Chevron (CVX) shale oil are growing fast about 10% per quarter but probably not enough to offset declines from other operators.
Shaleprofile.com has about 1,200 US shale oil operators. Many of these smaller operators may be taken over by larger ones as access to capital becomes too restrictive.
1o top ranked by 2019Q4 shale crude oil production:
1 Occidental incl Anadarko acquisition 0.50 mbd
2 EOG 0.47 mbd
3 ExxonMobil (XOM) 0.34 mbd
4 ConocoPhillips 0.28 mbd
5 Pioneer 0.22 mbd
6 Concho 0.21 mbd
7 Continental 0.20 mbd
8 Marathon 0.20 mbd
9 Diamondback 0.19 mbd
10 Ovintiv incl Newfield acquisition 0.18 mbd
XOM crude oil data is taken from shaleprofile.com, averaging three months into a quarter. XOM shale crude oil production rate increased by over 60% from 2018 avg to 2019 avg. If XOM continues this growth rate into 2020 then US shale crude oil production could grow very slowly in 2020. Also, increasing CVX shale crude oil production could help in 2020.
This is a recent forecast from ExxomMobil for its Permian and Bakken production but it combines crude, NGL and natural gas.
https://corporate.exxonmobil.com/-/media/Global/Files/investor-relations/quarterly-earnings/presentation-materials/2019-presentation-materials/earnings-presentation-3q.pdf
This is similar forecast from Chevron for its Permian basin.
https://chevroncorp.gcs-web.com/static-files/3fbe253f-0b1d-454b-849a-0701005b5941
Let’s see how this plays out at the current oil prices.
When their earning tanks too much, they’ll see an investor revolt very soon. An almost red ink company in times of all time highs at the S&P doesn’t make investors happy.
Oil hasn’t been near $100 for 5 years. Earnings report quarterly.
There’s been five years to play out. Playing out process seems to be increasing output, as the price declines.
How very amusing.
Yes the World is complex and price is not the only factor affecting output, producers look at the trend in stock levels and their expectations of future consumption based on the state of the economy.
When you purchase a good, does price matter? If so, is that the only consideration? The amount that a company produces of any good is determined by many factors, price is only one of many.
Brent price
Looks like at under $50/b tight oil output declines and over $50/b it increases, roughly.
U.S. Shale Patch Sees Huge Jump In Bankruptcies
By Nick Cunningham – Jan 23, 2020, 5:00 PM CST
More than 200 oil and gas companies in North America have filed for bankruptcy since 2015, and the list of casualties could continue to climb this year.
From 2015 through November of last year, 208 companies filed for bankruptcy, according to a new report from law firm Haynes and Boone. Those filings involved a combined $121.7 billion in debt.
Since the last update from Haynes and Boone at the end of the third quarter last year, nine firms went bankrupt. In fact, in 2019, bankruptcies surged by 50 percent compared to a year earlier, and hit the highest number since 2016.
The rate of bankruptcies could accelerate this year as the price of natural gas recently tumbled below $2/MMBtu and crude oil prices have fallen back once again. “I think the trend line should be moving up in the first half of 2020,” Buddy Clark, partner at Haynes and Boone, told Reuters.
The IEA predicts that the oil market will remain in a state of surplus this year, even after taking into account the recent OPEC+ cuts. The IEA said that OPEC+ may need to cut deeper in order to avoid a chronic surplus.
The problem for the sector is the tidal wave of debt that comes due in the next few years. According to the Wall Street Journal, North American oil and gas companies have a combined $200 billion in debt that matures over the next four years, with $40 billion due this year alone.
The financial stress is causing a slowdown in the pace of drilling. Already, gas production in the all-important Marcellus shale may have come to a halt. The EIA sees gas production contracting in the Anadarko, Appalachia, Eagle Ford and Niobrara shales. As for oil, U.S. production growth is expected to rise by 22,000 bpd in February, a tepid rate compared to typical months last year and the year before. Some shale basins are facing decline, including the Anadarko, Eagle Ford and Niobrara.
But less drilling has knock-on effects, dragging down oilfield service companies which make their money on drilling activity. The same is true for pipeline companies, which make their money on oil and gas flows. Kinder Morgan just announced a $1 billion impairment charge on one of its gas pipeline assets.
Halliburton also announced a 21-percent decline in revenue in the fourth quarter in its North American division, due to weaker activity and pricing reductions. “The U.S. shale industry is facing its biggest test since the 2015 downturn,” Jeff Miller, Halliburton CEO, said on an earnings call on January 21. “As expected in the fourth quarter, customer activity declined across all basins in North America land, affecting both, our drilling and completions businesses. The rig count in U.S. land contracted 11% sequentially and completed stages had the largest drop we have seen in recent history.”
The squeeze on Halliburton and other service providers will continue. Miller said the “equipment attrition” – jargon for idling or scrapping rigs and other unneeded equipment – began to pick up last year. But, “this is just the beginning,” Miller said. “We believe a lot more equipment will exit the market as lower demand, increasing service intensity and insufficient returns take their toll.” Halliburton cut its capacity by 22 percent last year.
The oil industry already faces two headwinds viz ; low or zero profitability ( on where you are located) and climate change activists . Will radioactivity of ^ brine^ be the final nail in the coffin of LTO . See link below and comment .
https://www.rollingstone.com/politics/politics-features/oil-gas-fracking-radioactive-investigation-937389/
move along citizen nothing to see here …
There is money to be made…
A new Petroleum thread has been published along with an Open thread Non-Petroleum.
http://peakoilbarrel.com/open-thread-non-petroleum-january-24/
http://peakoilbarrel.com/non-opec-production-growth-is-struggling/