The data below was taken from the OPEC Monthly Oil Market Report. All data is through April 2019 and is in thousand barrels per day. The data is crude only, that is it does not include condensate.
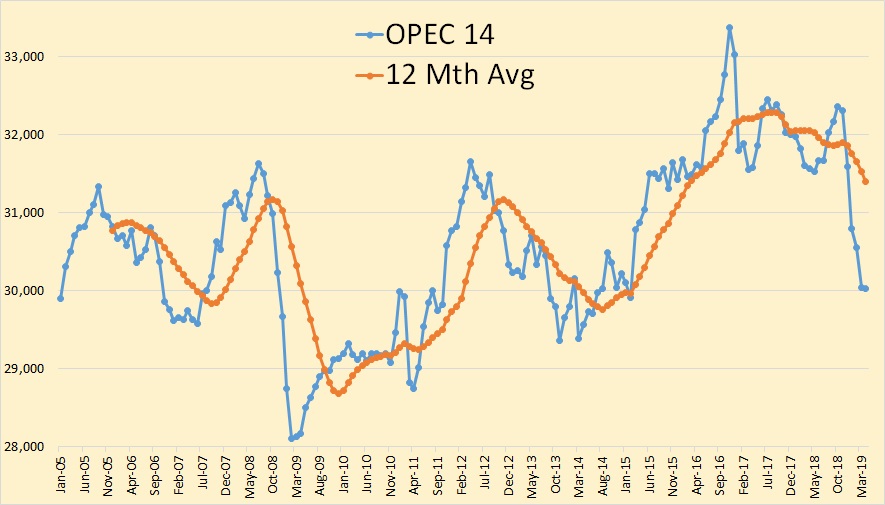
Total OPEC production hardly moved in April, down a mere 3,000 barrels per day.
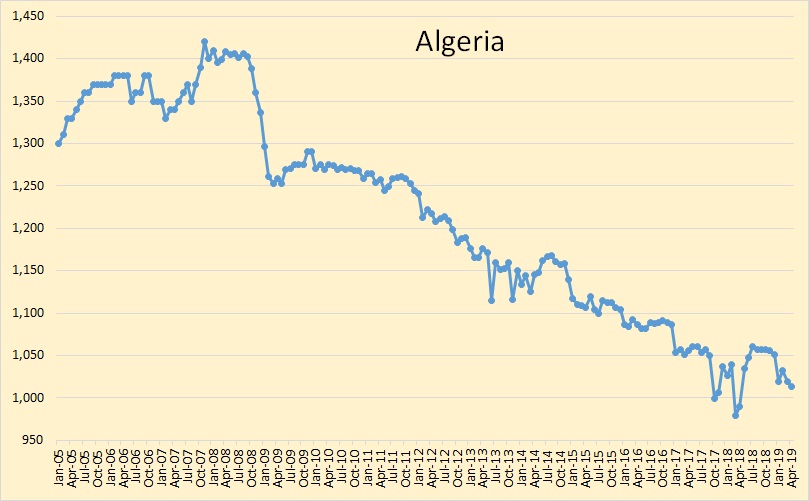
Algeria peaked in 2008 and has been in slow decline ever since.
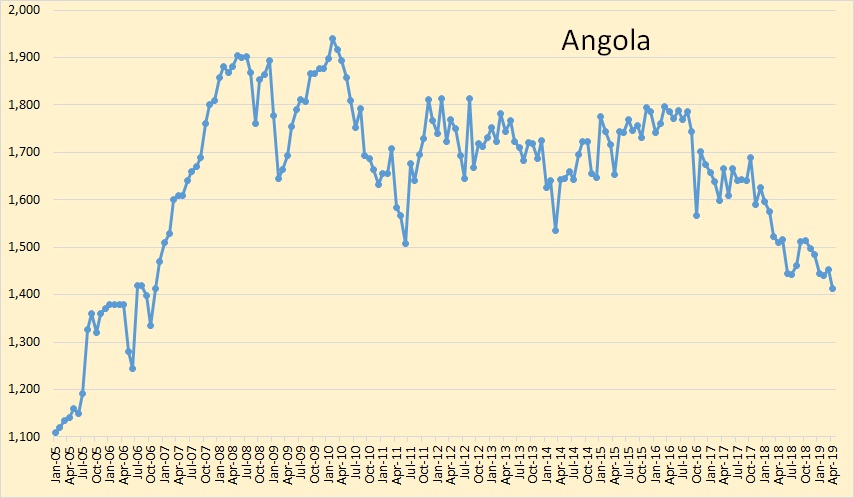
Angola is also in slow decline.
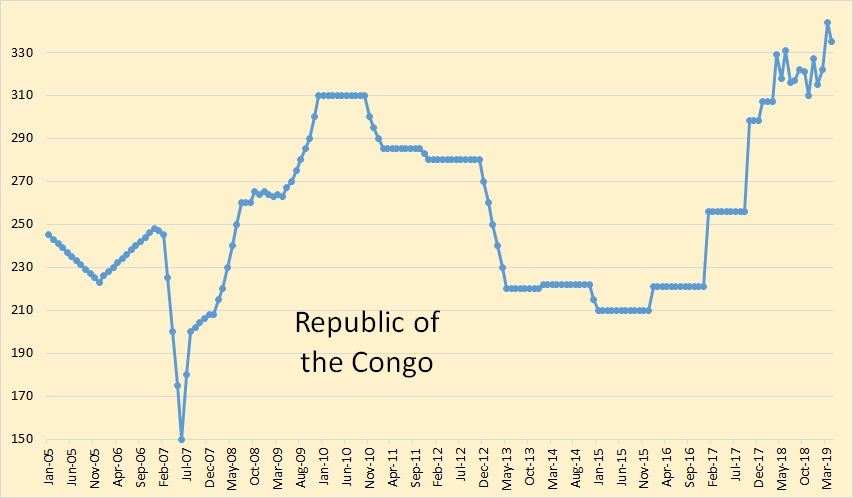
The Republic of the Congo, not the DRC, is the newest member of OPEC but they hardly produce enough to count.
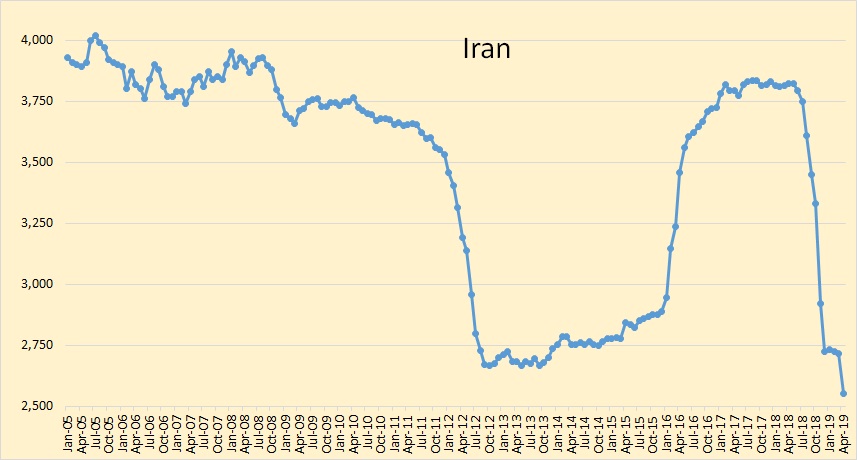
Iran took another hit in April, down 164,000 barrels per day due to Trump sanctions.
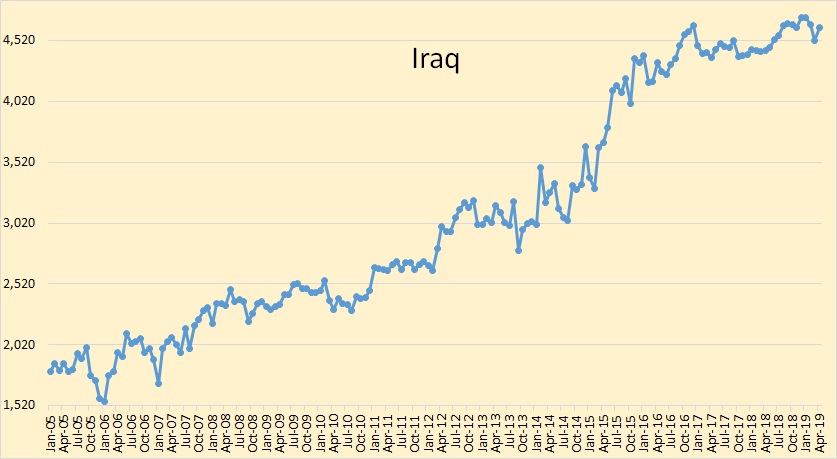
Iraq is obviously ignoring sanctions and producing every barrel they possibly can.
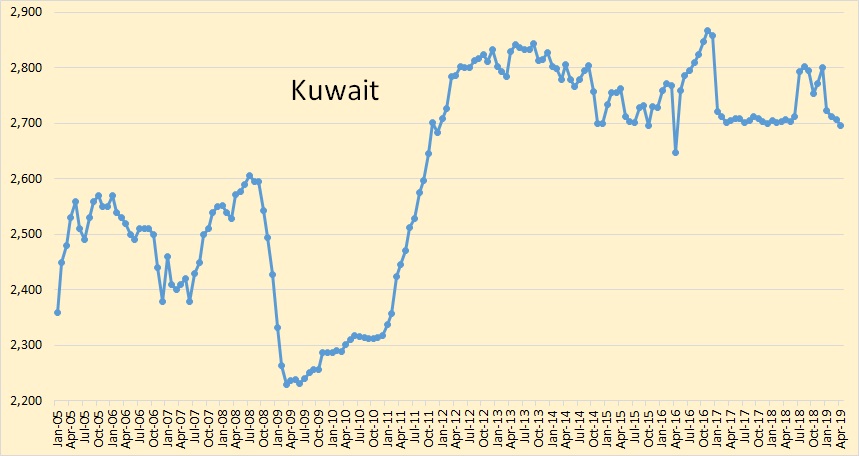
There has been little change in Kuwait’s crude production. They peaked in 2013 but have been holding steady since.
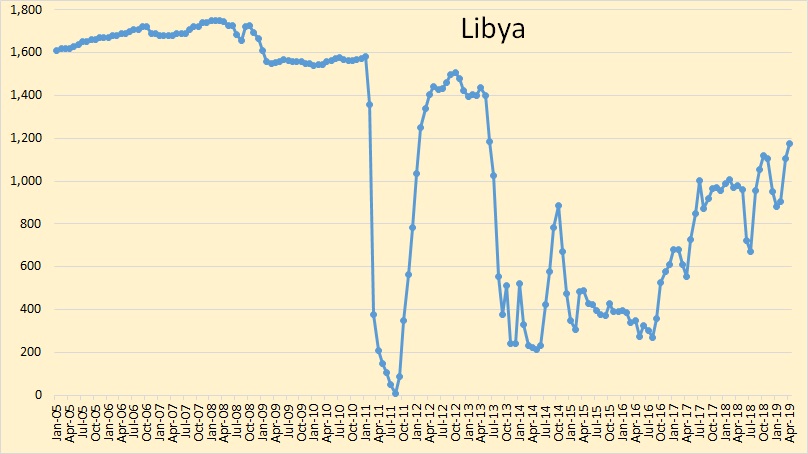
Libya seems to be making some progress against its rebel insurgents.
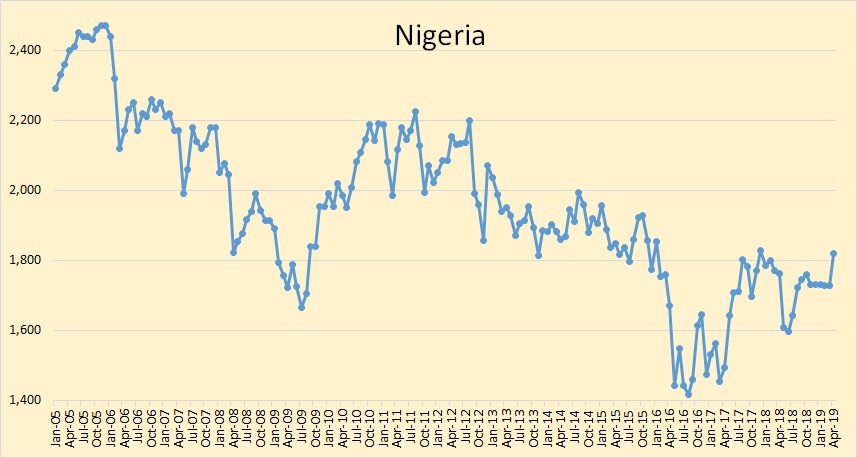
Nigeria had a nice uptick of 92,000 barrels per day in April.
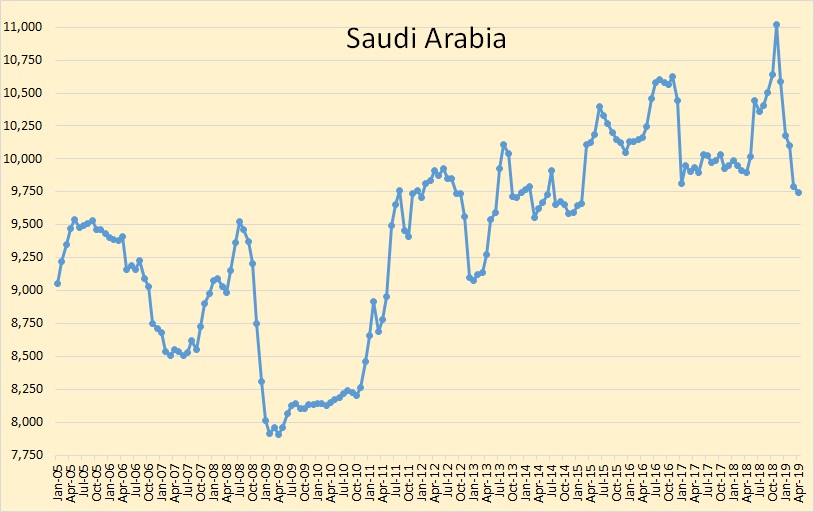
Saudi Arabia dropped another 45,000 barrels per day in April.
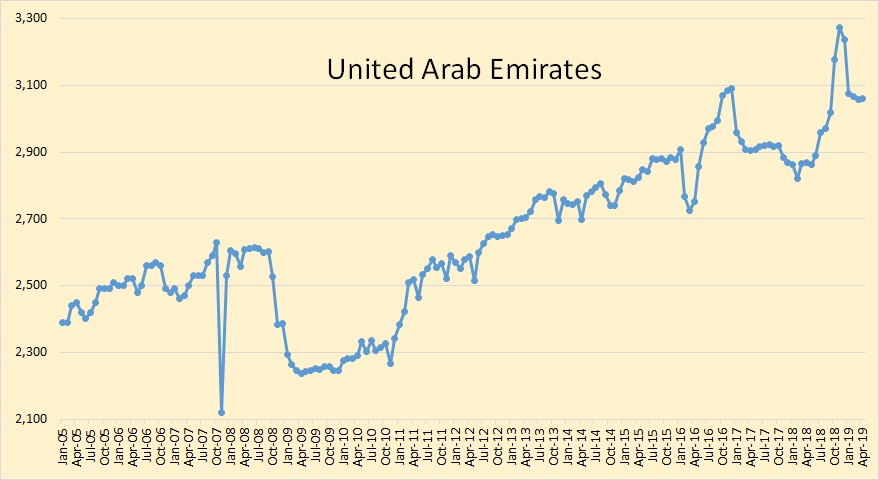
I think the UAE is at maximum production. The three-month peak in the last quarter of 2018 was extraordinary efforts just to get a high quota.
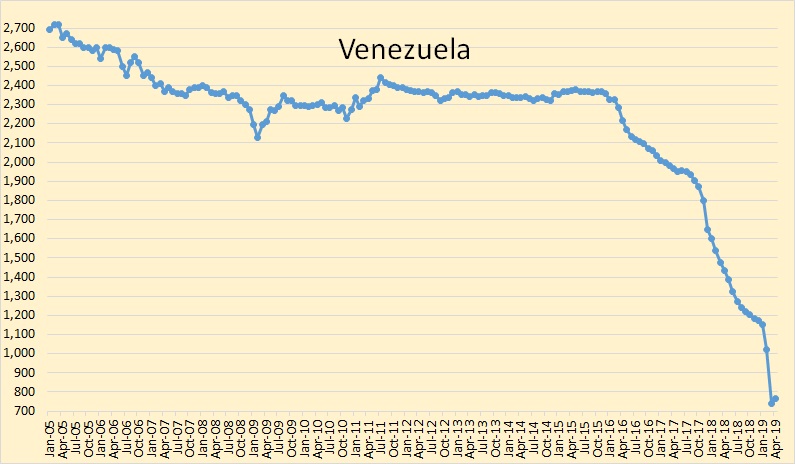
Venezuela showed a slight uptick in April.
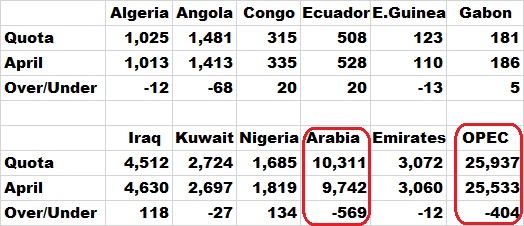
This shows which countries are sticking to quotas and who is not. Iran, Libya, and Venezuela are exempt from quotas so the total OPEC leaves them out. Saudi Arabia is producing 569,000 barrels per day below their quota. Why?
The statement that OPEC’s crude oil share in total global production is 30.4% is a bit misleading. They are comparing OPEC crude only to world total liquids. I did a calculation based on the EIA’s data and OPEC’s share of total C+C has averaged about 41.5% over the last three years though it is down to about 39% now.
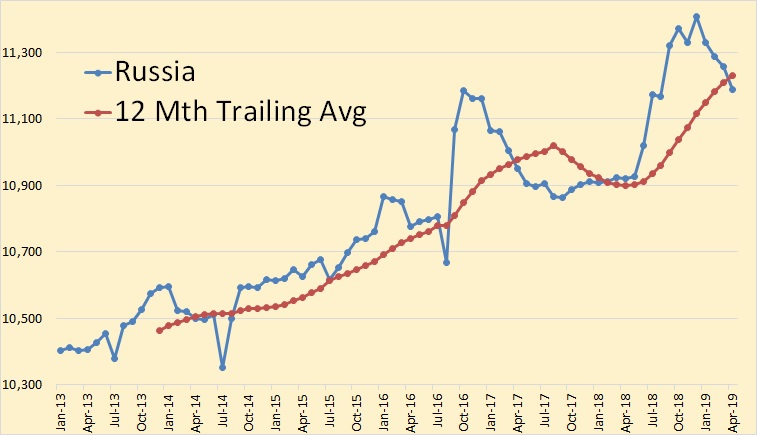
Russian April C+C production down 221,000 barrels per day from their December peak. That is according to the Russian Minister of Energy. Their data is in tons so I used 7.33 barrels per ton.
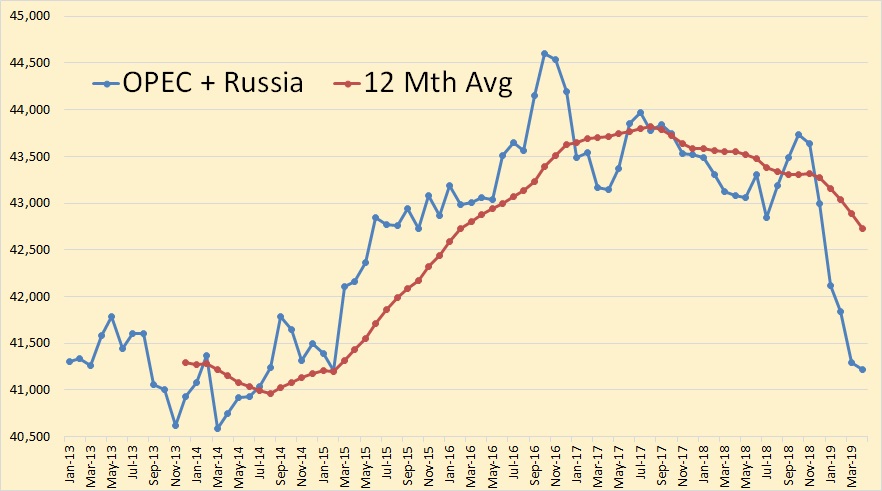
OPEC + Russia, about 52% of world oil production, down from about 55% just a few months ago. This is why 2019 world oil production will be below that of 2018. I expect OPEC + Russia to hold close to this level for the rest of the year. The rest of non-OPEC will not make up the difference.
Note: This graph adds OPEC crude only to Russian C+C.
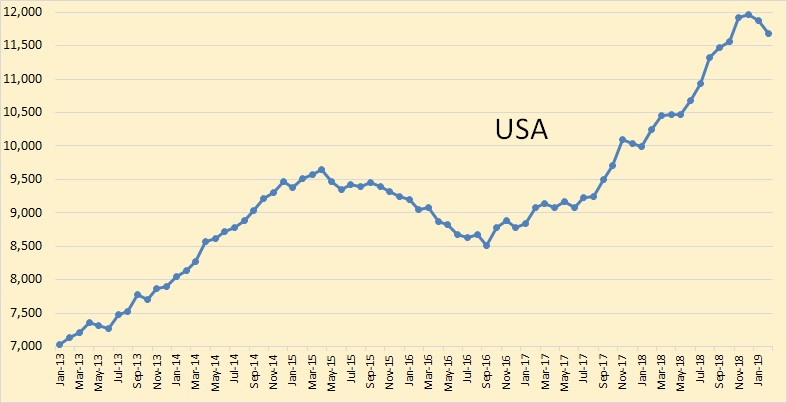
US C+C production through February 2019. The US took a hit in February primarily to a drop in the Gulf of Mexico. US production is down 280,000 barrels per day from its December high.
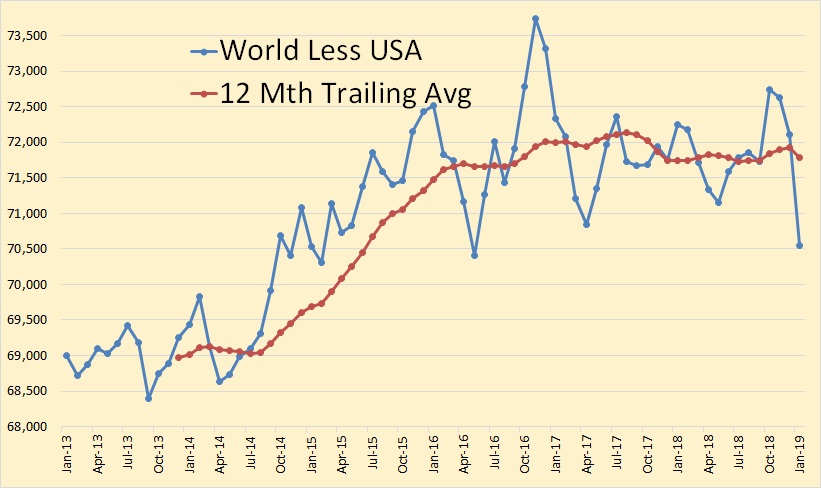
The above data is through January 2019. Only USA production is holding off world peak oil.
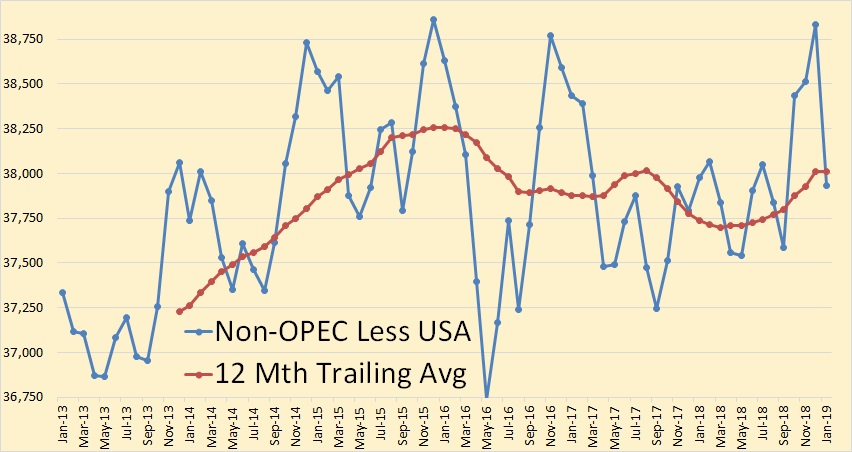
This chart is also through January 2019. Russia will not hold off peak oil, Canada will not hold off peak oil and certainly, Brazil will not hold off peak oil. OPEC peaked in 2016 so they will not hold off peak oil. It’s all up to the good old US of A. Are we up to the task?
Found this at the link below link about a Permian trucking company closing. Not sure what it means.
In the middle of the hot Permian oil and gas play, a trucking company is closing some operations
402 responses to “OPEC April Production Data”
Mexico will not hold off peak. With the new administration in charge their bonds are on the verge of junk status. Such a downgrade would be crippling.
https://www.reuters.com/article/us-mexico-pemex-insight/mexicos-rising-oil-nationalism-faces-debt-rating-crisis-idUSKCN1SK1TE
Over the next four years we will get to read comments written by the usual suspects explaining why Mexico’s Lopez Obrador is such a great political figure fighting for social justice and blah blah. My advice to Mexicans is to sell everything and get ready to flee before it heads too far down the chavista path.
A a recent resident of Mexico, I was not surprised he buried the opposition.
Love the country,
Mexico’s collapse is certainly opening up opportunities for America’s enemies.
Why is Hezbollah involved in Mexico’s Drug War?
https://medium.com/@johnruehl/why-is-hezbollah-involved-in-mexicos-drug-war-ee64e6c902b9
Venezuela too.
Hezbollah Is in Venezuela to Stay
https://foreignpolicy.com/2019/02/09/hezbollah-is-in-venezuela-to-stay/
“We are closer to you than you think” ~ Quds Force commander Gen. Soleimani rebuking Trump for threatening Iran.
Mexico is very complicated socially.
Less oil will politically benefit a large social class.
Here’s two articles that might be of interest:
LOUSY SHALE ECONOMICS: Financial Troubles Continue At ExxonMobil: https://srsroccoreport.com/lousy-shale-economics-financial-troubles-continue-at-exxonmobil/
Global Economic Growth In Serious Trouble When U.S. Shale Oil Peaks & Declines: https://srsroccoreport.com/global-economic-growth-in-serious-trouble-when-u-s-shale-oil-peaks-declines/
Steve
Steve.
I wish XOM broke out US upstream shale and non-shale.
I suspect we would then see that US shale lost money while US GOM and US conventional onshore made more than $96 million.
I suspect the GOM and onshore conventional masks how terrible shale was for XOM in Q1.
Further, comparing XOM US to CVX US shows just how important CVX’s shale mineral ownership is.
CVX might be better off just being a mineral owner and collecting royalties.
Shallow,
Agreed. I believe XOM’s large investors, at some point, are going to get the ear of the CEO & Management and tell them to GET THE F-BOMB out of Shale, just like Pioneer Investors told its CEO, which has decided to cut shale growth projections by 15-20%, to provide investors what they want:
1) More Dividends
2) Stock Buybacks
Exxon, like BHP Billiton, will likely become DISENFRANCHISED with Shale, but will probably lose $10-$20+ billion before doing so.
steve
Well they aren’t talking about getting out of shale yet.
https://www.businesswire.com/news/home/20190517005081/en/ExxonMobil-Permian-Development-Provide-64-Billion-Benefits
Shallow: CVX’s mineral/royalty position in Anadarko’s Delaware Basin block is not insignificant. Not only did it walk with $1.2bn in breakup fees (I never got a nickel whenever I went thru a breakup!)…it is now assured of Oxy having to drill the snot out that crap while they get mail box money from it. CVX can now focus on its nearly 1.6MM acres of 0.95000 NRI’s in both basins, as it sees fit, under no stress of drilling commitments or SEC 5 year PUD rules. As I have said before, the additional 20% revenue in shaley carbonate economics is enormous. It has a no flaring policy, Chevron, and if it can secure its own pipe and its own downstream use it will be the ONLY company in American history to truly kick ass in unconventional resource plays. Everybody else essentially got theirs kicked for them.
Mike,
I know it is not intended as such, but it sounds like a good stock tip.
Oxy had more than ten times the production area (it almost has the same production area as Exxon and Chevron combined) yet ranked only about 15 or 16 out of total production in Texas. Anadarko’s area production is more likely to go down than up. Especially, after laying out all this cash. I think Oxy is setting the bait for acquisition, or it is already planned down the line. JMO
Occidental CEO Hollub is completely insane for even considering the acquisition of Anadarko. Anadarko has $16 billion in debt and is paying $947 million a year, nearly $1 billion, to service its debt.
Occidental has $10.2 billion in long-term debt and pays nearly $400 million a year to service it’s debt. If these companies merge, then they will be paying something like $1.3 billion a year in interest expense… LOL.
So, knowing this, OXY is going to acquire Anadarko for $38 billion??? You got to be kidding. This sort of debt-based acquisition insanity in the pharmaceutical industry is what drove up the cost of many drugs.
I have to tell you, there isn’t much WISDOM taking place in the oil industry. However, Chevron deciding not to acquire Anadarko is the exception.
Lastly, it will be interesting to see how the energy analysts deal with the realization that there has been a great deal of fraud taking place in the U.S. Shale Industry.
If energy analysts aren’t questioning the production or financial data of many of these shale companies, then it’s going to be A LOT OF FUN when the FAN hits the SHYTE.
Steve
You have to look at the companies to garner if their really making a profit (real) or not. Regardless of the constant negative allegations, profit is there under the right circumstances, it DOES actually exist. If profit is a higher measure than growing th, it can be a reality. I reassure myself of that with simple excel sheets. Oxy is one of those exceptions Do I think Oxy is planning on ruining their current efforts by buying s company that is operating outside of its guidelines? Duh. No, methinks it is part of a larger acquisition plan, either being currently pursued, or anticipated by Oxy. Shale is NOT forever, it has a limited lifespan. Any CEO of a large independent, who is not entertaining the economics of being bought out is incredibly stupid.
The majors can handle this a lot better than the independents.
GuyM,
Except the case of Chevron which owns a lot of land in the tight oil plays and thus has lower royalty payments, for the other majors it does not really seem that there is a good reason that they would be any more profitable than a well run independent company, perhaps their bigger size might get them some discounts, but will this really be enough to make tight oil profitable? I am not so sure, they do indeed have deep pockets, but the aim is to make money, if they bleed cash they will sell out. Perhaps they’ll figure out some magic formula, but so far only higher oil prices gets it done, so maybe their plan is to slow things down and let oil prices rise to a point where the profits can roll in. They may have better discipline than some of the independents.
Yes, a more conventional business approach would make a significant difference. The independent CEOs are mainly rewarded in the past on production increases, which is hardly a MBA approach, at least within the past 50 years. The concept of profit and return on equity, including dividends, should have been part of the reward determination. But, they are paying the piper, now.
GuyM,
Got it. Essentially many of the independent oil companies are not well run, I am thinking, will XOM do a better job than EOG? I am using EOG as my gold standard and I think of them as an example of a well run large independent oil company.
Do you think the majors (except for Chevron which has a royalty advantage) will be more profitable in the tight oil space than EOG?
I am skeptical.
No, not really. But, even EOG is a good bet for a takeover. Look at their presentations. They always put, we have x amount of good locations for x years. X is never too big, so that HAS to weigh on their minds for extinction.
“Occidental CEO Hollub is completely insane for even considering the acquisition of Anadarko. Anadarko has $16 billion in debt and is paying $947 million a year, nearly $1 billion, to service its debt.”
Sounds like Hollub is man driven to make a small fortune from a very large fortune. Its the easiest way 🙂
Mike:
Can you believe someone is giving Floyd Wilson money to start another company after he got kicked out of Halcon (with a multi million dollar separation payment of course)? The same Halcon that went BK once under his leadership and is now trading at about 30 cents a share.
I wonder what Ben Hulburt is doing these days? He was CEO of Rex Energy, it went BK. He was CEO of Eclipse, it did a 1-15 reverse split, merged with another company, and he was terminated (with a multi million dollar separation agreement, of course).
Mike we are the dolts apparently? We use our own money, not OPM.
I remember coffee going on about Eclipse Resources record setting Purple Haze well, which I assume contributed to that wonderful 1-15 reverse split.
Someone someday will write a novel about all the capital burned up in smoke by shale.
Unreal.
Shallow i stated that here long ago & many times. The business model has always been a legal ponzi scheme. Perhaps you’ve see the move the “Producers”. Promise your investors the moon, while running an assured to fail business will collecting salary and bonus. When the money all gone you walk away leaving the investors holding the bag, and yet not have commited a fraud.
As far as the investors: “A fool & his money so part ways”
This suggests that at the next US/world recession, when investments stop supporting shale for a significant time, that will likely mark peak oil? Any subsequent ramp up will not be able to offset the ongoing declines elsewhere
Robert,
A recession like the Great Financial Crisis can be recovered from fairly quickly in the oil industry, if proper economic policies are followed in response to the economic crisis. So depending upon the timing a new peak might happen after the crisis. For example if GFC2 started today, output would decrease as demand fell, but a fairly rapid recovery by 2021, might lead to a new peak. If the GFC2 occurred in 2022 to 2025, then I would agree, the peak in World output would be 2021 or 2022 in that case (depending on which month in 2022 the crisis started).
Dennis,
So, you say, “that a recession like the Great Financial Crisis can be recovered fairly quickly, if ‘proper’ economic policies are followed.”
By “Proper” economic policies, are you referring to the $30 trillion of debt the Chinese Govt added since the 2007 Financial Crisis? Also, when the markets were tanking OCT-DEC 2018, one of the reasons we had a nice rally was due to the Chinese Govt pumping 4 trillion Yuan into the economy in JAN… one month.
Then we had the about face by the Federal Reserve to stop raising interest rates as well as capping the Fed’s assets sales to the $4 trillion level instead of $3.5 trillion.
So, with the Central Banks in the world going ALL IN, I gather that is what you are referring to by “Proper” economic policies.
Oh, by the way, the Japanese Govt owns 50% of the entire Japanese Bond market and 80% of all Stock ETFs.
LOL,
steve
Steve,
Generally monetary policy loses traction as real interest rates approach zero as far as being a good economic stimulus. A better approach is to use fiscal policy. A call to reduce government deficits during an economic crisis, is an example of poor economic policy.
I would agree the debt must eventually be reduced, after the economy has recovered, this is why the corporate tax giveaway was an example of bad economic policy, now would be a good time to try to balance the budget (if we had a more sane approach to trade policy in the US). With a clown in the White House one does not expect sound economic policy.
Not sure the answer to Japan’s economic problems, much of that is a demographic problem that will require innovative policy. No idea what that is however.
Mostly by “proper” economic policy, I mean using government fiscal stimulus to recover from a severe economic downturn, like FDR’s New Deal or a similar level of government spending as the military buildup for WW2 (preferably on something besides war, such as infrastructure or renewable energy).
The European response to the GFC is an example of poor economic policy, as was the Hoover administration’s response to the Great Depression.
Dennis,
Things have changed dramatically since 2008, in regards to “Govt Stimulus” to remedy economic downturns. Since 2008, the top central governments have GONE ALL IN. This is well beyond lowering interest rates or providing some liquidty.
Governments are now PRINTING MONEY and buying ASSETS. Thus, they “ARE THE MARKETS TODAY”, as I tried to provide examples in my previous comment.
Stocks Values are now 145% of U.S. GDP. When stocks were 60% of U.S. GDP, 1960-1990’s, then we could have bear markets and recessions. NO LONGER.
Why? Because STOCKS are now the economy. Which is precisely why Govt’s are now ALL IN THE MARKETS.
steve
That’s why I think many voters/citizens are politically and economically screwed. They no longer have much leverage. Whether they work or not and whether they buy or not is increasingly irrelevant to the wealthy. It’s about paper value.
Boomer II,
Paper value will go down in an economic crisis and people do get to vote, maybe they will vote for people that will represent their interests.
They’re irrelevant until things start getting violent. I remember how the late 60s made the status quo sit up and react, and that was just over one little SE Asian war. Today, we’re sitting on a virtual powder keg. Just like the Chinese walking away from Trade talks, there are always consequences, some more serious than others, and most unintended. Today, China called it a Peoples War and urged citizens to stop buying anything US made. We’ve been doing that in Canada ever since the steel and aluminum tariffs. I would suspect most of the World is now rooting against the US until this period of division and bluster fades into a distant memory.
We’ll see what happens around Hormuz, I guess. That would make everything else, irrelevant.
The Fed is in the bond market, both Treasuries and Mortgage backed securities, they were gradually reducing the assets held by paying off the securities as they mature a process called unwinding the balance sheet. Perhaps other central banks are involved in the stock market, in the US it is bond markets only.
Currently the Fed balance sheet is at 3.892 T$ from a high of around 4.5 T$. Before the crisis it was about 900 B $. So just 3 T to go. 🙂
“I would agree the debt must eventually be reduced, after the economy has recovered” ….and how pray tell does the economy do that, as all the cheap conventional oil peaked in November 2005?
When has debt ever been reduced, even in a good economy? NEVER EVER
“We must pay back our debt when the economy recovers….” SAID NO GOVERNMENT EVER
“clown in the Whitehouse”…well, what would you know of it? The alternative at the time was far worse.
BTW Dennis, those charts that Ron posted are clearly indicative of PEAK OIL, which is happening NOW and not 2022-2026.
“clown in the Whitehouse”…well, what would you know of it? The alternative at the time was far worse.
Mike, I agree with you on almost everything. But not in this case. Nothing, absolutely nothing, could possibly be worse than Trump. A lot of people had an intense dislike for Hillary, but she would have made a far, far, better president than that idiot, narcissist, nut job we have in there now.
Otherwise, thanks for the vote of confidence on my charts.
Nothing, absolutely nothing, could possibly be worse than Trump
Oh, I dunno, how bout Trump Clown and Circus version 2.0 in 2020…
.
Hillary, or as she was named, Killary Clinton.
Perhaps for the USA she would have been better, but for the rest of the world?
She would have started already 1 or 2 new proxy wars. Trump has done many dump things and is an idiot – but not started a new war. And he is not very eager to intensify current running wars.
So far – that can change any minute. It is settled at the end.
“Trump has done many dump things and is an idiot – but not started a new war. And he is not very eager to intensify current running wars.”
Sorry you must be living under a rock. Shortly after he took over office, He taunted NK to start a nuclear war. Including B-52 over flights of the Korean DMZ.
Then there is Syria, launching Cruise missiles in retaliation for fake Chemical Weapons attack staged by the Rebels, White hats. US still has forces in Syria that has been bombing Syrian army forces that were trying to take control back of its southern territory where the US & Israel are planning to build a pipleline.
Now there is Iran. Hes order the US Navy to mobilize for a conflict with Iran, and working on moving more than 120K US troops to Iranian borders.
No action against KSA secret war in Yemen, that has killed at least 100K and another 5M to 10M Yemen are facing a long duration Famine.
Then there was MBS caught red handed ordering the murder of a KSA dissident.
That said Clinton would have been just as bad or worse. Only a Psychopath would go on TV and joke about the brutal murder, as well ask joke about the millions who died or became refugees in the Syrian Proxy war she started while at the US state Dept.
Bottom line, Gov’t power always attracts the worse that humanity has to offer.
And her statement: We came, we saw, he died.
Hillary. What a lovely lady.
Are not Americans getting seriously fed up of the all the f… wars and all the killing of civilians? I think most other nationalities are . The wars are camouflaged as we are the great Saints rescuing the world. Are Americans not able to see through their government’s propaganda?
Become a democracy or we will bomb you back to the stone age! Your choice. Good luck.
American global politics. So sincere.
https://peakoil.com/publicpolicy/that-time-john-bolton-said-its-good-to-lie-about-war
Check out what Patrick Clawson is saying.
Who be behind the Curtain? https://www.transcend.org/tms/wp-content/uploads/2018/02/wikileaks-media-council-foreign-relations-usa3.png
Hi Mike,
The highest trailing 12 month output for World C+C was Jan 2019 (the last data point available from the EIA.) I judge peak by the 12 month averages not based on a single month. So until I see a 12 month output that is lower than the previous month, I won’t call a peak. Typically Ron calls this in a similar way, so it seems his 2018 peak has moved to 2019. Also note that my “low scenario”, consistent with Mr. Laherrere’s World URR estimate (2800 Gb) suggests a 2020-2024 peak, with a best guess of 2022 and maybe a 60% probability it will fall in that 5 year interval, if the low URR estimate is correct. I believe my medium scenario with a URR of 3100 Gb is more likely, that peak will be between 2022 and 2025 with a best guess of 2023 or 2024, perhaps a 55% probability the peak falls within these 4 years and a 20% probability it falls before this period and a 25% probability it occurs later than 2025.
And as always I could be wrong for either of these cases and in fact I have a high case with URR of 3400 Gb where peak would be later in 2025 or 2026 and a range of 2023 to 2028 for the likely peak, perhaps a 65% chance it would occur in this interval, with perhaps a 15% chance the peak occurs before 2023 and a 20% chance it occurs after 2028. Low, medium and high scenarios compared in following chart, extraction rate held constant at 2019 level from 2019 to 2050.
>“We must pay back our debt when the economy recovers….” SAID NO GOVERNMENT EVER
That’s complete bullshit. For example the German government has been paying off debt for years.
You’re so blinded by Republican propaganda that you don’t even bother to do a basic check of the lies you spread for them.
“A call to reduce government deficits during an economic crisis, is an example of poor economic policy.”
Except deficits continue to grow even during the boom times. Current and growing debt levels are assured mutual destruction. No way the world it get out of this with the worse crisis since the collapse of the Western Roman empire.
Techguy,
Yes currently we have poor economic policy where we are decreasing taxes and increasing deficits (in the US) when we should be doing the reverse. During Clinton’s presidency we got pretty close to a balanced budget after the increasing deficits seen during the Reagan era. A balanced budget may be enough because inflation tends to reduce debt to GDP under those circumstances. Most politicians are not comfortable using a budget surplus to pay down the national debt, but in a high employment situation that would be fine with me.
Agree this is not very likely, best we can do is to raise taxes and cut spending to approach a balanced budget, and even that is highly unlikely with the lack of many moderates in either political party in the US.
Debt based monetary system either expands or contracts.
Paying down debt in debt based monetary system is never going to happen Dennis.
Money disappears when debt is paid down. Which means there would be less money in the system to service debts.
Debt has to expand in a debt based monetary system. Or system will collapse. People just don’t seem to understand that fact.
10-15 years from now US government debt will be $35-40 trillion. It has to be. Otherwise we’ve had a debt crisis and instead of inflation we got debt deflation beyond anything that anybody can really comprehend.
It has been said that when the system contracts “money. goes to money heaven”.
HHH,
There can be more private debt and less public debt.
I am not suggesting pay off all debt, just reducing Government debt to GDP ratio during times of low unemployment. This is macroeconomics 101.
Where do bubbles factor into this? You seem to be suggesting that our system has to keep growing or terrible things happen.
But don’t we always reach a point where people realize they won’t get their money back and it is a race to be the first to get it out before it isn’t there anymore?
Garrett Hardin on growth, interest, and debt. https://www.garretthardinsociety.org/docs/hardin_living_within_limits_ch_8.pdf
The picture at the bottom is of Garrett Hardin with L F Buz Ivanhoe and Walter Youngquist (author of GeoDestinies). https://www.garretthardinsociety.org/gh/gh_pictures2.html
Boomer II,
Sometimes debts are defaulted on, a physical asset such as a house is difficult to unload, or a factory, or an oil well, any physical capital will be difficult to sell in a severely down market and usually people just hold the asset.
For financial assets bought at the top of the bubble, people can try to sell on the way down, but at some point it makes more sense to hold the asset as it becomes undervalued, it is pretty difficult to call tops and bottoms effectively, this is only known looking backwards.
Generally macroeconomics ignores these bubbles except in considering utilization rates of available labor and physical capital. In a crisis these rates will be low and government spending can help to boost employment and capital spending.
Also the demographic transition will lead to lower labor availability and economic growth may slow as population peaks and falls, real GDP per capita may continue to grow at 1970-2017 average rates (about 1.5% per year) or they may slow down as the World becomes more developed, difficult to say, but as we try to move to a more sustainable World, lower growth rates would be preferred. Though human impact can be reduced by more recycling, cradle to grave manufacturing, building more durable and repairable products, and just consuming less throw away products.
These kinds of changes can be accomplished, but the biggest factor will be people choosing 1 child families so that World population can fall precipitously.
People will have to save more as social insurance is not likely to be adequate as population declines. In any case education is the key to smaller family size, it should be a focus especially for girls.
Hi Ron,
If your assumptions are correct, (no change in OPEC+ Russian output levels from April 2019 to Dec 2019), then C+C output will be lower in 2019 than in 2018. My guess is that the oil market will be short and oil prices will go up. OPEC members will either increase the quotas in June or they will cheat on their quotas, Russia may leave the deal in June unless quotas go up. I think it likely we will see a moderate increase in OPEC plus Russian output, enough to make World C+C output for the 12 months ending in 2019 somewhat higher than 2018. Even if my guess proves incorrect for 2019, I expect higher oil prices will result in year end 2020 average output being higher than 2018, with a likely peak between 2022 and 2026.
I think those are pretty good guesses if all remains as it is. It depends on how much Exxon, Chevron, and maybe Shell? will gobble up. They are interested in how much they can get out of it to be refined, not for how much they can export. That leaves the estimate any where close to your prediction to, well…flat.
Dennis, it’s just my estimate, nothing more. However it is based on the output of every nation in the last five years, what they have produced and what I think they can produce. Yes, the price will affect production, but only as much as it can affect production. I don’t think OPEC can produce much more than it is producing today. And non-OPEC, less USA peaked three years ago. And even the EIA has Russian production at a near standstill for the next two years.
Yes, yes, there will still be some nations with a slight increase in production. But the declining nations decline more than the others increase.
As I said, it’s all up to the USA. Hey, just look at the charts. It has been all up to the USA for the last few years. And now it is even more so. More so right when shale oil production is looking iffy.
The main place where we disagree is OPEC, I think they can produce another 500 to 750 kb/d, that will offset Iranian reductions and the US will increase a little, maybe 500 kb/d for the year, and that might be enough to result in an increase.
Hey I may be wrong, just a difference in what we see for future output from OPEC, with the exception of Saudi Arabia, and Iran OPEC is probably at close to maximum output, but I think Saudi Arabia will be able to get back to 10.4 Mb/d if needed, US output may get to 12.5 Mb/d by the end of the year, we just don’t know.
The main place where we disagree is OPEC, I think they can produce another 500 to 750 kb/d, that will offset Iranian reductions…
Goodness, I hope they can. OPEC April production is down 2,327,000 barrels per day below their October 2018 level. That was when everyone was straining to produce every possible barrel they could in order to get a good quota number. So I am sure they could very easily increase production by 750 kb/d from April production.
Their strained October 2018 peak was still over one million barrels per day below their peak of November 2016.
No, OPEC is close to maximum output except for Iran and Venezuela. Iran could possibly ramp up in a couple of months if sanctions were lifted but it would take Venezuela a decade to get back to pre-collapse levels.
Yes, Saudi may get back to 10.4 million barrels, but even so, that would still be well below their previous peak. Hell, their quota is 10,311,000 bpd.
Why do you think they are producing 569,000 barrels per day below their quota? I think it is quite possible that Saudi has peaked and is now in deep trouble.
As far as the US getting to 12.5 million bp/d by the end of the year… I seriously doubt it. It could happen but it would shock me if it did.
Ron,
Much will depend on oil prices and pipeline construction in Permian basin. GOM output might rebound (after drops early in the year) and tight oil may go up by 750 kb/d, if the Dec to March rate of increase continues for the rest of the year. This id much less than OPEC forecasts for US output where crude is expected to increase by about 1.5 Mb/d in 2019, my scenario has a YOY (2018 avg to 2019 avg) increase of 1.13 Mb/d and average output for 2019 at 12.1 Mb/d and about 12.4 Mb/d for Dec 2019.
So yes Probably not 12.5 Mb/d at the end of 2019 and much less for the 12 month average (12.1 Mb/d). Guesses as always (the OPEC guess is close to 12.5 Mb/d for the 2019 average output, I agree that is too optimistic).
Lots of possible reasons for Saudi to produce below quota, so they can raise prices, so they can fill the gap when the sanction waivers are removed. Note that I ignore monthly peaks and only pay attention to sustainable capacity which I define as lasting for 12 months, so I look at recent 12 month peaks instead of monthly peaks. The extra Saudi output can fill the gap left by Iranian drops in output and other OPEC producers might be able to produce a few hundred kb/d more (combination of other OPEC producers).
This leaves the World’s spare capacity critically low so I expect this will push oil prices higher as it becomes evident how low OPEC spare capacity is, the sustainable capacity may be close to zero if Iranian exports fall by 750 kb/d, but expectation is for 500 kb/d or less.
I now follow your argument for “producing all they can”, at the recent monthly peak, that is probably correct, it is doubtful that OPEC minus Venezuela and Iran could sustain production at the Nov 2018 rate of 28,219 kb/d for longer than 2 or 3 months. That would be an increase of 1510 kb/d from the April 2019 level, but as I suggested only half that level (750 kb/d) is sustainable in my view.
Ron,
Looking more closely at my medium tight oil scenario, I would expect average 2019 output to be about 12 Mb/d for the US (trailing 12 month output in Dec 2019) vs 11 Mb/d for the 2018 TTM avg. I expect the December 2019 monthly output to be roughly 12.5 Mb/d, about 820 kb/d higher than Feb 2019 output and 537 kb/d higher than Dec 2018 output.
“So I am sure they could very easily increase production by 750 kb/d from April production.”
Just water it down with some condensate. Shh. I won’t tell if you don’t /sarc
Tech guy,
Condensate has been included in EIA estimates since at least 2005 (around the time I started following this closely), some of this condensate increases propane supplies which is very useful in rural areas with limited access to natural gas infrastructure (tends to be no local distribution system.)
The percentage of US output from 2015 to 2019 (where EIA data is available) with API gravity of 45.0 or lower has been pretty steady at 77 to 80% (for 12 month running averages). So the high condensate claims are not really a significant issue. We simply export the higher API liquids that refineries cannot utilize in the US, most of the US refinery capacity is designed for heavier blends of crude.
Hi Dennis,
It was a Joke. I did include the “/sarc” tag.
Look Dennis, Russia has peaked and Russia’s only chance to hide it is to hang together with OPEC, so Russia has ‘quota’ to follow.
Russia said that her oil ouptut will start to go down after 2022, and expects to produce only 5mbd in 2030. That, however, means only 1,5 mbd for export then (if at all).
Perhaps Russia has peaked, we will know more when OPEC quotas are lifted.
Data from Russian Oil Ministry was used to produce the chart below, I used 7.3 barrels per tonne and the chart has the trailing 12 month (TTM) average C+C output in kb/d.
The peak is not apparent from this chart, my guess is that they will maintain a plateau for some time after reaching peak output, perhaps it is 10.4 Mb/d (the most recent trailing 12 month average). We will know more in the future.
Also see (from July 25, 2018)
https://www.reuters.com/article/us-oil-opec-russia-idUSKBN1KF20Y
MOSCOW (Reuters) – Russia’s oil production this year will increase to 551 million tonnes (11.02 million barrels per day), a new 30-year high and up by around 3.5 million tonnes from previous expectations, Energy Minister Alexander Novak said on Wednesday.
He said Russia would further raise production to 555 million tonnes in 2019 after the Organization of the Petroleum Exporting Countries and other oil producers led by Russia agreed last month to ease production curbs.
On a monthly basis you are correct, Russia peaked in Dec 2018, but I focus on 12 month average output. Also I noticed that the 7.3 barrel per tonne estimate gives very different results from EIA data, using a conversion factor of 7.0365 b/tonne gives a result consistent with the EIA estimate for Russian C+C from Jan 2013 to Jan 2019. Chart below uses 7.3 b/tonne.
This chart uses the 7.0365 b/tonne conversion.
In a perfect world, Denni’s prediction might be the most accurate. The question is: How perfect is this world?
Westexasfanclup,
Not perfect at all. The scenario is just a guess assuming things roll along as they have. Unfortunately I cannot predict future shocks. Possibly the world will adapt to higher oil prices and transition to alternatives, won’t be easy, but probably won’t require a perfect World, just one that does not fall apart completely. It will be interesting.
Dennis,
“It will be interesting”. Definitely. My guess, as we are approaching higher probabilities of war and economic downturn, is, that the peak of the idealized curbs of your graphs could well be hidden in the ups and downs we might be facing. So 2018 could indeed be the all-time high if recovery doesn’t set in as fast as you are guessing (well, this is, in fact, a guess IN a guess, so not really worth to discuss that point, I just wanted to hint toward that possibility just as Robert did).
Westexasfanclup,
War in the Persian Gulf would be a huge shock, look at 1979-1985 for an idea of what that looks like, recessions are minor bumps, even GFC is a small bump.
Of course the real world output will not be perfectly smooth like my models, where I often hold extraction rate fixed after 2018. This is just a simplification, it will no doubt fluctuate randomly, superimposed with political and economic shocks to the system which cannot be predicted.
In any case peak might be 2018, it might be 2025 and if your point is that the natural ups and downs of any plateau will make the peak difficult to pick. I agree, we won’t know until 5 to 10 years after it has occurred that we are past the peak (or peak plateau).
Totally agree, but I dare to claim the – once again very bumpy – plateau is reached.
Hickory has also pointed this out, perhaps based on your hints.
It may be the case that a bumpy plateau started in 2015 that wont end until 2035, it is just a matter of how wide one makes the band around the plateau, is it +/-5%, of so for 83 Mb/d of C+C output we would have 79 to 87 Mb/d for the range of the plateau, and for my 3100 Gb URR guess the model output fits nicely in that range from 2015 to 2034, a more conservative model (2800 Gb) would have a shorter plateau from 2015 to 2028 and would be likely to peak in the 2020 to 2023 time frame at about 84 Mb/d. The higher URR model peaks in the 2022 to 2025 time frame at about 86 Mb/d. The bumps and randomness of a real world output curve would mean these estimate may be off by a few years and 1 Mb/d higher or lower, the URR guesses are also problematic and could be off by +/-100 Gb or more.
War in the Persian Gulf would be a huge shock, look at 1979-1985 for an idea of what that looks like
Hmm…not so much. 1979 was indeed an oil shock, but it was also the beginning of the Paul Volcker era at the Federal Reserve. He reversed the easy money and low interest rates of the previous 10-15 years or so in order to eliminate high inflation expectations.
So…the 1979-1985 era was less an oil shock and more a high interest rate and low inflation rate policy shock.
And even so, GDP rose over the 1979-1985 period. It even rose over the 1979-1982 period, where oil consumption fell by 18%!
Now is very different: the Fed explicitly excludes the impact of oil price increases from their considerations for rate policy, and we’re already in an era of low inflation. So, that’s a shock that’s very unlikely to be repeated.
Nick,
Growth was not very good from 1980 to 1982 using IMF data for World real GDP growth rates at market exchange rates
https://www.imf.org/external/pubs/ft/weo/2019/01/weodata/weorept.aspx?sy=1980&ey=2000&scsm=1&ssd=1&sort=country&ds=.&br=1&c=001&s=NGDP_RPCHMK%2CNGDPD&grp=1&a=1&pr.x=58&pr.y=7
The chart is incorrect for the years used for the average it was 1985 to 2000. If I had used 1983 to 2000 the average growth rate would be slightly higher (3.26% vs 3.19%).
Ref Venezuela production, the report is off by about 70 kbopd. The corrected numbers should have march higher by 70, April lower by 70. Dennis, if you send me the link to the venezuelan oil data you use in that excel file, i can give you an annotated version with political events posted since say 2012, the year Chavez got cancer and Maduro got control.
Fernando,
Ron has the data through April, I use the EIA data, I think Ron has a spreadsheet with OPEC data going back many years.
It would be also interesting to separate Venezuelan oil production in conventional and bitumen and then relate both to the oil price.
I don’t have great information on the split between extra heavy oil from Orinoco and conventional crude, though we could take the OPEC figures and subtract from the EIA figures, we would only get about 100 kb/d of extra heavy oil for Jan 2019, that seems too low. Elsewhere I have read that half of Venezuela’s output is from Orinoco.
Fernando probably knows.
I guess that Venezuela’s crude oil exports must be low at the moment but I’ve not seen any recent numbers…
2019-05-14 (Argus) Venezuela’s crude production has dropped to around 500,000 b/d as sluggish export loadings and replete storage force state-owned PdV to shut in wells, four company officials tell Argus.
The decline is most pronounced in the Orinoco heavy oil belt, where production has dwindled to less than 200,000 b/d in recent days, compared with more than 700,000 b/d in early May.
“All production that is transported as DCO is shut in,” a senior PdV official said, referring to the Orinoco crude that is diluted with naphtha for pipeline transport to the Jose upgraders and blending facility.
PdV has been forced to store more of its crude because exports are not keeping pace with production, even at the reduced level.
https://www2.argusmedia.com/en/news/1902787-venezuelan-crude-production-sinks-to-500000-bd
Platts version https://www.spglobal.com/platts/en/market-insights/latest-news/oil/051419-venezuelas-orinoco-belt-crude-production-falls-to-169800-b-d
Venezuela major basins https://pbs.twimg.com/media/D2xSEWBWsAAhoOG.jpg
Hello Energy News
Interesting, that – referring to your sources of information – export is Venezuela’s bottleneck. That’s quite contrary to the common narrative that sluggish socialism is to be blamed for it.
Not really. A longtime admirer of EN. He only reports facts, and they are damned inclusive. Rarely, have I seen him naming causes, like I am prone to imagine what they are. Hence, he can never be “incorrect”. He can always be regarded as the provider of the latest information, not putting forth anything that is questionable as to any one belief. A true champion of journalism.
I thought the marxists who back the Cubazuelan regime narrative and continue to defend socialism were giving up writing in defense of the regime.
Production is down for several reasons.
1. The well and reservoir decline
2. the lack of maintenance and investment,
3. really bad investment decisions by a PDVSA management and staff gutted since the regime named General Quevedo as President of PDVSA in the second semester of 2017
4. the impact on wells and facilities of the large blackouts experienced after two of the Guri generators were damaged
5. Brain drain as qualified Venezuelans flee.
6. Work slowdowns taking place in recent weeks after oil union workers met President Guaidó, and he assured them his policy would allow those who are employed now to remain.
7. US sanctions are having a minor impact, but they arent really that effective. For example, Maduro is still giving away oil to the Castro dictatorship, the Russians help handle oil payments, and oil is still moving to China, and India. And because production is so low, there’s very little to export anyway.
I would also add that Faja production has a much higher water cut, because PDVSA didn’t know how to drill and complete wells to avoid water, and breached shale barriers which served as containment layers to avoid getting water to the wells. The higher water content can’t be handled properly by surface equipment because water requires more heat to raise temperature, and this in turn is used to break up emulsions and separate crude from water. The net effect is that crude has out of spec water, excessive salt, and they have no option but to cut fluid rates.
Thanks Fernando,
Do you have a rough estimate of Faja output say in March 2018 and March 2019 (or any two months from 2018 and 2019 that are 12 months apart)? The comment by Energy News suggests 200 kb/d in the past week vs 700 kb/d early in May. In other places I have read about half of Venezuelan output from Faja (maybe 1000 to 1200 kb/d). My guess is you know where to find the data.
Fernando,
Another quick question, with someone running the show for Venezuelan Oil industry with your expertise and the ability to call the shots (say the head of a National Oil Company) and willing investors (say a new stable government was in place that was not socialist) would it take maybe 10 years to get Venezuelan output back to 2.5 Mb/d, or is that too optimistic? This is 10 years after the stable government is established (probably a 5 year process at best).
Dennis, it depends on what happens after the Maduro regime falls. Venezuela has a missing generation running government and companies properly, and I’m not impressed by the quality of the people around Guaidó, who lack experience and have never been tested in a real tough situation like this. Based on what I’m seeing it’s going to be touch and go, but it’s possible to take it back to 2.5 in 10 years, if they get their act together.
Production seems to be holding up better in Maracaibo than the Faja and Furrial. I too heard the 500 KBOPD, so my guess is the Faja is down to say 150. The question is whether they can restart de upgraders, and handle the labor problems. Maduro, I hear, has very little support inside PDVSA, and I suspect they are simply letting things fall apart to drive him out.
Thanks Fernando.
Always interesting to get your perspective.
If they can refine it they can burn it.
From Platts piece:
The Orinoco production decline, if extended, will pull Venezuelan output lower. One field operator said an “optimistic scenario” would put Venezuelan output at 400,000 b/d to 500,000 b/d.
Also this chart from the Platts piece, which forecasts 600-700 kb/d (reading off chart).
The EU-15 inventory numbers from the OPEC MOMR to March. With the April number from Euroilstock. And the US monthly inventories to February with lastest weekly number from the EIA.
My latest graph on crude and condensate (EIA data up to December 2018) showing that production excluding US and Iraq is flat since 2005:
http://crudeoilpeak.info/latest-graphs
The Australian government continues to be complacent. Its recent liquid fuels security review claims that oil supply disruptions are unlikely. I have done the following analysis. China peak oil in 2015 and rising oil imports constitute a pre-existing condition which will exacerbate any oil supply issues.
2/5/2019
Australian fuel security review ignores peak oil in China 2015 (part3)
http://crudeoilpeak.info/australian-fuel-security-review-ignores-peak-oil-in-china-2015-part-3
30/4/2019
Australian fuel security review ignores peak oil in China 2015 (part2)
http://crudeoilpeak.info/australian-fuel-security-review-ignores-peak-oil-in-china-2015-part-2
29/4/2019
Australian fuel security review ignores peak oil in China 2015 (part1)
http://crudeoilpeak.info/australian-fuel-security-review-ignores-peak-oil-in-china-2015-part-1
Thanks, Matt, I just can’t stop looking at your graph. Peak oil really happened in 2005 were it not for the USA and Iraq. And notice that the price of oil did not really affect production. The rest of the world started to decline after 2005 in spite of spikes in oil prices. High oil prices did not really increase production.
Matt, your chart is priceless. Thanks.
Hi Ron,
Supply is limited by demand, so the impression that Iraq and US were what caused supply to increase is just a matter of how the chart was stacked. In a nation that has peaked, high oil prices don’t cause production to increase, but it likely slows the rate of decline vs a scenario with lower oil prices. This fact is easily seen by looking at US tight oil output and the effect of the crash in oil prices. Also the fact that oil prices were so high from 2011 to 2014 is the reason that US tight oil output increased by 3.88 Mb/d from 1 Mb/d to 4.89 Mb/d over the Jan 2011 to March 2015 period, a 389% increase in output.
If we consider World C+C less US tight oil less Canadian oil sands we get the chart below.
Yes, there are many ways to stack graphs. From bottom to top I usually start with countries having flat production (if any). Then the declining group with a peak. Then a growing group offsetting that decline in the order of growth rates. That’s why the US is on top – the big mover. Iraq is there because of it’s special role. Bush and Cheney – who knew about the approaching peak – invaded Iraq to shift the predicted peak a couple of years into the future (which took longer than anticipated)
I wrote this post:
16/3/2013
Iraq war and its aftermath failed to stop the beginning of peak oil in 2005
http://crudeoilpeak.info/iraq-war-and-its-aftermath-failed-to-stop-the-beginning-of-peak-oil-in-2005
That’s why I call the Iraq war the first peak oil war.
We may also remember that the Iran oil expert Dr. Ali Samsam Bakhtiari (who did a presentation to the Australian Senate in 2006 – which I attended) always spoke of geo-political feed back loops when oil gets scarce.
Matt,
Your analysis and chart are excellent, just another take on how one might divide things up.
In this case we compare non-continuous (aka conventional oil) with continuous oil (aka unconventional). I leave out Orinoco because I do not have a good data set on Orinoco output.
Very interesting chart. See the effects of Libya in 2011. One country can move the whole thing. Some countries lose production, like Libya in 2011, and US is flat??? If it increases (US) after 2019 as Dennis predicts, the it is up to flat. But, if the US remains flat, or not much increase, it’s all down.
GuyM,
Output is either above or below my predictions 100% of the time, its roughly a coin flip. 🙂
Well, I’d say that places you squarely within the human range? Drifting around with the rest of us wanna be Vulcans.
Iraq was a political outage, coming back online.
Today we have political outages, too:
– Canada with green movements refusing to build more pipelines – 1- 2 mb/day more possible
– Venezuela, can come back after regime change – 2 mb/day more possible
– Iran, can come back with a new US president or China running blockade breakers – 2 mb/day more possible
– Lybia can come back with one side winning the civil war – 0.5-1 mb/day more possible
Venezuela is a wild card, if someone taps the tar oil there lot of production is possible, and bye bye enviroment.
So it’s still a political and not a geolocical peak, even without USA.
There have always been political problems and there always will be. If it were a perfect world we might hold off peak oil another five to ten years. But the world is not perfect and never will be. Peak oil will be peak oil, regardless of the cause.
Exactly. It doesn’t matter for max production if an easier geopolitical issue, say Libya getting back close to post-civil war max, is overrun by other people’s natural decline rates in the meantime. This is particularly the case re: Venezuela where it would take many years of large foreign investments to restore production if it started tomorrow. By the time that happens, Russia and China (aging fields only held up by EOR blitz) will be down by much more.
Theoretical peak based on believed URR and actual peak are not the same thing. To say nothing about how suspect some URR claims are (anything from the Gulf state NOCs, lazy extrapolations of US fracking).
My overall URR is essentially an average of Laherrere’s work and the work of the USGS for conventional oil, is based on Laherrere’s work for extra heavy oil and I use mostly USGS mean TRR estimates and my own analysis to estimate tight oil output.
I presented a poster on Permian output at the AGU Fall Meeting last December (poster can be downloaded at link below (about 75% works pretty well for viewing PDF). Note that the poster was finished just before new estimates for the Permian Delaware Basin were published so an updated analysis has been done (mean case is similar to earlier high case for URR with revised TRR estimates).
https://agu.confex.com/agu/fm18/meetingapp.cgi/Paper/446221
I have also done a Bakken Analysis (updated since post below)
http://peakoilbarrel.com/oil-field-models-decline-rates-convolution/
The type of analysis above combined with the economic analysis presented in the AGU poster and work in Mathematical Geoenergy (link below) on the Bakken, has been completed for all major shale basins in the US.
https://www.amazon.com/Mathematical-Geoenergy-Discovery-Depletion-Geophysical/dp/1119434297
The resulting model ( see below) might be considered lazy analysis by some and of course is far from perfect, chances that it will be a correct depiction of future output are infinitesimally small as this is one of an infinite number of possible future scenarios.
Chart below shows annual EIA tight oil data. In 2018 the model underestimated actual annual average tight oil output by about 175 kb/d, in 2019 the model predicts 12 month average tight oil output at 7410 kb/d, in March 2019 output had already surpassed this level, with average output for the first 3 months of 2019 at 7331 kb/d, so the model may again underestimate output in 2019. In short, the model is fairly conservative, if anything it may underestimate future tight oil output. Well profiles used in the analysis are based on the free data available at shaleprofile.com. Hyperbolic well profiles are fit to the data and a 15% terminal exponential decline is assumed when the hyperbolic decline rate flattens to 15 % (typically at about 12 years after initial output for best fit hyperbolic using OLS).
If average US tight oil output for the April 2019 to Dec 2019 period (9 months) rises by 146 barrels per day above the March 2019 level of 7,419,000 barrels per day, then my model estimate for 2019 average US tight oil output will be correct. My guess is the model will underestimate US tight oil output.
I agree that regardless of how you stack it, peak was 2005 if not for USA shale and Iraq coming back online after being invaded.
The constraints to production are far from just geologic. Technical, military, political, environmental decisions, energy conservation or alternatives, economic policy, all play their role.
Hickory,
Alternatively one might claim that it was expected that Iraq would come back online once the security situation improved. The biggest surprise was how quickly tight oil ramped up and I was relatively surprised that Canadian Oil sands ramped as quickly as they did. Though looking back at the 2008 Canadian Association of Petroleum Producers (CAPP) forecast, they did predict such growth in oil sands output, but I was skeptical at the time.
The 2018 CAPP forecast predicts 4.38 Mb/d of oil sands output in 2035, about 1.3 Mb/d above Dec 2018 oil sands output. This is a fairly slow pace of increase about a 76 kb/d average annual increase from 2019 to 2035.
Agree Dennis.
I’m watching the maneuvering and story telling of the trump team in regards to Iran. Seems they are just itching for a reason to attack Iran.
I’m no fan of the Iranian goals and operations beyond their own borders.
But another fabricated war (like Iraq) will be an even bigger disaster.
Careful what you wish (vote) for folks.
Hickory,
Agree War with Iraq was dumb, and war with Iran would be dumber. I am surprised how good George W is looking at this point, I was not a big fan when he was president, but he is looking better and better compared to the moron in chief.
Eulenspiegel,
CAPP forecast from 2018 has Canadian output increasing by 1.4 Mb/d by 2035, for Venezuela an Optimistic forecast would have them at 2500 kb/d by perhaps 2035 so about 1.8 Mb/d above current output. For the more relevant point in time in 2025 when the peak is likely to arrive, CAPP has Canadian output at 694 kb/d above 2018 average Canadian output and Venezuelan political problems are unlikely to be resolved by that time, a very optimistic scenario (even for me) would have Venezuelan output perhaps at 1.6 Mb/d or about 800 kb/d above April 2019 output. An Iranian solution to political conflict with the US and Sunni Persian Gulf producers might indeed allow another 2 Mb/d, for Libya 300 to 600 kb/d is a reasonable estimate. The chances that all problems in Venezuela, Libya, and Iran will be resolved by 2025 are near zero. Canada at a 700 kb/d increase is probably reasonable and even solving the Iran puzzle is possible with a reasonable US President, which could give us 2.7 Mb/d by 2025, this might be adequate to offset declines elsewhere or lessen the rate of decline after 2025. Libya might be able to recover before 2025 (I am not tuned into the civil war there, perhaps it will be a stalemate), Venezuela is unlikely to make much progress before 2030 in my view, though Fernando might have some insight there.
Norway is to add 0,5 mb from a new field at the end of the year.
US is planing to take control of Iran & Venezuela to insure its fair share. One problem with the US – Iran war. Iran has nukes. Iran sort of let that slip out a few days ago, when it stated Iran can take out the entire US naval flotilla stationed in the straight with a single missile.
That armada just sent to the Gulf should be considered a floating Gulf of Tonkin.
The USA should be able to take out a single or a few medium range missiles. Something nearing the fleet with high velocity will be taken out.
I don’t think Iran has access to the newest russian hypersonic technology. Instead it’s propably a variation of the old Scud missles.
A reason for a war it will be even when shot down anyway.
Khalij Fars is an Iranian single-stage solid-propellant, supersonic anti-ship quasi ballistic missile with a range of 300 km. It is based on the Fateh-110, which itself can do about mach 3.5. KH 35 is a pretty good anti ship missile, although subsonic. A large volley would likely overwhelm fleet defenses.
China and Russia are probably looking at research opportunities to be conducted in the next Middle East weapons lab, er I mean war, courtesy of the American taxpayer. Iraq during the 2003 to 2010 time frame was mostly an anti-armor lab. Iran war will likely feature more anti naval technology, which China is quite interested in these days.
Iran has its own missile program & also been sharing missile & nuke tech with North Korea.
A nuke assault on a Naval group would like be multiple missiles, all but one decoys. The Nuke would be detonated as air burst to cover a large area and does not need to be close to its target.
In the case of the Iraqi Scuds, they had chemical warheads and need to be very close range to do any damage. a Nuke can be air busted high above its target and cause widespread destruction.
I would imagine Iran would be launching dozens of missiles nearly at the same time, in order to overwelm defensive systems. One tactic with nukes is high alt. airbust which causes localized EMP knocking out radar and other electronic systems, thus rendering them in operative or blind for a period, & enough time to reach their targets.
War is a terrible thing. No one wins, except perhaps the Arms merchants.
As the fabricated events from the Gulf of Tonkin showed, attacks don’t need to be real to be used as an instigation for war-
https://www.usni.org/magazines/naval-history-magazine/2008/february/truth-about-tonkin
All it takes these days is a press release and bit of ‘news’.
Who Pays the Pro War Pundits?
https://youtu.be/PuVFeeFJ1X0
“Journalists for Hire : How the CIA Buys the News”
https://gosint.wordpress.com/2019/05/07/two-years-ago-journalists-for-hire-how-the-cia-buys-the-news/
I’m late to the party. As regards Occidental versus Chevron and the pursuit of Anadarko, which then evolved into discussion of the 2009 events in the crisis, which maybe should not have because there’s a lot of inaccurate information that went back and forth but it doesn’t matter. I’ll just toss out some data that either you have or should already have. I didn’t work through the entirety of the scroll, and that doesn’t matter either.
Perhaps the most important item and OXY –> CVX thing is Warren Buffett. He is funding the OXY bid. He is buying 10 billion in preferred. You can go and find a wiki or something on preferred stock in general but in this case he is purchasing preferred in OXY that’s going to yield 8%.
Just consider that repeated. And think about that number. And then go and look up Bank of America and its preferred held by Warren Buffett.
The reason this is a big deal his Buffett was approached during the crisis and essentially was begged to participate in the attempts to prevent global annihilation. He agreed to bail out BOA and his instrument was preferred.
I can assure you he doesn’t want a position in shale. The odds look higher that someone approached him to make this happen.
Oh and by the way the Fed in January when they announce the suspension of rate increases also put a date of sometime this year for suspending the unwind as well. And yes the BOJ owns one hell of a lot of the Japanese stock market. I’ve mentioned this before in the context of the silliness of presuming that there are free markets. Probably best to realize that they will be less and less free as oil scarcity asserts itself.
About a month-and-a-half ago a conference was held how’s the follow-on to a Davos discussion some months earlier. The conference publicized it’s subject matter as being an expansion of the Fed’s toolkit. It turned out that the majority of the conversation focused on one tool proposed. That tool will be the Fed’s purchase of equities. Buffett won’t always be around.
I don’t think W. Buffett would spend a dime on the shale companies if it wasn’t for the expectation of a good return. That fact that he got 8% preferred is just the kind of outstanding bargain you can get when you are a huge player with resources (money) to deploy, and you are smart.
Buffett is not compelled to bail them out. How I see it anyway.
Buffett was approached to do the Occidental deal. He was approached by Bank of America.
https://www.bloomberg.com/news/articles/2019-05-03/buffett-says-bofa-s-moynihan-was-matchmaker-on-occidental-deal
https://readsludge.com/2019/05/02/bank-of-america-is-set-to-profit-from-the-biggest-oil-industry-merger-in-years/
“By the end of 2018, Berkshire owned 918.9 million Bank of America shares worth $22.6 billion, its largest common stock investment other than Apple, and sat on an $11 billion profit.”
https://uk.reuters.com/article/us-anadarko-petrol-m-a-occidental-buffet/frothy-markets-turn-dealmaker-warren-buffett-into-a-bankroller-idUKKCN1S62GN
The headline is deceptive, but that’s a good find. A few 10s of millions of advisory fees is not the motivation.
Read within. It’s the 107B in shale loans they made.
Buffett is a large holder of BAC common BECAUSE OF THE BAILOUT he did. The preferreds were convertible preferreds. They had a conversion price that evolved to be well below the price of the common in 2017. The mechanism involved warrants but that doesn’t matter. He put up $5B to bailout BAC and got 6% preferreds that were convertible into a big chunk of common.
(For amusement folks should go back and look at the story of BAC during the crisis from about 2006 to 2011. Odds are at least 50/50 a murder took place to keep the CEO from talking.)
Someone needs to scope out his $10B 8% preferreds in OXY. Are they convertible?
And make no mistake here, BAC needed another bailout — from the devastation unfolding in shale debt.
U.S. Petroleum Balance Sheet
EIA pdf file http://ir.eia.gov/wpsr/overview.pdf
Oilytics chart summaries
https://pbs.twimg.com/media/D6nZBGLXsAAfGk8.jpg
https://pbs.twimg.com/media/D6nafnnWAAA0HqQ.jpg
Global fossil fuel subsidies hit record $5.2 trillion –
https://desdemonadespair.net/2019/05/global-fossil-fuel-subsidies-hit-record-5-2-trillion.html
The Free Market in action.
FF make our world look different than 18th century, so I don’t get the subsidy thing. Unless you are a moron (hi Dennis), and think, that our civilization can be powered by “renewable” energy.
Have the cajones to state your name, “name,” especially if you’re going to insult our moderator. Otherwise, stfu.
Well, there’s an argument in that post, somewhere, but damned if I can figure it out.
I don’t think Dennis coined the terminology “renewable energy”, which would make most scientist cringe. Alternate is a much more acceptable term. Can it replace FF uses? Surely, not in the near term. At least all of the uses. But, it’s much better than nothing. Nothing is the end result of relying on FF. In the end, we will adapt to alternate, or wind up with the nothing end of the spectrum. I vote adapt, but I am only one vote out of billions.
GuyM- “Can it replace FF uses? Surely, not in the near term. At least all of the uses. But, it’s much better than nothing. Nothing is the end result of relying on FF. In the end, we will adapt to alternate, or wind up with the nothing end of the spectrum. I vote adapt, ”
I agree with you entirely here. Question is- Timing, how fast should we get to it?-
How long will affordable oil and gas last, how quickly can we deploy alternatives ‘at massive scale’, how much incentive for adaptation should we apply.
I think it is unlikely we will achieve a transition with enough energy available for normal function of the economy as we know it. Not at this pace.
I hope to be wrong on this.
My view is that we must first have a major crisis to get the focus right and also adjust to the reality, that is; what is common knowledge? Second, there will be a time frame with faltering oil output and increased focus on natural gas, that will allow for more focus on a transition. The following up question is if we will have an environment with room for adjustment like now with plenty of capital and low interest rates to once again allow for a transition. The governments around the world are the ones that can plan, or else short term is the norm – and short term planning is often unfortunately to be expected I guess. Some governments have been making incentives for renewables now for a while because it is easier now when you have overabundance in some nations (my guess). I am just reading the policy in etc. Norway between the lines; that is where I live, so also easier to pick up signals here as opposed to elsewhere.
kolbeinh wrote:
“My view is that we must first have a major crisis to get the focus right and also adjust to the reality, that is; what is common knowledge? ”
We already did back in 2008. Its pretty much back to BAU at this point. No investment in Public train transport. People are buying big SUVs again. More big McMansions with no attentions to energy efficiency.
Nothing is going to change until the world is forced into Change. Lots of unable consumers lead to global wars. USA started early with wars in the Middle East targeting Oil Exporters. Only VZ and Iran remain, Both will end up with war with the US either very soon, or before 2023.
Yes, it is grim. The peak oil theme was not present too a large degree in 2008 though? The war drums are approaching Iran it seems. That is going to be 5x worse than Iraq if it happens. Total chaos with oil supplies lacking and the country itself too big to be easily invaded. If it is an economic blockade it is still going to be disruptions in oil supplies with no end in sight. Venezuela is going to be a piece of a cake compared to that one. Question is if the Trump administration has time enough and goodwill enough to do this quickly enough. I am in the camp that things tend to take time (both in this instance and also for example in the climate change question).
I don’t think the future will look like the present in terms of energy no matter what we do or don’t do. We can either shoot for as smooth a transition as is possible, or wait until we hit crisis mode and let economic failures happen as they may.
Boomer II,
I agree with your assessment. If I ruled the World, I would choose option one, I don’t, so option 2 looks more likely.
The crisis might prompt policy changes to help attempt a smoother transition, at this point most people think we have hundreds of years of fossil fuel, what many fail to realize is that once half of the resource has been produced, declining output is likely to follow soon. Continued output at the peak level doesn’t continue until 100% of the resource has been produced, we all know this, but most people do not get this fact.
Cumulative C+C output at the end of 2018 was 1365 Gb, if my medium URR estimate is correct (3100 Gb) then thr midpoint is 1550 Gb, about 185 Gb more than the year end 2018 level, output was 30.2 Gb in 2018, so in just over 6 years we would be past peak if output doesn’t increase after 2018. My guess is that output over the next 6 years will average about 31.2 Gb each year, so the peak would be a little less than 6 years in 2024. A lower URR estimate would move the peak to 2022 and a higher estimate to 2026, the changed URR estimates would also result in a lower or higher peak output level from 84 to 88 Mb/d, with the best guess at 86 Mb/d.
In any case, the peak will become evident over the next 5 to 10 years, at that point things may change.
Dennis,
I suppose the peak will be evident when China won’t be able to get those additional hundreds of thousand of barrels it needs to keep its economy on a stable path of growth (or when fracking can’t provide the US-illusion of plentifulness anymore). Then everything will break loose.
The problem will be gradual decline will make people miss the peak thinking it is a repeat of 2005 to 2010 where there was a plateau followed by an increase. After 2025 an increase in output is not likely.
“The problem will be gradual decline will make people miss the peak thinking it is a repeat of 2005 to 2010”
not so sure it will be gradual. It could become a whipsaw event where prices become very chaotic, rising & falling in response to economic instabilities.
I am sure your aware of system stability & tipping points. Systems can be stable right up to the tipping point, then suddenly & rapidly become verychaotic.
If we look at the summer of 2008, that seemed to be the tipping Point. Oil prices peaked out at $147\bbl and soon after the global economy collapsed into a rapid collapse as the tipping point was breached. The change was global as it affected all nations as over extended companies, consumers an gov’ts suddenly had their feet knocked under them (metaphorically speaking)
If you look at the global economy today, its slowly creeping toward the tipping point as debt growth & demographics (Boomers beginning to retire putting pressure on underfunded pensions forcing many local & state gov’t to raise taxes). Its possible that rapid rising of energy price could once again be the trigger for the next financial crisis.
Oil prices are essentially global. when they change in prices they impact the entire global economy rather than a local\regional economic changes. It has the power to trigger tipping points in many locations unlike a localized recession, natural\manmade disaster. So if oil prices are low and only country falls into a recession it usually does not trigger the rest of the world into a recession, but when Oil prices are, usually a lot more nations fall into recession.
When worldwide recessions hit they have a much more powerful impact on all nations as everyone feels the pinch which tends to global change peoples spending & employment.
Techguy,
Yes I am aware the system can become unstable. Japan is a case where the demographics are not good, and so far a tipping point has not been reached, the economy has been remarkably stable considering the very high debt levels.
The GFC was due to poor regulation of the financial industry (see The Big Short) rather than high oil prices. Oil prices were quite high from 2011 to 2014 (an average for Brent of $107/b over that period) while Global GDP growth remained strong. The volatility in oil prices from 2015 to 2018 has also not affected World GDP very much.
So though it is possible there might be a GFC 2 or major war, it is by no means highly likely (I would guess 50/50 odds that decline in World C+C output will or will not be more than 2% per year from 2019 to 2030. My best guess is about 1%/year on average from 2025 to 2030, the World can likely adjust to the $130/b oil prices that are likely to result and the high price to keep demand in line with supply.
Dennis Wrote:
“il prices were quite high from 2011 to 2014 (an average for Brent of $107/b over that period) while Global GDP growth remained strong.”
Not really, The economy was largely floating on a lot of QE, stock buyback, and cheap & easy credit. Since then Companies have been burying themselves deep in Debt to support stock buybacks & buying up competitors. Ditto for consumers, doubling down on their debt load because lower interest rates made it possible to borrow even more.
So with all this additional debt, we are creeping back up into the default territory as consumers & business may start to find it difficult to service there debt. No doubt gov’t will unleash the QE kracken to avoid another financial crisis, but its hard to drop interest rates below zero for consumers & businesses without major repercussions.
Tech Guy,
Note that the fact remains that real GDP growth was relatively strong and has remained so since 2010, eventually there will be another recession, but it is not likely that any near term (next 5 years) recession will be severe. The 2009 recession was the worst since 1933. Not likely to repeat until 2030 in my opinion.
See
https://www.bis.org/statistics/totcredit.htm?m=6%7C380%7C669
For BIS debt to GDP
Hickory,
I believe you are correct, if you are assuming the economy will continue in the future as it has in the past. This will not be possible and that should be a catalyst for change, which is probably a good thing in that the present path is not a good one, we need to change course. The future path that is chosen is difficult to predict, all we can be nearly certain of is that the path is likely to change.
Dennis,
I believe CTL is very economic when oil rises roughly above $75/bbl in current dollars. But…economies of scale require very large projects, and so they’re very risky.
12 years ago it started to become economic when prices rose above around $50 (not adjusted for inflation since then), but the Feds sent strong signals that they would not provide policy support (loan guarantees, etc) because of how dirty CTL is. And…investors dropped the idea.
CTL has only gotten riskier – I’d be very surprised if it had a future outside some limited projects in China.
Thanks Nick
The original discussion of subsidies here had to do with a faction who believed that price could restrain consumption. It is probably not a perspective that qualifies as absurd, but almost.
Note parenthetically that the same relative absurdity applies to production as well. Argentina.
I may disagree with Dennis (strongly), but he is anything but a moron. I doubt you are even capable of understanding the math behind the models he is producing.
Niko,
I forget your point of view, perhaps you believe the C+C URR is far lower than say Mr Laherrere’s estimate and no transition is possible.
Not many agree with my positions, but there a variety of reasons. I think a transition to other sources of energy will be necessary, but I doubt BAU will continue, the necessity of transitioning to non-fossil fuel will lead to social change. I am unsure what form that will take, I am hoping it will be one that attempts to minimize human impact on the environment, perhaps by encouraging smaller family sizes, better stewardship of the planet, etc.
Note that I see no reason why this would be likely, except that eventually it will become clear that it is necessary for anyone who opens their eyes. It is already crystal clear to me.
Is it possible that coal to oil could postpone the peak a few years?
Tom,
I imagine it would take quite a bit of time to install needed equipment and I am not sure the price would be competitive. I think at best it would reduce decline rates a bit, doubt it would be of much significance. Good data on coal to liquids cost is hard to find.
North Dakota Director’s Cut: March +54 kb/day to 1,390 kb/day
pdf file on this page: https://www.dmr.nd.gov/oilgas/informationcenter.asp
completions chart
https://pbs.twimg.com/media/D6oXmoZX4AIUApn.png
US inventories week/week change (1000 barrels)
Crude Oil: +5,431
7 oil products: +737
Total (crude oil + 7 products) +6,168
Propane & Natural Gas Plant Liquids: +8,480
SPR: -1,764
Line 13 Adjustment +5,845
Chart https://pbs.twimg.com/media/D6rpeDgWsAEeASx.png
US Crude Oil & Distillates
+6.6 million barrels week/week
+40 million barrels year/year (from May 11th 2018)
Chart https://pbs.twimg.com/media/D6rprWOXYAAQqWz.png
Fujairah weekly inventory change (1000 barrels)
Total Distillates +111 week/week
Total Distillates +6,383 year/year
https://pbs.twimg.com/media/D6l8763X4AAN5dd.png
Japanese weekly inventory change (million barrels)
Crude Oil +8.93 w/w
Total (Crude + Distillates) +10.82 w/w
Total (Crude + Distillates) +3.08 year/year
https://pbs.twimg.com/media/D6mJYE0XoAAEUC_.png
OPEC MOMR: monthly inventories: ARA + Singapore
Chart https://pbs.twimg.com/media/D6rsOSxXkAAji0B.png
Then we still have a big over production – so no problems with production dropping another 2 or 3 mb/day?
So even with the new Iran sanctions and a Venezuela further dropping, tanks will continue overflowing.
Hardly. Give it less than a month. My guess is those less than visible storage areas are already dropping, and that makes the visible areas look weird. And probably includes a lot of original and rebranded oil from Iran.
As oil price is determined now (80% looking straight at US storage tanks) it would be easy to suppress oil prices for a few months, for example for a trump re-election.
Just bring companies to order some more than needed, and transport a tanker extra each week from SA/Iraque to USA.
That’s an easy 10$ less WTI price for a bit of transportation cost.
All this oil business stays somewhat opaque.
I think it has more to do with refinery operations. One, they are gathering nuts for the winter, and two, it helps suppress oil prices if we look full. And, we are looking at commercial inventories, not what has been drawn down from various SPRs.
OECD stocks days of forward cover, 5 year average is 95.35 days.
The anticipated shortage of oil with delivery in autumn is visable in Brent (huge backwardation). Who would have thought so? It is selfinduced in some way as choking Iran (not a very nice move btw) and Venezuela would lead to a large shortfall especially given seasonal demand growth that usually occurs second half each year. And also the investment shortfall in shale oil, offshore and within OPEC materialise in the form of disappointing output gradually more in the same timeframe. So this “shooting oneself in the foot” policy surly must have some purpose? Well, it is probably constructed to check out what kind of spare capacity and excess inventory that really is out there before sanctions eventully are revoked. Not very impressed by what is going at the moment – the marketplace must be very confused.
The OECD inventories are the ones to watch, they are very large 4500 million barrels or so and they are currently at about 2014 levels in terms of days of forward supply and below the 5 year average. Not very good visibility of Indian and Chinese petroleum stocks, so the best we can do is watch the OECD stocks.
That is the main problem with predicting oil prices in my view. Some countries with strategic inventory of oil can decide to overflow the market for a substantial period of time. And I am not confident that it gets reported properly (inside OECD or outside it). But my guess it that such activities have been going on for some time now, at least in 2018 and 2019. The feeling is that the market is approaching breaking point due to failure of true price discovery (too low prices). But that is only my hunch; remains to bee seen. And if this view is ever going to be backed up by data it will be way after it is proven right.
The numbers above include the strategic inventories within the OECD, which is fairly transparent (the OPEC MOMR) reports the most recent 3 months and quarterly data is available for earlier periods. Data does get revised and is far from perfect and OECD is only about 30% of World consumption (total liquids), so we have a lot of missing data on petroleum stocks, about the best we can do is look at supply and demand analysis from the IEA and OPEC which seems like a lot of guessing, guessing should not be allowed. 🙂
Agree. My question at the moment is what is going to happen with US exports as China may be vary of importing due to the ongoing trade war, especially extra light oil. Are China going to compensate from their substantial strategic inventory or not?
Do we have decent data on Chinese petroleum stocks?
Will LNG Exports impact US Prices?
“The burgeoning love affair between Americans and renewable energy is turning into a love triangle with natural gas. ” https://thebulletin.org/2019/01/us-has-a-natural-gas-problem/
“On Monday, Chinese officials said the country would more than double its tariff on imports of U.S. liquefied natural gas, or LNG, from 10% to 25%, in retaliation”
https://www.theadvocate.com/new_orleans/news/business/article_ba9b8b20-75a7-11e9-b02b-73d47318395d.html
This does not equate to an increased price for China. Preliminary data says the tariff will not increase the price of the LNG. Rather, China will just stop buying it from the US.
FYI, North Dakota totals through March, 2019
Very intetesting that Exxon seems to only. earn fraction in US and the shale investment seems to obvious to be a very, very bad investment compared to the international oil and gaz buisiness. It might indicate Mark Papa was correct in 2018 when he told the best in US shale is behind , perhaps now the sweet spots starts to be fully utilized and geology constraints, increaced decline rates makes it even impossible for oil majours to earn money in a time where oil majours several times have highlightened the importance to get investors back as the rumor is already very bad because of huge losses. I know from the news Equinor want to sell their shale buisiness , they buy and invest now offshore. Dutch Shell sold also shale acre, and soon Exxon might follow. Trump do as best he can to keep WTI below 60 usd/bbl , soon the trade war will give huge negstive impact on world growth and oil price. Will be very interesting to see what happens when all DUCs are compleated , will there still be free cash after loan baloons , dividends are payed to drill and compleate . The investors have refused to give more , guess also the banks . They want their money back….
Off topic: I recently updated my Mac and ever since then this site address is preceded by “Not Secure.” Anyone else had that experience?
Site doesn’t run https nothing to do with your mac.
Change your web address to start with https, then safari won’t complain. Works ok for me.
You cannot just change the web address to HTTPS. That is the protocol determined between server and browser. To get HTTPS you need a security certificate for the web site and make changes to how the server handles your web site.
NAOM
Umm, actually it did work. I edited the address of the bookmark and the “Not Secure” no longer appears.
If you changed HTTP:// to HTTPS:// then you changed the requested protocol not the web address which is the WWW part.
Hyper Text Transfer Protocol
Hyper Text Transfer Protocol Secure
The change means that you are requesting an encrypted page that is certified. There is an add-on HTTPS Everywhere that you can use to avoid issues as it changes your protocol to HTTPS every time. Note that some sites are behind the times and do not like HTTPS 😉
NAOM
It is the Chrome browser tagging all HTTP non-HTTPS sites as not secure. Expect it to be coming to other browsers soon. Note that Firefox has an i in a circle at the start of the web address box which, if you click on it, tells you that the connections is nor secure.
NAOM
If you are interested in your privacy, don’t use chrome or firefox.
And the reason for that is?
NAOM
Both those browsers data mine, chrome is possibly the worst when it comes to data mining and spying on your browsing behaviour. Obviously because it is owned by Google.
Firefox has recently followed Google’s footsteps.
You can download fork browsers from both chrome and firefox which disable or completely take apart the data mining aspects of the browser. For e.g. Ungoogled Chromium is Chrome fork.
Waterfox is a firefox fork.
There are many to choose from and your privacy is somewhat better protected.
There is always Tor———-
Works fine for this site.
LOL! Peak Oil Barrel on the dark web!
And guaranteed to get you noticed by NSA and many other TLAs.
NAOM
Not my experience with Firefox and I make sure all security features are activated. I also use privacy apps which keep browsing clean. You may want to add the following to your hosts file
http://winhelp2002.mvps.org/hosts.htm
NAOM
The “New Energy Economy”: An Exercise in Magical Thinking
https://www.manhattan-institute.org/green-energy-revolution-near-impossible#notes
Roger,
Using BP data for fossil fuel consumption in millions of tonnes of oil equivalent from 1973 to 2017, the average rate of growth in the consumption of fossil fuel has been 1.84% per year. As fossil fuel output peaks (oil, then coal, then natural gas in 2025, 2030, and 2035) the price of fossil fuel will rise relative to alternative sources of energy and the rate of growth in consumption will slow to zero and then become negative. The process will be gradual and as economies of scale for solar, wind and other sources of power drive their costs lower the transition will accelerate.
The “magical thinking” of that author is that he may believe that fossil fuel output can “magically increase” forever, they are incorrect.
The share of fossil fuel energy in primary energy consumption was 85% in 2017, down from 94% in 1965. The author also fails to point out the simple physics that 60% of fossil fuel energy is lost as waste heat, most of this waste is eliminated with wind solar and hydro. This is very simple physics.
His solar example points to the efficiency of PV conversion of incoming solar energy to electricity which obviously has physical limits. His mistake is assuming the reduction in PV costs is primarily because of an increase in the efficiency of the PV panels, most of the cost decrease is due to lower costs of manufacturing and installation of PV panels and associated equipment as well as tracking technology and many other factors. LCOE cost for utility PV has fallen to 6 cents per kWhr in the US and is expected to reach 3 cents per kWhr in 2030, at that point coal and natural gas fired electricity generation will no longer be able to compete. It will only be a matter of time before most fossil fuel power generation is replaced with wind and solar, probably 2050 to 2060. Fossil fuel use for land transportation will also be replaced with EVs, electric trains, and light rail. The replacement of water, air, and petrochemical uses may take longer, though rising fossil fuel prices will eventually lead to alternatives being implemented in these sectors as well.
His mistake is assuming the reduction in PV costs is primarily because of an increase in the efficiency of the PV panels, most of the cost decrease is due to lower costs of manufacturing and installation of PV panels and associated equipment as well as tracking technology and many other factors.
Dennis, he goes in depth into all these topics and many others, and quite clearly speaks about how these factors are the reason for the drop in price. He also explains why these factors will not be nearly sufficient.
The cost per kilowatt hour is very nearly irrelevant when examining whether a fully renewable grid is feasible, another fact he delves into in great detail. I don’t think you grok it though. You must choose not to, because it’s certainly no more complicated than the models you yourself create.
Faced with all the realities outlined above regarding green technologies, new energy economy enthusiasts nevertheless believe that true breakthroughs are yet to come and are even inevitable. That’s because, so it is claimed, energy tech will follow the same trajectory as that seen in recent decades with computing and communications.
Niko,
The costs of PV have fallen mostly due to cheaper manufacturing as the industry has scaled up. The point is that several studies have shown we can get to 80%, the last 20% may require breakthroughs, though some studies have shown with a highly interconnected system with solar and wind widely dispersed very little backup power will be needed, as little as 1%.
The study was based on 4 years of actual data for a land area roughly 25% of the US L48.
See
https://www.sciencedirect.com/science/article/pii/S0378775312014759
Post below covers the back and forth over Jacobson’s proposals.
https://cleantechnica.com/2017/07/08/mark-jacobson-naysayers/
Dennis,
I think you also engage in another kind of magical thinking.
The fossil fuel that matters most for the present conundrum is oil since it is the least abundant. The oil rate of growth, although quite variable, has been decreasing over time. It was high in the 70’s. If we look at the ten-year average rate of growth in oil production we can see that it decreased from about 1.7% per year in the early 90s to about 1.2% per year in the mid 2010s. Since 2015 it is at ~ 0.8% and it doesn’t look like it is going to increase. Quite the contrary.
So essentially Peak Oil has arrived. Oil production increase has become so low as to be almost negligible. As a result oil is becoming more costly over time as it is increasingly being obtained from more costly sources (tight formations, deep-sea, Arctic). Coal-to-oil should prolong oil production but it is also a costly substitute. Part of the economic agents will not be able to afford the increasingly costly oil and as a result the economy will contract. So with Peak Oil the economy will go from expanding to contracting. Social disruption then exacerbates the problem.
Oil is not used for energy production but for transportation, while only a small part of electricity is used for transportation, so it is not a good substitute. Then we have the problem that solar and wind are low density, intermittent sources. So they are also not good substitutes for nuclear or fossil fuel electricity generation. Under a contracting economy with expensive oil derivatives the world won’t be able to substitute the over a billion vehicles even if possible. It probably isn’t possible because of battery limitations.
The global economy rests on three bases. One is labor, required for the production of goods and services, that rests on the demography. The demographic dividend from a working-age cohort expansion has all but disappeared even in China, and all the world except Africa is entering a demographic burden when the >65-years old cohort expands to constitute over 20% of the population.
The second base is credit, required to start new businesses and expand the economy. The global credit situation is awful. The credit situation is such that it can only be resolved at the expense of a great damage to the economy.
The third base is energy, required together with labor and credit to produce goods and services. This is our main resource. Fossil fuels have been responsible for the improvement in life conditions and the growth of the human population. Cheap energy is essential.
What you don’t seem to get is that if the energy becomes costlier it is equivalent to our main resource becoming more scarce. And it is known what happens to complex civilizations when their main resource base contracts. The key author here is Joseph Tainter: “The collapse of complex civilizations” (1988). You can get a copy here:
http://gen.lib.rus.ec/book/index.php?md5=95D1F492D6186FC1676042FA835D224E
Complex societies resolve problems by building complexity using the surplus from their base resource utilization. As they become more complex the return from this surplus utilization keeps decreasing, as it responds to the universal law of diminishing returns, while the complexity keeps increasing. When the resource base decreases there is no way to maintain the complex society, that cannot be simplified in an organized manner. As more and more people feel the system is no longer useful to them and not worth maintaining, collapse follows.
That is what is going to happen. As oil becomes costlier the economy will perform worse excluding more people and making an energy transition impossible. Then the system starts collapsing, and what we have seen in several countries from different causes (Sudan, Somalia, Yemen, Syria, Libya, Venezuela) will start happening to more and more countries, also from different causes with a common theme. Supranational organizations and heterogeneous countries will break up and globalization will unravel producing conflicts and a lot of social unrest.
The Soviet Union collapsed from a reduction in their base resource, but the rest of the world was doing well so things never got too bad and recovery was possible afterwards. The global collapse will be a lot worse.
“Oil is not used for energy production but for transportation, while only a small part of electricity is used for transportation, so it is not a good substitute’
“Insight to what’s going on
Information keeps us strong
What you don’t know can hurt you bad
Take it from me you’ll be walkin’ around sad
Cryin’ for a better day
Until you educate for a better way
So if you wanna be in control
Ya gotta get yourself in the know”
“Scarcity refers to a gap between limited resources and theoretically limitless wants [2]. The notion of scarcity is that there is never enough (of something) to satisfy all conceivable human wants, even at advanced states of human technology. Scarcity involves making a sacrifice—giving something up, or making a tradeoff—in order to obtain more of the scarce resource that is wanted.[3”
https://en.wikipedia.org/wiki/Scarcity
“The theory of consumer choice is the branch of microeconomics that relates preferences to consumption expenditures and to consumer demand curves. It analyzes how consumers maximize the desirability of their consumption as measured by their preferences subject to limitations on their expenditures, by maximizing utility subject to a consumer budget constraint.[1]”
“The law of demand states that the rate of consumption falls as the price of the good rises, as the price of a good rises, consumers will substitute away from that good, choosing more of other alternatives”
https://en.wikipedia.org/wiki/Consumer_choice
Carlos, your thinking is still based on decade old thinking that there is no substitute for fossil fuel based transportation. The world has moved on.
“The world has moved on.” ~ HB
93 million barrels a day as of 2015 and still increasing.
https://en.wikipedia.org/wiki/List_of_countries_by_oil_consumption
IMO Carlos appears to be making observations and projections, not expressing a way of thinking, i.e. an ideology, a distinction that is no doubt missed by HB.
While it may be posited that his projections are flawed because his assumptions are incorrect; to accuse him of peddling ideology is basically shitposting, an alt right tactic of online discourse increasingly popular with the cornucopians when unable to posit credible arguments.
While HB may have his finger on the pulse of Silicone Valley Hopium, his grasp of human nature; the human condition; and how people will respond to the various carrots and sticks soon coming their way, is extremely simplistic and naive. It makes me wonder if he’s ever left USA and seen the shabby end of this planet, and how its many inhabitants are faring.
Demand does not reduce with price. Neither does consumption.
This is why God gave us govt subsidies.
“IMO Carlos appears to be making observations and projections, not expressing a way of thinking, i.e. an ideology, a distinction that is no doubt missed by HB.”
“your thinking is still based on decade old thinking”
What Carlos has failed to observe over the last decade is that technology has advanced to the point of a viable alternative to ICE. The economy isn’t going to collapse because of peak oil. It’s just going to improve the quality of life.
I have a problem with your definition of viable.
EVs are sold not because they are cost competitive and performance competitive. They are sold because of subsidies and regulations. When subsidies are removed the sales plummet.
https://www.zerohedge.com/news/2017-06-11/its-confirmed-without-government-subsidies-tesla-sales-implode
A tax-payer funded advantage doesn’t fit my definition of viable as it can only be maintained as long as EVs are a very small fraction of sales. Of course oil could become so expensive as to make unsubsidized EVs look cheaper, but that is the wrong type of transition, as it results in much lower total sales, economic contraction, and even a possible economic collapse.
It is hilarious how the rise of atheism has coincided with the faith being deposited on science and technology instead of being eliminated. Thermodynamics has resulted the most important part of science but one of the least understood by ordinary people. It doesn’t paint a rosy future for us. We cheated thermodynamics by using fossil fuels to create an artificial environment for 7.5 billion people. The idea that a combination of solar/wind/EVs can substitute that is so silly as to deserve contempt. We should be going the nuclear way full speed at this time. The faith in technology is, however, driving us to the precipice.
“When subsidies are removed the sales plummet. ”
And when your fossil fuels artificial environment that is subsidized by air pollution, bad debt and environmental degradation meets $120 a barrel. EV sales will sky rocket and that wasn’t the case 10 years ago.
Salud
They are not my fossil fuels as I have nothing to do with them except being a consumer as everybody else here. I don’t care much where my affordable energy comes from as long as it keeps coming and being affordable. Electricity in my country is becoming less affordable, and in fact one of the most expensive in the world as the bill includes a subsidy to renewable generation and a carbon tax. The result is more people are becoming energy poor. This is not the renewable paradise promised, it is the hard reality of more expensive energy. Its effect spreads over the entire economy.
“And when your fossil fuels artificial environment that is subsidized by air pollution, bad debt and environmental degradation meets $120 a barrel. EV sales will sky rocket and that wasn’t the case 10 years ago.”
Sorry, thats not going to happen. Consumers are reaching the bottom of the barrel financially. Car Loan durations is moving to 10 years. About 70% of American households live paycheck to paycheck.
My guess is that people will hold on to their existing cars as long as possible. and the number of vehicles per household will decrease (ie one car per household like 1950 Ozzy & harriet). I also expect number of people per household to increase which multiple generations living under the same roof. This already started with as about 35% of the millennials still live with their parents, and many them don’t own their own car.
EV’s don’t solve much considering the US grid power is about 63% from fossil fuels (Coal, NatGas, Distillates). If Nat Gas prices remain considerable below Oil price in the future, I expect more vehicles to operate on NG derivatives & eventually we likely will hit a production wall with shale gas leading to higher prices, which will drive up electricity prices.
FWIW: The two elephants in the room in the not so distant future are Demographics and Debt. When the Debt. Demographics crisis merge with Oil Depletion its going to create the perfect crisis. My guess is they all merge in the mid to late 2020’s. Which will end BAU forever.
Carlos- i would point out here that not a single nuclear power plant would get built without a huge subsidy.
Ex – Government Loan Guarentee
For the current construction in S.Carolina it is over $12 Billion
If the project fails, its the tax payer who losses the money.
The project needs the guarantee because they cannot get funding through any bank or state without it.
Just too risky, and expensive.
Much more expensive than coal, wind, solar, Nat Gas.
https://www.energy.gov/articles/secretary-perry-announces-financial-close-additional-loan-guarantees-during-trip-vogtle
Amazing that we were able to build them by the dozens in the 60s and 70s and we can’t afford to build them now. Meanwhile developing countries are now building them by the dozens. 50 reactors under construction in the world right now. I guess we have made them unaffordable through death by excessive regulations.
Carlos- ” This is not the renewable paradise promised, it is the hard reality of more expensive energy”
You think this is tough times for energy price. Just wait til fossil depletion starts to hit. Alternatives promise no paradise. Just that something is better than even less.
If you want to see costs for 2018 USA new electrical production, study page 3. It always helps to inform your opinions with some fact based analysis.
https://www.lazard.com/media/450784/lazards-levelized-cost-of-energy-version-120-vfinal.pdf
“Amazing that we were able to build them by the dozens in the 60s and 70s and we can’t afford to build them now.”
No new Nukes in the West. The reason for the boom in the 60’s & 70’s is the west wasn’t conserned about the major risks, but with the Meltdowns of TMI (US) Cernobyl & Fukashima, Nuclear is dead.
Another issue was Peak high grade Uranium Ore in the 1980s. No way to scale up Nuclear power when you peaked Uranium extraction. While Thorium is abundant, Good like finding people willing to expose them to Thorium (mining, extraction, smelting), as well as exposure to U-232 waste created using the Thorium cycle.
U-238 to Pu-239 is very expensive (equivalent to $3K of un-enriched Uranium).
My guess is that the world self-destructs anytime between now and the early 2030s as Demographics & resource depletion leads to WW3. US is now working to take control of Iran & Venezueala to grab the last share if independant Oil that is not directly under control by another nuclear power (China & Russia). Iran has Nukes so if the US does start a war with Iran it will go Nuclear.
Carlos,
Going to 100% nuclear is putting a lot more faith in technology than any other option.
https://cleantechnica.com/2019/04/25/tesla-model-3-vs-honda-accord-7-scenarios/
Even if the subsidy for the Model 3 is dropped ($3750 in the US) the Tesla Model 3 wins on the 17K per year comparisons.
Had a quick look and it looks as the cost of capital is not considered. I thought he had at first but looks like his “cash cost” was just the purchase price – his assumed resale value.
Adding cost of capital to the ICE case Tesla Model 3 SR+ vs. Honda Accord Sport CVT
10,000 Miles/Year, 5 Years the Tesla comes out at roughly 22500 a bit more expensive then the ICE and i guess that is where the argument about much nicer car will be applied.
Also to me it seems very guestimate to use an expected resale value of a car that just started existing as the back bone of to reach that “cheper than” conclusion, it might be correct but again it might not and then that calculation is way off.
Will Tesla still be operating in 5 years? If not how will that affect resale value of 5 year old Teslas?
If demand turns out to be weaker then expected on new Teslas, what will then happen to resale value?
Dont get me wrong here, im not against it in any way in fact i personally want to switch to a hybrid for my next car but so far the math (cost) has not made sense compared to an ICE.
Had a quick look and it looks as the cost of capital is not considered.
And it looks like you are not considering externalized costs of harming the environment and the commons.
Tesla may not be around in 5 years but that’s not the point. The point is that the current continuation of BAU is a destroyer of planetary support systems. I believe those support systems to be priceless… Tesla is just one small sign of systemic paradigm change, there are sure to be others. Of course you are free to ignore them!
Cheers!
Fred Magyar
“Tesla may not be around in 5 years but that’s not the point. The point is that the current continuation of BAU is a destroyer of planetary support systems. I believe those support systems to be priceless… Tesla is just one small sign of systemic paradigm change, there are sure to be others. Of course you are free to ignore them!”
What tha hell are you talking about, i was simply addressing the cost calculation not questioning the need for change! I also did as a safety measure include that i would like to buy a hybrid myself for my next car in the hope of having a discussion of economy (cost) without being jumped by the religious type, obviously it didnt work.
Cheers.
Hi Baggen,
He included the cost of a loan, assumed at 5 years 5.5% interest and assumed $5000 down payment, so not sure what you think he left out. The resale estimate is based on 60 month resale estimate Edmunds, the cost of the two cars is about the same if we assume maintenance costs are similar (I would think Tesla would have the advantage there). Also keep in mind that the Tesla is a much nicer car than a Honda Accord, so the fact that the cost is similar would be advantage Tesla. The Tesla is more like a well appointed Mercedes C class or BMW 3, cars that would cost about 40k minimum to come close to the features on the Model 3.
Dennis wrote:
“The resale estimate is based on 60 month resale estimate Edmunds, the cost of the two cars is about the same if we assume maintenance costs are similar (I would think Tesla would have the advantage there).”
Nobody wants used Tesla’s:
https://forums.tesla.com/forum/forums/worst-value-loss-any-car-i-have-owned-0
” paid almost 90K for the car. I was considering trading it for a Lexus hybrid until I was given a 40K trade in value. I understand every car loses a lot money in the first two years, but a loss of 55 percent shocked me.”
https://teslamotorsclub.com/tmc/threads/owner-frustrated-with-tesla-depreciation.138559/
https://teslamotorsclub.com/tmc/threads/depreciation-on-model-s-is-horrible.138350/
https://www.autotrader.com/car-news/why-do-electric-cars-lose-so-much-value-so-fast-265682
I still think Tesla will go bankrupt in the next 18 to 24 months.
Tesla lost $700M in Q1-2019
https://www.washingtonpost.com/technology/2019/04/24/tesla-lost-million-first-quarter-model-problems/?noredirect=on&utm_term=.5493ee6cced9
Loss of the $7500 Federal Tax Credit
https://www.thedrive.com/news/25757/tesla-fights-federal-tax-credit-loss-by-offering-2k-discount-on-all-models
Tesla’s Problems Add Up to a ‘Code Red Situation,’ Says Once-Bullish Analyst
http://fortune.com/2019/05/20/tesla-stock-drop-code-red/
My guess once Tesla does file for Bankruptcy the value of used Tesla’s will approach Zero Unless it becomes something like Deloreans (Collectable)
Hi Dennis,
Thanks exactly the answer i was hoping for, and i had indeed missed that he included that in his calculation i will have to go back and look at those numbers again and see if anything can be applied to my situation.
As i said i really would like to buy a hybrid for my next car but so far i havent been able to get the numbers to add upp they are about 50% more expensive where i live and i dont drive that much so i cant make up the difference in lower operating cost im afraid.
Perhaps the best cost comparison between Tesla / Hybrid / ICE is simply to find those car models at a company offering lease plans for said models.
@Techguy
I checked the prices here in Europe if I could get a Tesla for cheap.
No chance, even a 2014 Model S with more than 200.000 km is still 60k€.
Normal Luxury cars get down much much faster in price.
Hi Eulenspiegel.
Did a search and i found alot in that price range with less milage.
https://www.wayke.se/sok/tesla
I dont really know the new price on the different tesla models or rather what those costed when they were spanking new so i cant give an estimate on depreciation of value.
Hi Dennis,
I had another look and it turns out there are two pages on the one you linked to above cash cost is not included but the page contains a link to a newer version of the article witch is updated with cash cost the 5.5% loan you mentioned.
“However, when I published the previous comparisons, I didn’t include the cost of interest if you took out an auto loan to finance the purchase. (Basically, the analysis assumed straight cash purchases and no time value of money.)”
Anyway i took a look at the new one witch also have the excel file available. Here:
https://docs.google.com/spreadsheets/d/1i8AsZR9nc_psCd7P4gHK3rBadkCEPhRg-lCJlYebx-o/edit#gid=2095047886
Could you help me out, really tired now but i cant get his interest calculation to add upp and unfortunately its only a number in the excel and not any calculation so i can see how he reached his conclusion.
I suspect your car loans might be calculated differently from how i would finance mine. Is the estimated trade in value included in interest calculation some how?
Hi Baggen,
I used the link below, put in cost of the car minus 5000 down payment, so for a 35000 car the loan is 30000 and interest rate then look at amortization schedule which gives you the total interest over 60 months.
https://www.bankrate.com/calculators/auto/auto-loan-calculator.aspx
for the 30k, 5.5% interest rate example on a 60 month auto loan the total interest paid is $4382 over 60 months.
Hope that helps.
Carlos Diaz,
I suggest that the economy may be able to transition to 100% non-fossil fuel energy over many years. You would prefer to focus on oil, in that case other fossil fuels and biofuels will be able to substitute for oil a a source of transportation fuel.
In addition, electricity is a viable solution for much of land transport, note that 100 years ago very little transportation was powered by oil. The fact that slowly growing oil production has not slowed the rate of growth of World GDP per capita suggests World GDP may not be affected as much by peak oil as you surmise. I would point to 2011 to 2014 when at the World level real GDP grew at about 3% per year, even with high oil prices (about $107/b for Brent over that period). Oil is becoming less and less important as an economic input and high oil prices have less of an effect on the World economy than was once the case.
The share of oil consumption in total primary energy used by the World has decreased from 51% in 1973 to 32% in 2017.
But you don’t know that. All energy transitions have been to non-intermittent energy sources with higher density. This transition might collapse our civilization as other previous civilizations collapsed when their base resource decreased.
Which scenario are you more comfortable with:
We try to make a switch to renewables or we wait until oil becomes so expensive that oil dependent lifestyles shut down anyway?
I am not against deployment of renewables, I just think that they will not solve our needs because they are intermittent. Your dichotomy is false as usual. The only real alternative we have right now to fossil fuels is nuclear. France took that way and has demonstrated it works. They have one of the cheapest electricity in Europe and sell electricity to all countries around.
No country has demonstrated that modern civilization can rest on wind and solar energy. For the last years the Energiewende has been going nowhere, and if the Germans can’t get it to work we won’t either.
Rosatom is building nuclear reactors all over the world without upfront payment by the countries. I guess the Western World has become tired of being on top and now wants to downgrade to Third World status by energy chocking.
Just to remind you all, our civilization hasn’t even started to switch to renewables, because FF burning speed sets new records almost every year.
I guess you will have to face the reality that modern civilization will collapse when fossil fuels aren’t affordable.
Change is coming, one way or another.
Carlos Wrote:
“I am not against deployment of renewables, I just think that they will not solve our needs because they are intermittent. Your dichotomy is false as usual. The only real alternative we have right now to fossil fuels is nuclear.”
The simple answer that the World economy will collapse, unable to sustain BAU. Nuclear, Renewables, etc will not prevent it. Its not just Oil we are having problems with, Its Demographics, Debt, Water, and other resources that are peaking.
The most likely future is a full global nuclear war as the Industrialize world marches into belligerency. All you need to do is read the news head lines: Syria, Iran, Russia, China, Venezuela. Pretty much every year the US starts a new campaign to invade, coup or destabilize a nation somewhere.
“The most likely future is a full global nuclear war as the Industrialize world marches into belligerency.”
I see it the same way.
I think countries with technology are smart enough to realize they can wage war and take over other countries without dropping bombs, which are expensive and destructive.
If you want the assets of another country, why risk destroying those assets if there are other ways to take over?
I see China, Russia, and Iran doing a pretty good job disrupting the US via hacking and propaganda. We are already at war, just via digital means rather than through bombs.
I’m not optimistic about the future strength of the US because I think politicians’ and citizens’ priorities leave the country open to manipulation, distraction, and misplaced defense spending. We will bring ourselves down.
Why drop bombs when you can sow civil unrest?
In fact, convincing people that they have to heavily invest in bombs and weaponry is a good way to drain their economy away from more productive investments. Look how big our defense budget is. Is that buying us a secure world at the moment? It’s throwing away money in many cases.
Carlos.
Keep in mind that energy transition isn’t some kind of choice.
Its a matter of when (fossil depletes).
You’ve either been proactive about it , or you’ll (the country) will scramble just to avoid severe crises mode.
Also, nuclear is an option. Certainly not the cheapest one. Certainly not one that is quick to deploy, or one that people are lining up to fund. and certainly not one that the vast majority want in their locale. But it is on the table. Bring an affordable one with modern design forward. The one closest to new design approval and deployment is the one from Oregon State Univ-
https://www.sciencemag.org/news/2019/02/smaller-safer-cheaper-one-company-aims-reinvent-nuclear-reactor-and-save-warming-planet
“Spun out of nearby Oregon State University (OSU) here in 2007, NuScale has spent more than $800 million on its design—$288 million from the Department of Energy (DOE) and the rest mainly from NuScale’s backer, the global engineering and construction firm Fluor. The design is now working its way through licensing with the Nuclear Regulatory Commission (NRC), and the company has lined up a first customer, a utility association that wants to start construction on a plant in Idaho in 2023.”
Idaho btw is far ahead of most states in its deployment of alternative electricity sources.
Nuclear is not an option. It is not scalable, it is very expensive and extremely dangerous.
Why nuclear power will never supply the world’s energy needs
https://phys.org/news/2011-05-nuclear-power-world-energy.html
https://harvardmagazine.com/2006/05/is-nuclear-power-scalabl-html
Carlos,
The future is often different from the past, in 1968 no human had ever set foot on the moon. The old adage that it has never been done before, so it never can be is often incorrect.
So yes, I do not know that it can be done and likewise you don’t know that it cannot. Both are assertions without proof.
A gradual increase in the number of plugin hybrids and EVs over time suggests that the peak oil problem can be solved.
Did you notice I said non-fossil fuel energy?
Do you understand what that implies? In my view nuclear energy is not likely to be the best choice and much of the intermittency problem can be solved with a highly interconnected grid with widely dispersed wind and solar power sources and perhaps a bit of nuclear power for backup, thought there may be cheaper alternatives such as wind gas, batteries, vehicle to grid, pumped hydro, thermal storage, and demand management. Perhaps we cannot have 24/7 industrial output and increased productivity will make that level of output unnecessary. The future will be different than the past, as has always been the case.
Hi Dennis,
Did my moon cheese analogue stimulate your opening line? Our economic understanding is similar.
Salud
I am often reminded of Yoda saying,
“Always with you it cannot be done.”
and
“Do or do not, there is no try.”
Roger,
Mark Mills is trying to fool the readers.
I quote only one of his assertions:
“Consider Tesla, the world’s best-known battery maker: $200,000 worth of Tesla batteries, which
collectively weigh over 20,000 pounds, are needed to store the energy equivalent of one barrel of oil. [49] A barrel of oil, meanwhile, weighs 300 pounds and can be stored in a $20 tank. ”
Never mind the oil barrel is a one time bounty, finite on Earth, and the batteries may be recharged thousand times.
Never mind the electric engines are 3 times more energy efficient than ICE engines. Well, he makes some error by a factor of a few thousand.
In other words, his assertion could be:
30 Tesla Model 3 cars store the same amount of energy as one metal oil barrel, but the barrel is
much, much cheaper.
Good luck to him traveling over a barrel…
Alex Wrote:
“Never mind the electric engines are 3 times more energy efficient than ICE engines. Well, he makes some error by a factor of a few thousand.”
Not really since it 63% of all US grid power orignates from fossil fuels & have the same energy losses. Electricity also as additional loses via distribution & voltage conversion. EV will always be a tiny fraction of transportation since the grid would not be able to supply wide adoptation of EVs. The Grid is most of the Industrial world as at near or at capacity. The US would need to buid a heck of lot of new power plants and invest more than a $1T USD to upgrade distribution.
The answer is very obvious: There will be no transition to EV. BAU will end forever. If you believe otherwise your just deluding yourself.
EV will always be a tiny fraction of transportation since the grid would not be able to supply wide adoptation of EVs.
Not true! Google: VTG.
The electricity consumption is smaller than you think. And many EVs will charge at night time when the general usage of the grid is low.
“The electricity consumption is smaller than you think. And many EVs will charge at night time when the general usage of the grid is low.”
most Grid operators use nights for maintenance and repair & your assessment is incorrect that EVs will *ONLY* be charged at night. The office buildings I work in, EVs and they are charging during the day. Night would also not work if your plan is to use PV for charging: No sun. Either way you just replacing Oil for NatGas & Coal as 63% of the US grid is Coal & NatGas. About 19% Nuclear, but many of the US nukes will be shutdown in the next decade. Many are already operating beyond there end of life already.
Much of the US distribution system needs a lot of investment as a lot of the power distribution infrastructure, was installed back in the 1940s & 1950s and needs to be upgraded or replaced. Rust & corrosion never sleeps. Already several metro areas such as the greater Chicago area suffer frequent blackouts do to dilapidated equipment. Even without EVs US grid & power generation will need hundreds of billions of investment to prevent it from going dark. This is also at a time when Power companies cannot find skilled labor.
FWIW: From some of people I’ve spoken with: Power companies are starting to Panic over workers retirement & unable to find replacements, as well as underfunded pensions for their retiring workers.
https://breakingenergy.com/2014/06/12/utilities-preparing-for-massive-workforce-turnover/
https://www.energycentral.com/c/um/utilities-struggle-labor-shortage
“As older workers retire, many utilities are finding it difficult to replace them, and to attract employees with the skills needed to advance a 21st century industry. According to T&D World, Airswift and Energy Jobline found in a survey of over 17,000 professionals that “48 percent of power professionals are concerned about an impending talent emergency, with 32 percent believing the crisis to have already hit the sector and 38 percent reporting that their company had been affected by skills shortages.”
One thing is for sure: More blackouts & much higher electricity costs for consumers & businesses.
Where did I use the word ONLY?
There is also something called battery that works well with PV and wind turbines (which often may generate electricity even at night time). A Nissan Leaf may be charged at 3.3 kW. Which is pretty close to eg. a kitchen baking oven. IE. It is possible to charge a lot of EVs without increasing the grid capacity substantially.
I think you are right that the grid will need upgrading in many places, but probably it needs upgrading regardless of the EVs. And it seems possible to regulate the grid in order to optimise the capacity.
Tom Asked:
“Where did I use the word ONLY?”
You indirectly implied it, leading to the conclusion that EV would charge at night and thus not impact the grid.
Tom Wrote:
“There is also something called battery that works well with PV and wind turbines (which often may generate electricity even at night time). ”
That requires *Investment* in Grid infrastructure! You cannot argue against my statements, by turning around and agreeing with them in your rebuttal.
Tom Wrote:
“it seems possible to regulate the grid in order to optimise the capacity.”
If you referring to Gov’t regulation, not a chance. Gov’t regulation is only good at regulating project cost overruns & delays.
If you referring to regulating power usage, It going to require a lot of $$$ investment to make it happen. But without $$$ (The est is dead broke) and a skilled labor force (retiring boomers & no one to replace them) its not going to happen.
I think and hope you are capable of understanding the difference between ‘many’ and ‘only’.
As an example, in Norway about half of the EVs are typically
charged at nighttime. I would claim that’s many. And with V2G, cheaper electricity at nighttime than day time, hence an economical incentive to charge at night time + simple tools such as apps will likely increase the ratio of night time charging, as long as practicable possible. A very simple and cheap way of regulating the grid is V2G. The technology already exists. Another could be an app. Say the car is set to charging in the afternoon. At this time the electricity is expensive. So the app postpones the charging until night time. As simple as that. A good old timer might also work.
“EV will always be a tiny fraction of transportation since the grid would not be able to supply wide adoptation of EVs.”
OMG. A nick like “TechGuy” and such technical nonsense.
Way to go Ulenspiegel!
Prove me wrong instead of of your lame attempt at an insult. The reason is because you can’t!
Roger,
Another Mark Mills quotation:
“In practical terms, this means that spending $1 million on utility-scale wind turbines, or solar panels will each, over 30 years of operation, produce about 50 million kilowatt-hours (kWh)—while an equivalent $1 million spent on a shale rig produces enough natural gas over 30 years to generate over 300 million kWh.”
While he is keen to recognize that that renewable energy is already cheap, less than 0.03$/kwh , including interest over 30 years, he asserts that shale gas operators produce natural gas at about 1$/MMBTU ( 1MMBTU = 293 kwh ), if we suppose 100% energetical efficiency. ( It may happen on warming homes in winter, but not on electric energy production. ) Or he may think that shale gas is produced at only 0.5$/MMBTU , for electric utilities.
If shale natural gas is so cheap to produce, than why Chesapeake Energy Corporation could hardly break even over the years on a price much higher?
Its just more misinformation from the nice folk who benefit the most from “The Old Black Energy Economy”, which at the end of the day is the real Exercise in Magical Thinking! Case in point:
https://cleantechnica.com/2018/08/26/100-renewables-requires-less-land-footprint-than-reliance-on-fossil-fuels-in-california-realitycheck/
100% Renewables Requires Less Land Footprint Than Reliance On Fossil Fuels In California — #RealityCheck
Baker Hughes U.S. Rig Count
Oil: down -3 to 802
Natural Gas: up +2 at 185
Table https://pbs.twimg.com/media/D6ybkoHXoAExZJi.png
Baker Hughes Charts
Hz oil rigs: https://pbs.twimg.com/media/D6yNBBrWkAUFGul.jpg
Hz gas rigs: https://pbs.twimg.com/media/D6yNBULWsAAqU2Q.jpg
A 25-minute video explains exactly why 2018 was the year world oil production peaked.
Have We Already Passed World Peak Oil And World Peak Coal?
Published February 27, 2019.
EDIT: I do hope that a few people take the time to watch this video and comment on. I would be very interested in your comments.
Please watch and comment!
Gas prices have 44% of Canadians struggling to afford basics, survey finds
The Angus Reid Institute polled a random sample of nearly 2,000 people over four days in early May. The findings suggest pain at the pumps has made it harder for 44 per cent of Canadians to afford household basics.
If the above survey is an indication, a sizable minority of Canadians are affected by current oil prices. And we’re nowhere close to $100/barrel. This would support what’s said in Gail’s video.
Ok Ron, here are my two cents for free. I could only listen to about 10 minutes of this conservative right wing Republican economic nonsense. It’s the same BS Tverberg has been preaching since 2011 predicting financial collapse within 18 to 24 months back than. She was just spreading fear back then too, used for political support to booster anti-union, deregulation and tax cuts. Which is the reason of the growing financial divide between the have’s and have not’s since RayGun.
In the oil industry now, it takes years of capital investment to move the continued increase production needle. After the turn of the century, oil producers wanted and needed to see a new fundamental higher price increase to make the more expensive investment needed. We saw a build up of price up until the financial collapse of 2008. By 2010 the price increases had returned until late 2014. When capital investment changed the supply side to something we have today. Supply, demand and pricing effects take years to work themselves though the system and balance in the oil industry.
Currently I believe the world market pricing is close to being in balance with the cost of production. There will always be exceptions with bankruptcies and fortunes in capitalism.
The free market works, you can take that to the bank. Just not everyone has the stomach for it.
Salud
I could only listen to about 10 minutes of this conservative right wing Republican economic nonsense.
I am a hardcore, left-wing Democrat. I found nothing in the video that suggested it had anything to do with right-wing Republicanism. I do wish you had watched the entire 25 minutes before commenting.
If you tell me the last 15 minutes is something new from Tverberg, I will force myself. But for the last 5 years, she has been rerunning her greatest hits of ignorance. She started writing her fear posts of collapse shortly after Obama became president which help feed the Tea Party movement.
I have sat in to many economic classes to start believing in the collapse of oil prices because of a resource limitation. Republicans don’t want their flock to understand economics. They like to sell greed, every man for themselves, no free loaders and I deserve more because I’m better than you to promote their for the riches policies.
I know your a left-winger and I’m most likely more hardcore than you. I also think there are more resource still out there today than you. I disagreed with you back in 2015 and your peak prediction. But I can agree to disagree.
Are you going to make it to the west coast ?
Some of the images that I am seeing do not seem to match the descriptions of some of the figures between Fig 1 and Fig 14 ?? —–
By the end of the program I was somewhat reminded of The Next Million Years by Charles Galton Darwin
I found it easier to follow Fig1 to Fig 14 here. Have not had time to read the 1,593 comments. https://ourfiniteworld.com/2019/02/22/have-we-already-passed-world-peak-oil-and-world-peak-coal/
Just block his comments. pointless getting information from dedicated misinformation specialists.
Gail is a wingpawn—-
And I converse with her regularly, but she has been a bit standoff lately.
A very tight, christian centric (she is also a Cabbage For Christ) view.
But more knowledgable than me in a lot of areas.
Yes, I occasionally catch you in the comment section, Duncan, if that’s you.
I do seem to recall Gail writing that, to paraphrase, her theory, opinions and/or whatever else are informed by those commenting on her blog. If so, that seems pretty good compared with, for example, those who might ‘double down’ on their own ignorance in the face of alternative info that challenges it.
BTW, what, in your own words, is a wingpawn and Cabbage For Christ and specifically WRT Gail, and how do you think she would respond to that (or has she already)? For one, would she agree?
Ron,
Strange things happen with affordability. Someone around the world just bought a new car last year for 20000$ ( a typical case, one in 80000000 or so…) but cannot afford to pay an incremental 200$/year to use it, if the oil price goes up by 30$/bbl. No matter how much differential equations are used in the affordability theory, my gut feeling says it’s wrong.
Ron,
As I understand, they say something of danger of a sudden world financial crisis, as result of dwindling FF resources on Earth and increased energy price as a consequence. But there is not sufficient attention paid to renewable energy ( wind + solar PV), about PV energy being already competitive with coal for electricity production in any sunny place in the world, about renewable energy use doubling in quantity in the world for every 2-3 years, about land EV use trending to replace ICE vehicles, possible in a matter of years from now. They only dismiss such new trends as irrelevant.
The competition from renewable energy is likely to put a cap on FF energy prices. There is not only doom and gloom, there are also some bright spots.
Unfortunately the video is painful to watch. Gail Tverberg reached around 2012 the same conclusions David Hagen had reached quite a few years earlier in TOD when he proposed his accordion hypothesis. Given the big delay in the oil industry between capital investment (starting with exploration) and production, the industry runs through periods of boom and bust. Oil price oscillates between being high enough to stimulate production and low enough to stimulate consumption. The result is an increase in oil production while oil price spikes due to the mismatches trigger recessions. But as oil increasingly depends on unconventional costlier sources the price required by producers becomes higher, and as the result is a worse performing economy with higher debt levels, the price required by consumers becomes lower. The result is that the price range acceptable to both narrows and eventually reaches a point when no price can satisfy both simultaneously. From that point Peak Oil has been reached because the price point required to stimulate production of unconventional oil destroys demand and the price required to grow the economy destroys production. From then on the accordion works to reduce oil production regardless of the amount of oil in reserves. The economy can’t afford to produce it.
The inflection point, when oil production abandoned the old model, took place in late 2015, when the increase in oil production to compensate for lost revenue due to the price collapse of 2014 became unsustainable. Since then oil production has grown at a sluggish 0.8% yearly, and we are yet to be hit by the delayed effect of the loss of capital investment.
We are establishing a top in oil production since late 2015. From then on the accordion has been destroying future oil production. Gail is on the peak-oil-demand camp that foresees low prices. I am with David Hagen. The accordion will continue, so there will still be boom and busts in oil prices, only the net effect from now on of these cycles will be to reduce oil production through production destruction and demand destruction.
“Peak Oil has been reached because the price point required to stimulate production of unconventional oil destroys demand and the price required to grow the economy destroys production.”
Seems like a brilliantly-stated synopsis. To me, anyway.
Okay, Gail is a dunce. She predicted peak oil in the past and it did not happen. So from that, it logically follows that once wrong, always wrong. Peak oil will never happen. And even if it does, no one will notice because renewables will have pushed demand down to almost nothing.
Well, at least that’s the gist I get from all the comments.
I expected arguments for or against the thrust of the argument given. Instead, I got, mostly anyway, arguments against the man making the argument. Well, in this case, it was an argument against the woman making the argument.
Her particular take does not diminish the overall threat of Peak Oil. She’s just hard to follow.
Ron
That video is rather heavy going and why is it narrated by a machine. Anyway my take away point is that it matters not if peak oil is due to geological or economic factors the outcome for society is the same.
We all know that not every drop of oil that could be produced will be produced, arguing about the reasons why is all a bit academic considering the likely consequences.
I have no problem with Gail Tverberg. Nobody gets it completely right and nobody gets it completely wrong, including me. We are talking about the future and it is unknowable. Gail has a point of view from her actuary experience, so she understands risks. Even if she is wrong on many of the things she anticipates (and she is honest enough to recognize that possibility) I believe she is right in sounding the alarm bell as humanity is at a point in history when it runs a serious risk of global civilization collapse with a suffering at a scale we can’t even imagine. Quite simply the way things have worked for the past centuries will not continue to work for the next generation and we are not even acknowledging the problems we face. I agree with Gail that the most serious problem is the energy problem. We are running out of affordable oil and lack an adequate substitute. Transition to inadequate substitutes will most likely cause a painful collapse.
I agree with Gail that the most serious problem is the energy problem. We are running out of affordable oil and lack an adequate substitute. Transition to inadequate substitutes will most likely cause a painful collapse.
Nope! It’s a lot more basic than that. The most serious problem is collapsing global ecosystems! No viable ecosystems, no viable economy of any sort! Doesn’t matter if energy is coming from oil or wind and solar or whatever. No ecosystems, no 8 billion plus humans and no global industrial civilization. What part of this do people not get?!
Perhaps people just don’t know what is happening…
That comment isn’t oil related, so best for the other thread. A lot of the damage to ecosystems is coming from population increase and primary production appropriation by humans. And quite a lot from unsustainable consumption and carelessness that results in pollution. While a very serious problem, it is being dealt better by developed nations that have more resources to dedicate to environmental protection and the will to enforce it.
Our civilization is not immediately threatened by ecological mischief, and further development could actually improve the situation. It is however immediately threatened by an energy crunch. Our societies would loosen from the economic consequences as it is happening in Venezuela, leading to state failures and the impossibility of rebuilding, initiating a protracted collapse like that of the Roman Empire. The Energy crunch is likely to be initiated by Peak Oil.
If you think the ecological problem is bad, just wait until people have nothing to eat because of a civilization collapse. People will come out of the cities and spread into the countryside eating even the birds from the trees.
Javier, I highly doubt that civilization is going to collapse literally overnight where people are desperately eating up as much of, with little effort in replacing, what they deem as edible of their local environments. But the sooner this kind of civilization does go away and the sooner we can learn to take back, from the crony-capitalist plutarchy– ‘civilization’ if you will– our self-empowerment in such forms as knowledge of what’s edible and how to grow it, the better for the planet and its lifeforms, including us.
In slow motion, crash-test dummies are not immediately threatened by their car’s immediate impact either. It takes awhile to hit the insides of the car.
Incidentally, are you the same one who, on this site, had been denying the severity of the impacts of climate change?
Things take time. The Roman Empire didn’t fall in a year. It took centuries of decline with interludes of partial recovery. The main problem this time is to feed such a large population when globalization unravels. Food prices will go up big time and there are some pretty large countries were food production is several times lower than what their population requires.
Being skeptical of the New Religion gets you the same frowning as being Skeptical of the Old Religion a century ago. Then people think there has been progress and they are a lot more tolerant of dissent.
“Incidentally, are you the same one who, on this site, had been denying the severity of the impacts of climate change?”
Likely. This Javier’s KIA style is similar.
“Incidentally, are you the same one who, on this site, had been denying the severity of the impacts of climate change?” ~ CMac
Yes he is. And a long history of failed predictions too.
https://andthentheresphysics.wordpress.com/2018/12/19/there-was-no-pause-in-global-warming/
I have no problem with concluding that 2018 will be over 2019 production. Let’s leave it at that, as I refuse to look at another presentation by Gail. Especially, (gasp!) 25 minutes!
What gets me, is this implicit expectation that some semblance of a neo classical, growth based, global economic paradigm has even a snowball’s chance in hell, of continuing. I believe peak oil is just one factor out of many, that is already playing a role in undermining the current economic, political and social paradigms. So called ‘Elite Jobs’ are just as much threatened as those of the non elites, even without peak oil. The robotic narration of Gail’s presentation only served to underscored my perception…
https://www.youtube.com/watch?v=lzbAOE4qfDw
Yuval Noah Harari & Chancellor Sebastian Kurz in Conversation
The Chinese curse: “May you live in interesting times” seems to apply in spades!
Hi Ron,
Do you use the centered 12 month average to assess the peak? In the past you have used the trailing 12 month average, and currently Jan 2019 is the peak for the trailing 12 month average, for the centered average it is August 2018, maybe you are using that or judging on monthly peak output, not clear how you define peak oil output.
Dennis, there are three ways to look at the peak. There is the monthly peak, then there is the 12-month trailing average peak and there is the average calendar year peak.
The monthly peak will likely be November 2018. The calendar year peak will likely be 2018 and the trailing 12-month average peak will likely be January 2019. I use the calendar year peak. That will be, in my humble opinion, 2018.
I don’t use a centered average at all because you cannot center 12 months, it’s an even number.
Anyway, take your pick:
Nov. 2018…..84,557
Avg. 2018…..82,880
12 Mth Ave.
Jan. 2019…..82,894
Hi Ron,
Typically with a 12 month centered average one uses either month 6 or month 7 for the “center”, or one could simply call it month 6.5 (end of month 6 or the beginning of month 7). Centered average makes more sense than just using calendar year, at least to me.
The argument that $70/b oil is making oil too expensive for consumers, I don’t buy that at all. The World economy has been growing nicely, Gail’s analysis is not very convincing.
How about running up some charts to compare?
NAOM
NAOM,
You would need to be more specific.
Take the oil production figures you and Ron have been talking about and plot them with trailing and 6, 6.5, 7 centered averages to see which makes more sense. The eyeball should make things clearer that just discussing it.
NAOM
I can eyeball it just fine with the 12 month average at the date of the last month’s data, just as I have been doing for years.
To change from centered to trailing average simply shifts the curve about 6 months to the left. So if the trailing 12 month average peak was Jan 2019, the centered 12 month average would be between July and August of 2018 (say July 31 or Aug 1).
Yeah, I was thinking about that last night, thanks.
NAOM
Okay, the 12 month centered average would be July 2018 at 82,894,000 barrels per day.
No, I don’t buy Gail’s explanation either but I do buy her dates. Gasoline demand is just not that flexible. Consumption does drop off with higher prices but only slightly. I have November 2018 as the peak for entirely different reasons.
FYI. OPEC April oil production was 2,327,000 barrels per day below their October 2018 level and 3,380,000 barrels per day below their October 2016 level.
Hi Ron,
World demand for C+C adjusts to available supply, see 1979 to 1982 and the plateau in output from 2005 to 2010. I believe that consumption of C+C cannot be higher than the C+C that is produced in the long run. In the short run prices rise and storage is depleted, but this can only continue until storage tanks are empty. When that occurs we find there is more flexibility than was realized. People car pool, use more public transport, long haul freight moves to rail, people buy more efficient ICEV, hybrid vehicles, plugin hybrids and EVs. This all takes time, but high oil prices accelerates the process. I agree that there will not be big increases in output like we saw in 2018 (about 1.7 Mb).
My low URR shock model (2800 Gb) had output increasing at an average annual rate 540 kb/d over the next 5 years with a peak in 2023 at 85.3 Mb/d (calendar year average, as the model is done on a yearly basis.) Most of this increase will be due to US tight oil output increase, there is also likely to be some modest growth in Canadian oil output over the next 5 years. US tight oil output will grow by 2 Mb/d over the next 5 years on average, the rest will come from Canada and perhaps a bit from Brazil. OPEC plus Russia as a group I expect will have relatively flat output, adjusting their output to attempt keep the World market in balance to reduce oil price volatility.
Ron,
Let me take a crack at explaining Gail’s point of view which is not far from
my own. Gail can be too concrete while my sin is usually being too
abstract.
The main point is the following: if oil is a key element in the economy, then
a scarcity of oil is not necessarily a reason for high oil prices. The
reason is simple: a scarcity of an essential item causes the economy to contract which can
in turn reduce prices. Many investors believe that peak oil is an
investment opportunity. They believe that a scarcity of oil will cause
prices to rise because “it has to”. Otherwise there won’t be enough oil.
But there are two ways that oil can become unaffordable. The price can
rise, or salaries can fall. In the latter case, the difference between the
elite class and the “productive” (those who work for a living) increases.
If oil production falls faster than prices rise, oil companies invest less
and you get a negative feedback cycle. This is what I believe is currently
happening in Venezuela.
Negative feedback cycles are known to economists. This is what many believe
happened in the U.S. during the depression of the 1930s. My mother (who was
born in 1922) said that during the recession things were available, but no
one had any money. Prices kept falling leading to declining production that
led to declining employment leading to declining production etc. Economists
believe that they can transform negative feedback cycles into positive
feedback cycles with monetary policy tweaks. But it could be that peak oil is the
date at which monetary policy tweaks cease to work, turning the positive feedback
cycle of increased oil production into a negative feedback cycle of
decreased oil production along with the oil based economy.
It currently seems that oil producers are caught between a stone and a hard
place: either production falls or they go into debt. Someone on this blog
(I wish I had recorded the name) said: “Oil companies used to turn oil into
money, today they are turning money into oil.” So peak oil may be
characterized by lower profits for oil companies and lower salaries for the
working class. In this case oil production will not be a symmetrical curve.
The decline will be steeper than the increase.
“But it could be that peak oil is the date at which monetary policy tweaks cease to work”
July 20, 1969 could have been the date humans found out the moon was made of cheese
“Bizarro World is a fictional planet appearing in American comic books”
Schinzy,
Neither Gail nor David Hagen was the first to formulate the hypothesis of how the oil age will end by cycles of supply-demand destruction. I know I read it in one book from the early 80´s.
“peak oil is the date at which monetary policy tweaks cease to work” – care to give your view on the timing? do you see this as a distant phenomenon?
See my reply to Ron below.
Thanks Schinzy. However, I was far more interested in Gail’s timing rather than her explanation. I agree with the timing but not the method. No, oil production will not fall because people can no longer afford oil. Or at least not in the early stages of the post-peak era.
Of course, that could happen if we have an economic collapse. But that collapse will not happen because of peak oil. Well, not right away anyway. A collapse could happen because we have an idiot in the White House whose blunders drive the economy into the ground.
But barring that, there’s just no way a scarcity of oil will have such an effect on the economy, and definitely not that quick. I see higher prices for oil because of a declining supply of oil.
Of course, as you explained, it is a very complicated matter. It will not be just “oil production drops, therefore, prices rise.” Oil production is already falling because of the higher price of producing oil. Oil companies are getting less return for their investment dollar so they are investing less and therefore finding less oil. That, in itself, is a sign we are either at or very near, peak oil.
We are finding very little new oil. The lions share of oil is still coming from old fields which have been infill drilled with horizontal wells, sucking the cream right off the top of those old giant and supergiant fields. For this reason, I expect the decline to be much faster than the ascent.
Hi Ron,
If Jean Laherrere’s estimate of 2800 Gb for the World URR of C+C is correct. Then a shock model scenario with slightly increasing extraction rates would lead to a peak around 2023. The increase in rate of C+C output was about 1.2% per year from 1982 to 2018 and the decline in C+C output is 1.9% per year on average from 2025 to 2040. If we assume Mr. Laherrere’s estimate for World URR is correct then the decline will be slightly steeper than the increase for 1982 to 2018.
If Jean Laherrere’s estimate of 2800 Gb for the World URR of C+C is correct….
Dennis, just how much of this oil is still left in the ground? And what countries are the fortunate benefactors of all this recoverable oil left in the ground?
Ron,
As of the end of 2018 about 1366 Gb of cumulative C+C had been produced leaving 1434 Gb of recoverable resources if the 2800 Gb estimate is exactly correct, I believe Mr. Laherrere would suggest the 2800 Gb estimate is highly uncertain, perhaps 2600 to 3000 Gb for an 80% confidence interval, so there would be between 1200 and 1600 Gb of recoverable resources with a best estimate of 1400 Gb (the 1434 Gb is too precise to be realistic).
Our output estimates are imprecise, I should have used 1400 Gb of cumulative production (+/-50 Gb), not 1366 Gb, or perhaps 1370 Gb.
As of the end of 2018 about 1366 Gb of cumulative C+C had been produced leaving 1434 Gb of recoverable resources if the 2800 Gb estimate is exactly correct,
Well now, that pretty much agrees with what OPEC says is left in the ground.
OPEC’s estimate of world oil reserves, 2017 in Gb
OPEC ………. 1,214
Non-OPEC .. 269
Total ……….. 1,483
And that was at the end of 2017. So if we subtract the sum 45 billion barrels produced since the end of 2017 that would put the two figures at almost exactly the same point.
Oh hell, I forgot, OPEC proven reserves never decline. So OPEC numbers are likely still about 50 billion barrels higher than your numbers.
Hi Ron,
See
https://aspofrance.org/2018/10/03/updated-extrapolation-of-oil-past-production-to-forecast-future-production/
see page 18, URR=2600 Gb or 3000 Gb for World C+C less XH oil, Mr Laherrere’s estimate for extra heavy oil is 200 Gb (100 from Canada and 100 from Venezuela). I use the lower of these two estimates at 2800 Gb for World C+C. So this is based on Mr. Laherrere’s Oct 2018 estimate.
Dennis, I was really hoping for some idea, of yours, as to where this oil is. Okay, Jean does not tell us. He just says how much there is. Okay, I get that, but just where the fuck is it? Just how much of it is OPEC oil and how much of it is Non-OPEC oil?
You must see the problem here Dennis. You, along with Robert Rapier, has been defending those gargantuan Saudi reserves. But those Saudi reserves are no more gargantuan than the rest of those OPEC Middle East reserves. But those reserves are absolutely necessary if your estimate of remaining reserves are anywhere close to being correct.
I know, I know, you keep saying those are these resever estimates of Jean Laheerere. Okay, but that is just an appeal to authority. I respect Jean’s opinion but here I must reject his opinion in this case. Unless he, or you, can tell me just where this oil is located, I just flatly don’t believe it.
Dennis, this is not asking too much. If all this oil exist, just where the hell is it?
My post above that listed the OPEC URL on OPEC reserves was tongue in cheek. But it was to drive home the point that those claimed OPEC reserves are totally absurd. I mean really down in the dirt absurd. They have all the reserves and Non-OPEC nations have almost nothing. Yet they only produce about thirty something percent of the oil. Damn! Damn Dennis, do you really believe that shit. Dennis, wake up an smell the coffee. There is something really rotten with this scenario.
Hi Ron,
Look at the Laherrere paper that I linked above. He gives his estimates for 35 nations on page 134 of the paper. Total URR for those 35 nations is about 2200 Gb for C+C excluding extra heavy(XH) oil and 2400 including XH oil from Canada and Venezuela (200 Gb combined). The other 400 Gb may be expected from new discoveries or from nations besides the 35 included in the study. His estimate for OPEC URR is 1200 Gb, including 100 Gb from Orinoco. For non-OPEC URR (21 nations) the estimate is also 1200 Gb and 1100 Gb excluding extra heavy oil.
Remaining reserves at the end of 2017 were about 500 Gb for the 21 non-OPEC nations in the study and about 700 Gb for OPEC. About 100 Gb of World cumulative production was from nations outside of the 35 nations included in this study. If we assume there are 100 Gb of remaining reserves in those nations, that would add 200 Gb of URR to the 35 nations covered by this study, bringing the total to 2600 Gb and 1300 Gb remaining 2P reserves, the other 200 Gb are resources “discovered” after 2017, this includes reserves that are currently possible reserves or contingent resources that are known to exist but are currently not profitable to produce at the current level of oil prices. So the 2800 Gb estimate by Mr. Laherrere is very reasonable, and some might suggest, a very conservative estimate.
Dennis, I clicked the English document in your link and got several PDFs. Which one is the one you are talking about? However….
Remaining reserves at the end of 2017 were about 500 Gb for the 21 non-OPEC nations in the study and about 700 Gb for OPEC.
This gives
OPEC 58.33% of remaining reserves.
Non-OPEC 41.67% of remaining reserves.
In the long run, every nation produces oil in direct relation to the oil they have to produce. OPEC produces about 40% of the oil and Non-OPEC nations produce about 60% of the oil. Therefore the above percentages are the exact opposite of what they should be. Notwithstanding they are both very overly optimistic.
Regardless of URR or what remaining reserves are estimated by whatever method of guessing we use, current production trends suggest the supply is getting thin.
Hi Ron,
Sorry, try the following
https://aspofrance.org/2018/10/03/updated-extrapolation-of-oil-past-production-to-forecast-future-production/
see Table 1 on page 134 as well as
charts on page 18 which show Mr. Laherrere’s estimates for World C+C less extra heavy oil URR of 2600 Gb and 3000 Gb. His detailed estimates for the 35 nations in his paper would require reading the entire 134 pages, but the table at the end gives a nice summary. His estimate for extra heavy (XH) oil in this paper is 215 Gb (115 Gb for Canadian oil sands and 100 Gb for Orinoco Belt oil). The 2800 Gb estimate I cite is based on the lower 2600 Gb World C+C less XH URR estimate plus 200 Gb for the XH URR estimate.
Ron,
The chart below looks at the natural log of World C+C output from 1920 to 2140 in order to look at big picture rates of increase and then rates of decrease in World C+C output using an assumed URR of 2800 Gb.
From 1920 to 1980 the average annual rate of increase in C+C output was about 6.5% per year, from 1981 to 2050 the average rate of increase was 0.07% per year, essentially a plateau in output between 48 and 84 Mb/d with an average annual output of 68 Mb/d over that 70 year period. The average annual decline rate from 2050 to 2140 is about 3% per year for this model and the peak occurs in 2022 at a cumulative C+C output of 1490 Gb, about 53% of URR. If the peak were to occur at 50% of URR, we would see a 2019 peak in oil output. Such a peak can be forced by reducing extraction rates after 2018, that would reverse the trend of the past 8 years where extraction rates from conventional producing reserves has been gradually increasing. Difficult to predict future extraction rates, I have assumed extraction rates remain at 2018 levels after 2018 and that assumption could be incorrect.
With respect to dates, my gut feeling is that you and Gail are correct in picking the dates. I felt you were correct when you picked 2015 as the peak. But Dennis is the voice of reason, calmly averaging estimates, fitting all the estimates to models to see what happens. I read his assessments carefully and with great respect.
I believe oil production is an economic phenomenon. I think the reason that 2015 was not peak was investors behavior. I thought lower prices would reduce the flow of investment dollars into oil production. They did not. In 2018 close to 30% of all investment went into oil production, and 50% of that investment went into LTO production. I hadn’t anticipated such behavior. What I suspect is that investment in longterm projects is being neglected and short term LTO and infill drilling prioritized which will lead to fast decline in the 2020s.
I explain all things political and economic with peak oil. That is, I think that Trump is a product of peak oil. People see that the economy is no longer working the way it did, they see corruption in the system, so they vote for outsiders. This is visible in many countries. Political divisions are a product of peak oil. Trump is incompetent, but he is the world leader doing the most to reduce greenhouse gas emissions. His sanctions are decreasing the probability of producing all the oil in Venezuela, he might deprive the world of a great deal of Iranian crude as well. If he lets Bolton convince him to go to war with Iran who knows what will happen.
but he is the world leader doing the most to reduce greenhouse gas emissions
Really now?
I understand his reasoning. By Trump being the bull in the china shop, he is destroying the norms of economics and shutting down the oil trade in certain channels such as Iran and Venezuela.
However, this will incentivize USA to extract and export more and thus we will fall further behind in alternative energy technology and find ourselves in a real hurt in a few years when the shale oil ends its Red Queen run.
Yep, same goes for shale gas crushing the renewable energy advance along with adding to the GHG load.
https://www.youtube.com/watch?v=PGfIjCG-zB4&t=569s
Schinzy,
I think Obama’s failure to act decisively in Syria led to the refugee crisis in Europe and that is the source of the political disruption in Europe. The lack of action is understandable because there was not political support in either the US or Europe for any action due in part to war fatigue from war in Iraq and Afganistan.
In my view using peak oil as the essential starting point for all social analysis is a mistake, just as using class for the lens with which to bring into focus political and economic movements is also too narrow a focus.
Things are never that simple. There are multiple forces at work and the complex interaction of all these social forces is always far from clear.
My own analysis suffers from the same shortcomings (different focus, but the limited framework is the main shortcoming). The different perspectives offered here from a myriad set of viewpoints, might allow a clearer view to emerge.
Schinzy- “I think Obama’s failure to act decisively in Syria led to the refugee crisis in Europe and that is the source of the political disruption in Europe.”
I can’t say that I see things this way, at all.
Lets remember that the world doesn’t revolve only around the USA anymore.
To think that an american president could have prevented the chaos in Syria ‘through acting decisively’ is a form of tunnel vision on this. And, the chaos there could have gone in 20 different directions if the USA had more gotten involved.
Things happen in the world despite what USA does or doesn’t do these days.
I completely agree with your statement- “Things are never that simple. There are multiple forces at work and the complex interaction of all these social forces is always far from clear.”
Apply that thinking to your first paragraph.
Hickory,
Of course, both action and in action can have a variety of effects. The point is that inaction is not always the best policy.
One could apply that sort of thinking to climate change, we should not act because it would make things worse than acting.
One could argue that it is not ever in the interest of the US to involve itself in any military conflicts outside its borders. Generally I would agree with that, but I can think of cases where history suggests that would not have been good policy (World War 2 if there had been no Japanese attack comes to mind), there are many other instances where the reverse is true (Vietnam and Iraq are obvious examples).
I do agree there are undoubtedly many factors which I am not accounting for and I am not a foreign policy expert.
Perhaps those from Europe have a better perspective on this because the problems in Syria have mostly affected Europe. The rise of the right in Europe may be less of a problem than it seems from afar and perhaps refugees (they are from both Africa and the middle east) have little to do with it.
I’m guessing Russia was behind the civil unrest in Syria. Creating the “refugee crisis in Europe” and sewing the seeds or fertilizing of political disruption divisions in Europe.
Or maybe it was the USA.
Or maybe a 400 pound guy in his mothers basement, I agree.
The current instability in places like Iraq and Syria, if it to be laid at the foot of USA policy, is due almost entirely to the Cheney/bush escapade. Unintended consequences of that job are going to slosh around for a long time.
Obama did his best to keep our feet from getting stuck in the mud worse. I think he did a pretty good job of that. To expect any president to step in and ‘fix’ that mess would just be wishful thinking.
The CIA was in Iran back in 1952
The importance of oil reserves became clear during WWII
Well, good point.
And before that the Brits… and of course lets not forget the cruelest before that- was it the Ottomans or the Romans?
Dennis Wrote: “I think Obama’s failure to act decisively in Syria led to the refugee crisis in Europe and that is the source of the political disruption in Europe.”
Syria was a Proxy war started by the US. Libya was toppled so that ISIS Militants could be armed with Libyan arms, to over throw Assad. But like the Romans discovered about 2000 years ago. Middle East Militants usually have their own Agenda, and they turned on the US to set up their Calphate.
The Middle east Policy has been consistent since 2001 when the US has been in the process of toppling one ME nation after another, for the purpose of securing Oil exports. Same policy under GWB, Obama & Trump. The man in the house may change but not Geopolitics.
Seems likely regarding to Foriegn Policy, Presidents have no influence or control. I recall both Candidate Obama & Trump that the US needs to leave the Middle East, but when they took office, they completely switched to a Pro-War agenda.
Dennis,
Syria never invited the US to Syria. What was the US doing there in the first place? One result of US’ presence was a prolonged civil war with more killed civilans and more refugees. US soldiers are now occupying a substiantal part of Syria. Why? The IS is already defeated. US’ presence in Syria is a violation of international humanitarian law.
Political divisions are a product of peak oil. Trump is incompetent, but he is the world leader doing the most to reduce greenhouse gas emissions. His sanctions are decreasing the probability of producing all the oil in Venezuela, he might deprive the world of a great deal of Iranian crude as well. If he lets Bolton convince him to go to war with Iran who knows what will happen.
Yep, I think you have a point! He might actually put a big enough dent in Chinese global economic growth to significantly reduce their CO2 emissions. Now if only he’d declare a trade war on Australia and destroy the coal mine economy there as well, he’d be in line for a Nobel Prize for single handedly ending the threat of Climate Change!… Though the entire GOP would turn against him for ending their fossil fuel powered gravy train and they would definitely have him impeached and safely locked up for good. Win! Win! 😉
Sadly, if the Great Recession is a indicator, a new economic recession that would be created would only drop GHG output by a few percent globally and only for a short time.
http://time.com/3966553/recession-emissions-decline/
Of course there is a line of logic that leads to the fracking phenomenon and increased GHG instead of increased renewables due to the Great Recession.
Schinzy,
I also expected output would fall when oil prices fell in 2015, but my expectation was that any fall in output would eventually remove the glut of oil on the market and eventually prices would rise as storage levels of petroleum plus products began to fall. It is possible 2018 will be the peak, if extraction rates from conventional (excludes extra heavy and tight oil output) producing reserves fall below the 2018 extraction rate and this continues for 4 years or so before extraction rates stabilize at some lower level. Such a scenario is shown below, there is a rough plateau from 2018 to 2025 with steeper decline after 2025. The average decline rate from 2025 to 2100 is about 2.66% per year and the average annual rate of increase in C+C output from 1950 to 2018 is 2.7% per year, so roughly equivalent rate of increase and rate of decline over the 1950 to 2100 period. Such a scenario is indeed possible, though I would say the odds are less than 1 in 10 that 2018 will be the peak in World C+C output, I still like 2024 with a roughly 50/50 chance the peak will be before or after June 30, 2024(midyear).
Thanks Dennis, quite interesting.
Ron Wrote: “No, oil production will not fall because people can no longer afford oil. Or at least not in the early stages of the post-peak era.”
Oil demand via demand destruction could occur for periods if there is a hard global recession again. I recall back in Early 2009, Oil prices collapsed and Investments were leasing oil tankers to store Oil since demand had taken a dive.
My thought is the global economy destabilizes it can create a whipsaw effect like it did in 2008-2011 when prices & demand swung rapidly several times. My guess is wild price swings can impact Oil development projects as Oil companies delay or cancel projects that take years to complete.
I believe several major Oil projects (Deep Water & Arctic) that were cancelled between 2013 & 2016 never were restarted.
I am concerned that the low cost oil production may start to see declines around 7% (ie KSA\Middle East, Deep Water) having used every method possible to delay production but resulting in a steeper production decline in the future.
Question: How will a world cope with 7% annual production declines? I would guess industries that depend on abundant Oil may collapse: Airtravel for the masses comes to mind. I would also say war is a possibility, but that already started in 2001\2003 when the US started targeting Oil Exporters.
Techguy,
If Jean Laherrere’s Oct 2018 Oil Forecast for 35 nations is correct (URR=2800 Gb for the World), then decline after 2040 will be about 3% per year, from 2024 to 2040 the decline rate will gradually increase from zero to 2.5% per year and then stabilize around 2060 at about 3% decrease in World C+C output each year. The world will adjust by using oil more efficiently and switching to other types of energy gradually as oil prices rise.
Hi Dennis,
Short Summary: Too focused on short term instead of the long term needed to sustain shallow declines
I believe its more complicated than that. Presuming Jean’ assessment correct, it likely include deep water, arctic and other very expensive locations. I believe since about 2013, Oil companies have largely focused on the easy oil that does not have long term investment before a single drop of oil is produced. I suspect that this easy oil will have about 7% decline rate as Oil companies use every available means to maintain production over the past decade or so. I also suspect that even maintaining a 7% will become increasing more expensive.
The issue I see is that Oil companies are reluctant it invest hundreds of billions in Deep water & arctic projects. Many of them require 5 to 7 years to develop so even if they started today, they won’t be operational until mid to late 2020’s.
I am also concerned that demographics & debt will may impact Oil production in the Future. I don’t believe many younger people choose careers in Oil & Gas production & that most of the critical knowledge & experience is held by Boomers that are likely to retire. if I am not mistaken the folks like Mike Shellman, Shallow Sands, etc, are in their late 60′ or perhaps early 70’s.
https://www.businessinsider.com/oil-industry-facing-massive-worker-shortage-2016-7
“because there were few job openings, very few young people between the mid-1980s and 2000 went into oil and gas. As a result, much of the workforce that stuck around is now aging and moving closer to retirement, setting up the industry for a labor crunch, or the “Great Crew Change,” as some dub it. There are too few experienced professionals to replace retiring workers. ”
Presuming when the Shale boom comes to and end, there is likely to be a lot of bankruptcies and investor losses. I suspect all that Oil companies will have difficulty finding investors having gotten burned by Shale. Perhaps gov’t will step in to bail out, but usually state owned\controlled business rarely excel. Delays & cost overruns are very common with state own businesses.
Schinzy,
Economists used to believe that monetary policy was only viable when real interest rates were positive, in fact standard Keynesian analysis suggests in an economic crisis, businesses will be unwilling to invest even if interest rates are zero. Fiscal policy by means of government deficit spending is the means for ending a recession, in the case of the Great Depression it was spending on the military during World War 2 that ended the Depression, but any government spending on a large scale would do the job.
Income disparity can be remedied by changes in tax rates for wealthy vs middle class, including large estate taxes.
There is very little evidence that Worldwide demand for oil is likely to fall to a point that oil prices will fall, nor is there any evidence that Brent oil prices at 107/b in 2014$ as was the case from 2011 to 2014 will cause economic collapse (as World real GDP growth was around 3% per year over that high price period.)
Oil is becoming less and less important as an economic input, so high oil prices will harm the economy less and less and the high oil prices will also spur a transition to electric transport, that could potentially increase labor productivity and income.
” in fact standard Keynesian analysis suggests in an economic crisis, businesses will be unwilling to invest even if interest rates are zero.
Easy to overlook. Even with zero interest rates, there is still risk in borrowing money, in that you have to eventually pay back the principal. In a real crisis, you may lose that money and put yourself in debt, which should be obvious.
This is standard economic analysis. I disagree with it.
When oil production begins to fall I think we will see defaults and money creation by central banks causing inflation.
Shinzy,
The money creation only causes inflation if it is utilized, in recent economic crises as well as in the US during the Great Depression deflation was the problem rather than inflation. The German inflation between WW1 and WW2 was due to a very poorly conceived Treaty of Versailles which essentially was the reason a second War resulted, k\luckily the World learned from the mistakes of 1919 and they were not repeated in 1945.
I also do not think much of standard Neoclassical Economics and most Neokeynsians would also discard much of neoclassical economics.
The experience of money creation during the GFC and relatively low inflation certainly does not support your hypothesis. Lots of money was created and the Velocity of money crashed as most of the money sat in bank accounts and had very little effect on the real economy.
Ok Ron, back at you.
I want to say the video link is a thousand times more informative and entertaining, but one can’t when Tverberg is neither. All done in less than 20 minutes.
https://www.youtube.com/watch?v=JDcro7dPqpA
Not available in UK. But this 3 min segment is:
https://www.youtube.com/watch?v=Ia8R6gH5GB4
So… over here in Bangalore.
15M people and not an EV in sight. The truth is tuktuks are a resonably efficient form of transportation. So as tech brings us Uber and Ola that actually shifts rides from tuktuk to auto. Not sure this particular technological revolution is fuel efficient in the slightest. It’s also by definition more miles driven because you have to pair up your ride that then comes from, typically, 5-10 mins away. With a tuktuk it’s either there waiting (common pickup spots) or you wait for one to go by. There’s no calling them. I myself will take an Uber unless I just want to hop in and go. It’s more comfortable to ride in a car, and you get A/C with the better cars.
The things which the prosperous worry about in their mad max scenarios are already here. Refuse everywhere in huge piles. No water. http://www.newindianexpress.com/cities/bengaluru/2019/mar/10/bengaluru-water-crisis-in-bellandur-top-bidder-for-tanker-gets-water–1949110.html
Tech city itself – in an ironic twist for the hotbed of innovation – is being serviced by water tanker. A woman got her ears cut off a few days back because she took 8 pots instead of 4 from the neighbourhood well.
There’s also a GFC taint to the air, along with the other taints. Homes being offered in full page ads in the paper for as much as $600K USD. For whom I wonder? Meanwhile whole apartment blocks sit unoccupied and home finance companies go bailout begging. https://economictimes.indiatimes.com/industry/banking/finance/a-special-borrowing-window-inside-rbis-blueprint-for-the-great-indian-nbfc-rescue/articleshow/69410014.cms
The thing is, if most people in the prosperous west were plopped down in India, they would think the world had ALREADY collapsed!
So, I,m very late to this party but, I’ve been busy with real life apart from having slowed down with my electric commercial vehicle series to try and make sure we don’t get any nasty letters from anybody about my use of their pictures.
Timing aside I think Gail is overlooking the elephant in the room, technological disruptions. She keeps pointing to affordability as the reason prices can’t go up but, I think we are just about at the point where it’s competitive pressure from alternatives both in electricity production and transportation that is starting to put a cap on prices. From my ECV series, it is apparent that commercial fleets are starting to see the benefit of electrified vehicles and are starting to make serious moves in that direction. I’d wager that there is far more going on in the commercial EV space than there is for privately owned and operated vehicles. I fuel prices go to high there will be a “rush for the exits” and increasingly, viable alternatives are coming to market.
Gail also keeps going on about how increased production of commodities is required to replace coal with PV or liquid fuels with lithium ion batteries. Here she is again ignoring the role of technology disruptions. On of my pet examples is a company called 1366 Technologies, a pioneer if kerfless PV wafer production. They basically cast the wafers as opposed to sawing them of a silicon ingot, allowing them to make thinner wafers without any waste (sawdust). Their process along with other kerfless technologies can make more than three times as many PV wafers from the same amount of raw silicon using legacy methods, at a lower cost as well.
The most powerful supercomputer in the world in 2002 was Japan’s NEC Earth Simulator at 35.86 teraFLOPS. From the Wikipedia page
Every car delivered by Tesla now has a 144 teraFLOPS supercomputer that cost $600 and fits between the glove-box and the firewall, to enable autonomous functions.
Just a while ago I posted a link to a story on the non oil thread about research being conducted by the CCDC Army Research Laboratory and the University of Maryland, claiming that they can achieve a specific energy of 460 Wh/Kg. This web page, Testing Tony Seba’s EV Predictions 17 (More about Batteries), tries to work out the specific energy of Tesla’s most recent cells and comes up with a best case of 257 Wh/kg. If the army research were to bear fruit we are looking at almost twice as much energy per kg of raw material.
Even in the shale oil space, my understanding (mainly from folks like Coffeeguyz) that technology is allowing the shale guys to achieve a lot more using less resources ($)
Tony Seba talks about the fall in the costsand size of LIDAR in his video presentations as well as his treatment of PV and batteries. LED light bulbs now offer superior quality lighting, while consuming less than a fifth of the power that an equivalent incandescent bulb would and the savings pay for the morev expensive bulb pretty quickly. i could go on but I’m sure you get the point.
On the subject of the timing, if the Ghawar complex has in fact gone into full decline, there appears to be nothing on the horizon that will make up for that.
U.S. Oil Rig Count Dips To 14-Month Low
The combined oil and gas rig count is 987 with oil seeing a 42-rig decrease year on year and gas rigs down 15 since this time last year. The combined oil and gas rig count is down 59 year on year.
Oil rigs down while the oil price is up?
Investors and lenders demanding that wells themselves need to make money. Stop drilling money losers to boost aggregate production, we’re not paying for it anymore since you as a company arent making money despite doing that.
Interesting. The number of oil rigs used in Eagle Ford and Bakken remain quite constant, less than 1/3 of their maximum in 2014, no matter what is oil’s price. Now, also the Permian number of oil rigs seem to have reached a maximum and it’s trending down.
Not only this, but the new well productivity in the Permian seems to have reached a limit in 2016, after steep increase.
https://shaleprofile.com/2019/05/08/permian-update-through-january-2019/
Alex,
The Permian well productivity is plenty as of 2017 to allow Permian production to increase. The Permian scenario below has well completion rate gradually increasing through 2025, assumes EIA AEO reference oil price scenario and 10 million well cost in 2017$, 7% interest rates, and 10% discount rate, royalty and taxes 33% of wellhead revenue, $5/b transport cost (2017$), no revenue from natural gas produced, and LOE= $2.3/b plus $15,000 per month for each producing well. Model assumes zero debt at the end of 2009 and then debt (cumulative net revenue when negative) accumulates to nearly 200 billion (2017$) by 2023 and then is paid down to zero from 2023 to 2028, by 2040 cumulative net revenue increases to 540 billion 2017 dollars.
The model assumes no increase in well productivity from 2017 to 2022 and then gradually decreasing well productivity from Jan 2023 until the last well is completed in 2055. Peak is about 7500 kb/d in 2027 in this scenario.
Dennis,
On your scenario, less than 5GB have been produced to date, with 20000 wells, and more than 50GB remain to be produced in the next 30 years. On the financial side, the operators break even only 9 years from now. All this should happen on a very large reserve base and (probably) high and increasing oil prices.
What if:
1. Permian LTO ERR is much smaller ?
2. Transition to BEV is faster than currently predicted ?
3. Climate change gets worse and some future Administration imposes a carbon tax on gasoline/diesel ?
Hi Alex,
In every case you cite the price of oil will be different than I have assumed (I used the EIA’s AEO2018 reference oil price case).
If the oil price is lower, output will also be lower, simple as that.
I always tell people they can give me an oil price scenario and I can run it.
Chart below does just that.
From the last page of the 1,593 comments.
Gail Tverberg says:
March 14, 2019 at 11:56 am
I think that once a big recession hits, and price drops very low, say to 20 barrel, production falls way back. Even the level of cutbacks seen in China and Germany could spread. The demand side is more important than the supply side.
Hi Ron,
Well, I took your Tverberg challenge and lasted, um, 10 minutes 45 seconds.
If I got this right, her line of logic to that point was that non-elite workers are suffering deflation which leads to decreased demand which leads to oil gluts which are happening more often and at lower prices, but nation state producers need $100+ to meet State budgets – so their running deficits and headed towards defaults. Meanwhile its good to be an elite, but they don’t but enough basic stuff to keep the whole show going, so with the defaults it all goes to heck in a handbasket.
I used to follow Gail’s arguments. They string ifs together, declare them facts and point to a predetermined result. Like Zeno’s paradoxes, this line of logic makes sense if you accept the premises. But the result can be nonsense, which was Zeno’s point.
Here’s Tom’s paradox. Tom’s got work tomorrow. He has 30 minutes to get to bed. Gail’s video is 25 minutes long. Can he do this? Theoretically, yes. But he stops the video every minute to ponder wtf did those crossing lines prove? And who is the weird guy with the British accent? Why does he sound like an elite, and are they the bad guys here or something? Bong. Times up. ‘Night now.
I can’t follow that robot voice and watch the figures in the video at the same time. Also–I’m just confused. I’ve followed peak oil for 14 years now, and I can’t say I am any clearer on when it’s supposed to happen, what it means, who is right about geology versus economics, etc. It’s dispiriting to spend so much time listening and reading, only to be left in the lurch.
I ran across this Gail Tverberg once, live and in person, at a conference.
None of the regulars here would ever bother to talk to her, in person, more than five minutes before deciding she’s just a talking head, somebody with a series of canned presentations that make sense, SORT OF, to her audience, from which she makes a living, one way or another.
Her stuff simply does not hold together, if you examine it. I wouldn’t waste two minutes on her video, never mind half an hour.
She was incapable of rationally answering even the simplest sort of questions from anybody who actually knew something about oil, energy, and economics.
She’s sort of like a Sunday school teacher trying to explain physical realities such as fossils, lol, to kids who ask questions. Ask one someday, a fundamentalist Sunday school teacher I mean, any question based on real world science, and you will generally find that he doesn’t have the FOGGIEST conception of every day reality.
Sending his kids out to collect two of each and every kind in the whole world……..
Tverberg has her canned presentations. She gets paid to put them on. She may be, probably is, getting some support from donors associated whichever political faction finds her the most valuable.
But don’t ask her any real questions. If you do, she freezes up like a deer caught in the headlights, and answers some OTHER question, which is a typical politicians response.
Would be nice to hear of some examples.
Yes, Gail is paid to post on her web site at least as much as OFM is paid to post on Peak Oil Barrel.
She used to do paid presentations, and her web site is advertising for her live audience. I saw her myself at such a presentation, by way of paying a substantial registration fee, but there were other speakers there that I WANTED to see and hear, the most important one being John Micheal Greer.
Back in the old TOD days, a good many of the regulars posted comments to the effect that she was in the financial pocket of various fossil fuel interests. I personally believe they were right at that time, and see no reason to believe otherwise at this time. Never the less I defended her when she took some trips courtesy of big oil, given that she did provide some good info that would otherwise not have been available to the audience at TOD.
Look at her stuff and make up your mind for yourself, in terms of deciding what you believe. Unless you have money of your own, sufficient to live, you must take in money from running a website and making presentations if you do these things on a regular basis.
I have never collected even one dime, directly, as a fee or cash or in kind contribution, from anybody, for what I do on the net.
I have been richly rewarded nevertheless, by way of making new friends and learning new things from the people who respond to my comments.I have also benefited substantially from what I have learned by making better decisions in managing my own business affairs.
Assuming I ever finish it, I will be publishing a book based on a combination of human interest stories, folk wisdom, modern country living, the hard science of the environment, and politics.
My posting here and other places, using other handles, is partly for my amusement, just enjoying it, but more for the purposes of research…… by way of provoking comments that point out the shortcomings and or actual errors in my thinking or beliefs.
I have learned a TON of important things from regulars here such as GF, Fred, Dennis, and Ron, and more than a few things from a couple of dozen others.
It’s rather unlikely any publisher will pay me for it, so it most likely will have to be self published on the net, free for the downloading, but I will be printing a hundred hard copies, to be given away to friends near and far.
I would as my long departed dear old Momma used to say go thru her stuff like a chicken thru a dry cow turd, but it’s not necessary, as others are taking care of that task.
I will leave it at saying she decides what she wants to prove, ahead of time, and strings together stuff to prove it, and that if you are just a LITTLE BIT smart, you may well find her arguments convincing. I find them simplistic and misleading.
I will give one example, based on the first few minutes of the presentation linked here. Five minutes of it was all I could stand. She says things like smart phones get to be a glut on the market because they are TOO EXPENSIVE, due to the materials in them getting to be too expensive, and that ordinary people cannot afford them. Now there’s no fucking way I will ever pay a thousand bucks for one, since I don’t want to play on the net on a screen that will fit in my pocket, but I have a smart phone IN MY POCKET at this minute that cost me only forty bucks NEW plus sales tax. As smart phones go, I guess it’s intellectually challenged, but I can play some free games on it if I get stuck in traffic, see road maps, cruise the news, do any ordinary arithmetic, buy stuff online. It has all the numbers in it I have ever wanted to save. It does voice mail, sends texts, takes good pictures, etc.
It’s true that higher priced gasoline can play hell with the budget of stupid people who must commute a long way to work, but gasoline even at a high price is a world class bargain, in terms of what it makes possible….. such as living in a house with acreage ten or twenty or thirty miles out of town…….. a house comparable to one of similar size and features IN TOWN, on a quarter acre or smaller lot………. for as little as ten to twenty percent of the same money. If you are stupid enough to buy a six thousand pound four hundred horsepower tricked out vehicle as a commuter car, while earning only a modest salary, that’s the result of stupidity, not scarcity.
Cars are actually CHEAPER now, in real terms, than ever before, when you consider all aspects of ownership, including safety, fuel economy,cost of repairs, long term durability, and inflation. They are actually so cheap you have a hell of a hard time even FINDING A NEW ONE that isn’t equipped with all the stuff that used to be advertised as “equipped, not stripped” such as automatic transmission, power windows, power steering,power brakes, nice sound system, tinted glass, nice upholstery, air conditioning, etc, in comparison to older cars.
The right to brag about a car that lasted a long time when I was a kid started at about ninety to one hundred thousand miles. Bragging rights these days start at three hundred thousand miles.
((It is true however that a hell of a lot of cars die early due to being redesigned every year or two, so that by the time a problem with the design becomes obvious, it’s already out of production, with ANOTHER new design, inadequately tested, taking it’s place, lol. Manufacturers all too often unfortunately don’t pay much attention to the consumer’s cost of repairs these days because warranties are long, and they expect their new car customers to buy again, based on the FIRST THREE OR FOUR years being trouble free. But the better car companies such as Toyota and Honda get it right, and thereby sell new cars to people who can afford a new one every three or four years because the RESALE value of their product is higher than the resale of the competition. )
It takes a lot of words to refute just a few well chosen words selected to create a false picture in the minds of a susceptible audience. As Twain said, a lie goes around the world twice while the truth is still putting on it’s shoes.
“As Twain said, a lie goes around the world twice while the truth is still putting on it’s shoes.”
The truth has been out there for a long time now. Here is a list of videos from 2012-2013 showing the truth concerning gas fracking.
Dr. Ingraffea Facts on Fracking
https://www.youtube.com/watch?v=mSWmXpEkEPg
Marcellus Shale Exposed: Tony Ingraffea /Keynote
https://www.youtube.com/watch?v=JTUrwtYJhGk
Shale Gas: The Technological Gamble That Should Not Have Been Taken by Anthony Ingraffea
https://www.youtube.com/watch?v=PGfIjCG-zB4&t=621s
Lethal gas/oil wells: Anthony Ingraffea
https://www.youtube.com/watch?v=Dxis-vYGM_M
Cornell professor Robert Howarth presents on hydro-fracking
https://www.youtube.com/watch?v=T3Ib5O-igds
Industrializing up to 70 percent of the area of states to “produce” energy from fossil fuels has major and long lasting effects upon all levels of the environment. The truth is the major product is not useful energy.
There’s a large cottage industry sprung up over the last decade to spread misinformation and pseudoscience about safe industrial products or practices. You can see this with regard not just to fracing, but GMO’s, high fructose corn syrup, vaccines, etc.
So you think the professors at Cornell, some of whom helped develop deviated drilling, are lying? Let’s see your evidence.
All I’ve seen you do on this site is try to start arguments. I’m not going to take the bait.
If that is all you see then no problem.
OFM Wrote:
“Cars are actually CHEAPER now, in real terms, than ever before, when you consider all aspects of ownership, including safety, fuel economy,cost of repairs, long term durability, and inflation. ”
If that was true, why are consumers taking out 10 year auto loans & also often have to roll in the debt owed on the previous vehicle into the new vehicle auto loan?
Economically we are reaching in the bottom the Barrel. Its possible that soaring energy costs (when the hit) will be trigger the other elephants in the room: Demographics & Debt. The global economic has been burning its candle in three spots: both ends & the middle. Clearly its going to end in disaster.
If that was true, why are consumers taking out 10 year auto loans & also often have to roll in the debt owed on the previous vehicle into the new vehicle auto loan?
WHY?
Mostly because the consumers taking out ten year loans and rolling over debt on previously owned cars are,to put it mildly, utterly incompetent in terms of managing their money.
They buy the car they want, the car they have been SOLD, by the advertising industry, and indulge their desire to drive a high status car, in relation to their station in life.
( A Mustang is high status car to a typical hourly wage earner, whereas something along the lines of a new Porsche 911 is a high status car to a lawyer or dentist.)
THEY DO NOT BUY a car they can afford, and they trade it off on ANOTHER NEW CAR when it’s barely broken in, in terms of it’s actual life expectancy…… assuming they happened by lucky accident to select a make and model known to be reasonably reliable and durable.
The people who screw themselves this way aren’t at all likely to select a car that is noted for it’s low overall cost of ownership, including all expenses such as financing, taxes, insurance, repairs, maintenance, depreciation, etc.
Because they own two or three cars, when one or two would get the job done.
If you expect to get your money’s worth on a new car these days, you should pick one that’s in the lower part of the price range, with a relatively small engine, etc, not too many extra cost features, and plan on driving it for fifteen years, or even longer. Pick one that’s a top seller, that’s been on the market for at least three years, so that if it’s a lemon model, the word will have had time to get out.
If you really want to get your money’s worth, you will educate yourself about which cars last, and are easy to insure and easy on gas, etc, and buy such a car four or five years old from an individual who needs or wants to sell it for some legitimate reason.
Buicks built in the late nineties have a rep for bullet proof long term reliability and for lasting just about forever, as long as Toyota Camry’s or Honda Civics. My folks paid four grand for the one I’m driving now, back around 06 or o7, with about a hundred forty thousand miles on it. It will very likely roll right on past three hundred thousand miles with never a major repair of any sort, maybe a new alternator, a new starter, new ac compressor, etc, plus routine maintenance such as tires brakes hoses, etc.
Finance cost, zero, paid cash. Depreciation, driving it twenty years, under two hundred bucks per year. Taxes, trivial. Insurance, only liability and accidental injury coverage needed. Present value if sold, around a thousand bucks, but it’s not for sale.
We bought it from the original owners, long term acquaintances, who came into enough money by way of building a successful business that they could easily afford to spend thirty or forty grand on a really nice new car. Back when they were getting started, they drove old cars. The Buick we got from them was their FIRST new car, and they drove it ten years.
There’s a classic car joke that goes hubby talking, the OWNER ( of the company they work for ) drives a Buick, why can’t we?
Wife responds we are not rich enough, we have to have at least a LEXUS to keep up appearances.
The most popular vehicle ( according to the fact based finance book titled The Millionaire Next Door ) among self made millionaires is a Ford pickup truck, which they they drive for a LONG time. No Caddy, no Beemer, no Lexus, no Mercedes. Just a pedestrian practical pickup truck that’s universally acknowledged to be one of the cheapest vehicles you can own, over a period of time, assuming you need to do a little hauling from time to time.
Gee OFM,
TLDR: (Too Long, Didn’t Read!), But I don’t believe you didn’t answer the question, you mostly rambled about poor consumer decisions.
Exec Summary: Vehicle costs for consumers is rapidly making them affordable. Presuming this trend continues (the most likely case), then many people in the not so distant future will no longer be able to drive, unable to afford them.
Venezuela will be down big again this month after rebounding from the blackout. Both direct sanctions and cash/logistics constraints.
https://oilprice.com/Energy/Crude-Oil/Putin-Could-Cut-His-Loss-As-Venezuelan-Oil-Output-Nosedives.html
In 2009 Jim Lentz, CEO Toyota North America, predicted peak oil by 2020 and peak natural gas by 2050. The video is 2 minutes and 4 seconds long.
Toyota’s Jim Lentz Predicts Peak Oil by 2020
Thanks!
It is refreshing to see corporate people accepting reality.
This was BPs former geologist in 2013. Conventional peaked in 2008, LTO as a retirement party.
https://www.theguardian.com/environment/earth-insight/2013/dec/23/british-petroleum-geologist-peak-oil-break-economy-recession
We’ve produced more LTO than anyone in that article was thinking – because financial engineering has enabled production that makes no economic sense. That’s ending.
Propoly. If oil was $90/barrel now, I propose that much could/would be produced economically.
Even more if it was $120, say.
How much of the world demand would be crushed by these levels?
Enough to dip demand?
I doubt these kind of prices as an isolated factor would be enough to slow economic growth, and diminish demand even a bit.
Do you it differently?
Demand growth is starting to be blunted a bit in places with lots of electric vehicles, but this is still a small phenom on the global scale.
No worries! Peak Oil?! What Peak Oil?!
7 giant airport projects around the world take flight
Location: Dubai, United Arab Emirates. Cost: $32.67 billion.
Location: London, England. Cost: $18.5 billion.
Location: Los Angeles, California. Cost: $14 billion.
Location: Beijing, China. …
Location: New York City, New York. …
Location: Mexico City, Mexico. …
Location: Istanbul, Turkey. …
Long Thanh International Airport.
Oct 11, 2018
https://www.constructiondive.com/news/7-giant-airport-projects-around-the-world-take-flight/539244/
Transportation terminal projects worldwide recently posted a 61% year-over-year increase, according to ConstructConnect’s Construction Industry Snapshot — and the growth in terminals, runways and infrastructure construction shows no signs of slowing.
.
Most LTO would still not be a worthwhile investment at $90 benchmark. Through 2014 that was the case and fracking still burned cash. It lost more, a LOT more, when triggering a glut, but was funded by debt even at the peak. None of the boomtown buildout in North Dakota was paid for with oil profits. Max short term production at all costs has been the mantra of the industry and that’s where the US production levels came from. I doubt $120 would have gotten much more drilled with how up against logistical constraints it already was; it would have made money then though.
I really think what we saw in the last decade was the maximum possible attack on the LTO resource, conducted irregardless of economics. So US production is higher than what analysis would have called for but its conducted at a loss and at expense of the long term life of the resource. All but one county in Eagle Ford is in decline.
OT (sort of):
April 2019 was the 410th consecutive month the global temperature was above the 20th Century average according to the just released NASA GISTEMP data. There were 3 billion fewer people on Earth the last time we were below average.
How much ‘recalibration’ of the old temperatures is being done to get the colder results?
Oh, probably just enough to bring out the drive by trolls, bots and fake people with even faker names such as Shiloh Pacheco out of the woodwork! Of course that in no way excuses the actual despicable cowardly lowlifes who are behind such comments, which are designed exclusively to sow misinformation and discord and promote nefarious agendas!
Unfortunately, our global environmental issues are not just about anthropogenic climate change global warming, as much as some would seem to like to ‘politicize’ and/or ‘monoculturalize’ it.
As related asides, please see also my most recent comments one and two.
After following the peak oil debate here and at the old TOD for a bunch of years now, and having revised my thinking and beliefs, sometimes radically, I have come to believe that while we may well experience a super major economic crash, if oil production crashes fast, or the price of it shoots up too high too fast due to war or political factors, etc……..
The world economy will successfully adapt to oil prices that rise slowly but steadily, and actual declining oil production. The people who really count on cheap gasoline, such as my many neighbors who have to commute to jobs in town, sometimes fifty miles or more one way, have mostly already switched to driving cars such as a PRIUS or econobox four cylinder compacts, leaving their pickup trucks and vans at home. The actual cost of oil used on a farm is trivial, in comparison to the total costs of production of foods leaving the premises. The cost of oil per bag or box of potato chips or cornflakes delivered from processing plant to store shelf is likewise trivial, probably way less than one percent of the retail price. The LION’S SHARE of fossil fuel costs, in money and pollution, associated with food, are the costs of hundreds of millions of trips per week to the grocery store and or restaurants. Probably well over a BILLION trips per week, on a world wide basis?
When times get tough enough, consumers will go back to more basic foods, ones that are NOT highly processed. Such foods can and will be delivered in reusable containers, once energy is a REAL day to day consideration. I’m still using fruit juice glasses that my grand parents bought….. filled with snuff….. very nice glasses that fit in very well even on a formally set table. We used to make our own ” apple crates” right on the farm, harvesting and milling the timber, and building the boxes, buying only the nails. These boxes were reused anywhere from two or three to five or six times per year for thirty, forty or even fifty years. You can still buy them at flea markets in farm country, in excellent condition. Urban types use them for book cases.
Barring batteries getting cheap enough, or synthetic fuels getting cheap enough, there will be a substantial market for oil even at two or three hundred dollars per barrel, in current day money, indefinitely.
I can move eight tons of produce from my farm to the nearest wholesale market for fifty bucks with gasoline at six bucks per gallon. At ten bucks, that would still be well under a hundred dollars. That’s fifteen thousand pounds of actual apples, the rest these days is paper one time boxes and pallets. That’s two thirds of a cent per pound, and the cheapest of these apples sell for at least a dollar a pound, and average closer to two dollars, at retail. Synthetic fuels or biodiesel will be affordable even at twenty bucks a gallon…… if it’s for an ESSENTIAL job.
Peak oil is not going to be the end of the world unless we mismanage the transition to a low oil economy.
But I’m afraid the transition is more likely to be mismanaged than otherwise.
We are well underway in terms of going renewable on transportation energy, by way of electric cars and light trucks. Trains can and will make a big comeback in terms of bulk long distance transportation of heavy goods such as car loads of oranges, tomatoes, furniture, lumber, etc. If for some reason the self driving truck never becomes a commercial success, I predict that light rail will again be built in lots of places…… with self driving trains consisting of as little as ONE car equipped with a battery powered electric motor taking care of a huge part, maybe most, industrial shipping jobs.
We are well underway in terms of building houses that are super energy efficient and that will last just about forever. New electric cars can be built to last indefinitely, hell so can conventional cars, except that new ones are cheap enough nobody wants to spend serious money maintaining older cars anymore. I used to spend a thousand bucks refurbing old pickups to run reliably for another five or ten years when new ones were ten grand. I’m spending two thousand plus my time refurbing an old one, an eighty five, now, that will last me ten years, if I last that long myself. It will be functionally equivalent to a new one that costs over forty grand……. minus the modern safety and convenience features of course.
The direct cash savings of thirty thousand bucks, or more, will cost me only a couple of hundred hours of work. Not bad for a hillbilly farmer. I’ll spend that money on an INVESTMENT, rather than a depreciating asset. I can and will derive many times more satisfaction from spending this money on a nature oriented project, such as building a small lake, than I could ever get from driving a new truck.
It’s still possible to make an excellent living with one’s hands, if you possess the skill sets relevant to the twenty first century, and you are willing and able to work on projects of your own, as opposed to working by the hour for other people.
I think society will muddle along somewhat successfully with decreasing oil production long enough to reach the intersection of several other major predicaments. After that point in time no predictions are necessary or very useful.
Exclusive: Saudi’s Falih says sees no oil shortage, but OPEC to act if needed
“I am not sure there is a supply shortage, but we will look at the (market) analysis. We will definitely be responsive and the market will be supplied,” Falih said, when asked whether an increase in output was on the table due to oil shortage concerns.
“But all indications are that inventories are still rising. We saw the data from the U.S. week after week, and they are massive increases, so there is obviously supply abundance.”
If I’m reading this correct, no significant increases in quotas will be announced during the next OPEC meeting in June.
Production capacity at the Kashagan oilfield has been upgraded to 370,000 b/d from 340,000 b/d
2019-05-20 (S&P Global Platts) Production at the giant Kashagan oil field in Kazakhstan’s sector of the Caspian Sea restarted Sunday following the completion of scheduled maintenance
The Kashagan oil field was producing at around 340,000 b/d prior to its about 45-day maintenance from mid-April,
Production at the field will be gradually increased to 370,000 b/d, the Inpex official said on May 14, without giving a timeline.
https://www.spglobal.com/platts/en/market-insights/latest-news/oil/052019-kazakhstans-giant-kashagan-oil-field-restarts-production-partner
Kazakhstan crude oil production was down -299 kb/day (May 19th) from the Jan&Feb average.
Daily production chart https://pbs.twimg.com/media/D6_YWx5WkAA5aC9.png
Kazakhstan crude oil production (monthly) to April, down -300 kb/day from the average in Jan & Feb 2019
Colombia has increased its proven oil reserves by 492 million barrels, 42 million barrels is due to new discoveries, 450 correspond to revaluations…
Colombia – MinEnergy Bogotá DC May 13, 2019. According to the report of the National Hydrocarbons Agency, Colombia increased its proven oil reserves by 9.9% between 2017 and 2018, going from 1,782 to 1,958 million barrels. at the close of the previous year. As a result, the useful life of the country’s reserves increased by five months, from 5.7 years to 6.2 years.
During 2018, the country achieved the incorporation of 492 million barrels to its proven reserves, of which 450 correspond to revaluations resulting from the development of projects for improved recovery, incremental production and economic factors, and 42 million barrels more, product of new discoveries.
(Spanish) http://servicios.minminas.gov.co/web/guest/historico-de-noticias?idNoticia=24107159
Azerbaijan, April crude oil production was down -115 month/month to 683 kb/day due to maintenance at their largest platform.
2019-05-20 (Argus Media) Russian Urals crude shipments to Poland are set to restart via the northern leg of the Druzhba pipeline for the first time since a chloride contamination affected flows in late April, Russia’s oil minister Alexander Novak said today.
Stopped again
2019-05-20 (S&P Global Platts) Ukraine has suspended pumping Russian crude via the Druzhba pipeline to Europe following a request by Hungary’s MOL, as additional operations were needed to clean up the system from contaminated crude, national pipeline operator Ukrtransnafta said Monday.
https://www.spglobal.com/platts/en/market-insights/latest-news/oil/052019-ukraine-suspends-druzhba-oil-pumping-on-technical-issues-in-hungary
Am I the only nerd here to be surprised by the volume of organic chloride in Russian exported oil recently? There must have been thousands of tonnes (or much more) of the stuff sent through the pipeline system. One would have thought the head end manufacturing and storage plant would have wondered where all their volatile and toxic compound was going. Makes one ask how they usually get rid of it…
I’ve not seen a full explanation for it, just general stories…
2019-05-19 (Bloomberg) How one village on the Volga sowed chaos in Europe’s oil market
“This is a story about greed and small-time fraud colliding with incompetence and a lack of control over what goes in the pipe,” Bloomberg oil strategist Julian Lee said.
https://www.worldoil.com/news/2019/5/19/how-one-village-on-the-volga-sowed-chaos-in-europes-oil-market
@EN,
Thank you for this link. Very interesting!
It would be useful to find an assay of Vaca Muerta LTO. I’m still looking and not finding any.
Is the problem Late Stage Capitalism, or Texas? Or both?
Texas state bill would make protesting pipelines a felony on par with attempted murder – “It’s an anti-protest bill, favoring the fossil fuel industry, favoring corporations over people”
https://desdemonadespair.net/2019/05/texas-state-bill-would-make-protesting-pipelines-a-felony-on-par-with-attempted-murder-its-an-anti-protest-bill-favoring-the-fossil-fuel-industry-favoring-corporations-ov.html
Hey pipelines are people too. 🙂
Those protesters are trying to kill the pipeline, so obviously it is attempted murder. 🙂
Obviously! (sarc)
The pipelines are just the the life blood of the corporations. It’s the corporations that are legally considered to have the same rights as people… On the other hand Texas does have a death penalty! Maybe certain corporations will eventually be found guilty of crimes against humanity and executed 😉
As ex-president Jimmy Carter said recently, “the US is an oligarchy”.
“the US is an
oligarchy”OILYGARCHY 😉What, you don’t want a pipeline going through your neighborhood?
Are you a communist or what?
Even worse, a vegetarian. Probably rides a bike.
Seriously, its just like other things that people see as threatening to their livelihood, or dangerous, or deleterious to their health or property values. They don’t want it in their backyard, unless they get enough of an economic advantage from it.
Take two grain farmers. Both started out against wind turbines. Then one gets a royalty for having the pad installed on his land. Now he likes it.
“The material has been given wide circulation to Exxon management and is intended to familiarize Exxon personnel with the subject. It may be used as a basis for discussing the issue with outsiders as may be appropriate. However, it should be restricted to Exxon personnel and not distributed externally.”
-CO2 “Greenhouse” Effect, A Technical Review, Prepared by the Coordination and Planning Division, Exxon Research and Engineering Company, April 1, 1982
Protesters would have as their antithesis, armed counter protesters in Texas. Just not wise anyway. Bill is unnecessary. They keep on relaxing gun laws in Texas, and everyone will be walking around with a six shooter on their hip again.
I feel a LOT safer, here in the hills, where every second or third man carries, usually without a permit, than I ever felt in the city. An armed society is a POLITE society, lol. Bad guys are highly reluctant to fuck with somebody who MIGHT pull his piece instead of his wallet in the course of a robbery or assault.
The flip side of course is that nowadays a gazillion half wild urban nut cases are armed and very dangerous, and apt to shoot you for any reason at all, or no reason at all.
I’m ready to bet that it will be very difficult indeed to possess a firearm,outside one’s immediate dwelling place, other than a cased hunting weapon, etc, in most parts of the USA within another ten to twenty years.
Even in backwoods places such as my home turf, the REAL gun culture, as opposed to today’s thug culture, is dying off fast. Maybe one physically capable man out of every ten I know as of today will go hunting this fall. Twenty or thirty years ago , it would have been one out of every four or five, and then I was living in an urban environment.
In five or ten more years, one local guy out of twenty will have a hunting license, although half of them will still have his Daddy’s and even his Grand Daddy’s guns….. which will collect dust in a closet or safe until HIS kids eventually sell them, after he is gone, or even turn them in to be destroyed.
It won’t hurt my feelings if Dennis or Ron either one deletes this comment as being too far off topic.
OFM- the mass shooters at the Black Church in Carolina, the Jewish temple in Pittsburgh, the country music show in L. Vegas, were all small town white dudes. Kind of guys you know, and trust with guns.
I don’t see people as the good-natured, sober, head-on-straight chums like you might.
I don’t trust a single one with a gun.
One of my friends said- ‘Well- then maybe you need a gun’
Is anybody here willing to predict which countries are the next ones to flip from net oil exporters to net oil importers?
Venezuela
Sure.
Equatorial Guinea.
Not sure of current data but Uzbekistan and Denmark look close to becoming importers. Looks like Argentina recently flipped.
https://mazamascience.com/OilExport/
Coming October 2019: Blowout
“Rachel Maddow’s Blowout offers a dark, serpentine, riveting tour of the unimaginably lucrative and corrupt oil-and-gas industry. With her trademark black humor, Maddow takes us on a switchback journey around the globe—from Oklahoma City to Siberia to Equatorial Guinea—exposing the greed and incompetence of Big Oil and Gas. She shows how Russia’s rich reserves of crude have, paradoxically, stunted its growth, forcing Putin to maintain his power by spreading Russia’s rot into its rivals, its neighbors, the United States, and the West’s most important alliances. Chevron, BP, and a host of other industry players get their star turn, but ExxonMobil and the deceptively well-behaved Rex Tillerson emerge as two of the past century’s most consequential corporate villains.
http://www.msnbc.com/rachel-maddow-show/coming-october-2019-blowout
I hope that Rachel used wind power to carry her to her recent fishing vacation and that she only allows solar power to be used to run the MSNBC studio. —Edit to add. Blowout may well be interesting. In my opinion Rachel is easily the brightest of all the talking heads.
Not paradoxically. Countries whose economy depends on a great part on the export of a rich resource are affected by an economic problem known as the Dutch disease. The rest of their economy becomes stunted making them even more dependent on the resource. If the country uses the income wisely, like Norway, the negative effect is somehow lessened, but if the country uses a large part of the money unwisely, like Venezuela, the resource becomes a curse. So what happens to Russia is just textbook economy as it is somewhere between Venezuela and Norway.
OPEC+ Top Priority: Don’t Crash Oil Prices
When you think about it for a second, the differences of opinion between Russia and Saudi Arabia are logical. The Saudi preference would be to roll over the cuts, but if it had to agree to a change, it would prefer the plan that calls for reducing the over-compliance. That makes sense since Saudi Arabia is the one over-complying; agreeing to this option would allow the Saudis to enjoy the benefit of increasing production. Russia, instead, wants the overall cuts to be lowered from 1.2 mb/d to 0.9 mb/d, which would presumably offer more room for them to hike output.
The $500 question is will Saudi Arabia increase production in the second half of this year? It sounds like they either don’t want to or can’t.
Based on the production numbers released so far, I’m guessing that world oil production (Edit: assuming US about flat) in April is at about the same level as April 2018. I don’t like to guess a figure for the USA, so if you think that US production has increased since the February Survey914 then add that on.
2019-04-30 (Rystad Energy) Loading programs for Ekofisk show a -251,000 bpd m/m drop for June 2019, corresponding with our forecast of a -230,000 bpd m/m production outage.
2019-05-20 (OE Offshore Engineer) Petrobras: The company’s director of Exploration & Production, Carlos Alberto Pereira de Oliveira, recalled that the national operator’s goal is to reach 2.8 million barrels per day of oil and gas this year, a level that was already reached in early May.
(This might mean a new record high for Brazil’s (ANP) production in May or June)
And Kazakhstan has 2 more shutdowns for maintenance later this year, at their Tangiz and Karachaganak fields.
Based on the production numbers released so far, I’m guessing that world oil production (without the USA) in April is at about the same level as April 2018.
Energy News, I really don’t think so. World oil production less USA, in April 2018 was 71,338 kb/d. In January 2019 world oil production less USA was 70,540 kb/d, a decline of 798 kb/d. January is the last month we have world data for, but we do have data for OPEC and Russia through April. Since January, OPEC + Russia has declined another 904 kb/d. Adding the two we get a total decline of 1,702 kb/d.
I am guessing that, since January, the rest of Non-OPEC, less USA and less Russia, has been pretty flat. Perhaps increasing a little but not very much either way. So I am guessing that World oil production, less the USA, April 2018 to April 2017 will be down about 1,700 kb/d.
Sorry yes I didn’t word that correctly and I didn’t re-read it after I posted it, change it to WITH the USA rather than WITHOUT, makes more sense 🙂
Chart for World Crude Oil Production to April. A guess based on the numbers released so far. There is a chance that April 2019 is a little lower than April 2018.
I don’t like guessing US production so I left it flat in March & April. If you think that US production has increased since the February Survey914 then add that on
Chart https://pbs.twimg.com/media/D7GZFceVUAEvVuT.png
Eyeballing your chart it looks like you have January 2019 at around 74,300 Kb/d. Total world production in January, according to the EIA was 82,410 Kb/d. That means nations producing over 8 million barrels per day are missing from your data. I think most of these nations are in decline.
Anyway, I am guessing World April C+C production to be around 81,300 Kb/d or about half a million barrels per day below April 2018 production. We will see whose guess is closest.
https://oilprice.com/Energy/Crude-Oil/US-Shale-Oil-Production-Set-To-Grow-16-This-Year.html
Rystad projecting a lot higher than possible, again. Note, they admit first quarter is absolutely flat. From what I can tell from the Texas RRC site, the second quarter is comparably flat through this month. Second half is rocket propelled? Methinks not.
Through April, the number of new permits is down by about 25% from 2018.
GuyM,
US tight oil output was relatively flat from Nov 2018 to Feb 2019, but Feb 2010 to April 2019 production is up. There were large downward revisions to last month’s tight oil estimate especially Jan 2019 to March 2019. Perhaps the estimates for the most recent 3 months just extend the trend of the most recent 12 months, this does not inspire confidence in the EIA’s tight oil production estimates.
Sure, they are just estimates. And, mine is just an estimate. Flat, at best.
And do I think it will remain that way into 2020? No, I think Rystadt’s projection of 1.6 million is entirely possible for the end of 2019 into 2020. Will the increase trend into 2025? I don’t think so. Mergers and purchases are not finished, yet. Is 2018 peak? My guess is yes, but it could not go exactly like I think, so another (one time) peak post 2018 is entirely possible. But, production will never be higher than demand, again.
Ron,
The April data for US tight oil output is out see “Tight oil production estimates by play” at page below
https://www.eia.gov/petroleum/data.php#crude
In the past 2 months US tight oil output increased from 7183 kb/d to 7399 kb/d, or an increase of 216 kb/d or 108 kb/d on average for the past 2 months, about 73% of this increase was from the Permian basin and over the past 7 months 89% of the US tight oil increase in output has come from increases in Permian basin output. The rest of US tight oil output has been relatively flat over the past 7 months. Permian output has increased at an annual rate of about 570 kb/d over the past 7 months. US tight oil output in April 2019 was 1223 kb/d higher than in April 2018 (from 6176 kb/d to 7399 kb/d).
It does look like output will be 500 kb/d less than Jan 2019 levels in April 2019. and possibly 650 kb/d less than April 2018 levels (I am mostly using OPEC and US tight oil data and assuming every where else (summed together) is flat. A better alternative is to look at World output from April 2018 to Jan 2019 (increased by 570 kb/d) and then look at OPEC and US tight oil from Jan to April. OPEC decreased by 770 kb/d and US tight oil increased by 220 kb/d for a net decrease of 550 kb/d, if we assume non-OPEC excluding the US was flat, then output in April 2018 and April 2019 would be roughly equal. Note that non-OPEC minus US minus Russia increased at an average annual rate of 590 kb/d from April 2018 to Jan 2019. So lately the trend has been up rather than down. Longer term (2017 to 2019 or 25 months) the trend has been down at an annual rate of 70 kb/d or 6 kb/d each month. So over 3 months this would be about a 20 kb/d decrease and Energy News estimate of flat production from April 2018 to April 2019 looks spot on in my opinion.
if we assume non-OPEC excluding the US was flat, then output in April 2018 and April 2019 would be roughly equal.
Ahhhh, but therein lies the rub. Non-OPEC less the USA was not even close to being flat. The combined output of Russia and Canada alone was down 412 Kb/d according to the Russian Minister of Energy and the Canadian National Energy Board. And the rest of non-OPEC is in steep decline. Chances are they will be down 100 Kb/d or so. (January to April in both cases.) OPEC is down 761 Kb/d January to April. World oil production, April 18 to Jan. 19 was up 597 Kb/d.
Okay -412 -761 -100 +597 = -676 Kb/d
I am saying -500 kb/d so I have 176 Kb/d to play with. Will US production be up 176 Kb/d from January to April after being down 187 Kb/d in February? No way, not even close.
I am betting April 2019 World C+C production will be down half a million barrels per day from April 2018 production. Understand however that is just my guess. But I think it an educated guess based on the numbers I have posted above.
Ron,
I looked at EIA data through Jan and deducted US and Russia from non-OPEC output, the decline has not been very steep from Jan 2017 to Jan 2019 only 70 kb/d annual rate of decline on average over those 25 months. US output increase is only enough to bring us to flat so we probably have about a 450 kb/d decrease from April 2018 to April 2019, it is also possible GOM output will recover to Dec 2018 levels, though not enough to make up for Canadian and Russian declines.
Your 500 kb/d decrease April 2018 to April 2019 looks correct when we account for Canadian and Russian decline. Nice estimate, I stand corrected.
So we have a World increase of 597 kb/d from April to Jan an increase from US tight oil of 224 kb/d from Jan to April and 420 kb/b decrease from Russia and Canada and a 760 kb/d decrease from OPEC Jan to April so 597+224-760-420 or a 359 kb/d decline in output from April 2018 to April 2019 if non-OPEC minus US minus Russia minus Canada output is flat from Jan 2019 to April 2019.
Middle east oil reserves have been 3P for a long time. Western reserves have been 1P… with enhanced recovery moving them to 2P.. ie. growth. Therefore world is a mixed bag. ME depends on west to get to enhanced.. ie. London fiance..
In my opinion the real reason Iran is targeting Mecca and Medena is 3P offline, Iran wins, oil 300 barrel.
I’ve not heard if any Russian crude oil production is being curtailed due to the Druzhba pipeline outage??? It’s been a whole month now.
The USA is importing more Russian crude oil to replace imports from Venezuela
Chart: https://pbs.twimg.com/media/D7C2hfAWsAE2cEa.png
2019-05-21 (Reuters) Trading companies Vitol and Unipec are sending around 5.1 million barrels of contaminated Russian oil to Asia in an attempt to place the barrels rejected by buyers in Europe, according to trading sources and ship tracking data.
Another 9 million barrels are estimated to be stuck in the Druzhba pipelines between Belarus and Germany.
https://www.reuters.com/article/us-russia-oil-quality-asia/oil-traders-sell-dirty-russian-crude-to-asian-buyers-idUSKCN1SR0XD
2019-05-21 (Argus Media) Ukrainian pipeline operator Ukrtransnafta said Urals shipments have resumed through the southern leg of the Druzhba pipeline system this morning.
Any discussion of this link should be taken to the non petroleum side, but it’s relevant enough to the overall oil supply question that it is worth posting here. I’m going to copy it there.
https://www.teslarati.com/tesla-gigafactory-3-china-rises-elon-musk-sci-fi-projects/
Methinks lots of people are doing all they can to force the price of Tesla stock down, lol. Musk’s record of bringing his so called sci fi projects to reality is pretty damned close to perfect, although he’s like me, usually running a year or two late.
The Chinese are totally aware of their resource versus population problem, and ENOUGH of their people in positions of real power have real science and engineering backgrounds that they collectively see the writing on the wall, very clearly, imo.
It’s their intention to own the electric car industry, just as they own the solar panel industry, and they are willing to do what’s necessary to own it.
In this country, back in the earlier days of the oil biz, old JD Rockefeller made a habit of “sweating” the little guys who owned small oil companies, coming into their turf, selling at a big loss, forcing them out of business…. and then buying up their assets for peanuts, with everybody else knowing the same fate awaited them, if they bought those assets.
These days, the local turf is entire countries, and the world, with globalization. Chinese leaders don’t talk about peak oil much, but their ACTIONS tell us all we need to know.
Tesla’s new super factory there is going up in half the time, maybe only a quarter of the time it could be built anywhere else.
And when it’s built……. Chinese are going to be operating it, from the crews that clean the bathrooms to the programmers that tweak the machinery to optimize production procedures. In a little while, hundreds, then thousands of them will have experience enough on this kind of work and machinery to leave Tesla and go to work for other manufacturers located in China.
The people who owned the furniture biz here in the states thought they could outsource their production to China and make megabucks by doing so. But they soon found out that the Chinese could hire their own advertising agencies, and buy up respected brand names during down turns, and now the Chinese own not just the production end, but a substantial chunk of the shipping, distribution, and retailing end of the biz as well. The skilled tradesmen who used to know all about furniture manufacture are now mostly either dead or retired or flipping burgers here in the states…….. but the Chinese are getting PLENTY of on the job training in such skills, which can be transferred into other fields, and of course supplemented by training classes as needed. There’s not a hell of a lot of difference about the work of an industrial electrician, plumber, pipefitter, welder,machinist, or programmer, etc, from one industry to another. They are now dominant in terms of having such people ready to move into tomorrows big new industries.
Peak oil inevitably means that the world is either going electric, as far as cars and light trucks are concerned, or going back to the nineteenth century, economically speaking.
It’s not at all hard to predict that the Chinese are going to build enough electric cars and light trucks to put some SERIOUS down pressure on oil prices within the next five to ten years or so.
The only real question for the oil guys is whether oil runs short faster than electrified vehicles can take over the market. If it does, oil operators are in for boom times, for a few years at least. If the electric car industry takes off fast enough……. oil prices will stay low.
And they have the Pandas:
Trump creates tariff-ying panda bear market as China recalls its products from US
“Trump: “No, no, Bai Yun! When I said I wanted to stop Chinese imports from displacing American goods, I wasn’t talking about you! Please come back! Don’t leave us with only Yogi and Boo-boo for ursine amusement and delight!””
https://www.sandiegoreader.com/news/2019/apr/05/sdqt-trump-creates-tariff-ying-bear-market-china/#
Vaca Muerta developments.
Former Argentina prez standing trial for corruption, whilst running for VP, which seems to be a convoluted way to undercut the current prez’s power.
There seems to be another level of complexity as well in that the IMF wrote a big loan check to the current Admin, and expressed displeasure about “oil price subsidy”. The former prez is trying to get bankrolled by foreign money and is floating trial balloons about the evils of fracking, which points at the govt’s price decree that has kickstarted LTO and gas production.
As of now the IMF is taking an indirect anti LTO position, even though that flow is the only hope of repayment. It’s similar to left wing pro green support for EV price subsidies, and then being presented with data saying the rich are the overwhelming majority of buyers, and thus are getting a left wing pushed tax break.
https://oilprice.com/Energy/Crude-Oil/Oil-Rises-But-Some-Drillers-Are-Filing-For-A-Second-Bankruptcy.html
Looks like many shale Companies strugles even WTI is in the 60 usd range. US shale production was almost flat first quartile 2019. Still exsperts exspect it shall grow 18% in 2019. How could that be when active drill riggs is down from one year ago. Do they have profit to drill new wells or are they planning to compleate more drilled but uncompleated ( DUC’s). The leader of China tells there will be a long walk, means full scale trade war and the pepole of China need to be prepared for hard days to come. It simply means less investment and growth in other Asian Countries, Africa as China use to do. Products in US will be more exspensive as China need to increase custom to. All this will have negative impact on world growth and oil price. There will be a new oil glut , there will be more huge losses within US shale . US will buy agricultural products from US farmers and give as Aid acc. to the President. To exsport to China will be impossible or at least very difficult. In this way Mr. Trump will make US great again….
Whack a mole, where will it show up? Certainly, not in the US, where everyone is looking. If your a US refiner, who is certain the fits going to hit the shan, you keep your inventory levels UP. DUH! Inquiring minds want to know!
Hi All.
Does anybody have a link to oil production data for the FSU state of Georgia. Shlumberger have a large exploration area and are expecting to find gas.
Try this: Trading Economics, Crude Oil Production
No history, just current and previous month, Dec. and Jan. in this case. Georgia produces almost nothing, 4,000 barrels per day.
Norway crude oil and condensate production (without NGLs)(1000 b/d)
April 2019: 1,409
March 2019: 1,417
Average 2018: 1,517
Average 2017: 1,618
Johan Sverdrup is expected to start in November this year. Phase1 field production capacity: 440,000 bopd.
The Ekofisk field will be offline for planned maintenance in June > -200,000 b/d.
Chart https://pbs.twimg.com/media/D7KVVC9W4AAfT_w.png
NPD: Oil production in April is 0.6 percent lower than the NPD’s forecast, and 1.7 percent below the forecast so far this year. The main reasons that production in April was below forecast is technical problems on some fields.
Big inventory build (crude+products). But how accurate can it be with the Line (13) Adjustment as high this: 872 kb/day
U.S. Petroleum Balance Sheet, Week Ending 5/17/2019
EIA overview pdf file: http://ir.eia.gov/wpsr/overview.pdf
Saxo Bank chart summary
https://pbs.twimg.com/media/D7La1QeWkAAAk32.png
Oilytics @OilyticsData
https://pbs.twimg.com/media/D7Lbmp8WsAAPbNk.jpg
https://pbs.twimg.com/media/D7LdkYAWkAEEA5o.jpg
Iran is being penalized for agreeing to terms of the agreement that the US agreed prior to Trump’s presidency but to whom is Iran still selling 2.5 million barrels per day? I assume some is domestic consumption?
Iran domestic demand for total oil products according to JODI Data was 1,512 thousand b/day in July 2018 (which is the last entry).
Iran refinery crude oil intake according to JODI Data was 1,730 thousand b/day in July 2018.
Iran has a new refinery, The Persian Gulf Star refinery (Phases I & II) that produces gasoline from gas condensate.
Oil imports from Iran increased as Asian buyers used waivers ahead of their expiry in May
Reuters chart https://pbs.twimg.com/media/D40_NKSUYAAE9Az.png
US inventories week/week change (1000 barrels)
Crude Oil: +4,740
7 Oil Products: +5,713
Total (crude oil + 7 products) +10,453 (shown on chart)
Propane & Natural Gas Plant Liquids: +5,601
SPR: -1,135
Line 13 Adjustment +6,104
https://pbs.twimg.com/media/D7MyP7mW0AAFv7p.jpg
As I understand it these 3 are the only weeklies available without paying a subscription…
Inventories: the sum of the USA + Fujairah + Japan (million barrels)
Total (Crude + Distillates) +7.9 week/week
Total (Crude + Distillates) +51.4 year/year
https://pbs.twimg.com/media/D7Mz3xwW4AAMEHP.png
https://pbs.twimg.com/media/D7M0QmFWsAIm0Nz.png
Looks like we are still in over supply. The OPEC would be crazy to reduce their cuts – they need the money to keep their states from “regime change”.
New posts up
http://peakoilbarrel.com/eia-tight-oil-estimates/
http://peakoilbarrel.com/open-thread-non-petroleum-may-22-2019/