A post by Ovi at peakoilbarrel
Below are a number of oil (C + C ) production charts for Non-OPEC countries created from data provided by the EIA’s International Energy Statistics and updated to July 2020. Information from other sources such as OPEC, the STEO and country specific sites such as Russia and Norway is used to provide a short term outlook for future output and direction for a few countries.
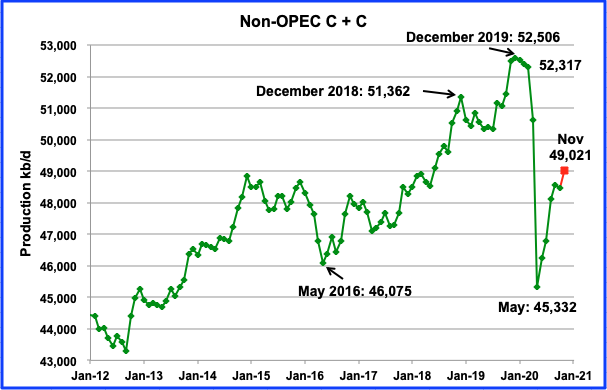
Non-OPEC production reached its lowest post CV-19 production rate of 45,332 kb/d in May. According to the EIA, July output added 543 kb/d to Juneʼs to reach 46,784 kb/d. Using data from the STEO, a projection for Non-OPEC output was made to November. November output is expected to rise to 49,021 kb/d, with the biggest increment occurring in August, close to 1,300 kb/d. It will be interesting to see if such a large increment occurs since US production in August dropped by 401 kb/d.
Ranking Production from NON-OPEC Countries
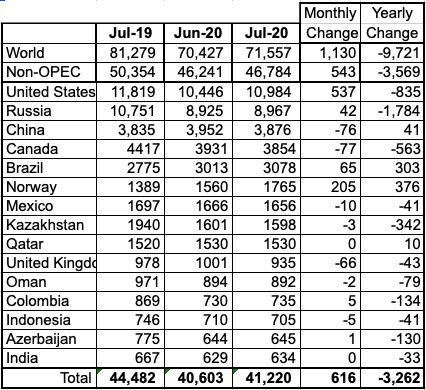
Above are listed the worldʼs 15th largest Non-OPEC producers. They produced 88.1% of the Non-OPEC output in July. On a YoY basis, Non-OPEC production decreased by 3,569 kb/d while on a MoM basis, production was up by 543 kb/d.
Looking at world oil production, it declined by 9,721 kb/d YoY and increased MoM by 1,130 kb/d.
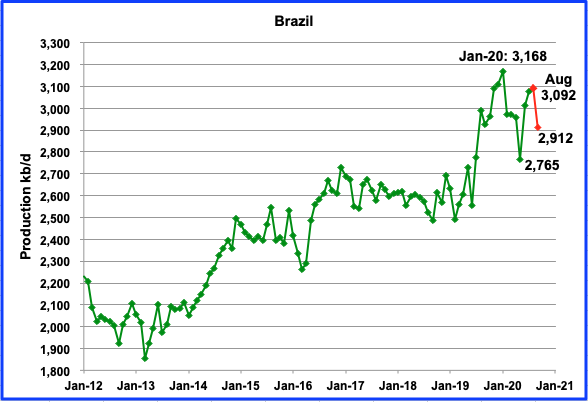
The EIA reported Brazil’s July production was 3,078 kb/d. According to this source, August increased to 3,092 kb/d and September dropped by 180 kb/d to 2,912 kb/d. (Red dots).
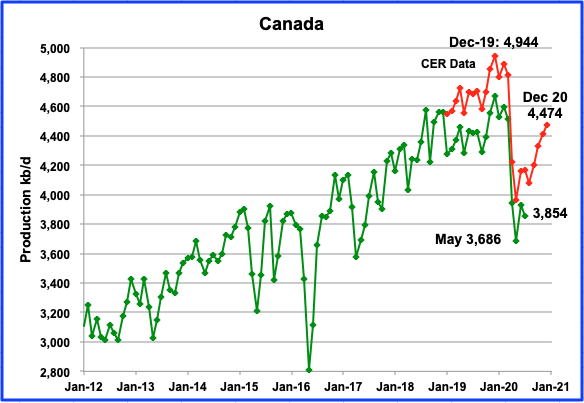
The EIA shows Canadian production was down in July by 77 kb/d to 3,854 kb/d. The Canada Energy Regulator(CER) data indicates a production was essentially flat. The CER data is higher because it includes NGPLs in their estimates and is close to 6% of total output.
According to this source, the cap on production in Alberta thatʼs currently at 3,810 kb/d will no longer be in effect in December. In August 51.05 kb/d was exported by rail to the US. This was an increase of 12.17 kb/d over July.
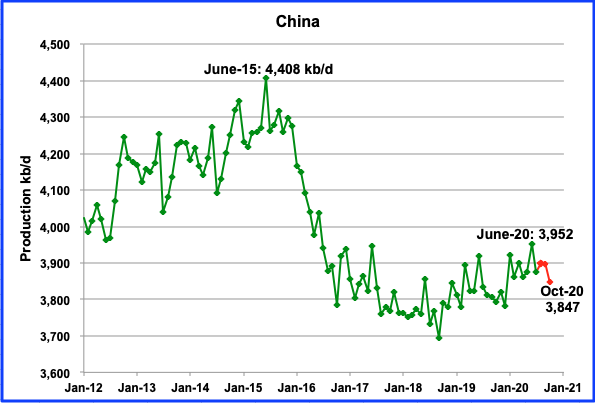
The EIA reports that China’s July output dropped by 76 kb/d to 3,876 kb/d from June. According to this source, Chinaʼs August production increased by 2.3% over last August. This source reported crude output for September and October relative to last year and all three are shown by the red markers.
From June’s recent high of 3,952 kb/d, October’s production dropped by 105 kb/d. Production has fallen from June even though Chinese oil companies have increased their spending to reduce the decline rate in their oil fields.
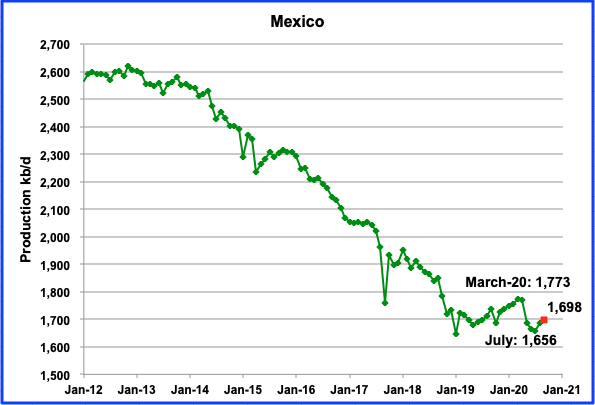
Mexicoʼs production decreased in July by 10 kb/d to 1,656 kb/d, according to the EIA. Data from Pemex shows that production increased to 1,688 kb/d and 1,698 kb/d in August and September respectively (red square).
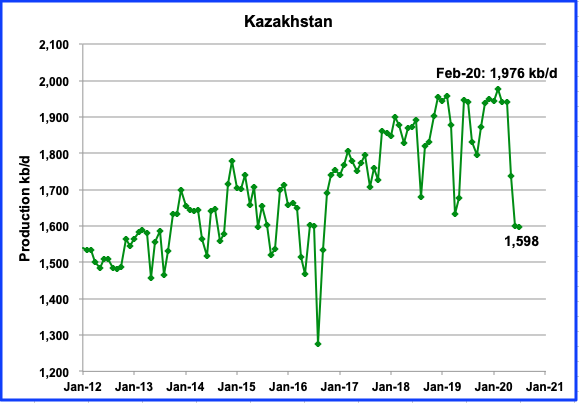
Kazakhstan production hit a new output high in February, 1,976 kb/d. In July, production dropped by 3 kb/d from June to 1,598 kb/d. According to this source, Kazakhstan states that it cut its oil output beyond OPEC+ requirements in June. This may explain the total drop of 340 kb/d from April‘s production of 1,941 kb/d to 1,601 kb/d. 1,600 kb/d may be close to Kazakhstan’s OPEC + production target since June and July production were very similar.
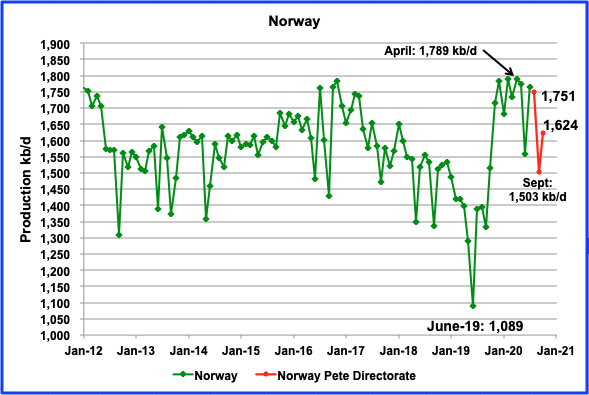
The EIA reported that Norwayʼs July production was 1,765 kb/d, an increase of 255 kb/d from June. According to the Norwegian Petroleum Directorate (NPD), oil output in September dropped to 1,504 kb/d and then increased by 121 kb/d to 1,624 kb/d in October. The NPD also reports that the production figures for oil in October include Norway’s promised production cut of 134 kb/d in the second half of 2020.”
According to OPEC, the main reason production dropped in September was due to maintenance work and technical problems in some fields.
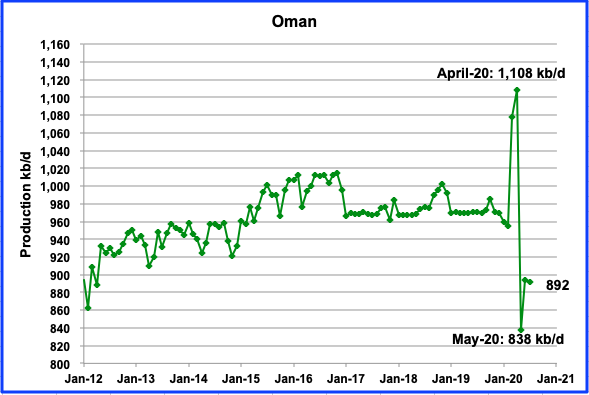
Oman production has been volatile since March. In June production was 894 kb/d, an increase of 56 kb/d from the May low. July production was down 2 kb/d to 892 kb/d.
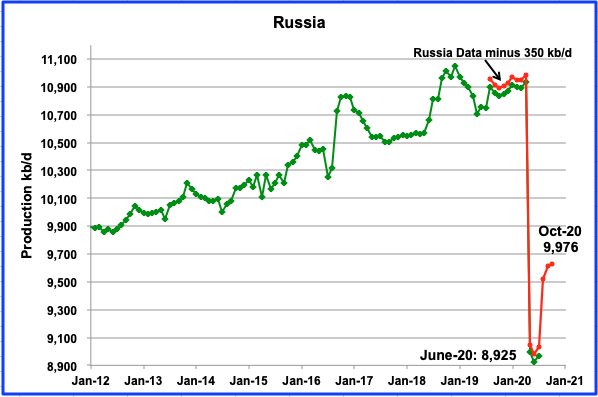
According to the Russian Ministry of energy, Russian production increased by 10 kb/d in October to 9,976 kb/d from 9,966 kb/d in September. Russia revised up its previous September production estimate from 9,932 kb/d to 9,966 kb/d.
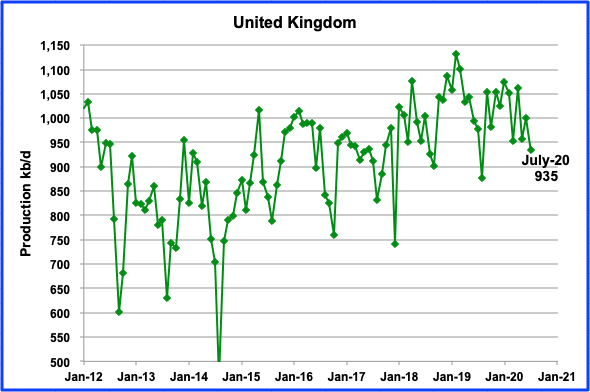
UKʼs production decreased by 66 kb/d in July to 935 kb/d due to summer maintenance. According to OPEC, UK production is expected to stay essentially flat for 2020 and 2021.
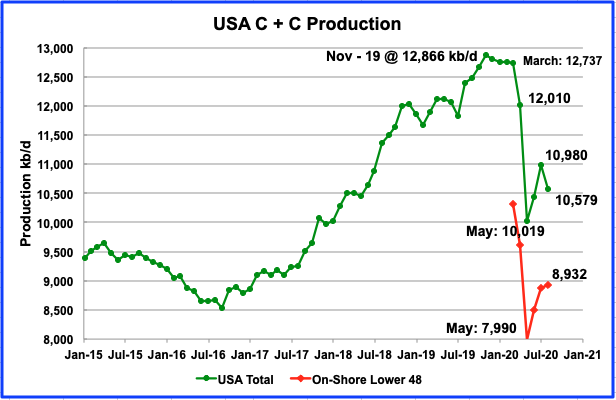
August’s US production dropped by 401 kb/d to 10,579 kb/d from July’s output of 10,980 kb/d. August’s drop was largely the result of a big drop of 453 kb/d in the GOM due to hurricanes.
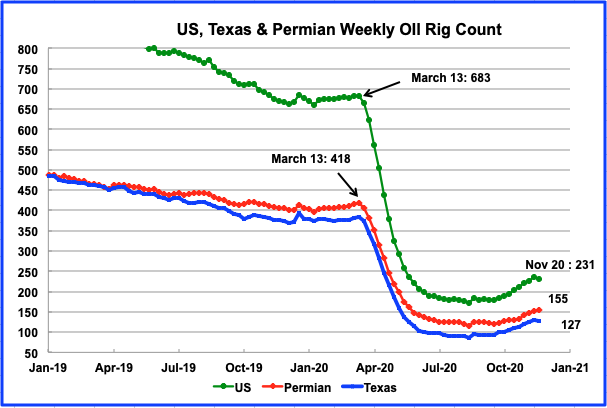
US and Texas oil rigs decreased by 5 to 231 and by 3 to 127 respectively in the week of November 20. It is not clear if the drop is temporary or the beginning of a plateau for operational rigs. Since the end of October, the price of WTI has rebounded from a low of $35.79/bbbl to settle at $44.91/bbl (January contract) on November 24.
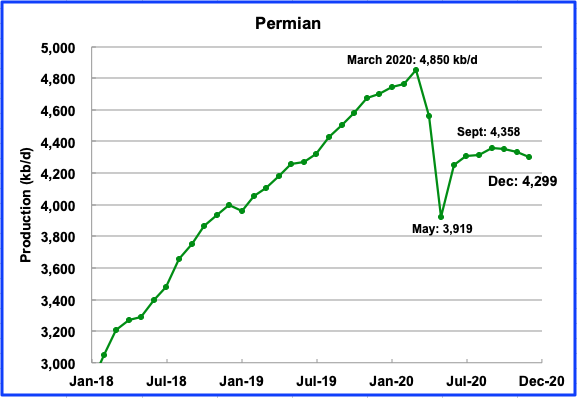
According to the November DPR, the 155 rigs operating in the Permian in November are not sufficient to increase production. Even though the number of rigs operating in the Permian has been increasing since September, the DPR is estimating that production will drop after September 2020. From September to December, the DPR is estimating that output is expected to drop by 59 kb/d.
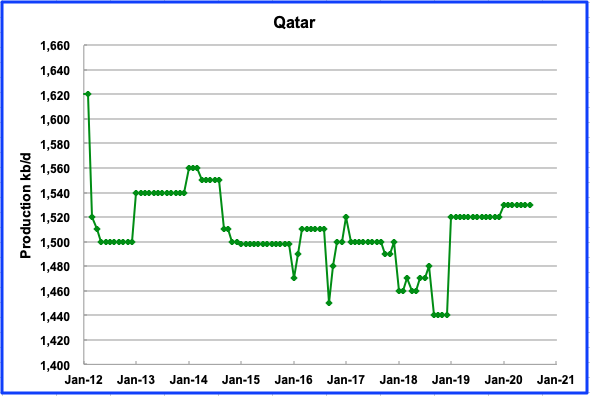
Qatar production has been stable in the 1,520 kb/d to 1,530 kb/d range since the beginning of the year.
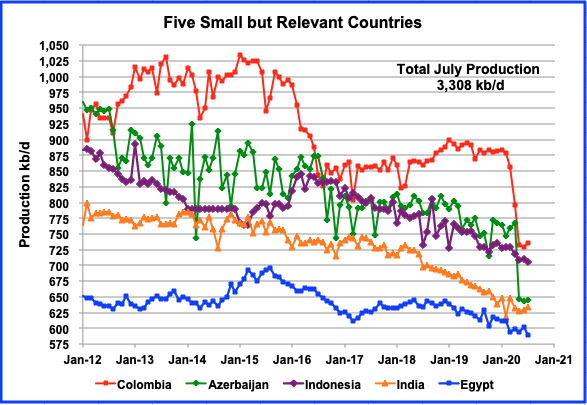
These five countries complete the list of Non-OPEC countries with annual production between 500 kb/d and 1,000 kb/d. All five are in overall decline. Their combined July production was 3,308 kb/d down 7 kb/d from Juneʼs output of 3,315 kb/d. For comparison, April production was 3,513 kb/d, 205 kb/d higher than July.
Non-OPEC Oil Production W/O US
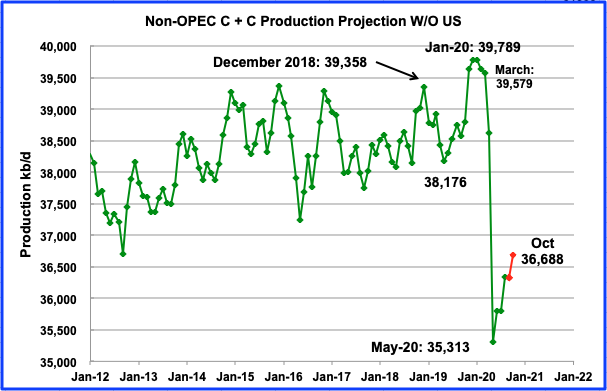
Non-OPEC W/O US output reached a recent new high of 39,789 kb/d in January 2020 an increase of 431 kb/d over the previous high of 39,358 in December 2018. For comparison, output from Non-OPEC countries W/O the US only increased by 541 kb/d over five years from December 2014 to December 2019. It is an indication that these countries as a whole are approaching an output plateau. Mayʼs oil output hit a low point of 35,313 kb/d.
Using information from the October STEO, output from the Non OPEC countries W/O the US is expected to rebound to 36,688 kb/d in October (red markers).
World Oil Production
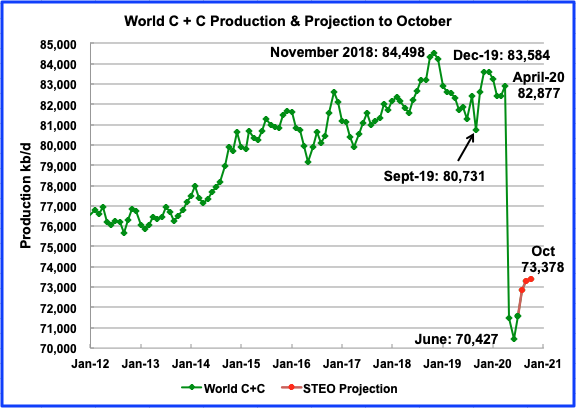
World oil production in July increased by 1,130 kb/d to 71,557 kb/d and is the first month to rebound from the June low.
This chart also projects world production out to October 2020. It uses the November STEO along with the International Energy Statistics to make the projection. It projects that world crude production will recover by close to 3,000 kb/d to 73,378 kb/d in October 2020 from June’s low of 70,427 kb/d.
OPEC and EIA Output Comparison
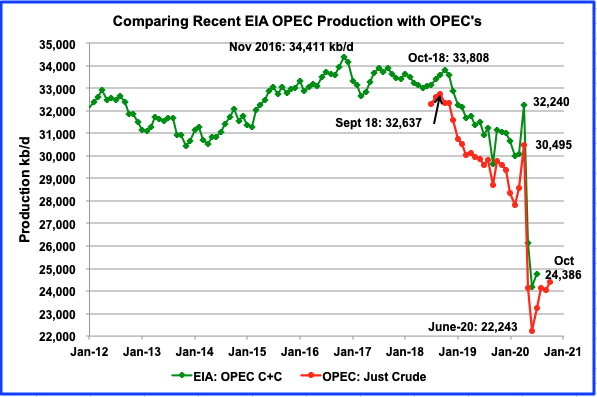
This chart is a comparison of the EIAʼs estimate of OPECʼs C+C production vs OPECʼs crude output. The EIAʼs estimate is roughly 2,000 kb/d higher, due to the inclusion of condensate. Will output ever get back to 34,411 kb/d level of November 2016. Some say it is not likely using a conservative annual decline rate of 2% that never sleeps.
84 responses to “Non-OPEC July Output up by 1.2%”
USD/JPY and USD/CHF price action to the upside suggest that a move in US bond yields is in the cards. The narrative of recovery taking hold. At least slightly higher bonds yields coming. Or money leaving bonds. As long as it’s an orderly exit from bonds i think oil will follow the narrative and go higher. But if we get a disorderly exit from bonds it might not be very good for oil price.
Banks being forced out of their long bond position would be a disorderly exit. FED would react only after the fact.
HHH
The Fed is currently buying about $120 billion in Treasuries and mortgage-backed bonds every month, partly aimed at lowering borrowing costs for businesses and households. How does this program affect your suggestion that slightly higher bond yields are coming. Will the Fed have to increase their bond buying to keep rates low?
Ovi, this 120 billion is just financing new government bonds. For buying the market up, they have to increase their speed.
I know, crazy times. Financing the state spending with printing money alway led to inflation in history on the longer run.
How long is long run?
Average annual rate of inflation in US has been under 2.7% for 30 years. For past 10 years it has been under 1.7% on average.
When do you expect this high inflation?
Note that central banks typically have a target of 2% annual rate of inflation.
If you use a forty or fifty year period you get a significantly higher rate. I believe the actuarial industry assumes a long term inflation rate of 3% – that includes an assumption that periods of low inflation like the current period will be balanced by periods of higher rates like the period centered around 1980.
Nick,
The 1970-1980 period was unusual, From sept 1980 to Oct 2020 the average annual rate of inflation was 2.66%. From Jan 1947 to Dec 1969 the average annual inflation rate was 1.84% per year.
From Jan 1970 to August 1980 the average annual inflation rate was 7.33%, clearly this period was anomalous, one can plan for 3% inflation to play it safe, or even plan for 7% inflation.
The very long term rate of inflation for the US (1913-2020) has been 3.3%, but again if we consider 1913 to 1967 the average inflation rate was 1.85%, 1968 to 1981 was 7.26%, and 1982 to 2020 was 2.6%, perhaps we will see a second oil shock like 1973 to 1982, but I doubt it.
I know what you mean, and I hope you’re right. But…actuaries disagree with that approach. I dealt with actuaries that advised on large pensions funds, and their analyses of investment returns and required contributions assumed a long-term rate of inflation of 3%. AFAIK, that’s the industry standard.
Honestly, I think people who were in their formative years in the 60s and 70s will never get over their fear of inflation, no matter what the prospects.
Alimb,
I agree that the risk of inflation in the US is reasonably low, and that the risk of deflation is somewhat higher. On the other hand, if you think hyperinflation is just a one-time thing, ask Venezuelans, or Argentinians, or many other people around the world who are seeing it now, or have seen it very recently.
Have you read “This Time Is Different: Eight Centuries of Financial Folly”?
Trump was dying to cause inflation: at the peak of the business cycle (when he was cutting taxes!) he was attacking the Fed for not inflating further.
The price of financial stability is eternal vigilance.
$120 billion a month might not be enough. For two reasons. Not all of that is buying the long end of the curve. The 10’s and 30’s. being the long end. Majority of the debt is short term debt. And the treasury is issuing a mountain of debt that has to be bought. If the FED doesn’t increase it’s buying then the money has to come from somewhere besides the FED. That would put upward pressure on rates.
Mortgages interest rates are tied to long dated US treasuries. Truth is we have another housing bubble that is even bigger than the one that popped in 2008. That don’t mean it is going to pop anytime soon. But if mortgage rates go up 0.5-1.0% from here we have problem.
All rates have to go lower in order to expand debt from where it’s currently at. Any rise in interest rates is contractionary. There is a reason banks in the US are long US treasuries to the tune of $4 trillion plus. It’s because of low interest rates. And while they can make fees loaning money out. They can’t get interest income that the use to get. So they buy bonds knowing they can force the FED hand to buy them at a higher price.
Inflation is the last thing the FED wants. QE is interest rate suppression and volatility suppression. Nothing inflationary at all about it.
If the FED doesn’t hold rates down. We have another Lehman like moment when the banks get blown out of their long bond positions. And they all either get bailout out or collapse.
Could be the prefect crisis in the making to usher in MMT where there is no bond market or banks. And the treasury spends money into existence. Without debt being attached. And everyone gets a digital wallet or account with the treasury. And inflation is controlled by taxes instead of interest rates. All of which will be a complete disaster in my opinion.
But until that happens. We have to lower interest rates to expand debt. And the FED has to make it happen. Otherwise we blow up. It don’t matter who the next president is. All that matter is if the FED can hold it all together or not.
I’m in the camp that bonds maybe aren’t as safe as they are perceived to be. And while the FED can step in a buy them. They can’t prevent a sudden mass exit of bonds. Due to front running the intro of MMT.
There isn’t much room to lower rates further without going negative. So you either go negative or debt stops expanding and goes into contraction. This is the problem the FED has right now.
If covid disappeared overnight. And demand returned to normal and everybody went back to doing everything they use to before covid. We’d still have the same problem.
Ovi
A better number to consider is OPEC’s 12 month average maximum C plus C output.
I agree they might never hit that again as Venezuela may never recover. Libya looks like they might get back to 1400 kb/d and I don’t know about Nigeria. Eventually Iran might reach a new agreement and might return close to their 2016 level. All told the 7 million in current cuts plus another 2 Mbpd for Iran and Libya would give us about 9 Mbpd, that gets us to roughly 33 Mbpd, whether Iraq or KSA can increase output at a higher oil price level is not known.
I would say tbe odds are a coin flip.
Dennis
Looking at a centred moving average, It appears there is a rough plateau between July-16 and May-17 where output runs between 33,500 and 33,580 with an average close to 33,550. So if 33,550 is the target, that reduces the new output target by 861 kb/d, which still may be a struggle.
Ovi,
Thanks for the chart, excellent. The 24 Mb/d for October plus OPEC full output ( 7 Mbpd) and Libya 1 Mbpd and Iran w/o sanctions 1 Mbpd, gives us 24 9=33 Mbpd getting us pretty close to the previous plateau. Can any more resources be developed, that might have been put on hold due to lack of demand for OPEC C plus C? I don’t have the answer, but I suspect OPEC resources could potentially be developed more quickly if needed.
I agree it may be a struggle to return to that level of output, if a rapid transition to electrified transport occurs, there might never be demand for that much oil in the future. Potentially OPEC might react to falling demand with a war for market share where OPEC falls apart. Under such a scenario OPEC develops their resources as rapidly as possible for fear of having oil in the ground that is of little value and under such a scenario we might see OPEC output (it would be former OPEC as it will cease to exist) rise to levels above the present peak plateau and non-OPEC output will be driven to zero as the higher cost non-OPEC resources will no longer be economically viable. This scenario envisions Brent crude prices (in 2019$) falling to $30/bo or less as OPEC members and Russia compete for market share in a all out price war, only the cheapest oil will be produced under such a scenario, few ultra deep offshore new field development, new oil sands development projects, or tight oil resources can be profitably produced at $30/bo (2019$) or less.
Dennis
I think that the CV vaccine is the game changer here. I think that by December 2021, the US, China, Europe, Australia, New Zealand will have achieved very close to herd immunity. That means that we may be only a few Million barrels per day of demand below the 83 Mb/d that were being produced in Jan 2020.
So I think that demand from there will slowly climb to one of your scenarios of increasing demand peaking around 2026 to 2030. The critical player going forward will be the US, depending on the price of oil and the availability of money from investors, who will probably more skeptical of the pitches they get from drillers.
Happy Thanksgiving to you and all of our US followers.
Thanks Ovi,
Not a holiday up there, but stay safe in any case, Canada is definitely handling this better than the US, hopefully better leadership at the national level in the US will help, but it looks like it will be a long winter in the US. Winter is coming. 🙂
Ovi,
The head of the WHO Tedros Ghebreyesus has already stated even with a covid vaccine there will still be restrictions.
Covid is a ploy to enact what President Jimmy Carter called ‘strict conservation’ of energy.
Peak demand is a misnomer. How can demand peak happen when an extra 1.2 billion people are to be added to the planet in the next decade?
Covid is about population control and resource management. Covid or some other manufactured disease will be with us for some time to come.
“Covid is a ploy to enact “..
“Covid is about population control…manufactured disease ”
Hume. This isn’t an audition for a false reality (trump variety) show. Most people are interested in ideas based on truth and science.
” How can demand peak happen when an extra 1.2 billion people are to be added to the planet in the next decade?”
One way is the possibility that the collective global citizen just can’t afford to buy as much fuel.
A second way is the continuation of a trend where each unit of GDP requires less fuel.
One way is the possibility that the collective global citizen just can’t afford to buy as much fuel.
Inexpensive electric transportation will be available. Whether it’s used plug-in light vehicles, or e-bikes, it will be affordable.
So, fuel won’t be unaffordable, it will be over-priced compared to the alternatives.
Hickory,
According to a BP report existing proven reserves of oil and gas will be depleted in 47 years. Coal in 133 years. Less if it’s used to replace petroleum and natural gas.
At what point would look to preserve some semblance of our current way of life?
Denying the population access to energy they’ve come to take for granted will lead to mass social unrest. Give them a reason (protection from a deadly disease) to forego those privileges and they become amenable to the idea.
Hume,
“Denying the population access to energy they’ve come to take for granted will lead to mass social unrest. Give them a reason (protection from a deadly disease) to forego those privileges and they become amenable to the idea.”
I really don’t follow this line of thought at all. Are you saying that Covid was “manufactured” with the goal of reducing petrol consumption, as some grand conspiracy or plan? If so, sorry man, I’ve got no use for wild attempts to massage reality into some bizarre conspiracy story.
Hickory
“I really don’t follow this line of thought at all. Are you saying that Covid was “manufactured” with the goal of reducing petrol consumption.”
I think you’re being a tad disingenuous. We’re both on a website called PeakOilBarrel speculating when that peak might arrive and how the world will cope when it does.
No I believe (as I have stated before) the coronavirus was initially China’s idea, since the trade deal they had signed with America put them at a disadvantage. Having to buy X amount of U.S. soybeans, shale oil etc etc they could readily source elsewhere and at a cheaper price. China triggered a pandemic clause within the agreement. An exasperated U.S. decided to follow suit and take the world with them.
The systemic problems with the global economy requires a financial reset and since the world economy has been put on ice, what better time?
Though what started out as a trade dispute has morphed into something else. Here in the UK the government has brought forward plans to ban all new petrol and diesel vehicles by 2030. £3.2bn has been allocated for cycle lanes and traffic calming measures. These aren’t small cycle lanes either. In many cases they take up half the available road.
My point is many western countries are looking to decarbonise after a century and half of non stop pollution. Are they really worried about climate change or the fact the energy source we all rely on is dwindling with no viable alternative at our disposal.
the fact the energy source we all rely on is dwindling with no viable alternative at our disposal.
Except that The Powers That Be don’t believe that. Which is a good thing, because it ain’t true.
If you really think that TPTB believe that there’s no substitute for fossil fuels, please provide support for that argument.
Hume. It would all be pretty funny , except for the part that you believe what you have said.
I’ve heard enough.
During my youth I could buy an ice cream cone for 5 cents. Is it really kosher for the government to steal 2% (or more) of our savings every year?
Sure. There are a number of reasons, but think about it: most of the time you can deposit your money in simple accounts (think CDs or Treasuries, if you have a lot), that pay more than the rate of inflation, but you have to make a commitment to keep your money there for a while, so someone can use it productively. Letting money sit around in a short-term money market account means that it’s wasted, not being used productively.
Think in term of investments, rather than money. You have to DO something, rather than taking no risk, making no commitment, and expecting to get paid to do it.
“You have to DO something” Yes. lose your money and find that government taxes all gains but limits deductions for losses.
I dunno. 15% long term capital gains tax is a pretty nice perk. And, isn’t it nice to be able to depreciate buildings even while they’re actually appreciating…
Robert Wilson,
Do you not understand the tax rules, the losses are carried forward to the next year until all losses are deducted at 3000 per year, it is not complicated at all.
Those are the rules, we are a nation of laws.
So how come when you take out a credit with a bank, the bank is allowed to create money ex-nihilo, but if you can’ t pay the bank back, the bank is allowed to take things you own?
Schinzy,
Again those are the rules, if you want the money, you put up collateral, otherwise no loan. It is a contractual agreement.
Because money isn’t a real asset, it’s just a means of exchange.
It may help if you think of the bank loan as “credit”, rather than “money”. The bank gives you the ability to buy stuff, but if you buy stuff and then your business fails, you’ve actually destroyed the value of that stuff and the bank loses the value of the loan. That’s a real loss, which is why banks often fail.
When the bank could create money out of nothing, they could never fail. But they do fail – so they can’t create money out of nothing.
They can give you the right to buy stuff (for example a car) – but the car dealer wants real money from the bank, which has to get it from somewhere. And if they can’t – Lehman.
The balance you see at the bank is only from thin air, that’s right. But in the moment you want your money to do something out of the bank, they have to transform it to money backed by the central bank.
And your 1 million $ in a bank account are null and void when a bank goes Lehman.
So the bank takes your money (if you pay in, for example when shallow gets his oil payed), gives you a XXXX number on some electronic cash account and pays out your money short after for Joe buying his new F150 truck he buys on credit.
After this, the bank has a account to pay back xxx at you, and Joe has to pay xxx to the bank. If Joe doesn’t pay and the truck is stolen, the bank has a problem when you want to get back your money (generally speaking). They can show you the number on your account but can’t give you the money.
I know that’s in very short, but that’s the system. And that ‘s the reason why they can just create your credit out of nothing (it’s only an internal note first) – but they can’t create the money if you pull it. And that’s the reason why you need a very big bank if you want to finance a very big project (for example a canadian oil mine).
Schinzy,
Here’s another way to think about it: the bank doesn’t create a net asset. I know, money feels like an asset, but from your point of view the bank creates a positive credit amount, which you can spend, which is paired up with a negative loan amount, which you have to repay. From the bank’s POV, the credit is a negative, which is paired up with the positive loan. If they give you the credit, but you don’t repay the loan, then the bank is left with a big negative.
If that happens a lot, the bank goes under.
Maybe you should keep your savings is something other than cash.
Robert Wilson,
The alternative is deflation, we could have a nice depression like 1929-1938, good times. 🙂
Read some economics so you are better informed.
Quoting Dennis–“we could have”– That is a hedge phrase which suggests that you do not know what we will have. We could also have something like ‘Not worth a Continental’ Or ‘Save your Confederate money, the South will rise again.’ I have been studying fiat money since the inflation of WW2 and have witnessed more than one episode of deflation. I understand velocity. I was once a fan of the late Franz Pick. (Pick’s Currency Year Book). Fiat money is potentially infinite. Goods are finite.——————————- PS thanks for your work on this site.
I think Dennis meant that “we could choose”, by which he meant that we could go back to the gold standard and thereby choose a currency which would force the economy into deflationary recessions/depressions.
Goods are finite, its true. And the sales of goods in the US has been pretty much flat since about 1970. We have enough cars, TVs, washing machines, houses, etc. And yet the economy continues to grow. Why? Because services continue to grow, and the quality and capability of “goods” continue to improve: cars, TVs, houses and phones are dramatically higher quality and more powerful than they were back then.
Should we choose to shackle ourselves to gold because we don’t trust ourselves to manage our money supply? I understand your concern: Trump, for instance, was delighted to risk high inflation in order to make himself look good. It’s very possible that we’ll screw up and create hyperinflation. But we’re doing ok, so far.
The price of financial stability is eternal vigilance.
Nick,
If we continue to have competent people involved with the Fed in the US, we will be ok, but there could be black swan events which I do not foresee, I just think the odds are low (say 1 in 30) we will see an inflation episode as severe as in 1967 to 1982 (7% or higher average annual inflation rate over a 15 year period) over the next 50 years.
Robert,
Of course I hedge when talking about the future, basically we are talking about things that are unknowable, perhaps there will be hyperinflation in the US in the future as severe as the 1967-1982 period, my expectation is that this will not occur, if I were to bet I would say the odds are at least 20 to 1 that my expectation is correct.
Dennis,
John Williams at shadow stats uses the old U.S. methodology for calculating inflation and he’s on record as saying the real rate of inflation is 10% year on year.
Hume . I also tend more to trust John Williams than BLS (Bureau of Lies and Shit) .BLS inflation figures are as good as their unemployment calculations . 30 million file for unemployment benefit and the unemployment rate hardly ticks . Funny they don’t include rent ,energy and food in their calculations . Excuse , these are volatile . Well they were not volatile before Greenspan became FED chairman . Also they have a method called ” hedonistic ” inflation which is a joke . Have you recently purchased a house , paid for your son’s college, visited the hospital , purchased a car, purchased groceries . I have commented earlier we will have ” inflation in all things essential(except oil) and deflation in all things non-essential “.
P.S : This is with reference to USA . In Europe I pay nothing for my son’s college . Last month got two surgeries, my gall bladder removal cost me $150 , got TURP on my prostate cost me $250.
Hmmm, let’s see about those shadow stats. Between 2012 and 2016 oil prices were about $120. So if inflation were 10%, the price would have increased about 46% in four years. So the price would be about $175. In fact, the price is more like $45. So inflation certainly hasn’t hit the oil industry.
In fact, the entire industry is suffering from deflation.
Alimbiquated , you said ” So inflation certainly hasn’t hit the oil industry.
In fact, the entire industry is suffering from deflation.” You are correct .
That is what I commented. “Inflation in all things essential(except oil) and deflation in all things non essential.”
About 8 to 10 years ago we bought a TV for $2500. Yesterday I walked into a drugstore and they were selling a 60 inch one for $499.
So my question is, does it make sense to keep using the old system for calculating inflation.
Ovi , simple question . How many Tv’s will you buy in your lifetime ? Today you have a LCD Tv , you won’t die if you don’t upgrade to a 4 K . How many sausages , minced beef, rice and bread will you buy in a week (leave alone a lifetime ) ? Try postponing this and you will understand what my definition is . ” Inflation in all things essential (except oil) and deflation in all things non essential ” is true .
Hume,
The shadowstats are nonsense. A better estimate is billion prices project
http://www.thebillionpricesproject.com/datasets/
The basket of goods that consumers use changes over time, so using the 1982-1984 basket made sense in 1983, but not in 2020.
Hole in head,
The basket of goods used by the CPI includes energy, food, housing (including rent and owner equivalent rent)
see
https://www.bls.gov/opub/hom/cpi/concepts.htm
Dennis,
That reminds me of something related to our earlier discussion of long-term inflation: the Fed uses PCE instead of CPI, and the PCE index tends to be roughly .3% lower than CPI. That means that when the Fed targets 2% inflation, they’re targeting roughly 2.3% CPI.
I’ve never owned a TV, and I’m in my 70’s.
Did have one around when living with working class girlfriends in LA in the 1970’s.
The more you watch, the less you know, from my observation in hotel rooms.
Alimbiquated,
Oil shouldn’t be trading at $45 dollars. If world supply of petroleum is tapering off and demand is rising. How can prices be falling?
Nick,
If one compares chained CPI with PCE price deflator from 2000 to 2020 they are very similar, 1.81% for chained CPI and 1.78% for PCE price deflator, a difference of only 0.03%, so perhaps a 2.03% inflation target, note the FED made this change in 2000. For the standard CPI the annual rate of inflation from 2000 to 2020 was about 2.04%, so yes a 0.26% higher rate for CPI compared to PCE price deflator since 2000. The FED thinks the chained type index is a better measure as it accounts for substitution as relative prices of goods changes. At some point congress will catch up to the latest economics and may enact legislation that used the chained CPI (which the BLS has published since 2002).
FED has every other central bank out there at the end of the barrel of a gun. Right now I am not seeing anything that the other central banks are doing to try to weaken their currencies working. Some are expanding QE others are going negative with interest rates. And only getting at best results that last a few weeks before their currencies again start to appreciate. The ECB Europe’s central bank is up again next in Dec. My guess is that whatever they come out with. More QE or even more negative rates will not work to weaken their currency.
FED is going to export the US deflation overseas like it or not. What does a strong Euro do to Germany’s economy? Or a strong Lonnie do for Canada’s economy? Or a strong Kiwi do for New Zealand’s economy? New Zealand is probably going negative interest rates soon. Their central bank is openly talking about it laying ground work to do it. And the Kiwi is right now the strongest currency out there.
Now what do higher oil prices as this trend plays out over next 3-4 years do to these economies? If you understand the plumbing of China’s system. High oil prices are their death knell if sustained for any amount of time. They’ll run twin deficits and be like Argentina. And I’m going to assume unless your an oil producer high oil prices are a big negative for you. Especially when you have high debt levels.
This is the kind of stuff that starts wars. Because you have no way out if you can’t do it through devaluation.
HHH, that is a very interesting evaluation of where we stand today . Tks .
USD/CHF and USD/JPY are both in consolidation patterns. Possible long-term bottoms on both of them coinciding with a long-term bottom in 10 year US treasury. I trade the actual break of the patterns. Not before the break. It’s all guess until then. But if these pattern break to the upside we get higher yields on bonds. If these patterns break to the downside 10year US treasury yield sink towards zero.
Negative yields sink the dollar. As the tsunami of money leaves not only that but the last 10 years of dollar appreciation against other currencies unwinds. So you have domestic and foreign money leaving the US at same time.
Oil gets $100 in a damn hurry. And doesn’t give a crap about supply/demand dynamic or covid.
On the other hand higher yields might bring a slow grind higher in oil prices as long as the narrative of recovery continues.
A variety of updated projections on peak oil-
https://www.reuters.com/article/idUSKBN2870NY
Peak Oil is in the rear view mirror–
We all know, it happened in Nov of 2018.
It may be passed, but I would not hold your breath.
HT , neither do I . What is important is POD (Peak oil dynamics ) as Rockman has annunciated . The date ,year month are not important . It is only a data point . It is what ” Peak oil” does to our living style . Viagra is a small pill but it does wonders , on the same level ” Peak oil” will do wonders for society but in the negative direction . Sorry to disappoint , but when were wonders supposed to be positive ? Ask the dinosaurs, were they wondered when the meteorites hit earth .
We can wander around and not view peak oil.
However, peak production is in the rear view mirror.
However, creative writing is kinda cool!
Redefining something self explanatory, is an exercise in creative writing.
HT , I agree 100% .
Hightrekker and Hole in head,
There have been many previous peaks, perhaps 2018 will be the final annual peak, I think we will see the 2018 peak surpassed by 2022 (perhaps 2023) output willlikely continue to rise until at least 2027, I expect a plateau for a couple of years (perhaps lasting until 2032), the actual peak output year might be anywhere along this plateau (with World C C output in the range of 84 to 85 Mb/d over that 5 year period.)
Of course this is speculative as is every scenario of the future (it is by definition creative writing as the future is a story that is unwritten).
I think the peak will be more believable when it is coupled with high oil prices, like 2008, the “peak” in 2018 was a case of overproduction to prepare for quotas at OPEC to reduce the market imbalance, and of course the current low output is due to lack of demand leading to low oil prices. The coming peak (2027 to 2032 would be my guess at roughly a 60% probability it will fall within this time frame) is likely to be associated with high oil prices (likely above $80/b in 2019$) imho.
Hi Dennis,
I’m in pretty much agreement with you. I still see another recovery in the future and transportation transformation is still basically a decade off. But, the next peak isn’t going to be much more than the last one because of efficiency. The EIA balance sheet is currently showing product supplied down 9% from a year ago. A year from now, most of us will have been vaccinated, Covid in the rear view mirror and demand closer to 3% down from a year ago. Maybe more like 2024 before a new peak. Maybe a little sooner if the Dem’s win Georgia and Biden gets a 3 trillion stimulus package. If they loose, a lot slower recovery like 2009. Republicans prefer monetary policy vs. fiscal policy. It keeps the rich drowning in cheap money and the little guy subservient.
It also sounds like Biden wants to address climate change big. To me, that means the end of new light weight ICE by 2030 and that’s going to put us on the back side of peak shortly after because of demand. Also, don’t be surprised if Biden sticks it to Russia and makes nice with Iran.
That’s my Wild Ass Guess today
Agree on new peak likely after 2024, it will take time to recover, also possible 2018 will be final peak, I would say about a 60% probability it will be after 2022 and only a 10% probability the peak will be later than 2030 with about a 50% probability it will occur between 2022 and 2030.
Thanks Hickory, most of the projections seem pretty reasonable. I am doubtful about the lower BP estimates, I wish I was wrong, but even I am not that optimistic.
I am less concerned about the actual date or amount of peak oil, than
just how gradual or rapid the down slope of the supply curve will be.
A slow down slope can be handled by the worlds economy, especially now that electric transport is ‘here and now’, meaning it is technologically on center stage and it is affordable.
A fast down slope is a whole different story, since it will take a solid decade or two for the inventory of current ICE vehicles to be cycled through the system and replaced.
Thoughts about that transition:
US light vehicles consume about 70% of transportation fuel, so they’re key. 50% of US light vehicle miles traveled come from vehicles less than 6 years old (new vehicles are driven more), so it only takes 6 years to replace 50% of their fuel consumption.
In the mean time:
Light vehicles only carry an average of 1.2 people. Want to reduce their fuel consumption by 50%? Raise that number to 2.4 people per car. How? Carpooling, which can be implemented literally overnight, with phone apps. That would be hard to do right now, but covid won’t last forever.
Telecommuting – we’re seeing right now how well it works.
There are 230M light vehicles in the US, but only about 50-70M people commuting every day. The average light vehicle burns 23MPG, but there are plenty of cars getting 40MPG, and of course many getting 50 . Higher prices and rationing could push people into the more efficient vehicles.
Car ownership turns over about every 3-4 years. There’s lots of opportunity for moving the most efficient vehicles to the people who need them.
Yes, there a lot of things that could get done if it was a national priority, but short of a crises I don’t expect that kind of urgency. So, it will likely take much longer than the best case scenario, to adjust to declining oil production.
For example, most Americans would have to be pretty desperate to consider carpooling. Count me among them.
Well, are we worried about a crisis, or aren’t we? If a fast down slope of oil production happens, what will we do to reduce oil consumption quickly?
The simple answer is to replace existing vehicles, through attrition, with ones that use less or no petroleum. Again, the average vehicle on the road in the US uses 23MPG. Replace a 15MPG SUV with a 30MPG hybrid cross-over and you’ve reduced consumption by 50%. Replace an ICE with an EV, and you’re done reducing your personal consumption. A single consumer can do that literally overnight. But if everyone wants to do that, it’s a “rush for the exits”, the supply of hybrids and EVs will be inadequate and someone will have to wait a little while to get their shiny new vehicle.
So, what do you do while you’re waiting for a year or three?
You can telecommute. Shop online. Give your SUV to your teenager, and take back the Corolla she’s been driving. Take an Uber hybrid. And, finally, carpool with just one other person to cut consumption by 50%. About 10% of commuters carpool, more than those who take a train.
Inconvenient, but not The End Of The World As We Know It.
Hey Nick,
I agree with Hickory, carpooling isn’t going to be revolutionary and safe us from our demons. Although, I have heard of Uber drivers who pick up one fair going to work and another on the way home for extra money. For me, I don’t want someone I don’t know riding with me. Picking them up or waiting to get picked up. It’s much quicker and easier to abide by the speed limit(which no one does) or a little under the limit and save 25% on fuel and repairs.
EV’s and renewables is were I would put my money. The answer is to stop building new ICE, ASAP
Nick- “You can telecommute. Shop online. Give your SUV to your teenager, and take back the Corolla she’s been driving. Take an Uber hybrid. And, finally, carpool with just one other person to cut consumption by 50%. About 10% of commuters carpool, more than those who take a train.”
Thats all nice for the sector of the world that lives in an urban, prosperous, white collar world. But for most of the world, that just isn’t particularly relevant.
There are other ways to cut fuel though- like slowing down and cutting out frivolous use.
@Hickory
I know car pooling from the 80s, where it was very common with blue collar workers from factories.
Since shifts begin the same minute for everyone, and end the same minute car pooling was very easy to organize even bevore the age of internet.
It was common sense everone owned a car (most times a cheap one), and driving rotated. Otherwise there was some financial compensation.
Even low and middle range white collar jobs car pooled a lot, since it was the time before flexible work times – no overtime working, just 7.30 to 16.00 with 30 minutes lunch for everyone.
The traffic jams have been big, too, with everyone starting the engines the same time.
Hickory,
My best guess oil shock model with total World C plus C URR of about 3000 Gb (conventional and non-conventional declines at about 3.1% per year on average from 2041 to 2100 (assuming demand for oil does not fall faster than this rate).
Chart below, note the 2018 peak is surpassed in 2025 for this model with final peak in 2028 at 83.7 Mb/d. Also the odds that this scenario is correct is approximately zero, the future remains unknown until it arrives.
Not planning on vaccination. The data is quite scarce.
The Oxford vaccine appears to be winning the global sales fight. That could evolve to be a problem. Americans who want a vaccine will or will not have a choice? The non-american vaccine won’t require super expensive Refrigeration down to -70 degrees C.
That has been the big incentive for other countries contracting to buy the Oxford vaccine.
The move of the population out of cities might not stop, even with an effective vaccine. If the vaccine’s performance turns out to be exaggerated, that out migration will accelerate. That will increase the distances required for travel, and thus oil consumption.
It’s a credible scenario that the virus turns out to be the greatest boon the oil industry has ever seen.
Moderna and Pfizer COVID-19 vaccines are the first out of the gate, and being mRNA, are 90%+ effective.
The Pfizer does need to be stored at -70C, and both are more expensive (quite) than the Oxford vaccine.
The Oxford also has only a 60%+ effective rating with full dose on first vaccination.
Let’s see how this unwinds.
Ironic that one who purports to be concerned about the effect of the pandemic on the oil industry would then consider refraining from vaccination. It sends the message that any concern over the economy/oil demand is not so genuine.
There will be much more data on these vaccinations within 2 months, when the supply for the general population begins to become more available.
I think the virus will be a permanent hit to oil consumption.
For all the office worker, a few days of home office per week will stay. A lot of business air travel will be replaced with video conferences, too. A transatlantic or transpazific business trip gets fast into a cost range of 10.000$+, and corona has shown in many cases it works without it.
Video conferencing software will get better, and with specialized video conferencing rooms it will get even better, creating an illusion of a shared conferernce room. So it can be even used for marketing meetings.
I notice this here everywhere. Government organizations, where homeoffice was IMPOSSIBLE, had it online in a few weeks. Consulting where it was mandantory, suddenly where going to Windows Teams.. We had even productive starts of big software packages in factories (where every day of chaos costs a million) where only a small base team was on shore, and the rest in home office.
And this will stay – instead of panick travelling additional team members, they will just log in in future (and can start working in minutes, not after 6 hours of flights and taxis).
You should be correct about this.
However, we have noticed with the working from home deal has also come a failure to get the work done issue.
For example, we have been waiting for things from our state’s regulatory office for months. We send emails inquiring, with little response. Basically,” you and the field inspector have done everything on your end, don’t worry, we will get to it eventually.”
The field inspectors have been out the entire time and have been getting the job done. If working from home is so efficient, what is with the holdup we are experiencing?
Maybe they are in the situation my family living in the big city is in. No in person school, so one parent tries to work from home while also making sure the elementary school aged kids stay engaged online. I know that hasn’t been too efficient.
Shallow sand
Should improve when covid is past and kids are back in school. The work from home can continue for those who prefer it.
I imagine people will be at the office for 2 or 3 days with other days at home for those whose jobs allow.
The EIA official tight oil estimate for October Permian basin tight oil output is 19 kb/d higher than September output (Sept=3875 kb/d and Oct=3894 kb/d) in fact Permian basin output has increased every month from June through October 2020, increasing from 3459 kb/d in May 2020 (low point so far in 2020) to 3894 kb/d in October 2020. Perhaps Permian tight oil output will decrease in November 2020 and perhaps the conventional output in the Permian region has decreased (the DPR includes both conventional and tight oil output in the 7 regions covered.)
US frac spread count has been increasing since May, so it seems likely tight oil output may continue to increase, the frac spread count matters more than rig count because there are DUCs which are in the pipeline waiting on completion, so frac spread count is where the rubber meets the road as it were. The DPR would be more accurate if it used frac spread count in its model.
For Nov 13, 2020 (last report I have available) the US frac spread count was 130, up from 70 on August 14, 2020 and 50 at the end of May 2020.
Dennis.
There have been a lot of mergers and bankruptcies in shale, meaning new management and new money to drill and complete more wells, regardless of whether it makes sense to any of us.
Shallow sand
My Permian model suggests a low level of completions makes sense if STEO oil price forecast is correct with oil price rising from $45/bo at the end of 2021 to $70/bo in June 2030 in a linear fashion.
Of course we don’t really know future prices but this roughly matches STEO and AEO from EIA, both of which are often wrong about future. 😉
Exxon big write down of gas holdings.
If you don’t measure things in dollars this is a non event. The gas is still there.
Watcher,
Under cuurent law the gas will be produced if it is profitable to do so in long run. Laws can change, future is unknown.
Frac spread count, data from
https://www.aogr.com/web-exclusives/us-frac-spread-count/2020
most recent 4 week average frac spread count for US (includes both oil and natural gas focused spreads) is 127, for 4 weeks ending 11/27/2020, the october 4 week centered frac spread average was also 127 and in June it was 73 and May was 48 (the low point in past 12 months for 4 week average frac spread count was mid May 2020.)
Article on frac spreads
https://www.worldoil.com/news/2020/9/11/frac-pumping-volumes-lowest-since-2017-as-shale-slowdown-continues
Snippet from link above:
After the number of active U.S. frac crews bottomed out at 100 in mid-May, 40 crews have been put back to work, mostly in the Permian Basin of West Texas and New Mexico, according to Coras.
A new US Production thread has been published.
http://peakoilbarrel.com/us-september-oil-production/
A new Open thread Non-Petroleum has been posted.
http://peakoilbarrel.com/open-thread-non-petroleum-december-1-2020/