Folks who follow this blog know that I am a data hog. That is I track data from the US as well as production from the rest of the world. But there are periods during the month when there is just no new data coming in. During the first 10 days or so of a month is such a time, almost no new data is posted anywhere. So I try to find something else to post. It is on the oil production in the Gulf of Mexico.
The last data point on all charts is March 2014. All data is in barrels per day except the first chart below which is in thousand barrels per day.
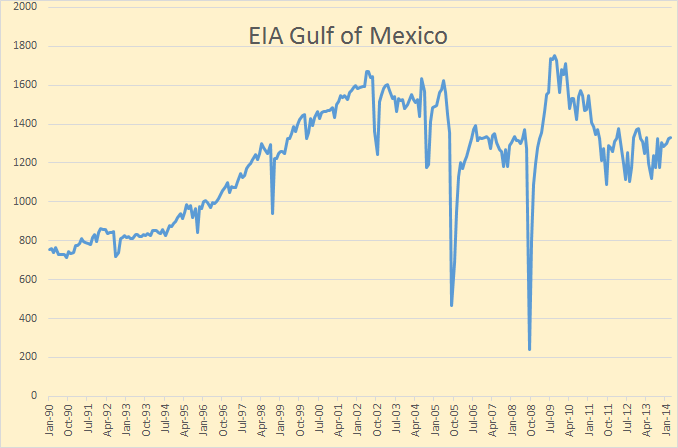
The EIA gets their data from BSEE, (Bureau of Safety and Environmental Enforcement), a branch of Department of the Interior, not the Department of Energy as you might expect.
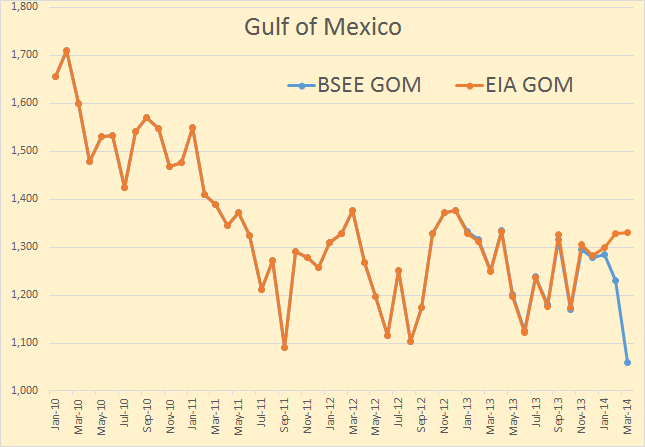
The BSEE is a little like the Texas RRC, that is they report the data they have even though they know it will be revised later. The EIA on the other hand, estimates where they think the data will be after it has all come in. So the chart above shows where they think production in the GOM will be after all the data comes in.
The few deep water leases that I follow seems to have leveled of somewhat. The charts below reflect final data for these platforms. When a company reports their production numbers it is seldom if ever revised. The problem is late reporting, not bad data reported.
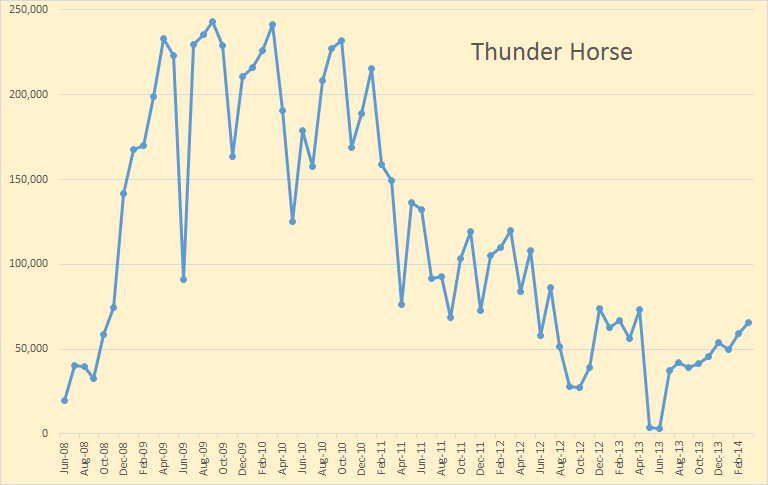
Thunder Horse peaked in 2009 and 2010 then declined pretty fast. But after shutting down for maintenance in June and July of last year they seem to have stopped the decline. Thunder Horse produced 65,563 barrels per day in March.
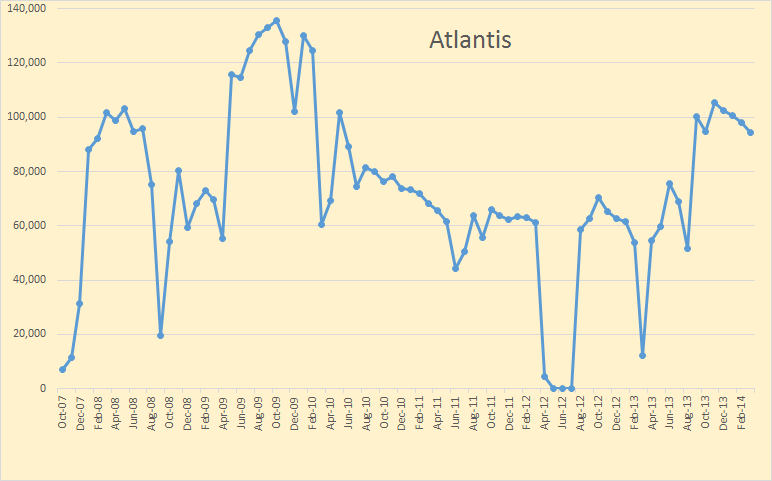
Atlantis has had erratic production throughout its history but as of late has increased production somewhat. Atlantis produced 94,440 bpd in March.
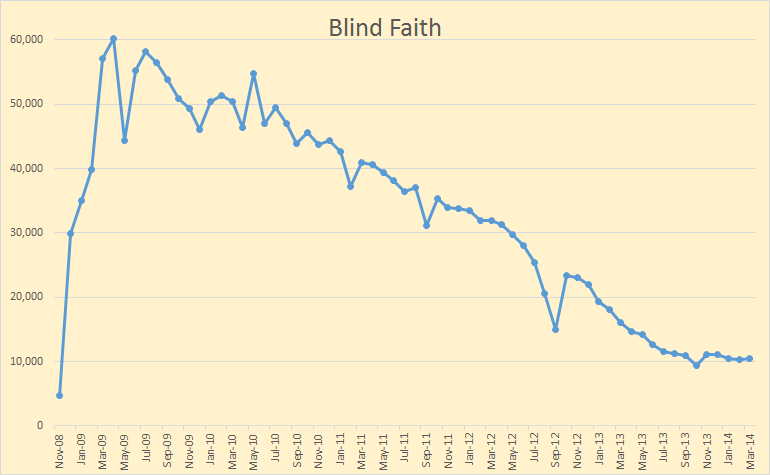
Blind Faith declined steadily for about three years but has leveled out somewhat now. Blind Faith produced 10,456 bpd in March.
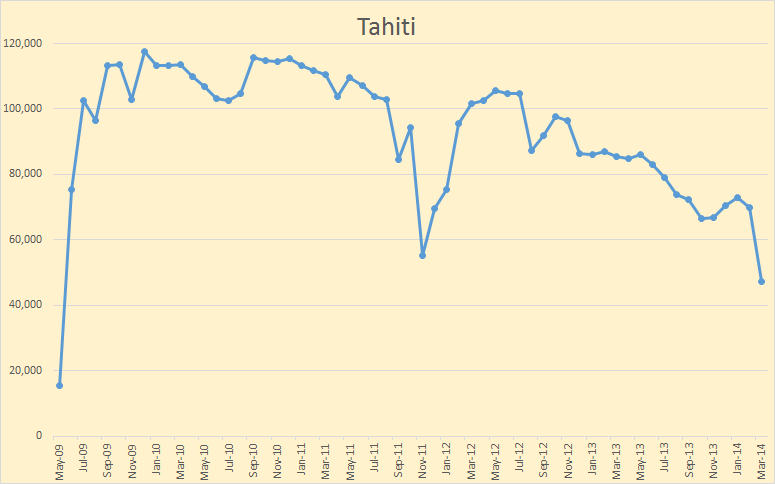
Tahiti held up best of all but has now started to decline a little faster. Tahiti produced 47,273 bpd in March.
News Jacking:
This article came out last month but is important enough to bring up now.
Washington‘s Shale Boom Going Bust (The government, not the state.)
To read the headlines, it seems that the USA has emerged out of the blue to the point of becoming the world’s oil and gas production giant. All thanks to the Shale Revolution. Recently President Obama made various noises that the US could solve the Ukraine gas dependency on Russian gas because of the spectacular growth of extracting natural gas, and more recently, oil, from shale rock formations across the US. There’s only one thing wrong with this picture—“It ain’t gonna happen…”
I don’t recall anything about Obama and oil in the news, but the author of the article is correct, it ain’t gonna happen.
No one expects the President of the US to have the time or the scientific background to delve into the geophysical complexities of shale energy. He naturally relies on competent advisers. What if the advisers, instead of being competent, like in so many government agencies today, are in the sway (and sometimes perhaps pay) of the shale energy companies and their Wall Street investment bankers who have hundreds of billions of dollars riding on promoting the shale hype?
The current US Shale boom is being sustained on steroids, otherwise known as the Fed’s never-ending Quantitative Easing zero-interest-rate policy, a stance that shows no sign of reverting to normal interest rate levels as the economy continues to be depressed since the collapse of the 2007 real estate mortgage securitization bubble. In effect, shale drillers are able to keep in business only because Wall Street and other investors continue to throw money at them like it was falling from trees. Tim Gramatovich, chief investment manager for Peritus Asset Management LLC, an $800 million fund, notes, “There’s a lot of Kool-Aid that’s being drunk now by investors. People lose their discipline. They stop doing the math. They stop doing the accounting. They’re just dreaming the dream, and that’s what’s happening with the shale boom.”
That is really a great article. Some folks are getting the message and some are still spreading bullshit.
Tight Oil, Shale Gas to Drive Lower 48 Production from RigZone.
Wood Mackenzie estimates that 21 billion barrels of light sweet crude oil will be ultimately recovered from the Bakken and Three Forks play in the Williston Basin, higher than the U.S. Geological Survey’s (USGS) April 2013 updated estimate of 7.4 billion barrels.
Got that? 21 billion barrels! That is 20 billion barrels more than the area has already produced. The Bakken, this year,reached the 1 billion barrel mark, in cumulative production, two thirds of that in the last three years. If the Bakken were to reach 1 million barrels per day, and hold production at that level, then it would take 55 years to produce that other 20 billion barrels. From Wood Mackenzie no less!
From Wiki: Wood Mackenzie is a global energy, metals and mining research and consultancy group with an international reputation for supplying comprehensive data, written analysis and consultancy advice.
It makes absolutely no sense that anyone with even the slightest knowledge of shale production in the Bakken could come up with such a very stupid estimate. Why would Wood Mackenzie make such a silly prediction? They have to know that is absurd. If they don’t then they deserve to lose every client they have.
But the IEA is slowly but surely getting the message. There have been numerous reports lately about the IEA warning of how much oil OPEC is going to have to come up with to meet the estimated future demand for oil. Here, from the IEA’s web site, is an article that estimates how much it is all going to cost, else… who knows?
World needs $48 trillion in investment to meet its energy needs to 2035
But only about half that is for oil, the other half is for power generation, transmission and $8 billion for energy efficiency. In other words we have to keep throwing money at this problem, a lot of money, about $2.3 trillion per year. What this tells me is the economies of the world, or most of them anyway, must remain sound and strong and that goes for the world currencies as well. If there is a hiccup, like the scare of peak oil throwing panic into the markets, then the whole thing could go to hell in a hand basket pretty fast.
142 responses to “Gulf Of Mexico Crude Oil Production”
Ron, Great post..
Wondering what a graph of Liquids ( and Gas ) production Shelf vs DW GOM would look like?
I would also Donald but the BSEE does not seperate DW vs. Shelf. They just mix them all together. They give you the total and you can get the production for each lease. But there are way too many of them to track each one, hundreds I would guess.
Sorry.
Hi Ron –
Re data collection from many wells…
I setup a function to download all Eagle Ford well production numbers, monthly, for all fields (wells?) in the EF, from Texas RRC (TRRC), in Excel. Dennis clicks on a button and the sheet clicks through every field, downloading all of the updated monthly data, current and previous months as well, for each field. When the function finishes downloading the data – all of it in ready-to use table format, one sheet per field, it aggregates everything together into a single consolidated sheet. The function takes about thirty minutes (30) to download and format all of the sheets …. Thirty-eight sheets altogether (38).
I imagine a similar function could be done for GOM, and others, if the data is out there.
I could not resist the temptation to reply with this link to a Wood MacKenzie tweet.
BSEE actually does break out shallow and deep water on at least an annual basis (they use 1000′ water depth as the cutoff.) I have tracked the data from 1985-2012, but am not tech savvy enough to be able to include in this post. Since about 2009 deepwater has accounted for about 80% of the production.
How would I either insert a picture, or an excel chart, in a post?
thanks
SouthLaGeo Wrote:
“How would I either insert a picture, or an excel chart, in a post?”
See below the “Post Comment” Button. There is a option “Select an Image for your Comment”. hit the “Choose” Button and select an image that is stored on your Machine.
Hi SouthLAGeo,
To insert a chart just use the box at the bottom of the comments for any png, jpg, or gif type picture file. You could also e-mail your spreadsheet to me at dcoyne78 at gmail dot com and I will forward it to Ron.
To post a chart:
Use the “select an image for your comment” below the “post comment” button.
Just click on the “Browse” button and find the folder where the chart is saved on your computer, enter the file name then click the “open” button and then click “post comment”. It usually works.
Groovy,
Hopefully the snip shows up.
In order to get to the data go to the BSEE website -> E&P tab -> Production -> Gulf of Mexico Region -> Deepwater Production summary by year
wow! Crossover was 1999…
Since DW accounts 80% of current GOM Liquids Production
Whats NG % ? How do Shelf vs DW avg depletion rates compare?
Must be order of magnitude difference in drilling and P&A costs.
I think I remember reading someplace that offshore oil production world wide passed dry land production sometime back in the late eighties or early nineties world wide.
Somebody here probably knows for sure.
Is there any news on the Mexican situation?
I guess it will take them a year or two at least to get a few outsiders actually out in the field – or on the water- and working to restore their production.
My guess is that IF they really do make an honest effort to partner with some independent companies their production will trend up again for a few years at but that it probably won’t get close to their previous peak.
Other folks may have good reason to think differently.I don’t know if they have any promising new unexploited territory left or not.
Did Wood Mackenzie manage to come up with a production curve for how that oil is extracted? That’d be amusing. Are people supposed to slant drill from Minnesota?
That Wood Mackenzie analysis of the Bakken first came out in April of this year. There was a much mention about it in the news at that time like the article below. Looks like they might be on another media tour now to get people to pay the big $$$ to read their reports/predictions.
Bakken Oil Output Seen Growing With Improvements in Drilling
Improved drilling techniques will help oil production in the Williston Basin outpace steep well-decline rates, boosting output by more than 70 percent to 1.7 million barrels a day by 2020, according to Wood Mackenzie Ltd. energy analysts.
Producers such as Continental Resources Inc. (CLR:US) are drilling wells faster and have had early success with downspacing, or increasing the number of wells per acre, said Jonathan Garrett, a Wood Mackenzie upstream analyst in Houston. They are also beginning to tap into more shale rock layers than the Bakken formation, which is part of the basin and has been the primary source in making North Dakota the U.S.’s biggest oil-producing state, after Texas.
The research released [April 2nd] by Wood Mackenzie, an energy consulting firm based in Edinburgh, comes amid increasing concern in the industry over potential hurdles of shale wells. Their output declines by 60 to 70 percent in the first year, according to Austin, Texas-based Drillinginfo Inc. Traditional wells take two years to fall by about 55 percent before flattening out.
“Even if the rig count stays flat, drilling efficiencies will grow and operators will continue to downspace their plays,” Garrett said by phone yesterday. “Even with steep decline rates, you should still be able to add production.”
Hi All,
The 21 billion sounds pretty ridiculous and I agree that it is a very optimistic estimate.
One possibility is that this number is barrels of oil equivalent(boe) which includes natural gas.
The ratio up till now as been about 80% oil and 20% natural gas in boe. So let’s make that assumption which would move this estimate to 17 Gb of oil.
The April 2013 USGS estimate for the Bakken had a range of estimates for undiscovered technically recoverable resources (UTRR), the F5 (5% probability that more oil will be discovered) UTRR estimate was 11.4 Gb for Montana and North Dakota.
Remember that this is “undiscovered” TRR, to find the TRR we need to add oil produced already and proved reserves. That number as of Dec 2012 was 3.8 Gb (3.2 Gb of proved reserves) for North Dakota alone.
The total TRR at the F5 level is 3.8Gb + 11.4Gb= 15.2 Gb for all of North Dakota and Montana.
This may be an overly optimistic assessment, but consider that the USGS mean estimates in 2008 for the Bakken and 2011 for the Eagle Ford were 50% too low for the Bakken and at least 40% too low for the Eagle Ford. The optimists may believe that the 2013 USGS Bakken/Three Forks assessment is also too conservative.
My models assume the 2013 Bakken/Three Forks assessement (at the F50 level) is roughly correct and that another 3.3 Gb will be discovered in the Eagle Ford beyond the 2.7 Gb of proved reserves plus production through Dec 2012. Note that this 6 Gb TRR for the Eagle Ford is 1 Gb less than David Hughes’ October 2013 estimate for the Eagle Ford.
Now Doug Leighton would probably point out that nobody pays any attention to TRR and he is certainly correct that it is economically recoverable resources (ERR) that are what matters and I agree.
The ERR will always be less than the TRR, how much less depends on the price of oil, well costs, operating expenses, royalties and taxes, interest rates, and the cost to transport oil to refineries. The TRR is just a starting point, if it is 15 Gb, the ERR cannot be more than that and it could be much less.
Using reasonable economic assumptions (similar to Rune Likvern’s economic analyses) to find point forward profitability, the ERR is about 83% of the TRR in the Eagle Ford and for the North Dakota Bakken/Three Forks the ERR is about 88% of the TRR.
If these ERR estimates are similar for the higher TRR estimates of about 17 Gb, at 85% we would get an ERR of 14 Gb for all of the Bakken.
A better way to do this would be to ignore Montana (which I have not analyzed due to lack of data). The North Dakota portion of the Bakken Three Forks has about 79% of US Bakken/Three Forks(BTF) resources so if the 17 Gb estimate were correct for all of BTF for the North Dakota BTF TRR would be 13 Gb and at 85% of this level ERR would be about 11 Gb, this very similar to the USGS F95 estimate and only 22% higher than the USGS F50 estimate which results in an ERR of 9 Gb.
I am doubtful about the potential resources in Montana where I know nothing of the tax rates well costs or average well profiles. If we make the simple (and probably highly inaccurate) assumption that the ERR to TRR ratio will be similar in the Montana BTF as in North Dakota, it would imply and ERR of about 2 Gb for the Montana BTF at the F50 level and an ERR=3 Gb at the F5 level. When the sweet spots run out of room in North Dakota, the drilling focus may move back to Montana and maybe this level of resources could be extracted, if costs are similar to North Dakota. Time will tell.
When the sweet spots run out of room in North Dakota, the drilling focus may move back to Montana and maybe this level of resources could be extracted, if costs are similar to North Dakota. Time will tell.
You are assuming that drillers have been concentrating on the North Dakota Bakken and when the sweet spots start to decline they will say something to the effect: “Hey, I got a great idea, let’s move over to Montana and start drilling there!”
Bad news Dennis, they had that idea several years ago. The surge started in Montana at the exact same time it started in North Dakota, mid 2011. The Montana Bakken sweet spot was smack in the middle of Richland County. It peaked in July and August of last year and is now in decline. Notice that the borders of the Montana sweet spot is much better defined than the McKenzie and Mountrail County sweet spots. That means they drilled outside that sweet spot and got zilch.
Actually Ron the Bakken surge was earlier than you realize in Montana, I looked into this earlier in 2013 when annual data only through 2012 was available. See chart below (data from state of Montana).
I realize that you can predict the future with much greater accuracy than I can 🙂 , but the fact remains that at present there is much more Bakken drilling activity in North Dakota than in Montana.
My guess is that the average new well EUR is better in North Dakota than Montana at present. What happens when the average new well EUR falls in North Dakota? Fewer wells will be drilled and if the prospects in Montana are better than the remaining prospective wells in North Dakota operations will shift. Just as they shifted from the Elm Coulee play in Montana to North Dakota in the past.
Note that in the North Dakota Bakken 2002 production was 1.9 kb/d in its most productive month and in 2006 the most productive month was 10.6 kb/d about 5 times less than average 2006 Montana Bakken production.
Over the 2006 to 2008 period North Dakota Bakken output increased while Montana was decreasing, average North Dakota Bakken annual daily C+C output only surpassed the Montana Bakken in 2008, when it reached and average annual level of 75 Kb/d.
Dennis, call me an artist if you will, but the Montana/Dakota graphic is quite telling. Ron’s interpretation of Montana well concentration seems correct; folks who wandered off the sweet spot were slapped down by dry holes. Montana appears kind of over.
Hi Anonymous,
I tend to agree that Montana might be done. In the past (in 2008 for the Bakken where 3.65 Gb was the mean estimate and the increase in proved reserves plus production from Dec 2007 to Dec 2012 was 3.8 Gb) USGS estimates have been too conservative. If the 2013 mean estimate is accurate then the 2008 estimate should have been 7.45 Gb for the Bakken alone(not including the Three Forks). The 2008 mean estimate was more than a factor of 2 too low.
The USGS mean estimate for the Montana Bakken/Three Forks is 1.6 Gb, this seems too high, but in 2008 I thought the 3.65 Gb USGS estimate looked high as well (I was wrong then, and I may be wrong now as well.)
When North Dakota starts to peter out production may move to Montana or to shale plays elsewhere.
Hi Anonymous,
A nice video below of the wells drilled in Montana
(thanks D. Miws)
Montana is currently less attractive than North Dakota, in the future this may no longer be the case (once the sweet spots are fully drilled up in North Dakota).
I was speaking of the month when the number of wells drilled per month more than doubled.
Since that date Bakken wells have increased by a factor of 2.94 and Bakken oil production has increased by a factor of 2.85.
That is why I refer to July 2011 as the month the Bakken surge started, and I will continue to do so.
I thought you were talking about a surge in Montana. I don’t have data on the number of wells drilled in Montana, so if you look farther back in time, you will find that there were a number of doublings of the number of producing wells in the North Dakota Bakken on the way to 2011.
I pay much less attention to single month events, but looking at the data, the doubling (or more) in a single month happened on many occasions between 2006 and 2011.
I tend to focus on 12 month averages to get an idea about the overall trend. If you look at 12 month trailing averages of the change in number of producing wells each month, with a log scale to show better the rate of increase, the surge was in the 2007 to 2008 period where the 12 month average increased from 6 to 35 wells added per month over a 2 year period.
The doubling from Jan 2011 to March 2012 was impressive, but in the earlier period the number of producing wells was doubling every 9 months. The 2009 recession slowed this down until early 2010.
So now I know what you mean by “the surge”, I would have put it in 2008.
I forgot to add,
What makes you think there was a surge in Montana
in 2011? That small uptick in production from 2011 to 2012? Most people would put “the surge” in the Montana Bakken from 2002 to 2005.
Sorry, my mistake. The surge started about three months later in Montana.
Hi Ron,
You are charting all of Montana, which is not just the Bakken, what does the chart look like if you go back to 2002?
Hi Ron,
On a log scale, which reflects “a doubling” much better there are many “surges”.
Dennis, why not just keep it simple. The number of wells more than doubled in one month in July 2011.
End of story.
Ok Ron you win, but the number of wells more than doubled in one month in 2006, 2007, 2008, and 2009 as well.
Only the June 2011 date is significant.
Oh for God’s sake Dennis, just look at the damn chart I posted below. Then tell me that the same thing that happened in July 2011 happened four times earlier and those three times is just as significant.
The doubling from Jan 2011 to March 2012 was impressive, but in the earlier period the number of producing wells was doubling every 9 months. The 2009 recession slowed this down until early 2010.
Okay, a 12 month average is exactly that, 12 months change averaged out. But it really happened in one month, July 2011.
How do you measure significance? Absolute change in number of producing wells, or percentage change in number of producing wells?
You may not understand a logarithmic scale, because the log chart clearly shows there is nothing special about July 2011. End of story.
By the same logic, a logarithmic scale of the U.S. economy would show nothing significant happened in late October 1929. Or a logarithmic scale or the progress of WWII would show that nothing significant happened on June 6th, 1944.
Dennis, you know and I know that “single events” cannot be measure on a logarithmic scale. The surge of drilling rigs into North Dakota and the new wells they started drilling in July 2011 was an event. Okay, let’s go over it one more time. Single events cannot be measured on a logarithmic scale. (Unless, of course, the entire measurement is a measurement of that one event as it is in the case of an earthquake.) They cannot be measured on a logarithmic scale because they happened only once.
Look at the chart just above once more. Look very hard. Squint if you must. See if you can see any point on that chart where something significant happened. Hint, look at where the arrow is pointing. Oh, and that plunge in December 2013 was a very bad weather event, causing the number of producing wells do drop dramatically. That was also very significant also. But of course that show up as not significant at all on a logarithmic scale chart either.
Dennis, why do you persist with this nonsense. It happened once, and you want to measure it on a logarithmic scale to make it seemingly go away? Give me a break!
Edit: I do understand what logarithmic scale is. Please don’t insult my intelligence.
Hi Ron I posted two charts with logarithmic scales. The second chart shows that on the log scale the June 2011 surge is no different than earlier surges.
The 1929 stock event would show up much better on a log scaled chart by the way.
Whether it is a single month (or single day) event makes no difference.
On a non-logarithmic chart, the 1929 event you mention would disappear, because the DJIA (or GDP, depends on what you want to look at) was so much lower then compared to now, so you are making my point for me by using 1929 as an example, it shows up better on a logarithmically scaled chart.
The significant time is 2008, that’s when the activity started to get rolling in the North Dakota Bakken.
Dennis, are you aware of exactly why logarithmic scales are used? When is it better to use a linear scale and when it is better to use a logarithmic scale instead?
A quick glance of places where we use logarithmic scales and places where we use linear scales would give us a hint.
Places where we use logarithmic scales:
Measuring the magnitude of stars
Measuring the size of an earthquake
Measuring sound in decibels
And there are many others but these three give us a hint. A logarithmic scale is used when the maximum figure is hundreds of times, sometimes thousands of times, the size of the smallest figure to be measured, or logged .
Linear scales should be used on all places where there are not vast differences between the smallest and largest points to be measured, like stock or commodity prices, number of oil rigs or the number of wells drilled and so on.
I have been an astronomy reader for years and therefore I am very familiar with the logarithmic scale. For instance A star that is five magnitude numbers lower than another star is exactly 100 times brighter. A magnitude 1 star is 100 times brighter than a magnitude 6 star. A magnitude 6 star is the dimmest that can be seen with the naked eye. Pluto is magnitude 14, (at its current position in its 248 year orbit of the sun.). The Hubble Space Telescope can see magnitude 30 stars but earth based telescopes can only see stars up to about 26 or 27 magnitude.
Okay, I hope I have made my point. We should only use a logarithmic when there are vast differences between the smallest point to be measured and the largest. Therefore: Using a logarithmic scale where such vast differences in the size or magnitude of points to be measured do not exist is totally inappropriate.
I hope I have made my point and we can close this chapter.
Hi Ron,
A logarithmic scale on one axis, with a linear scale on the other is commonly referred to as a semi-log plot. It is often used to reveal an exponential relationship, which will appear as a straight line on a semi-log plot. Petroleum engineers use them to analyze well output and forecast future output based on output to date. It is not used only in the cases you cite.
Dennis, regardless the use of a logarithmic scale graph to show the number of additional wells in the Bakken is inappropriate and just plain silly. Why in God’s name would anyone do such a silly thing? Unless of course they wanted to display the additional wells as far less than they actually were.
The number of wells more than doubled because the number of rigs more than doubled during that period.
I really don’t understand what your problem is Dennis. The surge in production clearly started mid 2011!
Bakken field production reaches 1 billion bbl mark
Two thirds of the total was produced in the last 3 years, Continental said.
The Bakken has been producing oil for more than 60 years. But two thirds of all Bakken oil, that was ever produced, was produced in the last three years. That is since the surge began in mid 2011.
If that is not the definition of a surge then I am at a loss for words.
Can we please close this discussion now?
In the chart below I plot Montana C+C from 1986 (annual data from the EIA in kb/d) and Montana Bakken C+C (from state of Montana).
Initial surge in 2002, secondary surge in 2011.
The Drillinginfo blog posted an animation a couple days ago showing how activity in the Bakken moved around the last 10 years or so.
Richland County Montana was where the Bakken Elm Coulee field was discovered about a decade ago and most of the drilling there took place around the 2004-2006 time.
The Elm Coulee field was one of the most significant finds in the history of hz drilling in the Bakken formation.
http://info.drillinginfo.com/visualizing-bakken-formation-activity/
Thanks. Very interesting
Hi all,
Now that I have read the article it is clearly 21 Gb of oil, not 17 Gb as I incorrectly assumed.
So let’s assume 79% of this is in North Dakota (based on the USGS estimate of the North Dakota to Montana split of the Bakken/Three Forks resources. In that case we have 17 Gb of TRR in North Dakota and if 85% of that is economically recoverable resources(ERR), ERR=14 Gb. The USGS F5 TRR estimate is 13 Gb(remember we need to add proved reserves and production of 3.8 Gb to the 9 Gb F5 North Dakota Bakken/Three Forks estimate of “undiscovered” technically recoverable resources). The ERR would be about 85% of this or 11 Gb, so the Wood MacKenzie estimate is about 27% higher than the USGS F5 estimate.
The article notes that the USGS assumed 4 wells per acre, which is correct and that many companies are testing higher density drilling especially in the Three Forks. Where they may be incorrect is that they assume these tests will be a long term success and can be widely applied in North Dakota and Montana, if this key assumption is correct, their forecast may also be correct. I share Ron’s skepticism and also think the USGS F5 case is pretty unlikely (as in a 1% rather than 5% likelihood). Unlike Ron I do not think a 2.5 Gb URR is very likely and think that the ERR will be at least 5 Gb (remember that proved reserves plus production were already at 3.8 Gb in Dec 2012 and the USGS F95 estimate for Bakken only in North Dakota is 2.2 Gb for a total TRR of 6 Gb). Such an estimate assumes no output from the Three Forks formation and a reasonable ERR/TRR ratio of 83%.
If we continue to assume no Three Forks output, but use the USGS F50 estimate we get TRR=7 Gb and ERR= 6Gb. Finally if we use the Three Forks F95 estimate of 1.3 Gb combined with the F50 Bakken estimate for a TRR of 8.3 Gb and an ERR of 7 Gb.
A very conservative estimate of the ERR of the North Dakota Bakken/Three Forks is 6 Gb+/-1Gb. Note that David Hughes estimate is at the low end of this estimate at about 5 Gb, no doubt he is aware of something that I have missed or he may be skeptical that there will be much economically recoverable oil from the Three Forks formation.
It is very possible that he may have updated his thinking since October 2013, at that time the EIA proved reserve estimates only were available through Dec 2011 and were about 1 Gb lower than Dec 2012, it is quite possible that he might presently estimate 6 Gb rather than 5 Gb. He said earlier he plans an update soon.
The article notes that the USGS assumed 4 wells per acre, which is correct and that many companies are testing higher density drilling especially in the Three Forks.
Okay, I did the math. The Bakken is from 3,000 to 3,500 square miles. Using the lower figure of 3,000 square miles, 640 acres per square mile, and 4 wells per acre comes to 7,680,000 wells.
That does seem like a tad too many. 😉
Yes that is clearly wrong, James Mason estimates 4 wells per square mile, but your estimate of the area of the Bakken is too low, Mason estimates 12,000 square miles in North Dakota. So 48,000 wells if the formation was uniform (which is clearly not the case). His estimate when this non-uniformity is estimated is 39,000 wells. Link to paper below.
http://solarplan.org/Research/Mason_Oil%20Production%20Potential%20of%20the%20North%20Dakota%20Bakken_OGJ%20Article_10%20February%202012.pdf
For the Bakken the USGS uses 440 acres per well or about 1.5 wells per square mile, for the Three Forks they use 407 acres per well or 1.6 wells per square mile. So we get about 17,500 Bakken wells and 18,900 Three Forks wells, for a total of 36,400 wells.
The NDIC estimates about 42,500 wells will be drilled, my 9 Gb ERR estimate (based on the mean USGS estimate) has 34,800 wells drilled by 2041.
Thanks for the correction!
The attention getting sentence is how “downspacing” is going to offset well decline.
One guesses the rationale is if one can downspace to less than frack distance and NOT LOSE ANY PRODUCTION, then one can indeed drill more wells on a given lease.
But I’m pretty sure we were all over this some months ago when EOG or CLR posted an investors’ briefing showing diagrams of frack distance and attempts at consequent down spacing and the production quoted was not universally the same or better as a non downspaced well. If you downspace and cannibalize oil from the adjacent well, you buy nothing by paying for the extra well.
This thread (number of wells/acreage-sq. miles/downspacing, increasing productivity, etc.) gets to the heart of why there seems to be such diversion of opinion on future Bakken production (and, by inference, many of the other emerging shale plays).
Last fall Continental announced results of its first downspacing project – the Hawkinson wells. The 13 wells produced an IP of over 14,000 boepd. This was on a Drilling Spacing Unit (DSU) of 1 mile by 2 miles (1,280 sq. acres) with 1,320 ft. between laterals. Six months later, the ongoing production is on track to produce near one million barrels per well over the expected lifetime of the wells.
Their newest pilot development – the Rollefstad wells – had an IP of 26,460 boepd from 11 wells.
They are currently doubling the number of wells on four separate megapads by putting the laterals 660 feet apart. Their is a growing recognition that highly stimulating the reservoir with bigger, more numerous fissures CLOSER to the wellbore enables much higher flow while enabling more laterals on the DSU.
These operations will be repeated many times over throughout the Bakken.
Quick side note on the rapidly evolving pace of technology … Whiting surprised some of the participating analysts in their May conference call when they described using Coiled Tubing conveyed stimulation (in its latest iteration). Not only did they frac 60 stages in an eye-popping 24 hours (an 80 stage frac is to be done shortly in the Niobrara), this latest development allows live-time monitoring and adjusting of the frac. The IP was 70% higher than an adjacent year-old well. Most significantly, this completion design will enable companies to re-enter these wells multiple times over the coming years (decades?) to economically re-frac.
Absent an awareness of all these types of continuing, ongoing, relentless productive innovations, predictive analysis is apt to err.
We really need to keep a database on this sort of thing.
First comment would be that my recall of the diagram indicated that the frac distance was 3D and the high producing wells were tapping Three Forks depths as well as hmm either it was lower or middle Bakken with the same well. I also recall that the well population were not all performing the same.
Second comment would be that hell yes, 60 frack stages will flow higher IP, but it will also be 10 million pounds of proppant on unpaved roads. Fracking in 24 hrs is not the critical path of the task; hauling material is.
Another thought occurs — the pressure pump. I think the physics say getting 1200 ft of 3D track radius on 30 stages can be done with a smaller pump than 60. Hmmm, is that true? If so, bigger pumps reqd, and may not exist?
That was typed on a Nexus. Badly.
The issue is . . . the pressure pump that can frack a 30 stage length to 1200 feet radius being called on to do 60 stages.
That’s more length of perforated pipe the pressure is pushed into. Doesn’t it require a lot more pump to do the extra 30 stages of length? Or is there something magical taking place were only one stage is done at a time and the rest of the length isolated from that pressure?
Anybody?
This is informative:
http://www.petroleumnewsbakken.com/pntruncate/182878313.shtml
That’s CLR talking about this enhanced recovery downspacing effort.
Items.
They are getting IP of 2800 boepd. If 70% oil that’s 1960 bpd IP.
They didn’t get it from all wells. That’s the average of about 8 wells. The ones that targetted TF3, the lowest TF layers, were disappointing.
What’s the magic? Brute force:
“Seven of the new completions at the Rollefstad unit were conducted using twice the proppant, 200,000 pounds per stage, compared to the company’s standard completion design and had an average IP of 2,675 boepd. One well was completed at three times the proppant and had an IP of 3,720 boepd.”
That would be 6 million pounds for a 30 stage frack, and 12 million (!!!) pounds for a 60 stage frack when up to the double level. The triple . . . 9 million and 18 million. Doesn’t count water.
No way in hell proppant prices don’t spike.
Hi Watcher,
It is just a matter of looking at the increased cost to complete the well with more stages and/or proppant vs. the value of any extra oil produced by the enhanced completion methods. In time we will have an idea of how much the average well cost increases and any increases in output.
So far it looks like well cost increases from 7.5 to 9.5 million and average well output has remained flat. I should probably adjust the well costs in my “silly” model.
Yes a new multivariate regression coefficient mapping silly to Industrial Production production restriction and now, 60 stages and 18 million pounds of proppant.
Good evening, Watcher. I do not know the details of the pump pressures and other specifics in the various types of stimulation procedures. However, this particular iteration of Coiled Tubing conveyed was used by Whiting – not Continental – this past April. To place a 60 stage frac done in 24 hours in some context, just four or five years back, performing a zipper frac of 30 stages in under a week was considered spectacular … several weeks faster than any previous stimulation. The effectiveness of this type is far more significant, however, than the time savings alone. Baker Hughes ‘Optiport” and NCS Energy Services have brief videos clearly describing this process.
Pad drilling is now allowing ‘batch drilling’ of 8, 12, 16 or more wells do be done at the same time as ‘baby’ rigs do the surface drilling and casing, then the big boys come and drill to Total Depth of 15,000 to 20,000 feet and set the production casing.
Anadarko is regularly drilling 15,000′ TD wells in under 7 days … a feat most any oil industry professional would swear was impossible just a few years ago.
The added cost for these enhanced frac jobs is – as both Continental and Dennis (see below) point out – about $2 million additional per well. However, the additional output of 1,100 boepd in your above mentioned real world example would seem to more than justify the expense. (An admittedly artificial calculation of $100/bbl oil price times 1,000 barrels [extra] for 30 days comes to $3 million.
I think these E&P guys know what they are doing.
Thank for the text coffee guy.
We’re on the outside hearing about technocopia in usually investor briefings and trying to read between the lines. In terms of production, at this point it seems clear that the greatest threat is the NoDak state industrial commission restricting output by decree. An alarming comment about this was made last month.
The next threat in terms of probability would be material constraints. The trucks max at about 80,000 pounds. 18 million pounds of proppant can get onsite only so fast. Then, of course, we know the oil is hauled by truck. All of this is concentrated in one county, which cries out traffic jams.
The CLR briefing did tell investors to expect better production in 2nd half of 2014 vs first half. The -50,000 BPD month was Dec last year, so they are presuming this year’s Dec will be warm.
What happens when we get near, or hit, peak oil? The “call on OPEC” gets louder and louder. 😉
Opec focus switches to supply challenge
The focus is no longer about reducing production but whether Opec can pump enough oil to meet the “call”, or demand for its crude, given the growing number of problems among its member countries.
“Raising, not limiting output is now the challenge for Opec,” says Energy Aspects, a London-based consultancy.
An “Interesting” What-If . . . .
Some definitions:
Global Net Exports (GNE) = Combined net exports from (2005) Top 33 net oil exporters, total petroleum liquids + other liquids (EIA).
Available Net Exports (ANE) = GNE less Chindia’s Net Imports (CNI)
CNE = Cumulative Net Exports (for a given time period)
ANE “Gap Chart” for 2002 to 2012, showing a decline in ANE, from 41 mbpd in 2005 to 35 mbpd in 2012:
http://i1095.photobucket.com/albums/i475/westexas/Slide04_zpsd68833b7.jpg
The following chart shows the GNE/CNI data from 2002 to 2012, with the extrapolation to the year 2030 based on the 2005 to 2012 rate of decline in the ratio:
http://i1095.photobucket.com/albums/i475/westexas/Slide1_zps9ff3e76d.jpg
At a GNE/CNI Ratio of 1.0, theoretically there would be zero Global Net Exports of oil available to importers other than China & India.
In any case, given the observed GNE/CNI decline, we can estimate* theoretical post-2005 Available CNE (Cumulative Net Exports).
Estimated Available post-2005 CNE:
(15 Gb/year X 25 years X 0.5) – 15 Gb = 173 Gb (billion barrels). This is ANE in 2005 times estimated number of years to zero ANE times 0.5 (to get area under a triangle) less 2005 ANE.
We can then estimate the rate of depletion per year in remaining Available post-2005 CNE.
2006 to 2012 ANE, billions of barrels, by year divided by estimated remaining Available post-2005 CNE (estimated simple percentage depletion by year):
2006: 14.6/173 (8.4%)
2007: 14.1/158 (8.9%)
2008: 14.2/144 (9.9%)
2009: 13.1/131 (10%)
2010: 13.2/118 (11%)
2011: 12.8/105 (12%)
2012: 12.8/92 (14%)
In other words, based on the above data, I estimate that we (theoretically) burned through, in 2012, about 14% of the remaining cumulative supply of Global Net Exports of oil available to about 155 net oil importing countries.
*I assume a triangular shaped net export decline. This method was too optimistic for estimating post-1995 CNE for the Six major net oil exporters (excluding China) that hit or approached zero net exports from 1980 to 2010, based on the seven year 1995 to 2002 rate of decline in their combined production to consumption ratio. For more info, search for: Export Capacity Index
The “Chindia Factor” ELM (or what I called ELM 2.0 at one time):
GNE have been slightly below 2005, but basically stable, but given an ongoing decline in GNE, unless the Chindia region cuts their consumption of GNE at the same rate as the rate of decline in GNE, or at a faster rate, the resulting ANE decline rate will exceed the GNE decline rate, and the ANE decline rate will accelerate with time.
GNE = Global Net Exports of oil
ANE = GNE less Chindia’s Net Imports
Hi Jeff,
How do you estimate China and India’s net imports? Do you assume that if their consumption has been growing by x% per year, that this will continue indefinitely? I also wonder about consumption growth in OPEC nations, at some point National Oil companies may prefer to sell oil for export rather than sell it in domestic markets where the price is 10 times less than World markets.
Do you attempt to account for these effects in your model? When we are talking about the World, where there is no other place to acquire oil the dynamics will be very different from the 6 country case. I also wonder if there haven’t been other countries that have become net importers since you did your original 6 country case, would adding those countries to the original 6 change the model in any way?
Chindia’s Net Imports (CNI) = Total petroleum liquids production + other liquids less total liquids consumption (EIA). As we have previously discussed, I ignore refinery gains. I defined the major net exporters in 2005 as those countries with 100,000 bpd or more of net exports.
Regarding the Six Countries, there is actually some overlap between the Six Country Case History and the (2005) Top 33 data base, and they are Vietnam, Argentina and Malaysia (VAM). In addition to the VAM countries, within the (2005) Top 33 list five more countries were below 100,000 bpd in net exports (or had arrived at net importer status) in 2012:
Syria (for obvious reasons)
Trinidad & Tobago
Yemen
Sudan (also political problems)
Denmark
If we called these countries the Five Country Case History, the data would look quite similar to the Six Country Case History. Denmark is a case history of a net oil exporter, showing a production decline, that taxes fuel consumption and that has successfully cut their consumption.
Denmark’s 2004 to 2012 rate of change numbers (EIA):
(P = Production, C = Consumption, NE = Net Exports.)
P: -8.0%/year
C: -1.9%/year
NE: -18.7%/year
ECI Ratio (P/C): -6.0%/year
In Denmark’s case, their 2004 to 2005 net export decline rate was 4.5%/year, while their 2004 to 2012 net export decline rate accelerated to 18.7%/year.
In simple percentage terms, a 47% decline in production from 2004 to 2012 resulted in a 78% decline in net exports, even as consumption fell by 14%.
Here are the mathematical facts of life:
ELM:
Given an (inevitable) ongoing production decline in a net oil exporting country, unless they cut their consumption at the same rate as the rate of decline in production, or at a faster rate, the net export decline will exceed the production decline rate, and the net export decline rate will accelerate with time (check out Denmark case history above). Furthermore, if the rate of increase in consumption exceeds the rate of increase in production, a net oil exporting country can become a net importer, prior to a production peak, e.g., the US & China.
As noted above, the “Chindia” ELM:
Given an (inevitable) ongoing decline in GNE, unless the Chindia region cuts their consumption of GNE at the same rate as the rate of decline in GNE, or at a faster rate, the resulting ANE decline rate will exceed the GNE decline rate, and the ANE decline rate will accelerate with time.
Let me try again. How do you estimate future imports for India and China? In a few of the OPEC countries oil consumption is over 100 barrels per day per 1000 people, in Russia it is one fourth this level. I can see why you assume China and India would be expected to increase their consumption, there will need to be a transition to less oil use everywhere, but especially in North America and OPEC.
I would expect we will see oil prices increase and at some point consumption will decrease, and we will start to invest (in North America) in public transportation.
What has happened is clear:
What will happen is less clear, but following is the extrapolation, based on the 2005 to 2012 GNE/CNI decline.
In any case, I don’t how many different ways I can say that given inevitable GNE declines, unless the Chindia region cuts their GNE consumption at the same rate as the rate of decline in GNE, or at a faster rate, the resulting ANE decline rate will exceed the GNE decline rate, and the ANE decline rate will accelerate with time.
And here is what we have observed since 2005: In terms of simple percentage terms, GNE fell by 3.5% from 2005 to 2012, while ANE fell by 14% from 2005 to 2012, due to Chindia’s increase in their consumption of GNE.
Public transportation has no particular value in Montana.
Nor North Dakota.
This is interesting:
http://www.statemaster.com/graph/ene_pet_con-energy-oil-consumption
Oil consumption by state. Texas #1 by about 2X vs #2 Cali. Lotsa trucks carrying oil around.
It’s clearly not purely population. Louisiana #5. Wide open spaces tell the tale.
You want consumption decline, you have to target industries. Shut down Hollywood. No more carting people around to film on location here and there. Shut down NASCAR (which probably burns less than Hollywood). No more art galleries. Totally useless trips there. No more gunshows. See, let’s make this lifestyle disruption politically homogenous. Shut down Broadway. And DisneyWorld. No tourism allowed.
No more air travel? That’s dicey. That kills FedEx and Amazon. And lotsa tax revs.
Only 43% of US consumption is gasoline. If you shave 10% off that, by forbidding drive in windows at McDs (70% of sales) you haven’t dented the total much.
Trucks airplanes and ships are 36%, probably untouchable, unless you want to kill FedEx and Boeing and Litton Shipbuilding.
Point is . . . China and India have no reason to restrain consumption. Consumption = GDP. In fact, if you want a good prediction of China’s future consumption, compound forward at about 6%/yr (they quote 7% GDP growth, but likely bogus).
Hmm. Why the hell is Louisiana burning so much.
I suspect it’s the refineries.
There is something wrong with that chart. They have Rhode Island consuming 23 times as much oil as Connecticut. That cannot possibly be right.
Frownable. They say it’s barrels/year.
Possibly not all from the same year, though if so, it would be 2001 (???)
sum is 6.7 billion, which is not bad at all, 18.3 mbpd.
So frownable, but they had to get something right to get that close to the final number?
http://www.eia.gov/state/
Not pure, but you can click on “consumption per capita” to get it ordered thus, and guess what’s #2 — Louisiana.
Weird.
Public transportation does help in more densely populated areas, the amount of fuel used in sparsely populated areas is pretty low. As prices increase, there will be more efficient use of fuel.
The amount of oil consumed in making movies is trivial because there just aren’t that many movie crews working on location at any given time.
And the amount of oil consumed by race cars at the track at a big race including practice is not over 8000 gallons per major event.This amount is is trivial compared to the amount consumed by the cars driven to the races by the customers. I think the last time I was at Charlotte there parking lots had well over twenty five thousand cars in them and probably at least five hundred motor homes.
The trucks that are used to haul the cars from track to track do undoubtedly consume a lot of diesel. There are about forty of them and they make a trip or two per week that probably averages three or four hundred miles round trip during the season.Eight to ten thousand gallons a week is probably a reasonable guess.
That would be enough every week to fly one or two jets a round trip to Europe so that the upper crust can see the sights.
I strongly suspect the football industry and the baseball industry and even college sports consume more oil than auto racing.
Nascar stages a lot smaller scale lower level events but there is only one top tier event per week. There are many times as many top tier pro football and baseball games and probably a lot more college events that draw fifty thousand spectators who arrive in cars than there are Nascar events.
This is not to say that when peak oil really starts to bite that we should keep on racing automobiles- or attending college football games.
I am not much of a racing fan and average attending one event maybe every five years but I do get very tired of football and baseball fans who seem to believe their favorite teams- which are invariably owned by billionaires – should be provided with stadiums at taxpayer expense.
Nascar to the best of my knowledge pays its own way as a matter of policy. I certainly haven’t heard of any public money being given to Nascar, or loaned at give away rates, to build tracks.I could be wrong about this of course.
The point got lost.
The point is there’s not a lot of consumption reduction to be found by “being efficient”. Efficiency is nearly maxed already. Kill Hollywood (and all trips to the theater) and you save little. Kill NASCAR and you save little.
When you have to cut, you’ll be cutting bone, not fat. People don’t do Sunday drives in the country anymore.
Watcher,
There are is a lot of fuel wasted by people in densely populated that sit in traffic jams on the way to work. Better public transportation solves that problem and higher fuel prices will cause a lot of people to use public transportation where it is available.
You are correct that it is of little help in sparsely populated areas. In those areas as fuel prices become really high, maybe the horse will make a comeback.
More horses in Wyoming than people, and more guns per household than people. Wyoming could become a Very Rich Place if demand for horses elevates and they become an exporter.
I am intrigued by the numbers for Louisiana. Gotta be refineries.
We should be able to profile traffic jams and stop lights. Average miles driven and average gasoline bill per year would tell us, based on avg 25 mpg, how much isn’t moving people around.
Oh another horse item.
They take a few years to grow to useable. If you use them too soon, the horse dies pretty early.
The rates of change in the ECI Ratio (ratio of production to consumption) from 2005 to 2012, by country. As noted above, eight of the Top 33 net exporting countries in 2005, had, as of 2012, hit zero net exports, or had fallen below 100,000 bpd of net exports–Vietnam, Argentina, Malaysia, Syria, Trinidad & Tobago, Yemen, Sudan, Denmark
That chart will look a lot different soon. Azerbaijan has peaked and is now in decline. Colombia has also peaked and Libyan production has completely collapsed.
Of the seven countries that showed an increasing ECI Ratio from 2005 to 2012, three of them were showing, through 2012, multiyear ECI declines since either 2009 or 2010–Azerbaijan, Kazakhstan and Nigeria.
Heckuva good job. I sure apriacpete it.
http://www.scientificamerican.com/article/faulty-blowout-preventer-contributed-to-deadly-bp-spill-in-gulf-of-mexico/
OFM:
rockman handled this at PO.com, under News; a piece on faulty tech still being used (horrors!)
I remember this from TOD, way back then. Not tech, but no one noticing that the drilling mud wasn’t holding the down-hole pressure. The boat captain that was receiving the drilling mud was the first.
You can’t fix stupid.
Energy XXI: Seeking A New Boom For The Gulf Of Mexico
This Friday [May 30], shareholders of Energy XII and EPL Oil & Gas are set to vote on the merger of their two companies, with EXXI paying $2.2 billion in cash, shares and assumed debt for EPL. Once the deal is completed, Energy XXI CEO John Schiller will run the only publicly traded, pure play oil and gas company focused in the shallow waters of the Gulf of Mexico. EXXI, as it’s known, will be producing 65,000 barrels per day, 70% of it oil, from fields across 633,000 acres, including 7 of the 15 biggest fields ever discovered in the Gulf….
[Schiller says] “One hundred dollar oil really broadens the possibilities. Two-and-a-half billion barrels of oil came out of these fields back in a $15 to $20 per barrel world. There’s at least that much left to go.” Indeed, if mature onshore regions like the Permian basin of Texas can undergo a drilling resurgence, then the shallow Gulf is overdue.
The past generation of offshore operators drilled vertical wells into those fields to suck up oil as if through a drinking straw. But today Schiller is taking a page from the onshore boom and drilling horizontal wells that will snake sideways through the reservoirs. These, he insists, will produce more oil, last longer, and generate better profits than the onshore shale oil wells in places like the Bakken and Eagle Ford, which have captured so much attention and investment in recent years….
But why can’t Schiller get any love from investors? At $21.80, shares are down 35% in three years. The company now trades (pre-merger) at just 16 times last year’s $160 million in net income. After shareholders approve the acquisition, the combined company will have roughly 110 million shares outstanding and pro forma 2013 net income of $270 million (about $2.45 per share).
Part of the problem is those shale plays. Investors in recent years have become so focused on the unconventional onshore plays like the Eagle Ford, Bakken, Marcellus and Utica that they’ve nearly forgotten about the horde of opportunities that still remain in the Gulf. The attraction of the onshore shale operators has been the seeming repeatability of their drilling campaigns. Because the shale reservoirs stretch under such broad swaths of land, the drilling process is repeatable, more akin to manufacturing than wildcatting. And yet there’s a harsh reality to the shale plays: though wells might come on strong,the decline rates can be so steep that a well that comes online at 1,000 barrels per day will often be doing just 300 bpd after a year. It’s a vicious treadmill.
The challenge for Schiller is to convince investors that EXXI not only has repeatable, predictable drilling opportunities in the giant mature fields of the shallow Gulf, but that the wells he drills will also come on stronger and last much longer than those onshore….
At a current 92 million barrels per day, world oil consumption has never been higher. Schiller has faith that once the American onshore oil boom levels out, investors will soon begin to appreciate the bounty that EXXI is sitting on. “Don’t believe this ‘the world is awash in oil’ crap. Thank God we added 3 million barrels per day in North America. Do you know where the price would be today without these shale plays? It would be $175 or $200,” he says. “The world is just consuming a vast amount of oil.”
Here is a link to a piece in Forbes that I find very interesting not for the content but for the gradual change in tone of the author and editor.
http://www.forbes.com/2010/01/21/biggest-oil-fields-business-energy-oil-fields.html
I have been reading this guys articles for a while now and the general tone has been cornucopian all the way.
But the word depletion is finding it’s way into his vocabulary as of now. The debate in the msm is now to the point that even the cornucopian element that preaches to the Joe Sixpack happy motoring forever choir has to recognize reality at some level.
So while the author acknowledges such facts as the decline of Mexican production, and the expense of getting tar sands to market, and mentions the decline of some other major fields, he spends most of his electronic ink on gushing about the prospects for Iraq to become a super producer and he has not mentioned tight oil in the US in this article.
I read between the lines this way. He is still pushing the business as usual line as hard as possible and the typical casual reader will as a result of reading this article put peak oil and higher oil prices out of his mind or at least way down on his list of things to worry about.
But the change in emphasis is solid evidence that Forbes and this author are repositioning themselves in terms of reporting on the oil markets. They do after all have strong vested interest in maintaining a certain amount of credibility with their regular readers and are probably hoping that most of them are not well enough informed to realize that Forbes is way behind in terms of reporting the real oil news instead of acting as a bought and paid for mouth piece for the business as usual community of banks, real estate , autos, and so forth.
I predict that we are soon going to be seeing a lot more references to the depletion of oil fields in the msm but it will be a while yet before msm actually EMPHASIZES what depletion means.
This Forbe’s guy doesn’t mention anything about the depletion rate of the thousands of smaller fields that supply most of the oil these days. Ya gotta have an iq of about one o one to understand why.His real job is mostly to keep Joe Sixpack happily half asleep and buying new gas hogs and tract houses and running up his credit cards.
But the real news is there and readily available to anyone with the brains to ask themselves what it is that he DOES NOT mention- the depletion of all the thousands of oil fields we are depending on OTHER than the giants and supergiants.
I gotta give him some credit, all things considered.
He almost comes out and says in so many words that Ghawar is now a doddering old man of an oil field. He is not far from simply badmouthing the Russian situation.He treats Mexico with what is actually pretty close to contempt.
Considering that this is Forbes………………….
Peak oil is gradually coming to the notice of the general public again.
Everyone who talks up sunny Iraq as the new Saudi Arabia should take a trip there.
Hi OFM,
Do you think Joe 6 pack reads Forbes?
I think there are a lot of fairly well to do people that have no idea about peak oil, the main stream media mostly focuses on the positive news about oil and gas so most people are really in the dark on this.
Well, this part is true.
Far more wells worldwide are plugged and abandoned in a given month than are drilled for new production in that month. We hear about none of them.
Yeah, to follow the “media” of CNN et all, one would think the Bakken was a fresh Ghawar. The misinformation is really, really bad.
Wall Street should be better, SHOULD, but there are two problems. One is that some bank analysts (Citi being the most infamous here) don’t understand shale production and so the stuff they give strategists has a false basis.
The bigger problem is that modeling the consequences of peak and near-peak is legitimately hard. Both the IMF and the Bundswehr (German army) came up with “here be dragons” for more severe declines in studies that otherwise were more mathematical.
Hi Dennis,
Just who Joe is depends on who is talking and the context.In this case, since I am doing the talking, and claim Humpty Dumpty as my authority, yes , Joe reads Forbes as much as he reads anything other than the sports pages. The audience is mostly investors and business people ranging from one horse operators to top level corporate management .
The dumber Joes will read such an article and conclude that everything is hunky dory. The smarter Joes will read between the lines and make a note to dig deeper elsewhere.
(A smarter Joe understands that Forbes can’t just come out and publish unvarnished facts; some whitewash is absolutely necessary to keep the advertisers happy and the circulation up.)
The article drops plenty of hints to that effect to anybody smart enough to recognize them for what they are.
Investors who read this sort of thing will fall out the same way. The smarter ones will realize that , hey, Mexico is a dead man walking, and water injection is keeping Ghawar alive like an IV drip on a Niagara scale.The smart guy will be thinking Tesla and maybe street cars or subways.The dumb one will be thinking Ford and Chevy.
(Humpty Dumpty famously said his words mean just what he intended, nothing more and nothing less.)
I have never thought the average banker is any smarter than the average plumber.The bankers I have met personally don’t have a clue as to the sort of stuff we talk about here.Neither does the average plumber but the plumber is usually more interested if a subject such as peak oil comes up.
The banker probably took an econ course and thus knows that running out of resources is an impossibility,lol.
Hi OFM,
I think of Joe 6 pack as more working class. Probably not a reader of Forbes.
I was formerly of just about the same opinion. But in recent times I have come to realize that just about everybody is as dumb as a fence post when it comes to the possession of any knowledge of the wider world of science and technology as it relates to people and economies.
I have a good lawyer but he is utterly ignorant of the sciences and energy.HIS opinion is that there is plenty of oil to be had- this opinion the result of reading the msm press. The last banker I had opportunity to talk to extensively- an old classmate met by accident after decades without contact- advises people on their investments. The only problems HE sees going forward involve taxes and entitlements.
I met another old classmate at my high school reunion who is an engineer. He seems perfectly comfortable with the idea engineers can solve all our problems if only we will get out of their way.He works in the heavy construction industry and thinks peak oil is chicken little foolishness.
You can graduate from over two thirds of the colleges and universities in this country without taking a science course according to EO WILSON who happens to be a real scientist and one of the very few Harvard professors to have earned both of the top honors that U grants to its very best teachers.My own experience talking to various acquaintances with degrees indicates that the situation may well be worse than that.
A brother in law who was boots on the ground all thru this country’s recent adventures in the Middle East from about 1990 on thinks I am a dummy for believing that oil is going to come up short because I did not personally witness the size of the army he was part of on the march to guarantee our access to it.He is a very intelligent man as men go with a degree in history.
In the end I conclude that just about all of us are Joe’s – just more prosperous ones that think we can prove status better with a BMW and Italian shoes than with a 4×4 F 250 and a Harley Davidson jacket.
Forbes posts a hell of a lot of stuff free online. Anybody from your maiden aunt who plays the stock market to the guy who has two employees who cuts your grass may be reading the free stuff.
The very name of the publication is enough to guarantee credibility with many such people.
And truth be told most of us are like ants or privates in the army who have very limited horizons and no time or inclination to expand them. Get up go to work come home try to relax a few minutes bed back to work…….. it is no wonder we are collectively so ignorant.
OFM,
There are many other attitudes to consider. (Thanks for the article).
re: “The dumber Joes will read such an article and conclude that everything is hunky dory. The smarter Joes will read between the lines and make a note to dig deeper elsewhere.”
Or, like my sister who is extremely intelligent and well educated, married to a WSU professor law/business…whose children are working at…one automotive engineer, one accountant/business manager, one stay at home mom with a masters degree…this beloved sister simply cannot entertain the thought of change and decline, nay, refuses to even consider it. I love her to death and we are very close, but when I explained the ramifications of the US dollar being a reserve currency of the day, but sales increasingly being made in other currencies (with example of latest Russia/China gas deal)…plus, a brief history of reserve currencies of the past ; she simply replied that she prefers to be more optimistic than I am.
This isn’t about Joe sixpack iq, it is about people unable to face change of any kind and who assume all is well with few bumps going forward.
And yet my brother last night remarked that, “You are simply too much an optimist” regarding facts and events.
I am a builder with enough experience to design and build almost anything structural. When I invent some contraption and see that modifications would improve function, (like my 50 ton log splitter that lifts 500 lbs rounds onto the splitting bed), I observe, evaluate, decide, and make changes. Simple. You do the same. When oil folks explain PO or ELM, I observe and digest, consider my life and lifestyle, extrapolate a realistic scenario, and make changes in thought and personal actions. My sister simply cannot do this. Emotionally, she cannot bear to consider there is no firmament in what she perceives to be real. (or, in any of what we puny humans think is real).
It isn’t about intelligence. It is about critical thinking and daring to appreciate risk and change, imho. It is about trying to make those changes.
Paulo
For the vast majority of people in the world strategic thinking is not foremost in their minds because by the time they reach adulthood they have settled into something of a routine. As long as their environment does not really change that much they do not need to lay additional plans beyond the limited horizons they have already mastered. Strategic thinking, for most people, is something they do more as teenagers than as fully developed adults.
-George
Ofm and paulo,
Excellent stuff.
The conflicting messages makes it hard. As Ron has pointed out people want to believe that things will work out.
Hi ofm
That Forbes article is 4 years old, Jan 2010
A few weeks ago, I pointed out, to a senior EIA analyst, the discrepancy between two different EIA data bases for US dry natural gas production, especially for 2012. He said he would look into it, and he replied that it was surprisingly difficult to get the numbers to match. I suspect, but don’t know, that two different divisions of the EIA are using different data sources (possibly Cediagaz for the international data base and Bentek for the domestic data base).
My initial impression was that the International data base used a preliminary number, subsequently reduced, but my analyst friend cautioned me agains this conclusion (he was not totally forthcoming about what was actually going on).
I suspect that what this exercise shows is that we probably have, even for US gas production, something like a 2% to 4% margin of error, which makes one wonder about international oil production data. For a reported Global C+C production rate of 76 mbpd, I suspect that the actual number may be somewhere in a range between 74 and 78 mbpd.
Two EIA sources for US dry natural gas production:
International Energy Statistics:
http://www.eia.gov/cfapps/ipdbproject/IEDIndex3.cfm?tid=3&pid=26&aid=1
2010: 21.3 TCF
2011: 22.9
2012: 25.3
Note on data source: The estimates in the table include data from Cedigaz.
Natural Gas Gross Withdrawals and Production:
http://www.eia.gov/dnav/ng/ng_prod_sum_dcu_NUS_a.htm
2010: 22.9 TCF
2011: 24.1
2012: 24.3
US dry natural gas production either rose by 4 TCF from 2010 to 2012 or by 1.4 TCF. The difference, 2.6 TCF, is roughly equivalent to one and a half times Mexico’s reported 2012 dry natural gas production.
And 2.6 TCF would be twice the UK’s reported 2012 dry natural production.
I love this website Ron. Thanks a lot. I also really enjoy J.J.B’s great input on the topic and his comments on this site.
A question for J.J.B please; have you applied you GNE model and analysis to any other commodities on the global market, like various staple foods for example?
Not in a quantitative sense, but the math works the same way. Note that a few years ago Russia banned the export of grains, in order to meet domestic demand and to keep domestic prices down.
(Note that I made a mistake on my gas post, see comment down the way.)
Maybe we have to wait 4 years for decent data, at least for Natural Gas, 2009 matched pretty well.
Note that the US Crude plus condensate data does not match the international data either for 2012 and 2013 but the difference is only 0.16 % in 2013.
For the Natural Gas data the difference is 4% in 2012 between the two data sources.
If the crude data for the World has the same type of error as the US crude data, we are talking about 75.8 to 76.2 for a range rather than 74 to 78 (which would be about a 3% error).
Maybe crude is tracked more closely because it is more expensive. The estimates seem to be much better for crude plus condensate.
Speaking of data quality issues, I made a mistake. The International data set is only through 2012, while the domestic data set is through 2013 (I was comparing international 2012 to domestic 2013), so the only real discrepancy is for 2012 (which is substantial though, at 5%, still not sure of reason why).
International Energy Statistics:
http://www.eia.gov/cfapps/ipdbproject/IEDIndex3.cfm?tid=3&pid=26&aid=1
2012: 25.3 TCF
Natural Gas Gross Withdrawals and Production:
http://www.eia.gov/dnav/ng/ng_prod_sum_dcu_NUS_a.htm
2012: 24.1 TCF
Libya’s Oil Output Drops Further
At this site is a 5 minute audio that is very revealing.
Funny how it usually turns out that way.
Nah, this is not signif numbers. They are only burning about 180K bpd, down about 100K bpd from Gadaffi days.
They can pump 1.7 mbpd when singing happy songs together. So at worst from a global perspective they might go from 200K bpd export to 50K export and that 200K isn’t going to move the Brent meter.
They can pump 1.7 mbpd when singing happy songs together.
No way can they ever pump 1.7 mb/d again. They were pumping just under 1.6 mb/d during the last days of Gadaffi. Then they got back to just above 1.4 mb/d after things returned to semi-normal after the revolution. But their fields have been damaged.
Libya: Oil Output Drops Further
“Oil reservoirs are kind of a fragile thing, and they need tender loving care at all times. If you shut-in production it tends to damage the reservoir. So, even if democracy broke out tomorrow and everybody was peaceful in that country, it’s highly unlikely that you’re going to get back up to the level that you were pre-Gadhafi overthrow anytime soon,” said Kingston.
That’s good stuff, Ron. I would like more geologic description of the mechanism of damage to an oil field if you stop extracting oil.
I guess I can imagine semi natural fractures that were held open by water washing/drive being allowed to close by the shutdown, but hmmm, it would be nice to have details.
No question in my mind Russia or KSA would have snipers on site in these places carefully killing anyone who looks like he’s making progress towards negotiated settlements. That would be an incredible return on assassin investment.
Don’t Chevron and ExxonMobil have any snipers?
Gotta be harder to get the orders issued in a private company than from a gov’t.
I suppose one might contact some local groups and offer monetary incentives to keep the oil offline, and not specify methodology. That provides prosecution shield.
A gov’t would have fewer inhibitions of that sort, though that may not be the best way in general. If you can get to the relevant rebel commanders and compensate them directly for intransigence, they get rich by not letting oil flow.
The reason is that water has a higher density, and lower viscosity than oil. When the pressure is released on a field the water begins flowing under the oil to the well bore, and the oil rises. When the well is re-pressurized the water, having a higher mobility, moves to the well bore, leaving the oil above it stranded. There is no way to fix it; part or all of the field’s remaining oil is lost. It is called premature breakthrough, and it can also occur by over pressurizing the injectors of a field.
http://www.thehillsgroup.org/
Good stuff, BW. Why can’t you drill another hole to the new oil depth?
Ron Wrote:
“This post, above, keeps showing up at the bottom of the page, as if it were just posted, while newer posts show up above it.”
FWIW: I think it would be easier if the newer posts just when to the bottom of the list. I find it difficult at times to identify new posts since the can be all over the list. I am sure there is a lot of interesting stuff I miss. Usually when I reply, I include a quote of the person I am replying to so the readers can follow. BTW, I am not complaining, just pointing out an observation 🙂
Sometimes people are responding to a specific comment. If not they should do as you suggest and post at the bottom or their comment may be missed.
Shortfall In Middle East Oil Investment Could Push Up Prices -IEA
It’s going to be a real shocker when “such as U.S. shale starts to lose steam” in about one year or so.
The “I told you so’s” are starting to come in.
US shale boom is over, energy revolution needed to avert blackouts
The author of this article points to four other articles where he pointed out that peak oil was not dead.
Shale gas won’t stop peak oil, but could create an economic crisis
Peak oil lives, but will kill the economy
Former BP geologist: peak oil is here and it will ‘break economies’
US Army colonel: world is sleepwalking to a global energy crisis
Your link doesn’t work Ron.
Fixed it.
And the IEA is still overly optimistic to boot. With the Monterey shale write-off, I can’t see how US LTO peaks in 2020, or the US C+C production even gets to the US EIA reference case in 2016.
The other problem is that, as the Libya article touches on, these geopolitical problems that are shutting production or slowing growth are NOT minor. Libya doesn’t have a government. The ISIS guys in Iraq and Syria aren’t the type you can negotiate with. Venezuela utterly believes in their SOCIALIST BOLIVARIAN REVOLUTION and will not reform investment practices or foreign company interactions.
Iran will negotiate the nukes, but they’re well past peak to start with.
A few Ronposts back I spent some time and looked into the last 50 years or so for what the norm is for oil shut in by above ground upheaval of whatever sort.
Present day shut in totals are low vs historical norms.
Ron, Again many thanks for the work you do and for providing a forum for sane discussion of the rather insane situation we find ourselves in. I feel that the data you have presented would cause one to come to the same conclusion as you have as to the timing of the Bakken as well as other LTO plays. As an anecdotal side note my wife teaches cob building and I’ve noticed a demographic shift over the last several years as well as the last several months. The variety of ages remains about the same but the reason for learning this skill seems to have changed at least somewhat. Several years ago these workshops were attended by many “green hippie” types ( for lack of a better label ) concerned with environmental degradation, sustainability and personaly living a more “natural” lifestyle. Imminent resourse depletion did not seem of much worry to these often fairly well to do folks and I saw little in the way of serious energy conservation other than perhaps arriving in a Prius or other hybrid. Oddly, many complained of the water not being hot enough and they almost ritually left the lights on. Water wastage also seemed of little concern. By contrast more recently held workshops have had a far more mainstream attendance and the lack of economic opportunity and a perceived shorter timetable for energy depletion seem to be more common reasons for the desire to learn this skill. We have another workshop on July1 and I am anxious to here the “chatter” among the students after the recent revalations that the idea of Saudi America rather than Peak Oil is going up in flames notably sans any thick oily smoke.
I watched Fatih Birol’s presentation the other night and if I recall correctly I believe he used the term transition.
Having parsed the words of the chief economist of the IEA after watching various presentations he’s given over the years I don’t recall him mentioning transition before. Given
the Byzantine protocols of his position Birol is expressing a great deal of urgency.
I hope his words are heeded… I can hope.
Having watched the presentation again maybe he didn’t outright say transition. : )
http://www.youtube.com/watch?v=awwVbAG0eig
Also the Q&A after the presentation is worth a listen…
http://www.youtube.com/watch?v=oh8iKykIH9M
From the Q&A…
~21:00 450 scenario depends on CCS, without it forget about the 2 degree Celsius guardrail.
~23:00 CCS keeps fossil fuel assets from being stranded, without CCS $300 billion in fossil fuel assets will be stranded.
From Executive Director Maria Van Der Hoeven’s opening remarks…
http://www.youtube.com/watch?v=OUsoGvQWgLo
LNG will not lower gas prices in importing countries since LNG costs 10X more to ship than an equivalent amount of coal or oil.
To 2035, $8 trillion will need to be spent on energy efficiency, 90% of this in the transportation and building sectors.
Aws.
“I can hope.” Yes you can. You can also hope the Tooth Fairy drops by tonight, waves her wand and grants you immortality. I’ll give you even odds on the result.
Doug
Generous odds. : )
From the link: Former BP geologist: peak oil is here and it will ‘break economies’
A rather curious statement…
“A shortage of oil will affect everything in the economy. I expect more famine, more drought, more resource wars and a steady inflation in the energy cost of all commodities.”
More drought?! While I myself expect more drought due to climate change it seems that more and more people are starting to equate our energy issues with climate change. Perhaps he is thinking fossil fuel powered irrigation will be affected by peak oil during a period of more intense droughts.
Anyway that’s just a very minor quibble with his overall point, which is, ” We’re All F@cked!” I guess I kinda agree >:-)
Fred,
Perhaps he means less oil therefore more coal therefore more climate change. Anyway, it’s hard to argue with his (your) conclusion — whatever he really meant.
Doug
Ron,
This was an excellent post accompanied by many thoughtful comments: Congrats to all involved. Keep up the good work Guys (and Gals).
Doug
Missed you.
Dcoyne
Hi Ron:
Please trash this if someone else already posted it:
http://www.zerohedge.com/news/2014-06-07/90-gazprom-clients-have-de-dollarized-will-transact-euro-renminbi
Ron,
As a heads up, my wife is planning to visit the Eurasian National University in Astana, Kazakhstan, in August to assist in the translation of a research paper (Russian to English): not the math which is already complete but the notes. I had no intention of going, however, given the developments going on in this country and the fact Astana hosts a ton of people at the university (who might be accessible), it might be fun to check out the scene and report back here. Sometimes if you hit it off with the right dude (or gal) at the right time you become privy to some cool stuff. Besides, costs are covered and I can’t stand my own cooking which will be the case if I stay here by myself. Update on this coming in one month, give or take. Would have said this in an e-mail but I don’t know your “address”. If, in the future, you’d prefer to discuss this kind of thing in another format please advise accordingly.
Doug
Doug, I am sure we would all like to hear about local opinions and politics from Kazakhstan, especially about the oil situation there. How do they feel about the Kashagan disaster, if you could call it that? Or any other cool stuff as you put it? My address is DarwinOne at Gmail.com. But please just post here so everyone can read it.
I am really looking forward to it and I am sure others are as well.
Carbon Tracker dropped a new report…
The Great Coal Cap:
China’s energy policies and the financial implications for thermal coal.
If I understand how the program controlling this blog works we can make only about four or five replies to a given comment and then any reply beyond that appears at the very bottom when it is submitted. Is this correct?
When I posted about Forbes my only real intent was to point out that this well known publication which is very much a ”business as usual” outfit seems to be edging towards hedging its bets a little on the supposedly bright future of the oil industry. People such as Ron here are slowly but surely gaining a larger audience.
I am sorry I misinterpreted Watchers comment about Nascar but being an old southern boy who grew up listening to the races rather than football games I tend to get defensive in a hurry when I find this sport is under attack.My friends and I could not realistically pretend to be pro football players but we could pretend to be Fireball Roberts. I attended the funerals of a couple of guys who pretended too hard and gave others rides when they were walking due to having their drivers license revoked.
Personally I do believe that there is a substantial amount of oil wasted in the American economy that can be and will be saved in the not so distant future but Watcher is probably right about there not being very much that can be saved if the savings under consideration are short term.
But there are still millions of early nineties pickups and sport utes on the road that are easy on gas compared to comparable eighties vintage vehicles – which are mostly gone now- but these older trucks and sports utes are real gas hogs compared to the newest models with comparable performance.It seems insane to an old gear head like me but a brand new Corvette which will ” immortally fly” will get about as good fuel economy on a road trip as a Ford Pinto with an automatic transmission would when it was brand new.
The people who own these older vehicles are junking them pretty fast because it costs too much to repair them unless you can do so yourself and not that many people can work on cars anymore. Some people who can don’t have a spot where they can or a place to store tools and expendables.These people are either buying newer vehicles which generally do a lot better on fuel or else they are giving up driving almost altogether.I used to ride a motorcycle and if the state I live in had not recently decided to require tags and insurance on small scooters I would now be the owner of a 50 cc Honda that gets well over a hundred mpg which would allow me to save quite a bit of gasoline at least on days the weather is nice.
And there are many many trucks out there burning a hundred gallons of diesel a day that are delivering things of no real consequence from soft drinks to potato chips to advertising flyers to throwaway junk of many kinds.
Delivering things of no consequence isn’t a lot different from a jobs program so it’s hard to frown at that. At least in the no consequence shipping activity, some well connected govt crony doesn’t get the contract from which to skim.
I read this post fully regarding the difference of latest and
preceding technologies, it’s remarkable article.
Kay McDonald has a new post at Big Picture Agriculture…
Photos: Land Use Change Destruction to Grow Biofuels
Click through to check out the photos.
El Niño Odds Raised to 70% by NOAA, But El Niño is Actually Imminent
By: Michael Ventrice , Wunderground, 2:36 PM GMT on June 07, 2014
So no dodging the summer gas burn for electricity generation, which won’t help underground storage injection. That said, if I recall correctly an El Nino usually means a warmer winter in the Eastern 2/3 of North America. We’ll see.
Kurdish Oil Looks For Buyers As Baghdad Warns Them Away
http://oilprice.com/Energy/Energy-General/Kurdish-Oil-Looks-For-Buyers-As-Baghdad-Warns-Them-Away.html
WSJ: http://peakoil.com/production/opec-struggles-to-cope-with-libyan-oil-shortfall
http://peakoil.com/production/opec-struggles-to-cope-with-libyan-oil-shortfall
Jeff,
Your contributions to Ron’s Blog are amazing: Factual, informative and entertaining. On behalf of all of us, Thanks!
Doug
As Ron previously noted, there have been little hints of reality beginning to appear in the MSM, and even the WSJ made a passing reference to “Net Export Math.”
Maybe one of these days, some reporter may get a calculator out and discover what happens to net exports given declining production versus flat to rising consumption.
773,000 vehicles sold in KSA 2013. 570K cars, the rest light trucks.
Err vehicles not including heavy trucks. KSA is getting a Volvo truck factory.
Correction: “KSA 2013. 570K cars” should read KSA 2013. 570K Mercedes. [Yes, little round yellow face here]
Good points all around. Truly apiprceated.
http://mobile.bloomberg.com/news/2014-06-08/world-needs-record-saudi-oil-supply-as-opec-convenes.html
“At the start of this year, expectations around the return of Libyan, and subsequently Iranian, barrels were high,” Amrita Sen, the chief oil market strategist at Energy Aspects, said by e-mail on May 20. “Today those possibilities have diminished substantially. The real question concerns how OPEC will meet higher demand for its crude in the third quarter. The onus falls on Saudi Arabia to do much of the heavy lifting.”
Saudi Oil Minister Ali Al-Naimi
told reporters in Seoul
on May 12 that any supply shortage in the oil market can be covered. The kingdom is capable of producing as much as 12.5 million barrels a day of crude and pumped 9.67 million in May, according to data compiled by Bloomberg. Media officials at Saudi Arabia’s oil ministry in Riyadh
weren’t available to comment when contacted by Bloomberg on June 6 and yesterday. There was no response to an e-mail to Saudi Aramco
’s media department yesterday.
meant to add: saudis at 11 mbd -credible?
The guy doing the talking in this article is a big wheel with Shell so he should certainly be well informed. Whether he is to be trusted is another question.He may be as honest as the day is long, and mistaken, or he could be cherry picking and shading his facts to support the conclusion he wants investors to draw.
I think he is credible in every respect except he seems to be VERY confident gas will be plentiful for the foreseeable future once the price goes up substantially.He does mention a challenge in holding oil production steady but indicates a belief in declining oil demand world wide so far as I can tell.
Personally I think that oil demand will remain very strong until the price of it gets so high that a lot of people and businesses simply have to give it up.It is going to take a long time for alternatives to scale up and for people’s habits to change.I believe in pure electric cars and cng fueled trucks for instance but it will be many years before either of these displace very many conventional cars and trucks as percentage of the fleet.
http://www.reuters.com/article/2014/06/09/energy-lng-shell-idUSL6N0ON42O20140609
Ron:
Do you notice that the BSEE oil production data is materially lower than the EIA GOM oil production data?This looks awfully familiar with the Texas RRC data for Texas oil production (Texas RRC data is materially lower than the EIA estimate of Texas oil production data – yes I know there is a timing issue). That the EIA uses lots of favorable estimates of oil production is looking more suspicious all the time.