A Guest Post by George Kaplan
Production
Production for June by BOEM was 1631 kbpd and by EIA 1636, compared with 1673 and 1659 kbpd, respectively, in May. The decline was mostly from Thunder Horse going offline and Constitution staying offline. Hurricane Cindy didn’t seem to have much of an impact, things will be different for the impact of Harvey on August figures.
Even with the two offline facilities coming back July numbers will struggle to beat those for March, and after that the depletion declines and hurricane disruptions take over. Note that the “others” area includes any assumptions BOEM has made to allow for missing data, which is quite a lot this month.
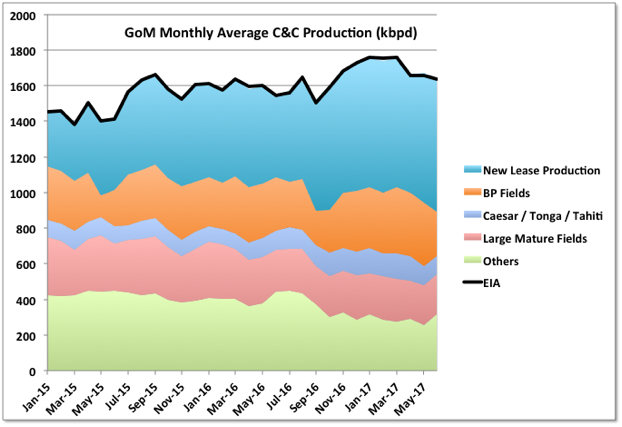
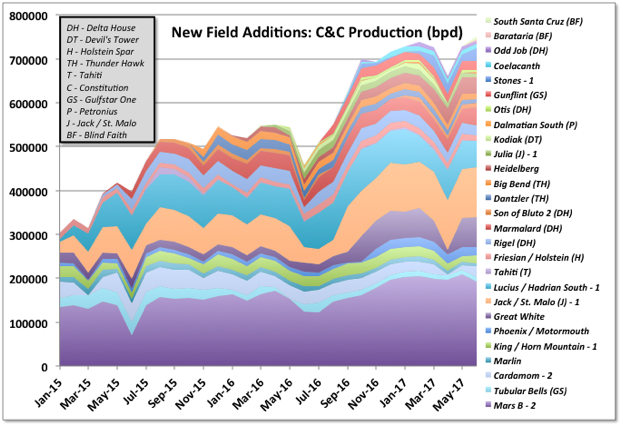
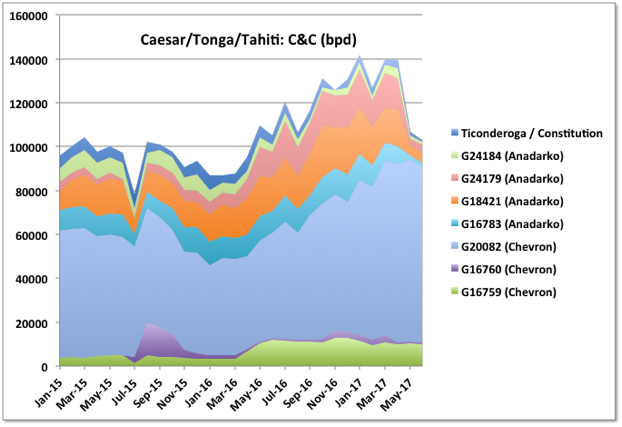
The combined new fields added from late 2014 are holding a plateau with South Santa Cruz and Barataria fields added and a new lease for Marmalard starting (adding about 20 kbpd combined). Stones also had a better month and achieved 70% of nameplate capacity. It’s interesting that five leases have come on line and then have effectively been killed off in this thirty month period: Amethyst (a small gas field that died after sputtering along for about six months, and not shown as the flow was so small), one lease in Lucius, Kodiak, one lease in Caesar/Tonga/Tahiti, and one in Rigel. Dalmatian South production fell immediately after start-up and was offline for a couple of months but came back in June (there are plans for subsea pumping to be installed but I don’t now the present status).
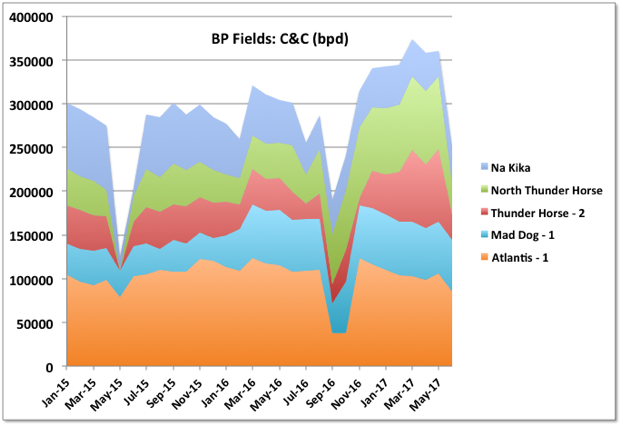
The big drops have been for BP, with Thunder Horse off line for part of June, and for Anadarko with the Constitution shut down extending into a second month (I think a bit longer than was planned).
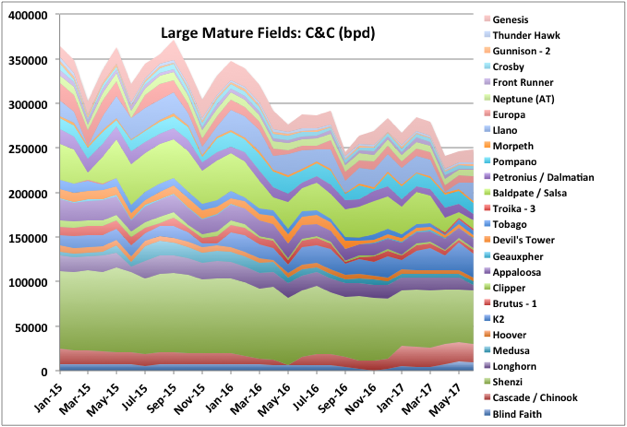
Mature deepwater fields continue a general decline. Note for all fields there is some missing data for June and even in May – I have assumed production remains constant from the previous given month’s numbers in each case. For some reason Hess’s Tubular Bells has no reported figures for eight months now.
Shallow Fields
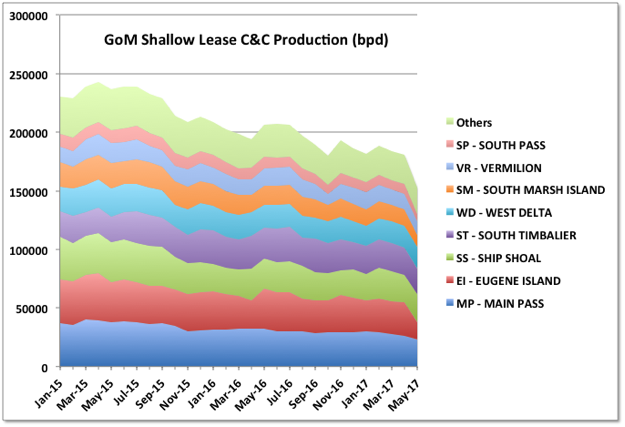
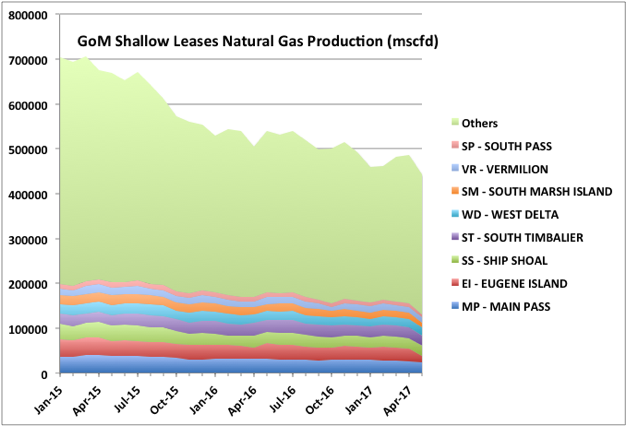
The shallow fields in the GoM are in steady decline for both oil and gas, but different leases are more oil and gas prone.
Production Breakdown
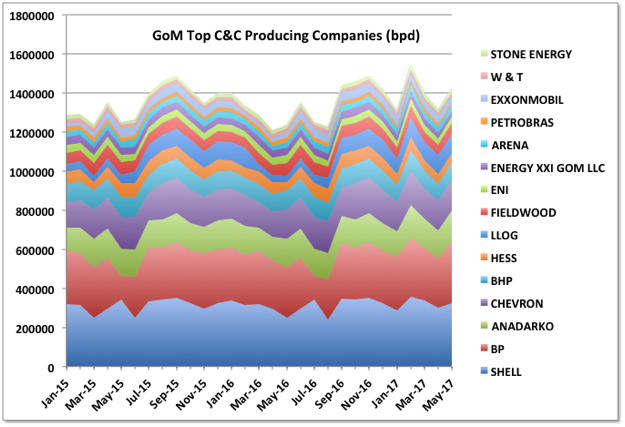
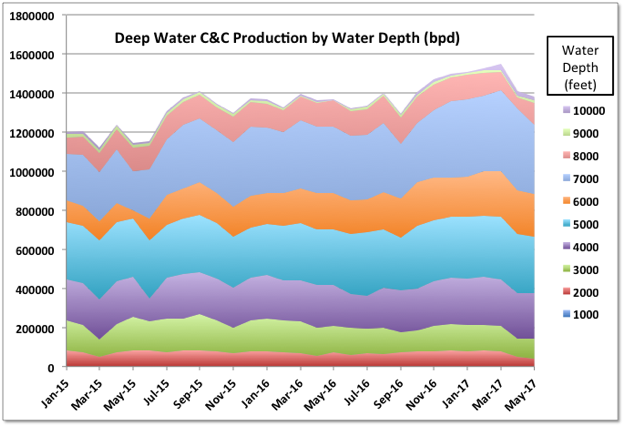
These charts show breakdown of production by company – most oil comes from four companies: Shell, BP, Chevron (including Union Oil) and Anadarko (their historical numbers include those for Freeport McMoRan, which they bought last year) – and by depth, which doesn’t tell me much, except maybe that ultra-deep hasn’t delivered as much as was once expected. Note these charts only go to May as June has a lot of missing data for the shallow leases (and some for May too I think, but it all comes from well numbers and there are too many to check).
Lease Expiry
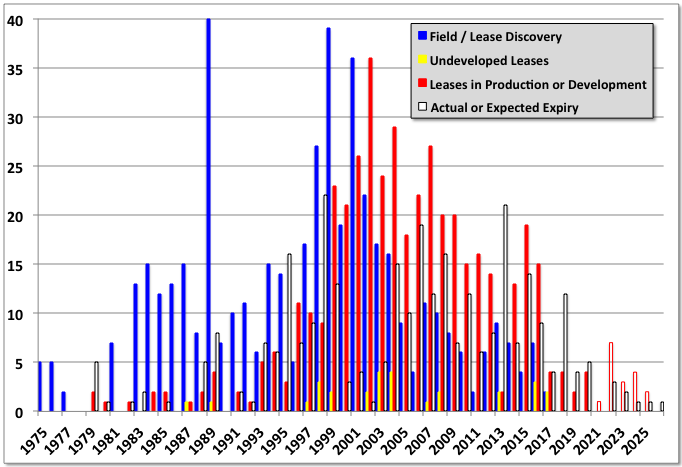
BOEM provide data of when undeveloped leases have expired or will expire. There has been only one so far this year (Kaskida). However there are a lot due over the next few years, as shown below. Presumably they can be extended, though at some cost, but this may indicate a lot of development decisions (for both greenfield and browfield work) need to be made in the coming couple of years. Some of the big ones due this year are Shenandoah, North Platte and Yucatan; next year and 2019 there are a couple each in Rigel and La Femme, plus Anchor, Leon, Gibson and Samurai, and overall another six or so associated with older producing fields (i.e. that would require tie-backs or outreach drilling).
Drilling and Workovers
There are thirty rigs listed with drilling operations in the BOEM deepwater activity for 29th August, plus sixteen workover operations (in any of the charts if there is a number after a name it shows the number of well operations listed against that field). Six rigs have no field listed so are presumably wildcats. There don’t seem to be any appraisal wells in progress. Also any impacts from Hurricane Harvey aren’t apparent (the rigs that were abandoned were mostly jack-ups in shallow water so wouldn’t be included).
Off Topic Finish
This is a house designed by Frank Lloyd Wright for Marilyn Monroe and Arthur Miller but never built. It’s computer generated from his original design drawings, although the second floor private quarters are missing. At the site below you can take a walk though the rendering. Miller didn’t like it and they couldn’t afford it.
I don’t know much about architecture, and I’m not sure if I even know what I like, but Frank Lloyd Wright’s work is unique, he was not much of a fan of right angles. A lot of his designs never got built (as with many architects I expect), but like this many have been rendered in graphics packages, often as an example of their capabilities. He designed a civic centre and transit building for LA, which looks a bit like the Tyrell building from Blade Runner (which, amazingly, was set in 2019 – that seemed a long way away when the film first came out), though I don’t know if it was the model for it.

93 responses to “GoM June Production Update”
India’s crude oil imports since $100 prices in 2014 have increased 462 kb/day
From an average of 3792 kb/day in 2014. To an average of 4254 kb/day in 2017 (Jan to July)
(using 7.322 barrels to metric tonne)
The IEA use India’s Petroleum Planning & Analysis Cell Ministry data as a primary source.
(Product imports include LPG)
Slope looks entirely price independent.
Yes India’s crude oil imports were in a strong uptrend already. I guess this is a better example – the world as a whole shows more of a reaction to the price drop…
Global? That’s not too meaningful. Only consumption would be. And from somewhere with very low production.
Those imports reflect falling Chinese domestic production. Remember, they peg the renminbi and have their own CB. The price not only doesn’t matter to them; it can’t matter to them.
Every once in a while I feel compelled to point out that I think Watcher is either naive or that he doesn’t give a hoot about the real TRUTH.
I am unable to interpret his comments as saying anything other than that central banks are free to print as much money as they please, so as to make sure there is oil available, and that this practice can be continued, apparently indefinitely, maybe forever for all I can see.
HE never mentions the consequences of this manipulation of the money.
THERE ARE CONSEQUENCES.
And the bottom line is that the supposedly magical oil that appears because HE SAYS IT APPEARS is actually PAID FOR by everybody else, in the aggregate, across the ENTIRE economy.
IF a billion dollars worth of steel, concrete, skilled labor, etc, is diverted preferentially to the oil industry by way of government, that’s a billion that is NOT AVAILABLE to the REST of the economy. THAT billion’s worth of steel, concrete, and skilled labor is NOT available to build bridges, or houses, or hydro electric plants, or wind or solar farms, or tanks and warships. The rest of us get by with a little less of these things that COULD have been paid for with the billion spent on the oil industry.
How anybody can fail to see something so obvious is beyond me. Maybe he does see it, and simply wants to make the same point over and over again, without bothering with being even handed about how he does it.
ANY money or resources the government, any government, devotes to a given problem or project is necessarily collected in the form of a TAX from SOMEBODY, even if the tax is in a form making it hard to recognize it for what it IS.
I am arguing neither FOR nor AGAINST subsidies.
What I am saying is that it takes a fool or a cynic willing to twist the truth to suit his own agenda to say that the COST OR PRICE of a new eighty thousand dollar car is only seventy thousand because the buyer gets a ten grand tax break. The SELLER of the car gets the eighty grand, and the PUBLIC contributes the DIFFERENCE, the last ten grand.
Most of us have at least HEARD of the mythical FREE LUNCH.
It blows me away how many people appear to BELIEVE in it.
There’s nothing wrong with supply and demand theory, if you have sense enough to understand that time lags, government interventions, economic warfare, price wars, and so forth are all incorporated in to the SECOND or THIRD semester of the study of economics, rather than the first semester, lol.
Looks like Katia will become a hurricane in the GoM but miss the offshore Mexican fields – but likely to impact some onshore oil production when it comes ashore.
BP says it has begun evacuating personnel from Thunder Horse platform & West Vela drilling ship in GoM on IRMA: Reuters.
Pemex’s oil production platforms remain operational and are unaffected by the presence of tropical storm Katia in the Gulf – BBG
EIA map: https://www.eia.gov/special/disruptions/
These 4 total 1160 kb/day of refinery capacity…
All but four major refineries are beginning to restart
Jordan Blum, Houston Chronicle – September 6, 2017
After Harvey shut down more than a dozen massive oil refineries that churn out nearly 25 percent of the nation’s fuel supplies, there are only four left that aren’t yet beginning to come back online.
The only major refineries still fully offline for now are Phillips 66 in Sweeny, Royal Dutch Shell in Deer Park, Exxon Mobil in Beaumont and Paris-based Total in Port Arthur.
http://www.chron.com/business/energy/article/All-but-four-major-refineries-are-beginning-to-12177013.php
Thanks again George. This is the first time I’ve seen a breakout of shallow water oil production. BSEE used to provide an annual breakout of shelf vs. deepwater production, but they haven’t updated that portion of their website since 2014. I’ve suspected shallow water production was dropping – just due to lack of drilling activity – and the data supports that.
The recent peak in GOM oil production from November 2016 to March 2017 probably won’t be seen again in 2017. August and probably September will have storm related down time. The next best chance to see sustained rates over 1.7mmbopd will be, in my opinion, early next year when Stampede and Big Foot come on line.
SLG – thanks. For the shallow leases I get the data from OGOR-A file, which is well production. It is easy to download and analyse but like Texas numbers I think it can take up to five or six months to get all the data. The deep water lease numbers take a bit more effort to download but I think they are more up to date in some way that I haven’t fully grasped (BOEM have something called LVS – liquid volume system, which somehow gets more data by the looks of things). I’ll try to show a fuller breakdown of the shallow leases for oil/gas/water next time. I’d agree 2017 will likely be a slight decline from March. For 2018 Stampede is early, and has some predrilling, The last I saw Big Foot was due late in the year – has it been advanced? I assume they had wells ready when they last tried to install it so it could ramp up fast.
It looks like it’s confirmed that Buckskin will be tied in to Lucius, I think that’s another indication that the water breakthrough on the Lucius leases wasn’t expected to be as severe and/or as fast as it has been
Platts – September 7, 2017
OPEC’s crude oil output fell in August for the first time in five months, as outages in Libya interrupted the country’s recent dramatic recovery, more than offsetting gains in Nigeria, according to the latest S&P Global Platts OPEC survey released September 7.
Libya’s National Oil Corp. said in the week ended September 1st more than 360,000 b/d of production from the three fields had been shut in, although sources told Platts on September 6th that flows from the 300,000 b/d Sharara and 10,000 b/d Hamada fields had resumed.
https://www.platts.com/news-feature/2017/oil/opec-guide/index
EIA weekly has some interesting numbers.
Will be interesting to see the more accurate data in a couple months. Will also be interesting to see how GOM and EFS rebound from Harvey.
IHS Market did a chart tracking GoM outages due to Harvey using BSEEgov data
Chart on Twitter: https://pbs.twimg.com/media/DJC25KrXUAAxHob.jpg
Weekly Petroleum Status Report, nice chart summary from Saxo Bank
Chart on Twitter: https://pbs.twimg.com/media/DJIVgJ0XUAA-olW.jpg
Statoil says operations in Eagle Ford shale of Texas will return to pre-Harvey levels by this weekend: Reuters
My grandfather left Vienna to work with Frank Lloyd Wright. Frank Lloyd Wright was astonishingly creative and had many styles. I prefer his early prairie style architecture, but I am biased, that’s what my grandfather preferred.
He seems to have worked for a hundred years, probably not quite that long though, so he probably went through several styles, maybe even had a part in starting some of them.
And, the connection to oil is?
None, but it’s my post so I get a bit of leeway.
A few of his clients, such as Aline Barnsdall, made their money in oil.
Are we in a “new normal” or are asset prices just inflated and ready to take a dive at some point?
Oil leases in our area continue to sell for roughly triple what they did in 2004-2005. This despite LOE higher now than during 2004-2005.
Farmland is similar. Cash buyers can expect a pre-income tax return of 2-2.5% at current grain prices.
Cannot justify buying either IMO.
See? People start to ask themselves or others or the universe in general about how it can be possible that things have the prices they do.
And that is in the context of elevation. Elevating prices is inflationary and yet globally there is what one might call astonishing deflation. Wages in the United States are not increasing. The price of money, interest rates, are not increasing.
Make no mistake here. The central banks of the world are in a quandary. One probably does not want to call that a panic, but it’s certainly consternation. They have inflation targets that they want to hit, and they’re not hitting them.
I’ve noted here many times in the past the level of interest rates on sovereign debt all over the world. In many places they’re outright negative. Not negative real, negative nominal. That is lower than negative real. They have been negative for some time and they remain so. Swiss sovereign bonds have a negative interest rate. So is Japan’s.
This is the sort of thing that people want to wave a hand at and essentially ignore. If one points out that it’s not possible, the rebuttal is the world continues to operate, the wheels continue to turn so it doesn’t matter if it’s impossible — it exists and we don’t care if it’s possible. And most particularly we don’t want to know what has failed that would allow the impossible to exist. It’s just best that we don’t know. So we’ll just ignore it.
It makes no sense to try to rationalize the price of oil in this environment. Frankly it doesn’t make much sense to measure the value of farmland in dollars as you just did. Calories will likely trump dollars within the lifetime of some of the people reading this, more probably most of the people reading this
it is a sad but true fact that if a theory in physics doesn’t match the data seen the physicist will change his/her theory .
an economist ( certainly current CB heads) will tell you reality is at fault …..
Forbin
I concur with Watcher, in that I have my own theories about money. First, fiat money can work. I think that you can start a country from scratch with no assets and no money and no taxes. Print money and give it to people and businesses to build roads, rails, dams, water and sewage facilities, dams, schools, universities, etc. Tell the people that it has value and so they can start giving the money to farmers for food, carpenters to build their houses etc., service workers – lawyers, accountants, doctors, teachers, haircuts, cleaners, etc. Citizens essentially can by concrete from concrete from production for essentially the same amount that the concrete company is willing to sell it to the government.
The lower the interest rates are, the lower the inflation rate. The higher they are, the higher the inflation rate. Simple examble. You want to build a restaurant, but you have no money. And you are able to borrow the $1 million to construct the restaurant at a zero interest rate and you can pay the loan back in 50 years. The price of your burgers only has to cover variable costs [labor, food, and utility costs, etc]. Basically, you never have to pay any interest or cover depreciation, so your fixed costs are zero and you can view your cash flow over variable costs is all profit. So in your market area, the price of burgers drops because others have to compete.
If interest rates rise and normal loan repayment terms come into play, generally you HAVE to raise the price of burgers to cover those fixed cash outlays. If the government now sees the price of burgers rising, so they want to tame inflation by raising interest rates higher – then you MUST once again raise the price of burgers to cover the increased cash outlay for interest costs. Of course in theory, you can cut costs in other areas in order to maintain prices, but in practice you cannot. Try cutting the variable costs of labor salaries, or utility costs, or the cost of your food input. Food prices are set by world wide production levels. You can shop for the best deals, but you will just be nibbling at the margin. You can lay off workers, but then your sales go down because of crummy service and a decrease in the quality of the burgers [much of the quality is controlled not by the beef, but by the cooking skills, attention to detail, timley serving the food with a good presentation, etc.].
To sumarize, fiat money is okay, and it does not cause inflation as long as interest rates are low. If the government increaes interest rates, they cause inflation. Low interest rates cause investors to invest in a company’s stock, rather than its bonds.
Probably an off topic reply to an off topic post.
It’s near historical line – you have only to add one thing. What gives (Fiat-) money
value ist the right to pay your taxes with it. That’s what give it value, and thats what when it all started in Athen 600BC with formalized money, the owls.
And that’s the incentive for the farmer to sell food for money – so he can pay his taxes.
And with money a state can pay soldiers – before these times, he had to entertain and feed his warriors on themself, much easier to give them money so they can get booze and bitches on themselves 😉 .
Old coins where often fiat money – the roman sesterz wasn’t worth much on itself most of the time, it was valuable by the romand empire, as the US $ today.
Point just slightly missed.
Fiat money is not the concept being addressed. There is no reqmt for gold backing.
The concept is failure. The concept is 2009 and desperate QE. Money isn’t inherently meaningless. It was made meaningless. How it is created ceased to link to loan demand (the mechanism for being “backed” by economic activity). That visibly changed. How it is created became CB whim.
As for rates vs inflation and which is the cart and which the horse, CB desperation is appearing in a different way. Debt. If you can’t repay debt, and most countries cannot, then you become desperate to inflate it. But if you have QE’ed 25% of GDP and STILL haven’t diluted money to create inflation pretty much all a CB governor can do is note the wheels are still turning and retire with a nice pension.
Only oil is immune to whim. Shale, the small proportion of global production, is made to flow with absurdly low interest rates, but the majority of oil is more at the mercy of geology than CBs. It is oil that will cause collapse. No money.
Not money, why didn’t I have an edit alive? Weird.
Watcher – I was not disagreeing with, nor addressing any point that you made. I was merely trying to state that you had theories and that I have theories [as does anybody who adresses the subject, including Central Banks]. I stated that because, right this second, there is no universally accepted theory or points.
So I probably did not “Point just slightly missed.” I just made my points. And, I like a lot of your points.
I believe that it may have been you, that pointed me towards what Hitler did. He just told everyone that the German Marks [using bonds?] that he was printing and giving out to companies were fully back by some government reserve that never existed. So he was able to build up the military and infrastructure, put most Germans back to work and create a booming economy in the 5-6 years prior to going to war with Poland without destructive inflation. And I have been reading some isolated reports from a few economists that the deficit really does not mattter. The US Congress may remove the “debt ceiling” limit later this year.
My main concern, having lived through the 1970’s is that the Federal Reserve starts chasing its tail again, i.e. “we see signs of possibly too much inflation, so we are going to raise interest rates to prevent it.” Which, in my opinion, will cause the problem to actually happen until rates get to 15% – 18% and then totally crush the economy into a severe recession.
And, e.g., if the price of food or oil go up, interest rate increases will, in my opinion, obviously just cause those prices to increase even more. If an indebted shale oil company [basically all of them] faced 12% – 15% interest rates, one of two things will happen: either they will virtually all shut down exploration and production or the price of oil will increase dramatically [causing inflation] to fund the interest cost. I leave it to the reader to decide which one it will be.
Ya, I know. Theories abound. At the Fed and its huge staff of analysts, they absolutely do NOT focus on oil because oil is not their concept of 21st century high tech. It’s old thinking and should be ignored.
Those folks live in cities and food comes from shelves.
Hitler is a subject studied only in the context of narrative. His evil gassing of Jews. His interest in Aryan this and that. The question of how he funded that huge military build up is somewhat carefully ignored, much like why Japan bombed Pearl Harbor. History tends to begin after the events, not before.
Japan refused to allow a foreign power to dictate their policies via oil. The US did exactly the same thing in the 70s. They refused to have policy dictated by oil (lack). In our overall context, isn’t it interesting Japan did not bid up their offered price for oil in order to make it flow? Or maybe they did, and it still didn’t flow.
Here’s a passage from the Wiki on Pearl Harbor, for the great unwashed that don’t understand oil overwhelms money and has war as an only answer:
https://en.wikipedia.org/wiki/Events_leading_to_the_attack_on_Pearl_Harbor
Responding to Japanese occupation of key airfields in Indochina (July 24) following an agreement between Japan and Vichy France, the U.S. froze Japanese assets on July 26, 1941, and on August 1 established an embargo on oil and gasoline exports to Japan.[11][12] The oil embargo was an especially strong response because oil was Japan’s most crucial import, and more than 80% of Japan’s oil at the time came from the United States.[13]
Japanese war planners had long looked south, especially to Brunei for oil and Malaya for rubber and tin. In the autumn of 1940, Japan requested 3.15 million barrels of oil from the Dutch East Indies, but received a counteroffer of only 1.35 million.[14] The Navy was (mistakenly) certain any attempt to seize this region would bring the U.S. into the war,[15][page needed] but the complete U.S. oil embargo removed any hesitancy. Moreover, any southern operation would be vulnerable to attack from the Philippines, then a U.S. commonwealth, so war with the U.S. seemed necessary in any case.[16]
Hi Watcher
If there is deflation then negative nominal interest rates can be positive real.
For example deflation of 2% and nominal interest rate of 1% would be a real interest rate of 1%.
Negative interest rates are to force spending when inflation is nil.
Swiss inflation rate YTD is +0.5%. Japan +0.2%.
Dennis – I asked this on the previous post just before it was replaced – is the destruction from Harvey and Irma (and maybe Jose and the one coming after) likely to be deflationary or inflationary, and what happens to the USA GDP (up or down). Also is the response always the same long term or does it depend on the current financial situation and the policies of the government? Also is it possible to imagine a government less well equipped to handle what’s going on at the moment than the present one (that applies to a lot of places including the UK)?
oops – wrong thread, sorry.
Hi George,
Hard to answer. The disruption caused by the damage might be deflationary (less economic activity because productive capital is destroyed and fewer people working due to the destruction). This is counteracted by all the stuff that needs to be replaced and the insurance payouts that support this spending which tend to lead to increased economic activity. I think the second effect outweighs the first especially over the longer term and the net result is that it would tend to be inflationary, but I don’t have any peer reviewed research to back up my claim.
Your point about government policy etc is a good one and what happens depends a lot on that and every case will likely be different.
I agree that with the current US administration seems likely that we might see poorly thought out policy.
In this case the areas affected voted for the current administration so hopefully I am wrong and their choice will prove wise.
Disasters destroy wealth, but increase income and expenditures due to increased economic activity. If you’re at full employment, that’s inflationary. If not, then it reduces unemployment.
In the long term, disasters can mean that obsolete capital is replaced with newer, more productive capital, like Chicago after the Great Fire, Europe and Japan after WWII, etc. The very recent elimination of improved building standards by the Trump administration doesn’t help…
Hi Nick,
Correct. I am just thinking in terms of deflationary or inflationary, a disaster can be disruptive to the point that economic activity becomes slower, eventually the constraints on economic activity might be removed gradually and growth might resume. Usually (based on past history) the economy is damaged more by financial crises than by natural disasters.
In many cases deflation and unemployment go hand and hand especially in the wake of a financial crisis.
I would agree that a natural disaster can lead to higher employment or higher inflation (if we assume unemployment was low before the natural disaster.)
The new capital can also potentially improve productivity.
The rich seem to mostly trade assets back and forth amongst themselves. They bid up land, houses, art, etc. because they have more money than they know what to do with.
If the art market and the mansion markets crashed, it wouldn’t affect most of us.
Land and houses can bring in income. Art, not so much.
Good land has intrinsic value. But a massive mansion isn’t likely to produce income. Putting a multi-family building in the same location would generate more income than a mansion that houses only one family and sits empty most of the time.
WTI Brent spread in over $5. Assume due to Harvey.
Would think now that US can export, a large spread would cause much greater US exports and would drain US crude inventories.
However, a comparison of historic US crude inventories with historic WTI prices shows the same do not correlate very strongly.
For example, US inventories in the late 1990s v 2013, despite WTI being 4 to 5 times higher in 2013.
The glib cause is the joules per barrel total does not depend on counter party imagination.
There is more than joules per barrel very heavy oil has more energy but is more expensive to refine.
There is a sweet spot of 30 to 40 API.
SS – “despite WTI being 4 to 5 times higher in 2013”
Substitute “dollars” for “times”??
Clueless.
Oil in 1998-early 1999 was $12 or so.
Oil in 2013 was $95 or so.
US inventories in 1998-1999 were, if anything, lower than in 2013.
EIA data on weekly US inventories and monthly average WTI prices easy to find.
Financial media points to US inventories as a reason for price fluctuations. Not sure they matter that much from a historical perspective.
SS – there has been continued talk about the Red Queen effect for LTO producers, and how they have to keep drilling just to keep solvent. The shut down from Harvey would appear to be pretty damaging to that model, but maybe taking a few months to see (i.e. when the wells that should have been drilled aren’t available for completion). Do you think there will be a sudden risk to solvency for some of the smaller companies?
George. I do not know enough about who had to shut in what to comment on your question. I think we will see the effects reflected in the 3rd quarter 10Q. Most of those will be out in early November.
Weather related shut downs are never good, in my opinion.
George.
Have been doing some reading on EFS shut in production. It appears one company that is both struggling and was hit hard by Harvey is Chesapeake Energy Corporation.
CHK stock price has fallen into the $3s. Debt is still $10 billion. It appears CHK has to spend roughly $2 billion per year to hold production flat, yet is generating a little over $1 billion per year of cash flow. CHK has three rigs running in Wyoming drilling a formation called the Turner sand. The reason for the activity is the hope of hitting some big wells so CHK might obtain a higher price for their position, because they have tried to sell it previously and did not obtain high enough offers.
CHK is gas weighted, and has some onerous gas volume commitments. Yet gas prices remain stuck at very low levels and there are several areas where realized wellhead prices are below $2 when transportation is included.
The EFS is CHK’s largest and best oil producing basin. It appears they had to shut in a high percentage of production, and a significant percentage is still shut in.
Finally, CHK is a heavily traded stock with a lot of short interest. Will be interesting to see CHK 3rd quarter 10Q. CHK failing would be a big deal.
OOPS!! I had my mind on the WTI Brent spread. Clearly my error. Sorry.
Baker Hughes U.S. oil & gas rig count rose +1 to 944 this week (oil rigs -3 to 756, gas rigs +4 to 187)
Chart oil rigs: https://pbs.twimg.com/media/DJN7GFRXgAAnrYI.jpg
Chart from here: https://twitter.com/JKempEnergy
Canada oil & gas rig count at 202 up +1 gas rig this week
International oil & gas rig count fell -7 to 952 in August (land rigs -4 to 751, offshore rigs -3 to 201)
http://phx.corporate-ir.net/phoenix.zhtml?c=79687&p=irol-reportsother
No change in the rig count for the GoM or Eagle Ford this week.
GoM has averaged 16 for a month, that’s the lowest by about 5 since 2000 when records began.
Anybody know the process for shutting down oil rigs in the Gulf of Mexico because of hurricanes? The details would be interesting. The on-board generators almost certainly run off of gasoline or diesel and one presumes they are shut down. What other things are locked down? Clearly refrigerated food can’t be kept if the power is turned off. Dumped overboard?
Details would be interesting.
Just the production is shut off. They have essential and emergency generators that can run without needing natural gas. Most main generators are dual fueled (or some might buy back fuel from I pipeline but I don’t know that for sure), otherwise they’d never be able to start up. Emergency generators have 24 hour local fuel supply, if the platform is completely abandoned that would be all that would be left to run (there’s also short term battery back up), and the fire water pumps would also be available if needed (also with local fuel supply).
Cool. But to clarify, is stuff left running when 100% evacuated?
The control and monitoring system is left running, emergency lighting, navigation aids (e.g. running lights), some communcation and satellite links, other stuff depends on the facility (e.g. maybe some heating to stop freezing or hydrate formation, or maybe key hvac), there might be stuff needed to keep the facility positioned, I’m having some trouble remembering exactly the rest but basically anything where there is a major concern that things will get damaged if it is switched off (nothing much in the processing side which would be shut down, depressurised, and fully isolated, but maybe something on storage, or the flare system). Eventually the Egen stops and things go entirely black and you hope nothings happens before you can reboard.
Are those guys bolted to the floor, as it were? Or is there some active moving of ballast around to counter wave action. All automated, one presumes, so total evacuation might not shut that down?
If by ‘guys’ you mean the facilities there are different sorts – jackets are steel structures and sit on the seabed, generally without storage, GBS are gravity base structures, sit on the seabed with storage; FPSO float and are anchored, some can swivel to handle winds and current; semisubs, float and are anchored; spars; tension leg etc. I don’t think ballast handling is left operating once abandoned, but I don’t know for sure.
A couple of highly touted exploration wells announced as dry: Fatala-1, for Hyperdynamics in Guinea and Partridge, for Azinor in the UK North Sea. There was a gas show announced in the GoM this week (no statement on it’s commerciality yet), also ExxonMobil in PNG (gas as well) but that was a couple of months ago. I can’t think of much else as successes announced since the one offshore Mexico, but a few promising wells announced as dry, and this is usually the start of the best months for discoveries
George,
Do you know which prospect had the gas show in the GOM?
LLOG laid out some plans for their Buckskin development this week. Initially, a 2 well tieback to Lucius – with drilling beginning late this year and first oil in 2019. They touted up to 5 billion barrels of oil in place, which, with a 10 % RF yields about 500 mmbo. Typically, that should support a stand-alone development. LLOG is pronounced log, not el-log, by the way. This is LLOG’s first Wilcox project. They are able to take advantage of all of Chevron’s drilling and appraisal so they can come in and just drill producers.
Similar type of developments could eventually happen at Shenandoah, Kaskida, and a few others – that is, the leases get dropped (or operator interest sold), someone comes back and picks them up at a future lease sale (or buys into the existing partnership), and, again, is able to take advantage of all the information from previous wells to fast track a development.
Rampart in MC116/117 drilled by DGE (Asgard drill ship). I was wondering about that OOIP for Buckskin. Repsol spent a lot of money before they give up on it. Two 8″ flowlines sound like depletion drive and around 20000 bpd.
Hi George
The Verbier well reported as water wet this morning. Also the Drombeg well offshore Ireland came in water wet.
Thanks, is that game over for the play offshore Ireland? Out of interest how do you get this info. so early every time?
There has been one recent discovery I know of – Cairn in Senegal.
Hi George
As with most wells there is often some level of involvment by a public listed company both Verbier and Partridge had an interest held by Jersey oil and gas so I simply read the RNS announcements when they come out at 7am.
https://www2.trustnet.com/Investments/LatestAnnouncements.aspx
With regard to the Porcupine basin no quite the opposite athough there have been few commercial discoveries Corrib, Spanish point and Burren there is a lot of significance attached to Dunquin as it prooved up a functioning petroleum system.
Indeed it is only in the most recent licencing round that the majors arrived. Next well will probably be drilled by Nexen.
http://www.dccae.gov.ie/en-ie/news-and-media/press-releases/Pages/2015-Atlantic-Margin-Oil-and-Gas-Exploration-Licensing-Round-Awards.aspx
http://www.geoexpro.com/articles/2016/01/ireland-south-porcupine-basin
Goanna well in Norwegian sector announced as water wet today.
Texas RRC, oil well completions for August at 401 (Including 60 re-completions) down -36 from July 437.
It probably doesn’t mean anything but on average there has been 21% more completions done in March than in the average for the other 11 months of the year. It might ensure maximum production during the summer demand season? I guess completions are more oil price dependent at the moment.
Chart of simpler version on Twitter: https://pbs.twimg.com/media/DJTVsOSXUAMz-Zt.jpg
If you remove 2014 then the completions high for the average year is April. As 2014 was a boom year for completions it skews the averages to itself.
We’ve talked about what would disappear if oil prices rise too high.
I’ve said that a lot of airline travel could be eliminated if necessary.
Here’s an article which suggests the airline industry may have future problems unrelated to oil. People are so underpaid that being a pilot ( or an attendant) isn’t views as a good career choice anymore, so it will be increasingly hard to find people to do those jobs.
http://www.slate.com/articles/business/metropolis/2017/09/how_we_ruined_airline_jobs.html
E&Y US Oil Reserves Study came out in August:
http://www.ey.com/Publication/vwLUAssets/ey-us-oil-and-gas-reserves-study-2017/$FILE/ey-us-oil-and-gas-reserves-study-2017.pdf
They don’t include all companies and all reserves, and a lot of US production is NGL and condensate, but from these figures, overall for US, R/P is probably about 10 to 12 years and falling.
Revenue summary
Revenues, the losses in 2015 and 2016 wiped out previous three years’ gains and more.
This is probably the most interesting chart in the paper. The reserve replacement trends show continuous decline and don’t look to be very correlated with price, except for the bit of a kink in 2015. They all appear to indicate average replacement is going to go below 100% in 2017 or 2018. I don’t see how EIA and USGS estimates for resources can be reconciled with these numbers.
So big oil must know this and know that they will run out of product to sell. So you begin now to get everyone’s money out before panic sets in and no one wants a piece of your company anymore. Quietly liquidating, and then you’ll mostly be out the door before the masses catch on.
For all we know, the Trump administration may be serving as a cover so the fossil fuel interests can pump and dump.
Boomer.
Not sure I am following your post.
We are in a bear market for commodities, after having been in a boom cycle for several years.
I know many think electric vehicles will soon take over. I think that will take quite awhile.
I just talked to a family of four with both kids in college. Parents both work, combined income slightly over $100K. Four vehicles in the family, newest is a 2008, with the other three ranging from 1998-2005.
The husband works in a union trade, has to drive a decent sized truck to carry all his tools. That truck is the 2008. Has over 200K miles on it. When does a dually EV hit the market that this family can afford and will there be a place for him to charge at every worksite? Will universities provide overnight chargers to all of the students? Have you seen parking at college campuses?
Not everyone is going to immediately buy new tech that is range limited, costing $35-100K. At least not in the US.
I suppose if governments mandate electric, that might do it. But how do the people pay for those cars.
I keep going back to the one Tesla owner I know. Paid over $100K for an S. It is now worth under $40K four 1/2 years later. He has since bought three ICE vehicles. He is in the top 1/2% income wise and asset wise.
I am saying is that if oil companies see their replacement rates are dropping below 100%, then they know their businesses are headed for decline. So presumably they want get money out of the companies now, while they still can.
If the administration promises a bright future for fossil fuels, that provides a cover for companies that know otherwise, but want to keep the public in the dark as long as possible.
Ok. I follow you.
Do you think the IEA is wrong, or where do the barrels come when demand passes 100 million BOPD?
I assume it will take the traders a year or more to figure out there is undersupply, similar to 2013-2014.
People cannot afford new cars now, that is why there are so many long term car loans, leases and a large market for used vehicles.
I think you kind’ve answered your own question: if people can’t afford new, they’ll buy used. You can buy Nissan Leafs and Chevy Volts for around $10-12k right now.
George.
Thank you very much for your post and your link to the EY report.
I highly recommend reading the report. Easy to read. Staggering losses in 2015 and 2016.
$120 billion of asset impairments in 2015. So, as these companies begin to show meager earnings, remember those meager earnings are aided by those tremendous 2015 impairments.
Year 3 of this mess. One would think this couldn’t go on, but it will. Shale wells will only be profitable as stripper wells once the basins have been almost completely drilled, as only then will oil prices rise.
http://www.zerohedge.com/news/2017-09-09/reports-confirm-north-korea-has-enough-oil-survive-embargo
Sounds shaky, per:
“China conducted surveys off the west coast (of North Korea) in the 1960s. Subsequently, Russia has also conducted surveys along with Taurus Petroleum in Switzerland and Malaysia’s Petronas.
NK News reports Rego saying that the West Sea definitely has oil and has flowed oil at reasonable rates from at least two exploration wells.
“Simultaneously, the Mongolian company HBOil conducted exploration activities in the area south of Pyongyang and drilled 22 wells. Most of wells contained crude, allowing the DPRK to extract an average of 75 barrels per day from each of them”.
Consumption 17K bpd. Seems unlikely, low.
This can be fleshed out.
There is reason to believe they have refining capacity from the 1970s and it will do a few hundred thousand barrels per day. Refining capacity does not look like it would be too narrow for whatever meager flow they can generate. Of course spare parts for 1970 s refineries . . . .
The companies that are making claims about oil flow in North Korea do seem to be small and less than reliable, but there seems to be more confidence in an assessment of natural gas than in the oil. And of course natural gas could flow and NGLs, and it doesn’t require much verbal contortion to turn that into oil.
NK has a lot of coal. Oil too doesn’t seem impossible. They don’t appear to need much and that may be compelling. If they can export oil it’s a whole new ballgame.
The odds of anybody being willing to put money into NK to produce any oil found there appear to be from slim to just about zero.
My personal opinion, having read all I can find about NK, and reading between the lines, is that dough boy is so short of oil and everything else he wouldn’t even be able to put his antique army on the road in it’s antique trucks, so an actual invasion of SK is utterly out of the question.
This is not to say he couldn’t kill a few million people by shelling Seoul, since he seems to have thousands of artillery pieces dug in and within range.
The usual way to invest in such a place seems to be to send some equipment there that is obsolete anyway, and a smallish quantity of materials to be processed, and only send more material as the finished goods come back.
With de facto slave labor, low productivity isn’t that big a deal. Old sewing machines are one thing, when you pay the operators a starvation wage in rice and cabbage.
Oil rigs and pipelines and the associated machinery and equipment needed to put them to work are something else altogether. I can’t see anybody being willing to chance the investment, other than maybe China, and the Chinese aren’t too happy about dough boy.
Google Earth North Korea. The cities. The roads.
This is not some backward place. And I’m suspicious of how the leader has been demonized — for 20 yrs or whatever. He died just a few yrs ago. This is his son now. Not even the same guy, but the labels have stayed the same.
KSA has no significant elections. Nor does Kuwait or UAE. So how NK is run should not be on the table.
Want to read something interesting ppl? Start googling North Korea uranium mining. You really want them to ship some to ISIS?
I hope the date on this ban is sooner rather than later. The sooner it happens, the sooner the world accepts the idea that the future of transportation is not petroleum.
http://inhabitat.com/china-announces-plan-to-ban-sales-of-fossil-fuel-cars-and-shift-focus-to-evs/
Art Berman’s latest presentation at HGS:
http://www.artberman.com/tight-oil-long-term-debt-cycle/
Summary
Regarding the total liquids supply figures that we see in the news headlines. Had a look at some of the countries that provide separate crude oil and NGLs data. And found that since 2013, NGLs have contributed 31% of the total liquids supply growth.
(The NGLs figures for OPEC are only approximate as I don’t subscribe to the IEA and so there is no adjustment for the change in OPEC membership. Also OPEC figures contain some heavy oil).
For these 6 countries, since 2010, total liquids supply has increased 5.9 million barrels per day. But 1.7 million b/day, or 29%, of that growth is from NGLS.
MOMR September 2017 http://www.opec.org/opec_web/en/publications/338.htm
Overall not much change
Libya down -112.3 kb/day (Libya’s Sharara oil field is said to have reopened and is running at 2/3 capacity)
Nigeria up +138.3 kb/day
OPEC MOMR in 1000’s
OPEC down 79.1
Algeria up 4.1
Angola up 8.3
Ecuador down 0.3
Equatorial Guinea up 0.6
Gabon down 32.3
Iran down 2.3
Iraq down 23.1
Kuwait up 0.1
Libya down 112.3
Nigeria up 138.3
Qatar up 2.3
KSA down 10.3
UAE down 20.2
Venezuela down 31.9
EIA STEO Forecast Highlights, on this page https://www.eia.gov/outlooks/steo/
GoM predictions for 2018 were constant from June to July, but fell about 60 kbpd in August and a bit more this year, so down 130 kbpd (constant decrement for each month).
Low oil prices have not persuaded the EIA to change their world production growth forecast
The EIA forecast total liquids production to increase by 2.28 million b/day by December 2018
The USA is forecast to grow the most, increasing 1.56 million b/day. But only 0.80 is crude oil and the rest is NGLs at 0.76.
OPEC is the next largest with growth of 0.47 million b/day. Nearly a third is other liquids at 0.15 million b/day.
Norway and Canada are both forecast to increase about 0.2 million b/day
The largest decline forecast is Brazil with -0.4 million b/day
The September STEO has a lower estimate for US July production at 9,240 kb/day which is a gap of -177 kb/day from the average of weekly estimates.
Eia released July production showing 1761000 bpd, just 2000 bpd more than March’s 1759000 bpd. George called for July to struggle to beat March with Thunder Horse and Constitution coming back online. Cograts on nailing it George.