A Guest Post by Islandboy
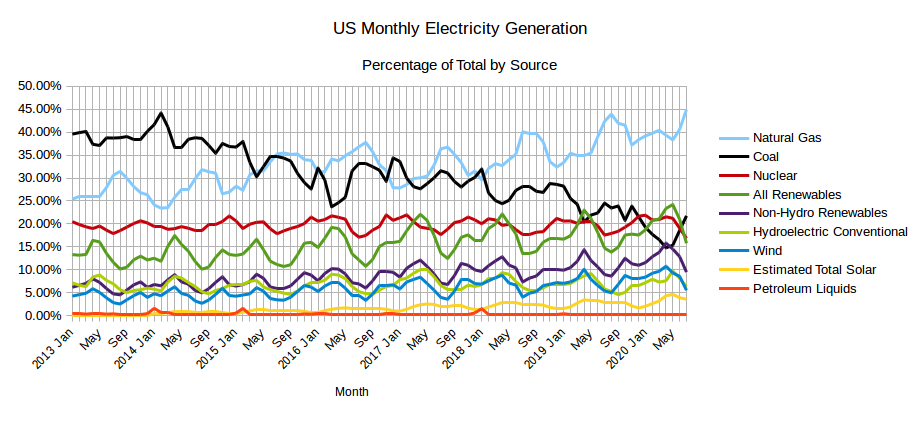
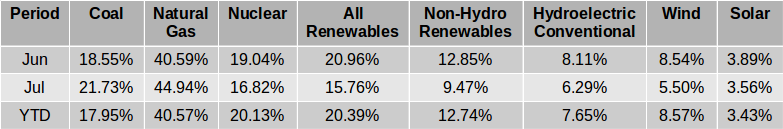
The EIA released the latest edition of their Electric Power Monthly on September 24th, with data for July 2020. The table above shows the percentage contribution of the main fuel sources to two decimal places for the last two months and the year 2020 to date.
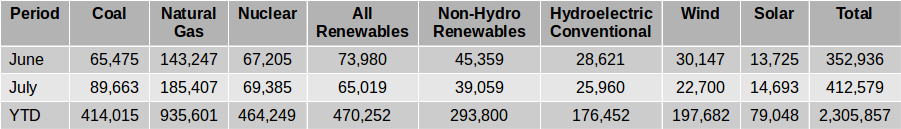
The Table immediately above shows the absolute amounts of electricity generated in gigawatt-hours by the main sources for the last two months and the year to date. In July the absolute amount of electricity generated increased as is customary between the months of June and July returning to pre-COVID levels with no discernible effects of the lock downs in response to any remaining COVID-19 restrictions. Coal and Natural Gas between them, fueled exactly two thirds (66.67%) of US electricity generation in July. The contribution of zero carbon and carbon neutral sources plunged from the record contribution of 45.41% in May to 32.58%. The percentage contribution from Natural Gas in July increased further to 44.94% from 40.59% in July.
Records Set
Natural Gas generated the most electricity over the course of a month in July at 185,407 GWh as well as hitting a record for it’s contribution to the mix at 44.94%.
July also saw the largest amount of electricity generated over the course of a month for the period covered by these charts at 412,579 GWh. Looking at the EIA’s Electricity Data Browser the only time more electricity has ever been generated over the course of a month was the month of August 2007 and the month of September in the years 2011 and 2012.
Solar also set a new record for monthly generation at 14,693 GWh exceeding the previous record of 13,987 GWh set back in May of this year.
The last record worthy of note in July was the commissioning of the largest utility scale battery in the world, the 250 MW Gateway Energy Storage project covered in this Green Tech Media article:
LS Power Energizes World’s Biggest Battery, Just in Time for California’s Heat Wave
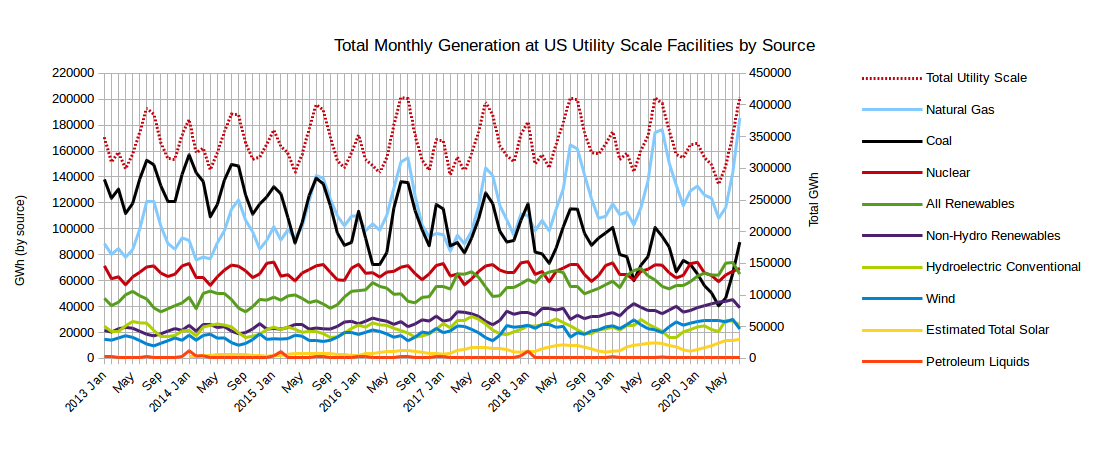
The graph below shows the absolute monthly production from the various sources since January 2013, as well as the total amount generated (right axis).
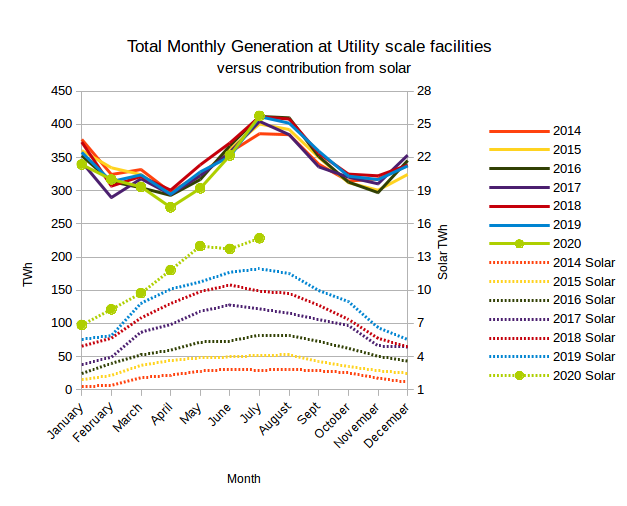
The chart below shows the total monthly generation at utility scale facilities by year versus the contribution from solar. The left hand scale is for the total generation, while the right hand scale is for solar output and has been deliberately set to exaggerate the solar output as a means of assessing it’s potential to make a meaningful contribution to the midsummer peak. In July 2020 the estimated total output from solar at 13,987 GWh, was 2.47 times what it was four years before in July 2016.
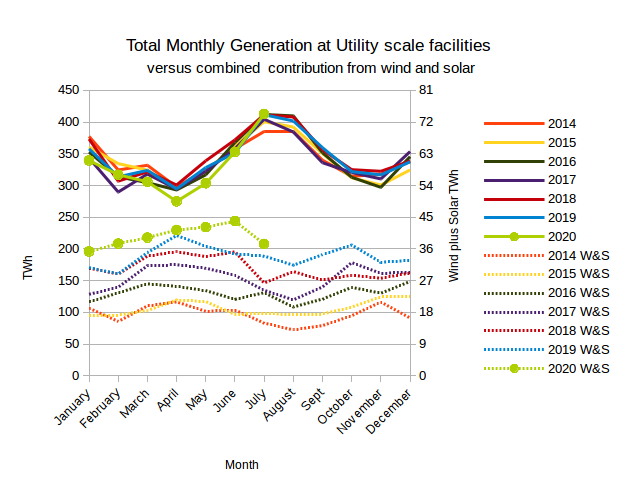
The chart below shows the total monthly generation at utility scale facilities by year versus the combined contribution from wind and solar. The left hand scale is for the total generation, while the right hand scale is for combined wind and solar output and has been deliberately set to exaggerate the combined output of solar and wind as a means of assessing the potential of the combination to make a meaningful contribution to the year round total.
Capacity Additions/Retirements
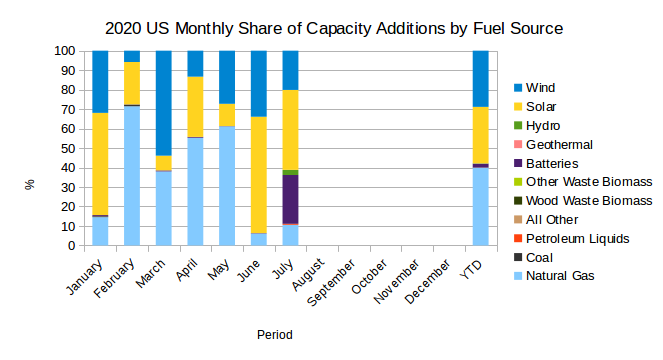
The chart below shows the monthly percentage contributions of the various sources to the capacity additions in 2020 up to July. In July Solar contributed 41.04% of new capacity and just over a quarter (25.10%) of new capacity came from Batteries, most notably the 250MW Gateway Energy Storage System in Southern California. Wind made up another 20.18% and Natural Gas contributing 10.58%. the remaining capacity additions came from Conventional Hydroelectric at 2.61% and Petroleum Liquids at 0.50%. Natural gas and renewables (including batteries) at 96.89%, continue to make up more than 95% of capacity added each month, as they have since at least January 2017.
In July 2020 the total added capacity reported was 1,001.2 MW, compared to the 622.4 MW added in July 2019.
The chart below shows the monthly percentage contributions of the various sources to the capacity retirements in 2020 up to May.
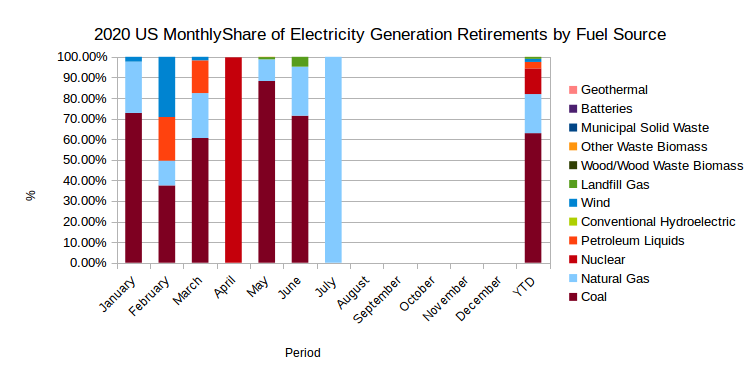
In July, the only retirements reported were a single, 31 MW Natural Gas fueled combustion turbine owned by the Northern Indiana Public Service Co. at its Bailly plant in Indiana and two Natural Gas Steam Turbines at the Willmar Municipal Utilities plant in Minnesota.
The 54.3 MW total retirements reported compared to the 992.5 MW reported in July 2019.
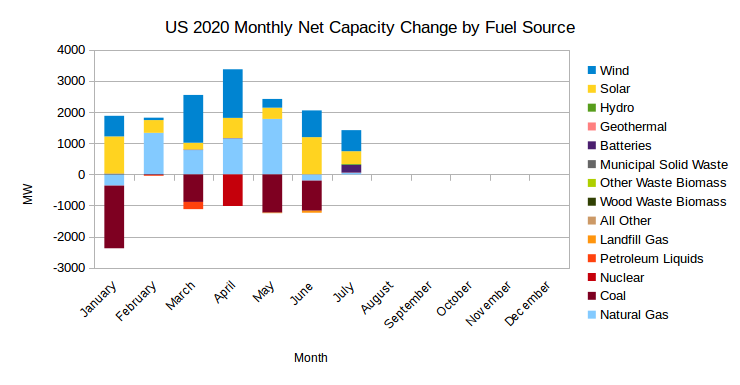
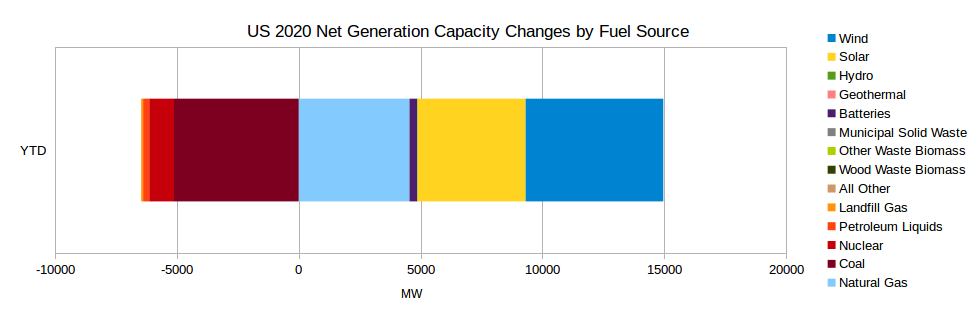
Below is a chart for monthly net additions/retirements in 2020 showing the data up to July, followed by a chart showing the net additions/retirements year to date.
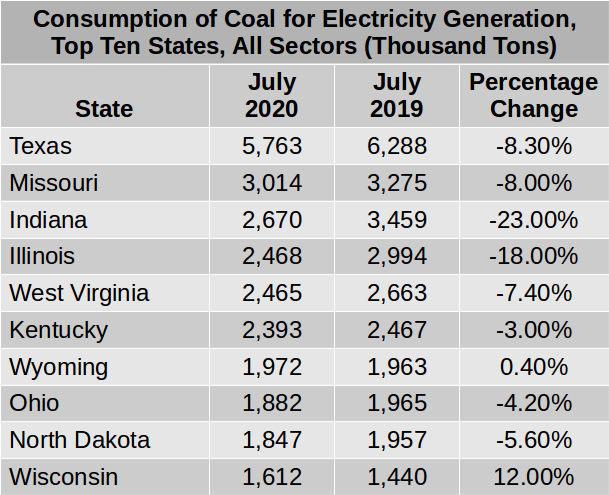
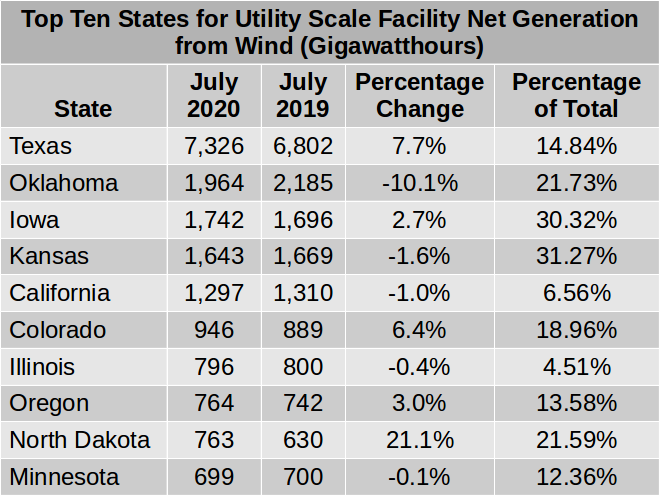
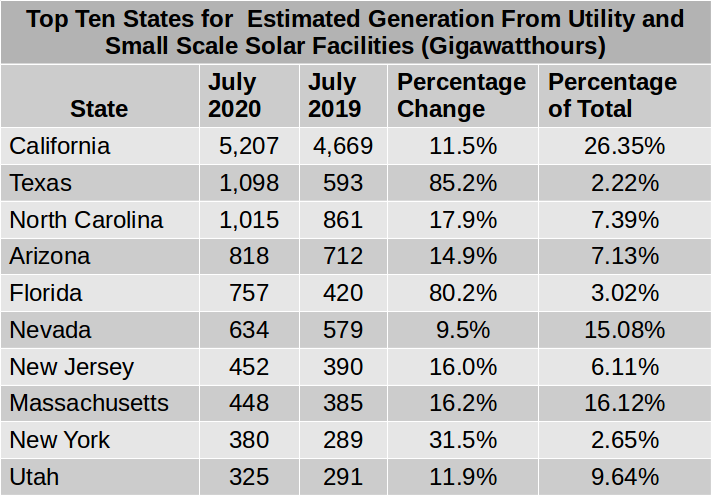
Below is a table of the top ten states in order of coal consumption for electricity production for July 2020 and the year before for comparison, followed by a similar tables for Natural Gas, Wind and Solar.
73 responses to “EIA’s Electric Power Monthly – September 2020 Edition with data for July”
Thanks once again for the good work IslandBoy.
I remain puzzled by the counting of ‘batteries’ as a fuel source.
” In July Solar contributed 41.04% of new capacity and just over a quarter (25.10%) of new capacity came from Batteries”
Surely energy stored in batteries is a source of electricity available for consumption, I acknowledge.
But the energy stored in batteries (or hydrogen or pumped hydro for that matter) was generated somewhere else, like from wind or solar or nuclear or hydroelectric facilities.
Are we sure this data is not a form of double counting the energy- first at site of primary production and then secondly at the site of energy storage?
This isn’t a measure of total energy, it’s a measure of capacity. Batteries do increase the maximum total energy the system could theoretically put out at any given time.
The wording in the title of the charts does need to be changed. Do you think “Fuel/Source” would be a better way of putting it?
Batteries and other forms of storage are a key component an energy system based on renewables. Without storage there are two big challenges with managing a renewable based electricity grid.
1) What is to be done with excess electricity when supply exceeds demand?
2) How are shortfalls to be met when renewable sources like wind and solar cannot meet the demand’
‘
Batteries assist with both of these challenges by soaking up excess power when available and providing an additional source when renewable sources are not up to the task.
Islandboy, adding a wee bit of global perspective to your post. ?
THANKS TO ASIA, COAL IS STILL KING WORLDWIDE
“Basedon recently released official economic data, and found 65% of the annual growth in energy consumption in 2019 came from fossil fuels, with coal accounting for 57.7% of China’s energy use. Coal plants, which burn approximately 54% of all coal used in the country, provide 52% of generating capacity and 67% of electricity output. China added about 40 GW of coal-fired power capacity in 2019—a 4% increase. As a result, the coal fleet’s average utilization rate fell below 50% on average. Even so, China is still building new supercritical coal-fired generators with 100 GW under construction, which would raise current coal capacity by nearly 10%. And, despite power generation from renewables expected to increase fourfold between 2018 and 2024, the IEA expects India’s coal power generation will increase by 4.6% per year through 2024, and for India’s coal demand to grow by more than that of any other country in absolute terms over the five-year forecast period.
Coal’s future is primarily in the electricity generation markets in Asia, with China, India, and Southeast Asia continuing to build coal-fired generating capacity. The IEA expects generation from coal power plants in Asia will exceed the drop in coal-fired generation in the U.S. and Europe so that coal remains the world’s largest generation fuel over the next five years. Coal may be struggling in the U.S., but it’s still king worldwide, and likely to remain so with Asia as its primary customer.”
https://www.powermag.com/thanks-to-asia-coal-is-still-king-worldwide/
Not to be forgotten:
Consumption of natural gas worldwide is projected to increase from 120 trillion cubic feet (Tcf) in 2012 to 203 Tcf in 2040 in the International Energy Outlook 2016 (IEO2016) Reference case. By energy source, natural gas accounts for the largest increase in world primary energy consumption. Abundant natural gas resources and robust production contribute to the strong competitive position of natural gas among other resources. Natural gas remains a key fuel in the electric power sector and in the industrial sector. In the power sector, natural gas is an attractive choice for new generating plants because of its fuel efficiency. Natural gas also burns cleaner than coal or petroleum products, and as more governments begin implementing national or regional plans to reduce carbon dioxide (CO2) emissions, they may encourage the use of natural gas to displace more carbon-intensive coal and liquid fuels.
World consumption of natural gas for industrial uses increases by an average of 1.7%/year, and natural gas consumption in the electric power sector increases by 2.2%/year, from 2012 to 2040 in the IEO2016 Reference case. The industrial and electric power sectors together account for 73% of the total increase in world natural gas consumption, and they account for about 74% of total natural gas consumption through 2040.
https://www.eia.gov/outlooks/ieo/pdf/nat_gas.pdf
And where is all that gas coming from? You guessed it.
AUSTRALIA IS THE LARGEST LIQUEFIED NATURAL GAS EXPORTER IN THE WORLD
“The record figure knocked Qatar out of the top spot, with the nation expected to produce 75Mt in 2019. Australia’s LNG exports were more than twice that of the United States, with the US Energy Information Administration forecasting 34.3Mt in 2019. LNG shipments out of hubs at Karratha, Gladstone and Darwin increased Australian exports by 11.4 per cent on 2018, largely due to growth from the Ichthys project, operated by INPEX. The largest contributing project to Australian LNG exports was the Woodside-operated North West Shelf project in WA, followed by the two Chevron-operated WA projects, Gorgon and Wheatstone.”
https://www.canberratimes.com.au/story/6568957/australia-now-the-worlds-largest-natural-gas-exporter/?cs=14231#:~:text=Australia's%20liquefied%20natural%20gas%20exports,A%2449%20billion%20in%202019.
Doug,
Do you know what is to be expected from Africa, regarding new coal plants ?
About China you write:
“ Coal plants, which burn approximately 54% of all coal used in the country, provide 52% of generating capacity and 67% of electricity output.“
Apart from generating electricity, do they use coal for example to heat houses like they did more than half a century ago in Holland ?
Well, according to data compiled by CoalSwarm, an industry watchdog, more than 100 coal-generating units with a combined capacity of 42.5 gigawatts are in various stages of planning or development in 11 African countries outside of South Africa — more than eight times the region’s existing coal capacity. Nearly all are fueled by foreign investment, and roughly half are being financed by the world’s largest coal emitter: China.
Hey Doug, I’m finding your attempts to troll me almost childish. Here’s the deal. My primary source of income has been severely curtailed by the pandemic. I have to spend more time to earn less now and don’t have as much free time to spend reading stuff on the internet. I prefer to spend the time I have reading the latest news about stuff that can boost my immune system help it beat COVID-19 should I get it, as I suspect many of us will eventually. I still read the news about the latest developments in renewable energy and EVs but, I can’t be bothered to troll you with them. Ain’t got the time.
In my neck of the woods, I’m not hearing anything about Peak Oil. Not much about renewable energy or EVs either. The latest craze among the owners of the sportier German cars and SUVs is to modify them so that they backfire and make a huge racket when the engines are gunned. The construction of multi-story apartment buildings is still continuing apace. With all that’s going on around me, I really have little time for all the moaning and “Chicken Little” discussions that go on around here.
As Ron has said, mankind is doing what nature compels us to do and there is next to nothing any of us can do about it. It is what it is (to quote the leader of the free world) and I am not going to spend my time worrying about melting glaciers in Antarctica or anything else that I have no control over. I am by no means denying that any of these awful things are happening, just don’t hold your breath waiting for me to respond to your trolling.
At Last, a Small Ray of Hope for Bolivia
I’m not sure the fact you hate Elon Musk is of general interest. Sounds like a personal problem.
Book: The Manufacturing of Greta Thunberg
I’m not sure the fact you hate Greta Thunberg is of general interest. Sounds like a personal problem.
ALIMBIQUATED, CAELAN makes a valid and interesting comment and you respond with a brainless reply — once again. BTW fossil fuels were, for awhile, a “high tech” solution to most of humanity’s problems and where has that got us?
ALIMBIQUATED, CAELAN makes a valid and interesting comment and you respond with a brainless reply
Doug, you are just now noticing that Alimbiquate does that? He often posts something interesting but his replies to other people’s posts are usually just ignorant put-downs. I have no idea why he does that as I am not a psychologist.
L.O.L Maybe phycologists would say it’s a case of low self-esteem? Or bullying? Certainly not conducive to adult conversation!
From what I can gather civilization is collapsing and Alim doesn’t much care for those who point out that the TechDaddy Cornicopian “power of hope” platitudes aren’t gonna cut it.
https://www.resilience.org/stories/2020-06-08/collapse-of-civilisation-is-the-most-likely-outcome-top-climate-scientists/
It’s a shoot the messenger kinda thing.
It looks like Texas and Florida are changing their minds about solar. Both show over 80% growth from a small base.
What may be surprising (if I read the tables correctly) is that Texas isn’t in the top ten for gas based generation and Florida is by far the largest. It seems odd that Texas is producing (and flaring) so much gas, but importing so much coal.
Good catch! Thanks for noticing this. I went back and looked at the source table and sure enough, as with most things with energy consumption, Texas is top of the heap! I use LibreOffice Calc, an open source spreadsheet application that i assume works the same as MS Excel. When I sort the data, any state that has “NM” (Not Measured) in the column for all sector Natural Gas consumption ends up at the top of the table. Up until June 2020 Montana had the “NM” in that column. To create the top ten table, I put together a little sub table that links to the values in the main table and was skipping the first row.
It’s fixed now and in the process I have decided that I will stop using the fuel consumption data for Coal and Natural Gas and use the electricity production data instead. This will allow me to calculate what percentage of the total is being produced by Coal and Natural Gas. I will post what the new tables will look like in later comments.
This is the table I plan to use for generation from coal. It does not match the consumption table but it allows us to see how much coal contributes to the electricity mix in the top ten states for the amount of electricity generated by coal.
I like the change. MWh output is more useful than tons of coal input.
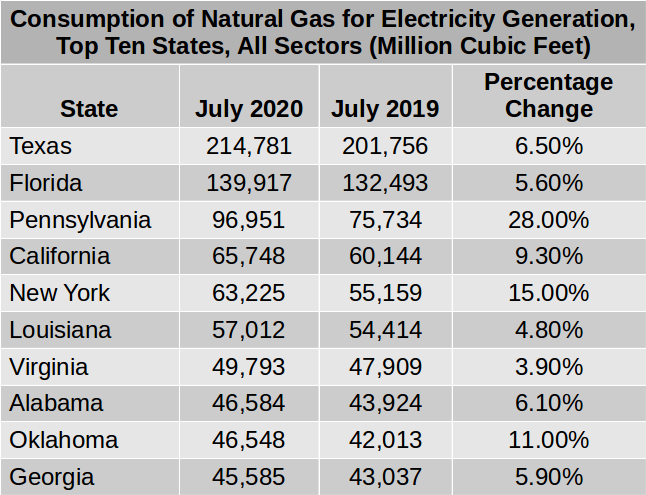
Below is the table for the top ten states for electricity generation using Natural Gas. It is almost an exact match for the table of the top ten stated for consumption of Natural Gas.
Islandboy,
I think some readers (or perhaps only me) might be confused by percentage of total in the last column, clearly it is not the percentage of total US natural gas use as in that case the top 10 would need to total less than 100%, clearly Texas uses more natural gas than any other state and about 58% of their total electricity output in GWh is produced by natural gas power plants, and 17% comes from coal, 15% from wind and about 2% from solar.
Haven’t heard much from the local in-house EV enthusiasts for awhile. Maybe this is the reason? So much for exponential growth!
“In the United States, EV sales dropped by 12 percent in 2019, with only 320,000 units sold. Meanwhile, sales in Europe rose by 44 percent, to reach 590,000 units. These trends continued in first-quarter 2020 as EV sales decreased from the previous quarter by 57 percent in China and by 33 percent in the United States.” Putting this in perspective in 2019, the auto industry in the United States sold approximately 17 million light vehicle units.
https://www.mckinsey.com/industries/automotive-and-assembly/our-insights/mckinsey-electric-vehicle-index-europe-cushions-a-global-plunge-in-ev-sales#:~:text=In the United States, EV,percent in the United States.
Meanwhile,
FOSSIL FUEL SUBSIDIES NEED GLOBAL REFORM
“As of 2018, “advanced countries were still spending some $800 billion per year to support purchases of fossil fuel products and services, versus $140 billion for all subsidies worldwide on renewable power generation.”
An example, you say, well according to the Alaska Department of Revenue’s website, the state of Alaska gave $7 billion in oil tax credit subsidies to the oil and gas industry over the course of the seven years from 2013 to 2019. Some of that money went into subsidizing relatively high-cost oil, although it has not been needed for the lower-cost Prudhoe Bay and some other oil fields. The interesting thing is that the oil and gas sector workforce averages 12,500 people per year. With an average of $1 billion in tax credits per year, the state of Alaska is giving the oil and gas industry $80,000 per job.
Further, the Norwegian Ministry of Finance has estimated the size of its oil subsidy since 2013. In the period 2013 – 2017, oil and gas companies have been subsidized with more than NOK 85 billion (more than €8.7 billion) according to the ministry. Some might suggest that this is money that should have been spent on ensuring a clean and just transition away from fossil fuels rather than on making the climate challenge even harder to meet.
https://phys.org/news/2020-10-fossil-fuel-subsidies-global-reform.html
I’ll try to satisfy you Doug-
The falloff in auto sales affects pretty much all vehicles and all countries-
‘Global new vehicle sales fell 25 to 30% in the first half, including 15% in China, 24% in the U.S. and 40% in Europe, according to a report in the late summer from Fitch Ratings.’
I expect ICE sales to pick up again for 3-5 before peaking.
From there, say 2025, PHEV and EV will rapidly become the norm.
Remember, a PHEV (having a battery pack and ICE) can cuts ones oil use by 70% easily. With no sacrifice in range or power. There are now several vehicles available in N America with 30-40 miles electric only range. The average miles driven/day by American drivers is 29.2
Hickory,
“Remember, a PHEV (having a battery pack and ICE) can cuts ones oil use by 70% easily. With no sacrifice in range or power. There are now several vehicles available in N America with 30-40 miles electric only range.“
That doesn’t make Peakoil look too dangerous. It is the combination with climate change, population overshoot, dropping water tables and the consequences like migration that makes future precarious.
Not to mention the tremendous amount of consumer debt in many countries.
Agree Han.
Peak oil can be handled by the worlds economy, if the downslope is gradual.
Its a race between depletion and replacement by electrical transport.
The technology is in place for electric transport, although continued improvement in battery density/lifecycle/cost/and chemistry (from an environmental standpoint) would be a most useful occurrence.
But peak oil, if the downslope is quick, remains a dire issue.
In 10 years, if there was 30% less oil/capita- the world still turns, and fields still get fertilizer, electric motors still get produced, people give birth, and wars get fought. And the climate will still be getting hotter.
Here are two plugin hybrid (EV/ICE) vehicles that get over 30 miles electric-
https://www.chrysler.com/pacifica/hybrid.html
Range: 32 mi battery-only, 520 mi total
https://www.toyota.com/rav4prime/
Range:42 mi battery-only, 530 mi total
So, how are EV sales doing in the second and third quarters of 2020? Seems like there were other events going on in the first quarter of 2020 that might have influenced EV sales.
I don’t keep track of all this data, since its the big trend that is makes matters.
If you are eager to know, here is the recent data from one manufacturer- Tesla delivered 139,300 vehicles in the third quarter of 2020 breaking a previous record of 112,000 set in 2019.
What other light vehicle manufacturer set all-time sales/delivery record in Q3?
They don’t even sell a truck yet, but have logged about 700,000 pre-orders for the cybertruck.
Hi Hickory,
I casually track the data and do know that Tesla sold those 139,300 vehicles and set company records for sales and deliveries in Q3.
I was just wondering why Doug was giving an old news summary of EV sales from way back in the first quarter of 2020. Even just six months later, that seems like an eternity ago considering what all has happened.
I am following the construction of Giga Berlin and Giga (or Tera) Austin closely. Not to mention anything to do with SpaceX and The Boring Company.
Outside of that, I can almost track the polling for President by watching the solar and other green energy stocks. Looks like Biden has it so far since the stocks are way up.
Yes Songster.
I do expect solar to be a big a winner this decade. Even more so with a Biden presidency and proactive energy policy. Looks like the ‘market’ expects that as well.
It seems that perhaps rapid economic contraction is not so good for the transition to free and clean energy.
Warning Detour Ahead.
Bad News Insinuated & Peddled As Good News
Doug, there appears an insinuation– that some people even seem to depend on– that increases in sales– and to a human population of ~ 8 billion with the kind of lifestyle it has and/or is indoctrinated and/or more or less forced to ‘want’– of many industrial mass-produced ‘goods’ are good news, such as for the environment.
As we well know, however, increased sales of many industrial mass-produced ‘goods’, such as electric vehicles, that are often charged by remote, large-scale centralized C02-emitting coal-fired, wood-/etc.-fired, and natural-gas-fired power-plants and still require thousands of miles of vast asphalt and roadway infrastructure that need constant work, upgrades, maintenance and that bury and cut over vast stretches of natural habitat, are often a bad thing, to put it very mildly.
Seeing and promoting a product, such as an EV, completely out of context with that kind of reality, save for ‘increased sales’ in it, is myopic and reckless in the extreme, but nevertheless clearly demonstrates what we and the rest of the planet are up against.
The total light vehicle sales fell by 29% in the first quarter of 2020. Growth in EVs has indeed slowed which is expected as the 50% growth rate early on was not likely to continue. Also subsidies are being phased out or reduced in various markets (US and China) which has an effect on sales.
An increased proportion of EVs and plugin hybrids will not save the World, but in combination with a higher proportion of wind and solar output, less vehicle use, more efficient vehicles, and more efficient use of energy in general, carbon emissions might be reduced relative to an alternative scenario where things remained as they have been in the past. Not a panacea, just one small step in the right direction.
A whole food plant based diet would also help.
https://nutritionstudies.org/whole-food-plant-based-diet-guide/
Islandboy,
The link for the battery article isn’t working – it seems to be concatenated with a POB URL.
Thanks Nick. I checked and found that the link to the EIA’s Electricity Data Browser was also broken. I fixed the links and also changed the table for the ten states for coal consumption to correct for an error that omitted the state of Missouri in the initial version of that table .
Not good. BTW, I don’t apologize for global perspective. After all, in the final analysis, what else matters?
GLOBAL COAL PRODUCTION WILL GROW THIS YEAR DESPITE COVID-19
“Global coal production is expected to grow only marginally in 2020, from 8.13 billion tonnes in 2019 to 8.17 billion tonnes in 2020, a growth of only 0.5% after three consecutive yearly increases, due to the disruptions caused by the coronavirus pandemic, says GlobalData….
Thermal coal production is expected to grow by 0.5% to 7.05 billion tonnes, while metallurgical coal production is forecast to be flat at 1.1 billion tonnes. Over the next four years, production of thermal coal is expected to grow at a compound annual rate of 1.9% to reach 7.6 billion tonnes by 2023, due to increasing demand from India and China.”
https://www.mining.com/global-coal-production-to-grow-by-0-5-in-2020/#:~:text=Global%20coal%20production%20is%20expected,the%20coronavirus%20pandemic%2C%20says%20GlobalData.
Respecting gas (global perspective):
“2019 was another year of continuous growth for the gas industry, with global consumption growing 2.3% to a new record. Supply rose in most regions around the world and producers took final investment decisions on a record 97 billion cubic meters of per annum of LNG liquefaction projects. LNG trade also grew 13% in 2019, the fastest since 2010, propelled by rising demand in new markets like South Asia and growing liquidity in the spot and derivatives markets. Major new pipelines, including a new link between Russia and China, were commissioned. Covid-19 has caused significant disruption. Initial assessments suggest that gas demand will decline by around 4% this year, and LNG trade by a similar amount. However, abundant supply and continued cost-competitiveness, aided by a push for cleaner air, can lead to a recovery in demand to pre-Covid-19 levels in the next two years, as the global economy regains momentum.”
https://www.igu.org/app/uploads-wp/2020/08/GGR_2020.pdf
Getting off fossil fuels you say. Well, not here.
TRANS MOUNTAIN PIPELINE EXPANSION ON SCHEDULE, ON BUDGET:
“A year after construction was allowed to restart on the Trans Mountain pipeline expansion, its chief executive says the project is on budget and on schedule for completion by the end of 2022. The project is advancing as expected despite challenges including the COVID-19 pandemic, a global slump in demand for fuel, a $5.2-billion rise in its estimated cost to $12.6 billion in February and ongoing protests by opponents. The expansion project is designed to triple the capacity of the existing pipeline between Edmonton and a shipping terminal in Burnaby, B.C., to about 890,000 barrels per day of products including diluted bitumen, lighter crudes and refined fuels such as gasoline.”
https://globalnews.ca/news/7336917/trans-mountain-pipeline-expansion-on-budget/
Big surprise, to me anyway; thought this was decades away — if ever.
IMF ADMITS CHINA HAS OVERTAKEN THE US AS THE WORLD’S LARGEST ECONOMY
“The world is waking up to a new reality post the devastating pandemic that brought everything to a grinding halt. One of them is the rise of China as the undisputed new economic superpower. Yes, you read that right. The International Monetary Fund (IMF), using the more reliable and now widely accepted yardstick, called the Purchasing Power Parity (PPP), has determined China’s economy at $24.2 trillion compared to America’s $20.8 trillion. Bloomberg did its own calculations of the IMF data, which shows the proportion of worldwide growth coming from China expected to increase from 26.8% in 2021 to 27.7% in 2025. That’s more than 15 and 17 percentage points, respectively, higher than the U.S share of expected global output.”
https://eurasiantimes.com/imf-admits-china-has-long-overtaken-the-us-as-the-worlds-largest-economy-but-why-is-the-media-silent/
Perhaps of bigger concern!
“In the last few years, there had been hopeful signs that China’s CO2 emissions were flattening. However, [China’s] CO2 emissions rose in 2018 and 2019, and we estimate 2020 GHG emissions will increase by 0.8% in our upper bound and decrease by 7.7% in our lower bound compared to 2019 levels, with most of the drop due to the pandemic.
China’s coal activities remain a large concern and are inconsistent with the Paris Agreement. It would need to phase out coal before 2040 under 1.5˚C compatible pathways, but it appears to be going in the opposite direction. After lifting a previous construction ban on new coal plants in 2018, China has rolled back policies restricting new coal plant permitting in each of the last three years. By mid-2020 China had permitted more new coal plant capacity than in 2018 and 2019 combined, bringing its total coal capacity in the pipeline to 250 GW, and brought 10 GW of new plants online. China is going against the global shift away from coal and now possesses roughly half of the world’s coal power capacity as well as coal-fired power plants in development.”
https://climateactiontracker.org/countries/china/
Meanwhile, words of wisdom from Mauna Loa: “Marking the latest CO2 records is not an act of celebration, but of bearing witness. The achievements are a sobering reminder of the chemical changes that we humans are collectively making to the atmosphere — changes with disruptive impacts that affect every living being in the biosphere. When a new record is reached, it is is marked here with an invitation for people to take notice, reflect on the transformation that is going in the wrong direction, and resolve to reverse these trends. Reversing the trend is not something that any one person can achieve on their own. But individuals and groups can build on this CO2 Earth initiative by taking steps that help make the CO2 indicator for planetary health as ubiquitous as our stock market updates and weather reports. Consider sharing the CO2 Earth updates and records with people and groups that are part of your information-sharing circle.”
https://www.co2.earth/co2-records
Finally, Tuesday morning trivia:
‘OFF THE CHART’: CO2 FROM CALIFORNIA FIRES DWARF STATE’S FOSSIL FUEL EMISSIONS
• This year’s fires in California have already burned through 1.4 million hectares (3.4 million acres) of land, and the fire season isn’t set to end for at least a couple of months.
• The fires have already generated more than 91 million metric tons of carbon dioxide, which is about 25% more than the state’s annual emissions from fossil fuels.
• Higher carbon emissions contribute to a multipart climate feedback, accelerating climate change which then sets the stage for more fires that will emit an increasing amount of carbon dioxide, experts say.
https://news.mongabay.com/2020/09/off-the-chart-co2-from-california-fires-dwarf-states-fossil-fuel-emissions/#:~:text=It's%20estimated%20that%20the%202020,Fire%20Emissions%20Database%20(GFED).
Keep it coming Doug. All important news.
How do we pay the coronavirus debt. That is the debt that all the relief packages that the virus will bring? There is one way, there is only one way. I don’t like it a damn bit but it is going to happen. There will be no other way and no way to stop it.
Inflation Is the Way to Pay Off Coronavirus Debt
By letting prices rise faster, the Fed can ease the burden of heavy borrowing.
And this one was before the virus, the debt brought about by the tax cut for the rich.
How Will We Deal With All the Debt?
The federal government’s deficit for 2019 should come in around $1 trillion. That’s the equivalent of about 5.1% of our gross domestic product (GDP). And it will push the total federal debt to more than $22 trillion.
Inflating Away the Debt
For now, inflation is the only real option. For a while my prediction has been that the Fed will print money to fund U.S. deficit spending. This is known as “monetization.” And eventually it will stoke serious inflation. I believe this is why we’re hearing so much about Modern Monetary Theory, which is essentially just deficit spending combined with monetization. We’re starting to see this play out now.
And from the google search “Inflating the debt away”:
First, inflating away debt is an act of redistribution from lenders to borrowers; creditors will oppose having their assets eroded. This anger might be blunted by reminding creditors that inflation also reduces the real value of the taxes they’ll have to pay to service government debt.
My opinion: We are going to have a recession. The massive government spending, that is the public relief efforts, will bring about an enormous debt. This will bring about massive inflation, the kind of inflation we had in the seventies and early eighties. That is, or will be, the only way to deal with the debt. I hate to see this because I live on a fixed income. But it is going to happen. There is just no way to stop it.
Ron,
When you refer to massive spending (and resultant borrowing), are you talking about spending happening now?
Yes, in the past four years and the future spending that will be required because of the recession. And of course the lack of taxes due to Trump’s massive tax cut for the super-wealthy. The national debt cannot possibly continue to increase. Something has to give.
Most of the spending has stopped as the Republicans do not think it is necessary. But millions are unemployed. A massive recession will be the result. If we don’t spend it will be a disaster. If we do spend it will be a disaster. The covid pracademic leaves no way out. It is a predicament of which there is no cure.
But just in case you do not think this is a problem, I give you the following:
Trump took office in January 2017 after promising to eliminate the national debt during his presidency. When he took the presidential oath, the national debt stood at about $19.95 trillion. As of August of this year, the national debt was estimated to stand at about $26.73 trillion—an increase of about $6.78 trillion during Trump’s tenure and a drastically different result from what the president promised.
If you think there are no consequences of continuing to increase the debt, you are sadly mistaken.
I agree Ron. I have heard the process of reckoning with the debt called “the Great Reset”, and one day ‘kick the can down the road’ won’t cut it anymore. Very surprised how good the world has been at playing the delay game.
When will it end- no idea. When it does, it will be hell for tens of millions. Depression level hell I suspect.
But we are on a treadmill of debt, and their is no way to slow it down without severe pain to too many.
best luck to everyone who will experience it. Get your solar beforehand. Its nice to have some energy.
btw- I knew this girl when I was young, in school. She was smarter than everyone, and seemed wise and calm for a youngster. I’ve read she may become Bidens treasury secretary. Big job to handle.
I have a question : where do come from the increase of production of electricity coming from coal power plant during these last months? Indeed, during this time, the retirements of electricity production facilities did concern essentially coal power plants.
Even though some coal plants have been closed, the US still has too much coal capacity. It’s about 225GW now, and in July it was only about 54% utilized, even though July electrical demand was unusually high. https://www.eia.gov/todayinenergy/detail.php?id=44976
Utilization of 54% is well below the historical level of about 75% for coal. Many more coal plants will close in the coming years…
Its a good question JF Fleury. Usually we see some uptick in the winter, but this has happened in the summer.
We find that by 2030 electricity systems comprised entirely of solar, wind and batteries (SWB) can provide both the cheapest power available and two to three times more total energy than the existing grid in the continental United States
RethinkX new energy report: https://www.rethinkx.com/energy
“We are on the cusp of the fastest, deepest, most profound disruption of the energy sector in over a century.”…
lots of food for thought within.
The 2020 annual update of the Lazard 30yr levelized cost of energy has been released (version 14)-
https://www.lazard.com/perspective/levelized-cost-of-energy-and-levelized-cost-of-storage-2020/
Two alarming articles:
3 charts showing the alarming decline of Arctic sea ice this year
Braving the elements like this is part of essential research: Sea ice is a bellwether of the climate change in the Arctic. Due to our ever-increasing greenhouse gas emissions, the Arctic surface air temperatures have been warming rapidly — at twice the rate of the global average.
Historically, during the winter, sea ice has covered a vast swath of the Arctic Ocean, which fills much of the Arctic Circle. But as temperatures rise, it has been shrinking 12 percent every decade since measurements began in 1979.
Sea ice coverage fluctuates seasonally, hitting a low in September before forming again as temperatures drop in the fall — and expanding again by two to three times by the end of the winter in March. Webster and her team surveyed the summer conditions and the beginning of the “re-freeze.” But this year, that regrowth has been slower than ever. As October comes to a close, sea ice is at its lowest level for the month in recorded history.
‘Sleeping giant’ Arctic methane deposits starting to release, scientists find
Scientists have found evidence that frozen methane deposits in the Arctic Ocean – known as the “sleeping giants of the carbon cycle” – have started to be released over a large area of the continental slope off the East Siberian coast, the Guardian can reveal.
High levels of the potent greenhouse gas have been detected down to a depth of 350 metres in the Laptev Sea near Russia, prompting concern among researchers that a new climate feedback loop may have been triggered that could accelerate the pace of global heating.
The slope sediments in the Arctic contain a huge quantity of frozen methane and other gases – known as hydrates. Methane has a warming effect 80 times stronger than carbon dioxide over 20 years. The United States Geological Survey has previously listed Arctic hydrate destabilisation as one of four most serious scenarios for abrupt climate change.
There is a lot more to both articles, as well as charts for the first one.
from the second article –
“At one location on the Laptev Sea slope at a depth of about 300 metres they found methane concentrations of up to 1,600 nanomoles per litre, which is 400 times higher than would be expected if the sea and the atmosphere were in equilibrium.”
Freeze his Assets-
https://www.politico.com/news/magazine/2020/10/28/is-president-donald-trump-a-flight-risk-433313
I’ve been pondering this with a pal of mine recently. The main issue was “Where?” Ken thought Dubai; I had thought Saudi Arabia before it dawned on me that there is only one option: Russia. No place else where he would (maybe) be welcomed and that was safe from American political pressure and SEAL teams.
Trump owns a Boeing 757: what would stop him from landing Air Force One, walking across the tarmac to board his 757, denying the Secret Service entry, and taking off?
Of course, Putin would have to consider if rubbing the West’s nose in it outweighs the problems of having a really stupid loose cannon around. Also, showing that Russian disinformation and political interference is real is not in Putin’s interest. More likely that Trump goes in and is never seen again.
Maybe a mysterious plane crash…
Maybe North Korea. Two buddies could play video games together.
Tesla Cybertruck to be built in Texas (with over 700,000 pre-orders) is said to use about 1/3rd as much energy/mile as the old Ford Pinto.
Not shabby.
https://insideevs.com/news/451303/tesla-cybertruck-efficiency-clean-future/
This is Really – really BIG news – Think about it. https://www.evnewsdaily.com/2020/10/20/foxconn-unveils-electric-car-chassis-19-oct-2020/
Yes, Foxonn is a very serious company.
““Foxconn, the Taiwanese electronics contract manufacturer that’s best known for assembling Apple products, has rolled out an automotive EV platform, part of a push to become a manufacturer of electric-car components. At the unveiling in Taipei, Foxconn Chairman Liu Young-way said he’s targeting a 10 percent share of the global EV market as soon as 2025.” says Autoblog: “The chassis is described as “open-source,” with customizable elements including size, wheelbase, suspension type, and battery size. Partner automakers could fine-tune it to their needs, and Foxconn would assemble it for them. The company additionally said it plans to introduce a solid-state battery for EVs in 2024 that would be superior to today’s lithium-ion electric-car batteries.”
Financial Times says: “The world’s biggest contract electronics manufacturer aims to become “the Android of EVs”, William Wei, chief technology officer, said at an event on Friday in reference to the open source operating system through which Google created a massive part of the global smartphone industry. Analysts say Foxconn is seeking to replicate its long-established dominance in the global manufacturing of personal computers and smartphones, the largest electronics category by shipments over the past 30 years, in the production of EVs.”
From PowerOutage.us 1.7 million meters cold.
Every Power meter requires tons of Herbicides per decade for vegetation management. Only Toxic power from the meter. Power Poles are the #1 killer on the Highways. How many reactors in the Path of Zeta were scramed?
Remember when wildlife reserves were protected areas? What an old fashion naïve idea!
WHEN OIL DRILLING MEETS THREATENED WILDLIFE
It’s home to endangered wild dogs, lions, leopards, giraffes, pangolins, and one of Africa’s biggest concentrations of elephants. Nestled among the scrub are hundreds of species of birds, reptiles, and amphibians. The Okavango region, in northwest Botswana and northeast Namibia, is spectacularly biodiverse, and the Okavango Delta itself is a UNESCO World Heritage site, a landscape of “exceptional and rare beauty” and an “outstanding example of the complexity, inter-dependence and interplay of climatic, geo-morphological, hydrological, and biological processes,” UNESCO says.
Except: there is oil. And gas. Probably. As much as 31 billion barrels, one company believes. On Wednesday, Laurel Neme and Jeffrey Barbee reported that a company called ReconAfrica has licensed more than 13,600 square miles in the Okavango region—just west and north of the delta—to explore a massive geological formation. One industry media source called it possibly “the largest oil play of the decade.”
“And the things, all the resources I have, they will disappear one day. I mean, I won’t be this person for a long time. Soon people will lose interest in me and I won’t be so-called “famous” anymore. And then I will have to do something else. So I’m trying to, as long as I have this platform, use it.” — Greta Thunberg
https://mail.yahoo.com/d/folders/1/messages/APMRO4MGI64kX5sS0AUJEHQrK7E
Meanwhile in Ohio-
” guilty pleas of two of four lobbyists charged in July in a federal racketeering probe into the nearly $61 million campaign to fund the passage by Ohio lawmakers of a $1.5 billion public bailout of two northern Ohio nuclear power plants previously owned by FirstEnergy and two coal-fired plants on the Ohio River jointly owned by the state’s utilities.”
Yep, they undertook illegal maneuvers to help with taxpayer bailout of nuclear and coal power plants.
Needing a public bailout to keep your industry alive (this was before Covid) is not strong sign for an industry, in case you were wondering. I thought so-called acting trump president had promised to save them (with all the money Mexico paid for the border wall?)
CLIMATE CHANGE, WE’RE ENTIRELY OUT OF MARGIN
“In 1988, when the NASA scientist James Hansen first alerted the public to the climate crisis, the CO2 number had grown to three hundred and fifty ppm, which we’ve since learned is about the upper safe limit. Even then, though, we had a little margin, at least of time: the full effects of the heating had not yet begun to manifest in ways that altered our lives. If we had acted swiftly, we could have limited the damage dramatically.
We didn’t, of course, and we have poured more carbon into the atmosphere since 1988 than in all the years before. The atmospheric concentration of CO2 has topped four hundred and fifteen ppm — that’s much too high, something that we know from a thousand indicators.
Last week came the news that the Arctic is stubbornly refusing to refreeze at its normal rate as the long northern night descends. The second biggest fire in Colorado history has closed Rocky Mountain National Park. California is white knuckling its way through yet another siege of high winds in a record fire season that refuses to end. Tropical Storm Zeta formed in the Gulf of Mexico — and the next big storm will take us deeper into the Greek alphabet than we’ve ever gone before. And that’s just in the one per cent of the planet’s surface that’s covered by the continental U.S. It’s a lot worse in a lot of other places, because they lack the money that keeps us fairly resilient.
https://www.newyorker.com/news/annals-of-a-warming-planet/on-climate-change-were-entirely-out-of-margin
Meanwhile,
Could things get any worse on virus front? Apparently, the answer is yes.
CORONAVIRUS MUTATION MAY HAVE MADE IT MORE CONTAGIOUS
“A study involving more than 5,000 COVID-19 patients in Houston finds that the virus that causes the disease is accumulating genetic mutations, one of which may have made it more contagious. According to the paper published in the peer-reviewed journal mBIO, that mutation, called D614G, is located in the spike protein that pries open our cells for viral entry. It’s the largest peer-reviewed study of SARS-CoV-2 genome sequences in one metropolitan region of the U.S. to date.”
https://medicalxpress.com/news/2020-10-coronavirus-mutation-contagious.html
Doug ,keep plugging . Arctic ice and methane emissions are elephants in the room . I read about peak oil in 2005 and also climate change . The view was peak oil would come first . The changes in climate change have gone exponential . I follow Paul Beckwith and Guy McPherson on these topics . Give’s me the jeepers . Keep up the good work . The light at the end of the tunnel may not be the end of the tunnel but a train approaching . We need guys like you to enlighten the public for the difference .
Yeah, just read the following in MIT Technology Review. Currently climate scientists seem to be about equally divided between hope and despair, maybe now with a majority tipping toward despair.
THE YEAR CLIMATE CHANGE BEGAN TO SPIN OUT OF CONTROL
“At more than 400 parts per million, we’re already well beyond dangerous levels of carbon dioxide concentrations in the atmosphere, as climbing temperatures, melting ice caps, and extreme weather events have made clear. So, despite all our climate policies, global accords, solar advances, wind farms, hybrid cars, and Teslas, greenhouse-gas emissions are still moving in the wrong direction. And as long as we’re emitting any at all, we’re only making the problem worse.”
https://www.technologyreview.com/2018/01/04/3591/the-year-climate-change-began-to-spin-out-of-control/
Doug , I acknowledge you know more than me . My view is that the train has left the station . The question now is when does it catch speed and when does it hit the wall . The speed of change has me all wrangled up , but I will go out on a limb on this . Upper limit 2025 when we will hit the wall in combination with peak oil . I am no expert but connecting the dots does not give me a later year .
Well, there are parts of the Earth system that have the potential to change abruptly in response to warming. These systems have so-called “tipping points” or positive feedback mechanisms. So, rather than a bit more warming causing slightly hotter heatwaves or more melting of glaciers, they cause a dramatic shift to an entire system. In Hansen’s tribute to scientist Prof. Charles Keeling, given at the American Geophysical Union, Hansen warned: “We are on the precipice of climate system tipping points beyond which there is no redemption.” That’s it in a nutshell!
A new US August oil production has been posted.
http://peakoilbarrel.com/hurricanes-impact-us-august-oil-production/#more-29056
A new open Thread Non-Petroleum has been posted.
http://peakoilbarrel.com/open-thread-non-petroleum-october-31-2020/
I posted your article to reddit! Check it out!