A Guest Post by George Kaplan
EIA reserve estimates for USA for 2016 have been issued (a couple of months later than usual). The numbers they provide are ‘proven’ reserves of crude, condensate and natural gas.
The data is provided directly by the E&Ps with some adjustments made by EIA for missing numbers. The data show reserves for the end of a given year, plus the reasons for change over the year: basically discoveries, production, revisions and sales. Until 2015 EIA had different categories for discovery (essentially a new reservoir, although there may be new pockets in existing freservoir) and extension (an increase in the area of an existing field). Recently most of this category has been extensions to LTO fields (i.e. an increase in the expected economic drainage area of a play). This year the reporting has changed so all discoveries and extensions are reported as a single figure and I’ve shown only this sum for previous years too. I have summed revision gains and losses plus adjustments to give a net number, and similarly for sales and acquisitions.
This year the data include non-producing reserves. I don’t know for sure if this is new but I haven’t noticed it before and can’t find any history for previous years. ‘Non-producing’ may mean reserves behind wells that are offline (e.g. are uncompleted, for maintenance or because of lack of processing or transport capacity); or that have real development plans for their production (typically starting within the next five years according to SEC rules, although for large, long cycle conventional projects the time can be extended). The undeveloped values for 2016 are shown on each chart.
‘Probable’ reserves are not included but I think this contribution might now be a relatively small proportion overall. The conventional oil reserves are in mature fields and these tend to have decreasing proportion of probable as they age – see below for the GoM, where BOEM 2P numbers are actually lower than EIA 1P estimates. For LTO there are few new fields each year and production growth comes from incremental development of known fields. In theory the expected recovery should be fairly well known but there are some really large revisions both up and down each year, which might indicate the E&Ps don’t have much idea, so setting reserves as proven versus probable maybe isn’t very meaningful.
The discussion here covers mostly crude for the USA, the GoM and the main tight oil plays, plus some look at natural gas overall and in the GoM. For some of the shale plays I have made some high level guesses about future well numbers, which I’ve based on figures from Enno Peter’s excellent shaleprofile blog.
USA Total Oil
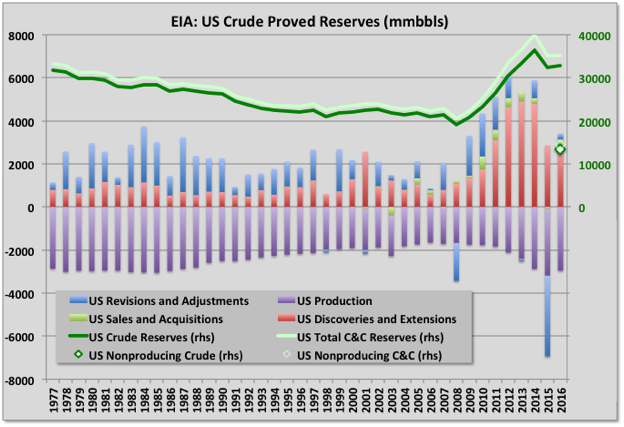
Total proven oil reserves for US in 2016 rose slightly: production was about equal to discoveries and extensions plus small net increases from acquisitions and revisions (see chart above). Although the overall net revision was small both the total increases and decreases exceeded 5 Gb, which is high relative to total reserves, for decreases this is the second highest number after last year and is likely to be a reflection of the uncertainties associated with tight oil plays as there is no history for any being run through a full life cycle. In fact the two revision numbers were almost equal and the change came from ‘adjustments’, which is a catch-all category used to make the numbers balance and might well just be a rounding error. The average price of oil fell in 2016 compared to 2015, which likely had an impact on some marginal areas.
Discoveries and extensions were about equal to 2015 and well down on 2013, which looks like the peak of a bell curve for tight oil growth that started in 2005. If so then it should drop down now through 2021, although possibly extended a year or so because the price crash in 2015 looks to have had a significant effect.
I have shown condensate for total reserves, though not the yearly adjustments, which for some reason EIA don’t give in the same format, by region, as they do for crude (neither do they do it for natural gas or NGL). Condensate reserves have been growing significantly because of shale gas but fell slightly this year.
Global conventional oil discoveries dropped to a new record low in 2015 and again in 2016. Combined with the USA tight oil numbers the drop is even more pronounced. Conventional oil saw another small drop in 2017 and that looks the most likely course for tight oil too, given the recent trend.
Non-producing reserves are shown as the green diamond and are just over a third of the total, and this a common proportion across different plays and for oil or gas. For conventional plays these would usually represent non-developed fields, but for tight oil are mostly non-drilled areas or non-completed wells in known and partially developed fields.
Crude production fell in 2016 but picked up again in 2017, which will be reflected in this years release that is due again in November.
Gulf of Mexico Oil
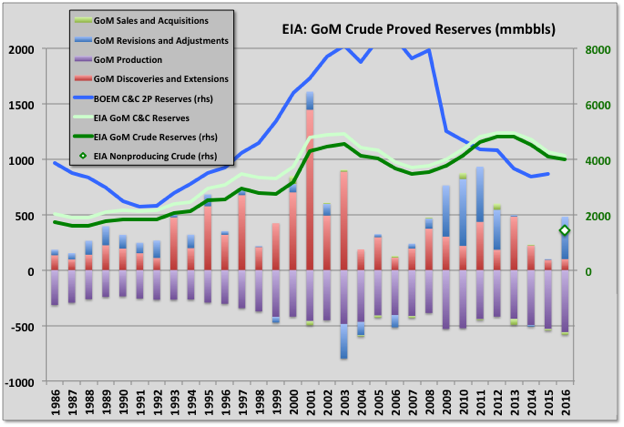
For GoM crude production is increasing through 2016, but discoveries are low and hence depletion and decline rates are high. I have included condensate reserves, but the production and adjustment figures are for crude only. Condensate production has been declining with natural gas (see below), and is now relatively insignificant. I don’t know where the big revision upgrade for 2016 came from but could be the Appomattox project, which was approved for construction, or the BP extensions to the Atlantis field. However there were significant numbers for reserve decreases exceeded by larger increases, so overall several fields have been affected.
The EIA 1P and BOEM 2P numbers are converging, the difference is probably mostly to do with which undeveloped reserves are included. The EIA non-producing reserve is about 1.4 Gb, a large part of which is in Appomattox, and probably Mad Dog. The producing reserves, at around 3.6 Gb, imply average 15 to 20% depletion rates in the on-line fields at current production rates.
Main Light Tight Oil Reserves
Eagle Ford
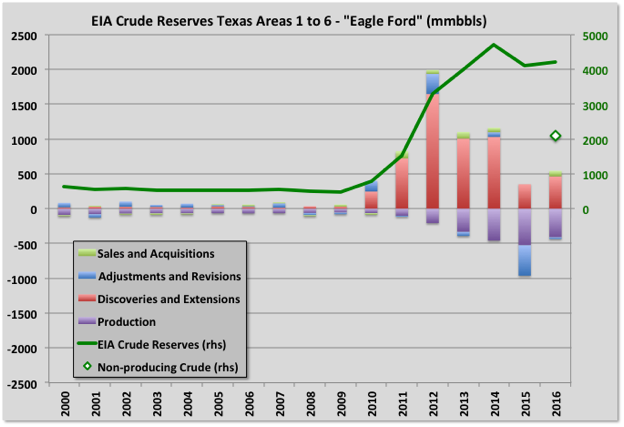
Discoveries and extensions increased slightly in 2016 compared to 2015, but are well down on the peak year of 2012. Eagle Ford has a lot of condensate production and extends over a large area including some conventional oil, so there may be a couple of logistic curves overlaying each other for the discoveries. This year the production seems to have started a slow decline and that looks about in-line with the discovery pattern. Price changes may have had some impact as well, but maybe less than would have been seen for conventional plays or in a normal interest rate environment.
Non-producing reserves, which would include DUCs, anything off-line for maintenance or because of lack of transport capacity and any areas with clear development plans, are 2.1 Gb. At 150 kbbls EUR per well that would require 14,000 wells to be completed, or 2,800 per year if they are to be developed within the five year SEC limit, which is about double this year’s number. Recently the EUR seems to be falling for new wells, which might suggest the core area is being exhausted, if so more wells would be required: something doesn’t quite add up.
Bakken
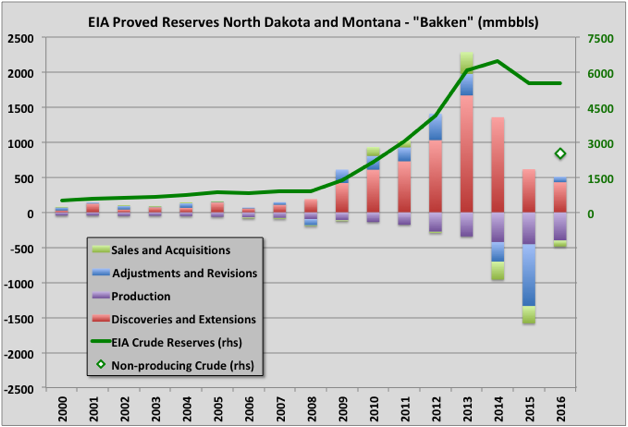
Discoveries and extensions show a pretty good bell curve, and seem likely to drop down fairly low over the next couple of years. The shape of the LTO discovery curves for different areas look somewhat similar but with the life cycle proportional to the total reserve. There have been fewer than ten Bakken wildcat discoveries reported over the last three years, so the growth must come from extensions of existing fields, which should be fairly well known now and with declining potential for further increases. A higher price may encourage more exploration and discoveries but most recent wildcats outside the core areas have come in dry.
Undeveloped reserves are 2.5 Gb, which at 400 kbbls EUR per well (from Enno Peter’s data) would be 6,250 wells. I don’t think there is enough acreage in the core area to support that (by maybe 3,000 wells short from December 2016), but outside that area the EUR would drop and many more wells would be required. Last year 1071 wells were spudded, a few more completed, so it might just be possible to develop those reserves within five years as required by SEC reporting rules, but I think they’d have to get a move on, and the E&Ps definitely don’t appear to be erring on the conservative side for their estimates.
There is a tiny part of the Bakken in South Dakota, but I haven’t included that.
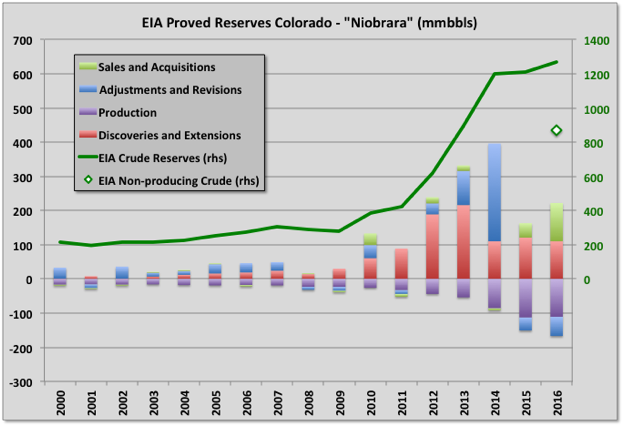
Niobrara
Niobrara reserves increased, mainly due to acquisitions. I’m not clear exactly how acquisitions can exceed sales so significantly, but it could be the E&Ps purchased land with resources that hadn’t previously been considered for development. Like Eagle Ford and Bakken the discoveries and extensions look likely to be trending significantly lower over the next couple of years, but there is a high proportion of undeveloped reserve that could allow a production increase or extended plateau.
Permian
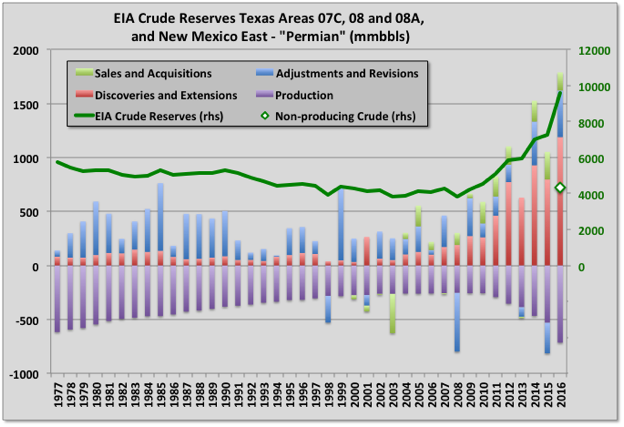
The Permian is where most of the reserve growth has occurred, in fact over half the total. The chart shows the gradual decline in conventional oil from 1979, which presumably is still continuing, and then the sudden growth in reserves and production since 2008 from LTO. I don’t understand how there can be significant acquisitions over sales every year, but there it is. The reserves for 2016 are almost a third of the total for US, and likely grew further in 2017. Similarly non-producing reserves are the largest of all areas, and too are almost a third of the US total at 4.3 Gb. It’s difficult to see what the likely average EUR for Permian tight oil, horizontal wells will be as all the wells are fairly young, but 400 to 500 kbpd seems on the cards. So that would represent be about 10,000 wells worth or 2,000 a year to meet a five year development schedule, which is about what was achieved in 2017. Therefore continued, increasing production looks likely and the repeated highlighting of the Permian as a key component of many E&Ps near term plans is understandable.
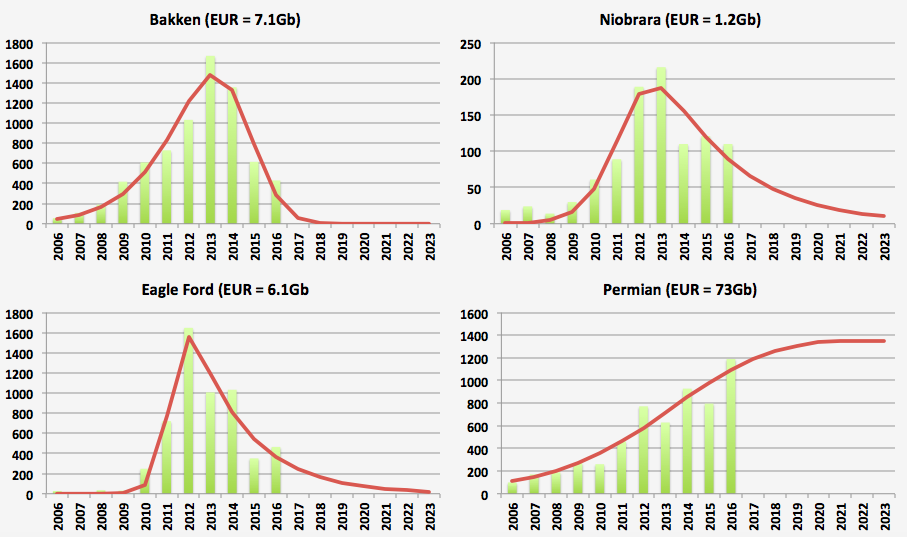
Estimated Ultimate Recovery
I fitted Verhulst equations to each of the four areas’ original discovery values. This allows estimates for the ultimate recoveries to be made as they are the areas under the curves, as shown. Note these estimates are just the conclusions from curve fitting based on the E&P stated numbers, they do not imply I think that is what will be achieved. The numbers need to be treated with a lot of caution, but the great thing in writing for a blog is you can speculate without complete scientific rigour. One problem is that revisions aren’t included – to be meaningful these would have to be backdated against the original discovery years, and that data isn’t available. In addition some of these, particularly the Permian, have more than one play involved and should be represented by a matching number of independent curves, but I don’t have the data to do that either. For the Permian especially there isn’t really enough data to fit a good curve (most of it is extrapolation): a small drop in discoveries for 2017 would more than halve the EUR for the newly fitted curve.
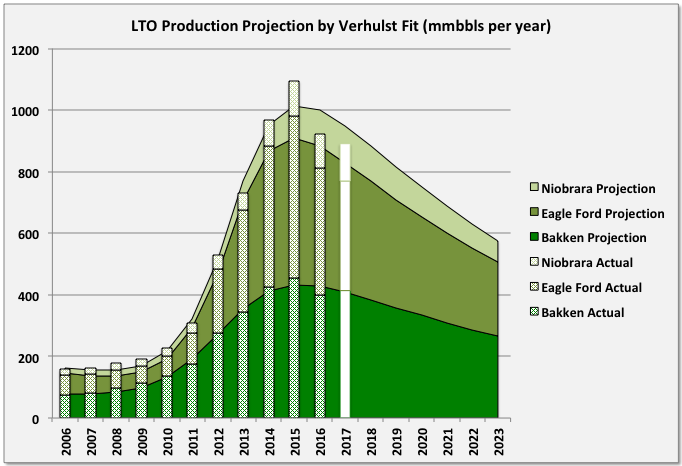
For Bakken, Eagle Ford and Niobrara I also fitted a Verhulst equation to production numbers and hence provide an estimate for future trajectory. I didn’t do this for the Permian as the error bars would swamp all other numbers, but the picture their might be clearer next year. The total production for the Verhulst curves (i.e. for post 2006 developments) is equal to the total EUR predicted from the discovery curve fitting plus any net revisions and acquisitions for the period 2006 to 2016. I assumed that reserves before 2006 would decline exponentially at the same rate as 2006. The fits are pretty good, but then there aren’t really many points to match, interestingly though all three plays break down in the same way with 2015 higher than expected and 2016 lower. It remains to be seen whether this is an artefact of changing policies in response to falling prices, or inaccurate reserve numbers, or maybe just that Verhulst isn’t the best choice. I’ve included preliminary 2017 values, but didn’t use these in the curve fit (and should emphasise again that, especially for Eagle Ford, the production isn’t from a single play or necessarily all non-conventional oil). By this method it looks like the three regions are at or around their peaks, with an overall slow decline to come
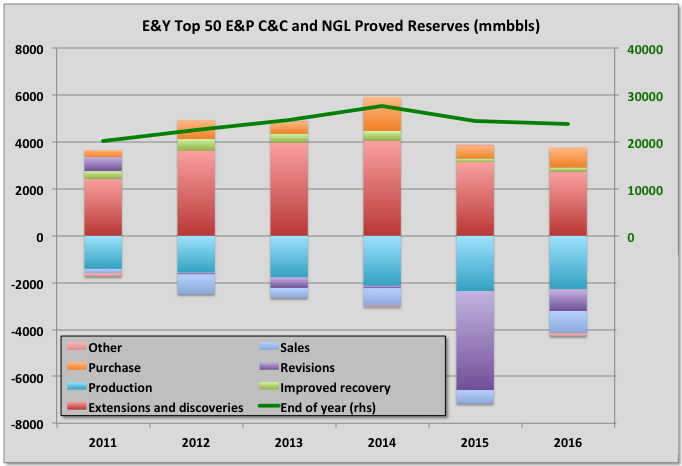
Ernst and Young
E&Y make their own estimates for US reserves for the fifty largest E&Ps. It’s main advantage is that it comes out in June, well before the EIA numbers. They also include condensate and NGLs. As shown below nothing they presented seems to be at odds with the EIA numbers, although they do show a slight decline for 2016 rather than a small uptick.
Most of the discoveries come from these largest companies (the condensate and NGL have some impact but it looks like the smaller companies had very low discovery rates), but there is less growth from net acquisitions (i.e. purchases minus sales) than I would have expected, e.g. compared to 2014, so maybe the smaller companies had decided to ride out the low price years or maybe they had nothing that the larger companies considered worth going further into debt to buy. E&Y break out revisions for IOR as a separate category and the numbers indicate this isn’t contributing much, for all the technology improvements, and is declining.
Natural Gas
I’ve only looked at total US gas and the GoM. Data for individual areas is available but it takes a lot more effort to download and sort by area than for crude oil.
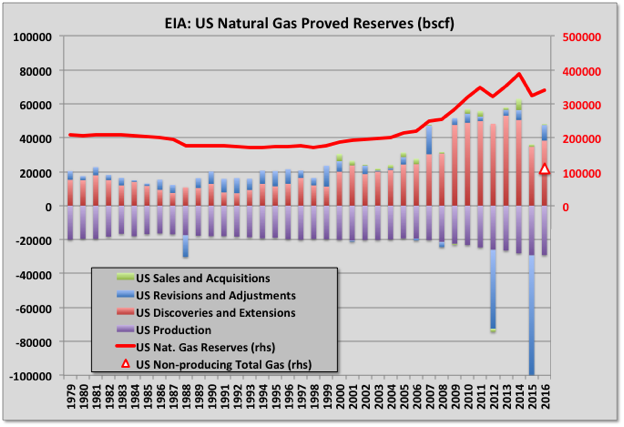
Total USA Natural Gas
Reserves dropped significantly in 2015, but rose slightly in 2016 to 341 Tcf (about 57 Gboe). Non-producing reserves are about a third of the total at 110 Tcf (18 Gboe). However discovery rates are in slight decline and may have peaked in 2013. Discoveries rose rapidly from 2007 because of the shale plays and if a something like a normal bell curve is followed may decline equally rapidly now. Production shows signs of starting to plateau over the last three years; it will be interesting to see how things evolve if prices start to rise or LNG exports quickly expand.
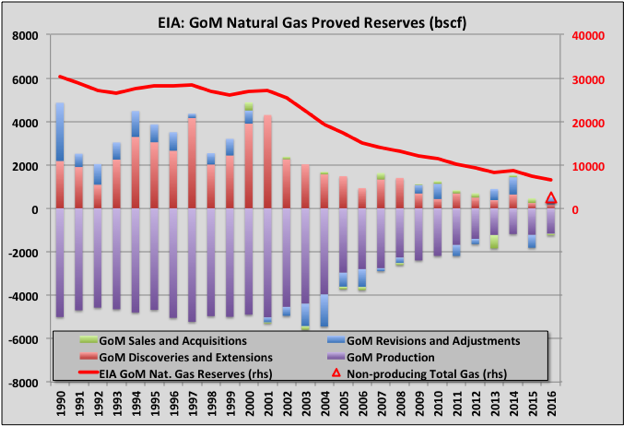
Gulf of Mexico Natural Gas
The Gulf of Mexico is at the end of its life as a significant gas producing area. The last major producing gas field is Hadrian South, which started up in early 2015 and had been supplying just over 10% of total gas, but came off plateau last July and has declined rapidly. Most of the remaining gas is associated with oil and there isn’t much undeveloped reserve remaining.
Off Topic Finish
A living coral reef in Fiji:

262 responses to “EIA USA Reserve Estimates”
NEB has issued it’s estimates for 2018 Canadian production. The average annual production increases quite a bit at 260 kbpd, but not so much for the exit rate at 107. All numbers from December 2017 onwards are estimates and a couple in November.
2018-02-20 – Scotiabank – Canada’s oil patch once again finds itself with too much crude and too few pipelines, depressing the value of Canadian crude relative to US and global benchmarks.
Chart on Twitter: https://pbs.twimg.com/media/DWfFcucVwAIMNUj.jpg
pdf file: http://www.gbm.scotiabank.com/scpt/gbm/scotiaeconomics63/pipeline_approval_delays_2018-02-20.pdf
There was some excitement last week of more activity in offshore as more projects were expected to be approved:
Hail shale, but deepwater oil fights back: https://in.reuters.com/article/us-oil-deepwater-analysis/hail-shale-but-deepwater-oil-fights-back-idINKCN1FY2AI
What they failed to point out was that because the projects are smaller the actual production to be developed is about 16% down, and likely significantly more so for developed reserve as those smaller projects decline faster. A significant proportion will be gas, and I think at least three of the projects are redevelopments of existing, producing fields, including Penguins, which has been much hyped for the UK but is in fact needed only because Brent Charlie, to which it is currently tied-back, is getting shut down and decommissioned.
https://www.rigzone.com/news/shell_to_redevelop_penguins_field_in_uk_north_sea-15-jan-2018-153140-article/
I love the baloney about the market for a deep water field’s oil production being clouded by electric vehicles.
Fernando,
Yes it will take some time (10-15 years) before EVs become significant, but for the past 3 years the World wide growth rate in annual sales of “plugin” vehicles (plugin hybrids and EVs combined) has been about 43% per year. Should that rate continue as these cars become more mainstream with increasing oil prices and falling battery costs, then 50% of annual sales of light duty vehicles would be reached by 2027. By 2036 (assuming growth rate slows to 9%/year by 2036 ) about 1 billion light duty vehicles Worldwide will be plugin vehicles.
For short term projects lasting 10 years (like smaller deepwater projects) or LTO wells that produce most of their oil over the first 5 years, plugin vehicles will not be a problem.
Eventually this may be a problem for OPEC as the World could reach 2.2 billion light duty plugin vehicles by 2048 and trucks and rail may also move to electric, only air travel and ships will create much demand for oil, these could also eventually replace oil with nuclear, wind, or biofuel. Not by 2050, though perhaps by 2070.
Denis, you are great at what ifs. There’s nothing in the horizon to support such growth rates for electric vehicles. Furthermore, if the rate continues growing as you assume, it runs into supply bottlenecks. Given that deep water projects make or break over a 20 year period, and that producers will be asked to deliver 80 to 90 million BOPD for decades (something they’ll be unable to accomplish in spite of higher prices), the last of their worries will be electric vehicles. Their main worry will be where the heck can they find new oil reserves.
Hi Fernando,
The growth rate of the past three years is history.
You assume there will be supply bottlenecks, perhaps you are right, perhaps not.
I agree there will not be enough oil supply to satisfy demand through 2030 and oil prices are likely to be very high, it is unlikely that oil demand will fall below supply before 2040 or so.
The high oil prices coupled with falling prices for batteries (due to economy of scale in production along with continuing innovation) may lead to a continuation of the 40% growth rates in the sales of plugin vehicles.
Run the scenario and you will confirm that if a 40% growth rate continues for World plugin vehicle sales for 10 years and then the growth gradually slows to 10% annual sales growth rates for another 10 years (falls by 3% each year 40, 37,…, 13, 10) most light duty vehicles get replaced by plugins by 2050.
https://insideevs.com/monthly-plug-in-sales-scorecard/
Hi Denis,
In 2015 sales dropped. In 2017 it was approximately 30% growth. Am I looking at the same figures?
I am looking at Worldwide annual sales for plugin vehicles.
Take the natural log and do a least squares fit to get exponential growth rate, it is about 43.7%/year for World wide annual sales growth rate for plugin vehicles from 2014 to 2017.
I’ve started using the Excel exponential curve fit, with the chart set to show the equation.
Getting lazy…
Hi Nick,
Yes that’s easily done. It essentially does what I have done. I guess I like straight lines. 🙂
Yeah, me too. When you’ve done linear regression for a long time, it feels like a good way to show a good fit. But, a log transformation isn’t quite as intuitive for most folks, I’ve found.
The “thing” that gets overlooked with the exciting growth numbers about light Electric Vehicle sales increase rates is this pesky thing that Gail Tverberg often writes about–
low wages for non-elite workers (a large and growing part of the global working class). All the electric vehicle sales growth figures of recent years are taking place in this asset-bubble “recovery” from the Great Recession. From the cusp of when the USA dropped into the G.R, Dec. 2007, it is now 124 months elapsed time. This seems very anomalous to me, to have such a long period between cusps or Seneca Cliff moments going into recessions.
I may be wrong; there may be some way of sustaining such fast EV sales growth even with stagnant and falling real wages of our U.S. / global working classes.
I’m a Prosperity Skeptic(TM) tho.
Yours, B.G.
Gail’s not a reliable source. She’s been trashing alternatives to fossil fuels for a very long time, and predicting imminent disaster, and she’s been consistently wrong.
This has been an unusually long recovery, but historically that’s normal for recoveries after credit crunches, which is what we had. See the book “This time is different…”.
EVs are cheap to own AND operate. They’re cheap to buy used. See Edmunds.com
ICE fuel use rate with 30 percent gain per year of EV sales, plus fuel use rate if ICE efficiency gain of 3%/yr for first 25 years.
See comment http://peakoilbarrel.com/open-thread-non-petroleum-february-21-2018/#comment-631324
for the conditions and graph of ICE and EV populations over time.
Hi Fernando,
I’m eager to know your opinion or best guess as to when oil production will peak, whether you believe in the “undulating plateau” scenario wherein oil production will be roughly flat for several years, and how fast you think oil production will decline after that.
My gut feeling is that the depletion of legacy fields will wipe out production faster than electrified light transportation can wipe out demand for oil.
It’s very unlikely that we will have much in the way of electrically driven construction equipment, aircraft, ocean going boats, or farm machinery anytime soon, certainly not within the next ten to fifteen years.
It’s one thing to make a go of building cars that are used an hour or so most days… cars which require very little power to maintain cruising speeds once accelerated from a stop. It’s something else to build a battery powerful enough to run a tractor or other machine that requires a lot of power most or nearly all the time it’s in use, especially when it is used only intermittently, a few days a month or a few months per year.
It will be MUCH easier to profitably build electrically driven commercial trucks that are in near constant use, sometimes as much as twenty hours a day for weeks on end, but more typically four to six hours of actual driving time per day, the rest being stationary loading and unloading time. Chargers are easily installed along major highways and at large industrial facilities, because such places are usually close enough to larger grid lines to operate powerful chargers without running a lot of new transmission lines, and such trucks can get a partial or even complete charge while being loaded and unloaded. Not every load goes on and off in a matter of minutes with forklifts. Some plants now partially eliminate warehousing by putting the truck at EITHER end of an assembly nine.
If bottlenecks do happen, and the raw materials needed to build batteries are in short supply, the batteries will go into the machines that can be easily charged, and the ones that can use relatively small batteries. This means cars and light trucks almost all together, with larger trucks coming next.
There’s very little likelihood that serious farming using electrically driven tractors, trucks, combines and other equipment will come to pass.
The grid in rural areas would have to be rebuilt to several times it’s current capacity, to deal with peak seasonal demand, and the cost of this expansion recouped in just a couple or three months per year for the most part. It will almost for dead sure be a lot cheaper to run agricultural equipment on moonshine, diesel or bio diesel for the foreseeable future, ditto heavy construction equipment.
I’m not going to deny the possibility that affordable and durable batteries can eventually be built that are several times as powerful as the best ones available today.
But I’m willing to bet against such batteries being available in large numbers anytime soon, say within twenty years.
The price of oil is apt to go up and stay up for decades to come as I see it.
I think there’s no need to electrify farm and aviation soon – there 2 fields that, as you described, would be most complicated to electrify.
But aviation / farming / oil chemistry together are only about a quarter of oil demand. That could be supplied by stripping existing sources for the next 100 years, or a new solution is found.
Everything else can be replaced more easy, either by electric or liquid gas.
Or scale back farming equipment to bio fuel – horse powered.
Hi Eulenspiegel,
I agree that if the worst comes to the worst, the food industry, from plow to the table, can run on biofuels. This would result in a substantial increase in the price of staple foods at the wholesale level though.
In richer, urbanized societies, this wouldn’t be as big a problem as it would be in poor countries. A bag of grain that sells for four or five bucks can be ground into flour locally at very low cost.
The bread we richer people buy in super markets ………. well, there’s a Yankee nickel’s worth of wheat in a three or four dollar loaf of sliced bread. Richer people will be able to handle the increased cost, no problem.
If you are economically borderline, living on staples and buying them in as nearly unprocessed form as possible, then you will be in one hell of bad spot. I don’t have good figures, but a ball park guess is that the price of grain would double at least. The price of a large bag of flour at the mill would almost double as well.
Mac,
Don’t forget the millions of ways that fuel can be conserved that fall short of complete substitution (like EVs). One good example: ocean shipping reduced fuel consumption sharply by reducing speed. Ocean shipping has a lot of different ways to reduce fuel, like better ship design, bigger ships, wind power, etc., etc.
BioFools? crops @ 2% effciency.. PV is 20+
https://en.wikipedia.org/wiki/Photosynthetic_efficiency
Even bigger when one considers all the inputs (driven by external energy such as FF) that go into biofuels. Ethanol from corn is pretty much a wash if not an energy sink.
Mac,
I think you’re thinking about farming in developed countries. Most staples eaten in developing countries are produced there, by small local farmers. Seems like they would use small tractors, that could be electric.
Yair . . .
It is interesting to compare the world production of wheat and rice . . . the value . . . the numbers who RELY on the two staples . . . and the average size of the farms.
Wood Mackenzie’s forecast for Russian oil production in 2018 and 2019. Looks like they think that Russia has the potential to increase production by +200 kb/day in H2 2019
https://pbs.twimg.com/media/DWjJRbAXUAAFv11.jpg
2018-02-20 Financial Post – The Keystone system is still operating under a corrective action order and shipping a restricted number of barrels out of Canada, TransCanada spokesperson Terry Cunha said in an email Tuesday.
http://business.financialpost.com/commodities/energy/a-self-inflicted-wound-pipeline-delays-to-cost-canadian-economy-15-6b-in-2018-says-scotiabank
? Someone on Twitter was saying that more diluent is being added which means that the fluid flows faster, hence the reduced operating pressure hasn’t cut volumes that much, but it costs more.
The EIA’s Weekly U.S. Imports from Canada isn’t showing an on going decrease in volumes.
Moscow (Platts)–21 Feb 2018 – Kazakhstan aims to increase crude and gas condensate production by nearly 25% to 2.155 million b/d by 2025, according to the country’s development strategy released Tuesday.
Kashagan is expected to grow to 370,000 b/d by the middle of 2018, up from around 250,000 b/d at the end of 2017, the energy ministry said earlier.
https://www.platts.com/latest-news/oil/moscow/kazakhstan-to-pump-over-2-million-bd-crude-oil-26895552
Eagle Ford- most is held by production, and the main players are concentrating on their holdings in the Permian. Upstarts with OPM are drilling what I see as nonprofitable wells from bigger companies castaway leases. But, where did you get a 150k barrel EUR????
Hi Guym,
That estimate may be based on Enno Peter’s estimate for 2012 Eagle Ford wells.
See https://shaleprofile.com/index.php/2018/02/02/eagle-ford-update-through-october-2017/
Quoting Enno Peters:
Wells that started in 2012 have now reached a production rate of about 20 barrels of oil per day, and are just shy of 150 thousand barrels cumulative production, on average.
Also from the post linked above it looks like 2014 and 2015 vintage wells may have an EUR of 200 kb and 2016 wells potentially 250 kb, chart from Enno Peters post below, I simply used a straight edge estimate for EUR.
Notice that the “lines” are concave down, so a straight line estimate, as I have done will tend to overestimate EUR, probably 220 kb is a better estimate for 2016 wells as the will probably follow the slope of the 2014-2015 curves going forward.
Something like Dennis said but I just looked at the 2016 and 2017 quarterly numbers: they seem to be tending to smaller EURs to my eye. One of the issues ith LTO is there is no history to end of life to be able to make good judgements, so I’d say my guess is as good as the E&Ps when they determine reserves.
I don’t know how retention by production is relevant, to be able to claim undrilled areas as reserves there should be a clear plan for exploitation within five years.
Hi George
On a different note it looks like the Weald shale oil myth has been put to bed this week.
George Kaplan,
Agree on Eagle Ford, that 200 to 250 kb EUR seems reasonable.
Using David Hughes roughly 9000 square mile estimate for prospective drilling area and 4 wells per square mile on average and 225 EUR average would be 9000*4*.225/1000=8.1 Gb for Eagle Ford at 36,000 wells. If we assume 3 wells per square mile on average we get 27,000 wells and about a 6 Gb URR (close to your estimate.) My guess would be 7 Gb, but clearly that is a very speculative guess.
I used 150 not 200 to 250, I was using the number to estimate how many wells will be needed to meet the non-productive reserve number, i.e. drilling in the future, and therefore took the most recent approximate numbers and I think they are declining with time. I stated my assumption, you are perfectly at liberty to disagree: ‘For some of the shale plays I have made some high level guesses about future well numbers, which I’ve based on figures from Enno Peter’s excellent shaleprofile blog.”
The URR estimate of 7.1 Gb seems reasonable, David Hughes estimate in Drilling Deeper was 7.9 Gb, he estimated about 36,000 total wells might be drilled, which implies an average EUR of 220 kb.
Using your 17,500 well estimate and the 18,600 wells completed through Dec 2016 (from shaleprofile.com) we have about 36,100 total wells (very similar to David Hughes’ estimate.) At 7.1 Gb, this implies about a 197 kb average EUR for Eagle Ford wells, fairly close to the estimate of Hughes.
I really can’t explain the data. It looks pretty funky. If a well only derives 50k barrels within a year, it is really a bad, bad well. I haven’t seen too many of those, even in Atascosa County, which I follow pretty closely. Atascosa doesn’t have the best of wells compared to some of the other Counties, so quien sabe? It just does not look right.
The wells produce far more than that in the first year, actually more than earlier wells though that might have reached a limit, it is the extrapolation to the EUR that looks like it is falling to me.
Price is restricting a lot of drilling in the Eagle Ford. Then again, there are a lot of wannabe upstarts using OPM, who are drilling in insane areas discarded by the big players, who are obviously losing money. There are huge areas held by production, that have a lot of production left. I am sitting on a 3200 acre area that has 5 wells on it. They are not going to drill on it much, until price improves. One well had a 175,000 bbl first year production, and one 150,000 first year production. The other three were in the 120,000 bbl range. The bigger ones are well over 200,000 bbls, within the first two years. But, these are not “prime” drilling areas for EOG, they want 200k the first year. When price gets in the $80 range, I imagine it will look better to them, but the area will still have to compete with many better areas. I don’t think the “numbers and charts” paint an accurate picture.
It only measures the Eagle Ford, and it doesn’t say anything about the drilling in the Eagle Ford leases within the Austin Chalk in Karnes County. It’s a freebee. Why drill in your prime Eagle Ford area, when the Austin Chalk gives you 5000 bbls a day initial production.
In the meantime, EOG is putting most of its capex into the Permian. It may make equal to the Eagle Ford, but they need to get wells drilled to hold more production. Meanwhile, they are finding out which areas are not so good so they can sell it to the shyster companies with OPM to drill more unprofitable wells.
Guym, yes something doesn’t look right (in fact that is what I said in the post) – you maybe think it’s the production data, I think it’s more likely the E&Ps are overestimating their undeveloped reserves, or at least their ability to bring them online within five years (something for which some of them have been warned in the past by the SEC, though I think only informally so far).
You seemed to provide examples of why there could be low producing wells in poorer areas as well as high producers so maybe the average as shown is explained.
Yeah, it’s probably a combination of factors, as discussed, with E&P overestimation being the greatest factor. There is a lot of good area that has a significant amount of area to drill, yet. The counties within and just north of the Karnes fault, far southeastern Atascosa County, northeastern LaSalle County, and northwestern McMullen, all have the capability of EUR above 300. Below that, and it’s high condensate/gas, causing companies like Pioneer and Devon to want to divest. Hence, from many wags, the Eagle Ford is dying, but a lot of good area is held by production. Outside of those areas, there be dragons. There are fewer areas like mine with 250-300k EUR well capability. More with 150 and below. Most of the good areas are held by EOG. There are many other players, but EOG holding the greatest area. By 2016, most of the area they wanted to keep was held by production. Of course, with continued drilling clauses, they have to keep drilling some. EOG may create another factor in determining what EUR comes out of an Eagle Ford with their enhanced oil recovery program. Over a 140 well test area, they have been able to increase recovery by 30 to 70% with gas injection.
http://www.artberman.com/bad-actors-hurt-eagle-ford-shale-well-performace/
This article more depicts my view of Eagle Ford EUR, but bad actors can make a difference. Not as many wells being drilled, because most leases are held by production. In the meantime, senseless wells are being drilled to appease OPM, and voila, you have average crummy wells.
Note that he limited wells selected to those with only one per lease, because Texas reports production by lease vs by well. Which raises a question how others are measuring individual EUR per well, when there is no place to get that data? That means he had to overlook most production. If you have a good well on a lease, you usually have more than one.
Hi Guym,
That is a problem with Texas RRC data. Enno Peters has figured out some way to estimate output from multi well leases, I am not sure how he accomplishes this. A good programmer could probably figure out an algorithm, I never attempted this.
I constantly use the same method to find out production in general areas. I come up with similar numbers to the charts indicated in Art’s article. Single wells on a lease should be a clue that they are not producing, in general, to where there are multiple wells on a lease. I also compare the initial rates on multiple wells with the single wells, to get another guess how an area is doing. Production on wells has gotten better, not worse. Compare the EURs in Art’s charts to the potential EURs on Enno’s, and remember Art’s wells depict mostly an earlier time in drilling. It ain’t right.
http://www.worldoil.com/news/2016/8/3/eagle-ford-shale-still-shows-promise-of-greatness-in-variations
Then again, what price are we talking about.
https://stratasadvisors.com/~/media/Files/PDF/Upstream/2015/Garrison_Jessica_WhatDoEURsandWellCostsNeedtoBe_2015.pdf?la=en
Or, who is measuring EURs.
Enno’s chart really had me going. For just EOG, who I have the operator number memorized, from 02/01/2018 to current, I pulled the completions from district 1 an 2. There were 18 in District one, where the highest IP rate was 3566, the lowest was 1815, and the average was 2500 bbls a day. District two had eight, with the highest of 3480, lowest 1638, and an average of 2774 bbls a day IP. Going further, I pulled all completions for district one, and sampled them. There were only a few wannabes that had ridiculously low IP rates like 28 and 48, but most were name players who produced probably an average IP rate of around 1000. EOG’s rates, from my previous research would yield EURs well north of 400k. The majority would yield north of 225k, and the losers would not pull it down that much. Not very scientific, but probably within reason, in my opinion.
Even using the drilling productivity report, which I don’t like, the average well approximates 1,300 bbls a day initial. That’s closer to a 300k EUR, than a 150k EUR. As the well should make close to 150k the first year with an IP rate of 1300k. Mine do.
Hi Guym,
I think Enno’s data is pretty good.
Note that I believe George’s estimate is the average EUR for the entire life of the field.
He assumes, correctly I believe, that eventually the tier one areas will become saturated with wells and then the new well EUR will start decreasing.
My estimate for 2014-2015 Eagle Ford average wells (based on Enno Peters data through April 2016 downloaded almost two years ago) is about 203 kb, if the wells are shut in when they reach 10 b/d due to economics. It is certainly possible that the average well profile improved in 2016 as wells were high graded (sweet spot only drilling.) Eventually EUR will fall as closely spaced wells in the sweet spots may not have as high EURs as older wells that may have been spaced appropriately.
Using more recent data (from Feb 26,2018 from Shaleprofile.com), the 2016 average Eagle Ford EUR is about 217 kb, cumulative output is 122 kb for the first 18 months, the best hyperbolic fit has qi=25,771, b=0.8377, and Di=0.355 (see Arps hyperbolic).
http://www.petrocenter.com/reservoir/DCA_theory.htm
For Mike and Shallow sand’s payout calculations, 60 month cumulative is 181.3 kb and 36 month cumulative is 156.8 kb, the well reaches 10 b/d output after 136 months (11.3 years).
Hi Guym,
In 2016 the average EF well made about 537 b/d in month 2, (which tends to be the highest month, because on average most wells don’t produce for 30 days in the first calendar month that they produce). The average well’s 12 month cumulative output was 100.7 kb for wells that started producing in 2016 (based on data from 1411 EF wells in Enno Peters database for 2016.
https://shaleprofile.com/index.php/2018/02/02/eagle-ford-update-through-october-2017/
After 10 months cumulative output for the 2017 wells is about 7 kb higher than 2016 wells, but most of this is from the first 5 months of output, after that the 2016 and 2017 well profiles look very similar for data so far (based on 770 wells starting production in 2017 with at least 5 months of data.)
Based on Enno Peter’s data the cumulative for the average EOG well in 2016 was 151 kb after 12 months (data from 207 wells) compared to 101 kb cumulative output for all EF wells in 2016 (1411 wells) after 12 months.
EOG does gave very good wells, peak output (month 2) is 956 kb/d for average 2016 EOG wells (224 wells total), compared to 536 b/d in month 2 for the average EF well in 2016.
To get an idea of a field’s potential, all wells both good and bad need to be counted in my opinion.
The increase in well productivity comes with a higher cost tag and whether it is 225 or 250K BO EUR, at a gross WH price of $60 per barrel and a net back price of $30, those kinds of estimated UR’s are barely (in)sufficient to pay out $7.5M well costs. One cannot replace reserve inventories that are declining precipitously, much less grow reserves, by breaking even. It is, in my opinion, a mistake to assume the future of unconventional shale oil resources in our country is strictly price dependent. It is very much money dependent.
I think one of the primary reasons there are any rigs still running in the EF is to comply with SEC, 5 year, drill-it-or-lose-it rules for proximity related PUD reserves. If you have borrowed money on PUD reserves and are about ready to have to impair, again, because you are running out of time, you are up Shit Creek. Or further up Shit Creek than you already were. Otherwise, I don’t know why anyone is drilling Eagle Ford wells anymore…unless they know, guaranteed, the price of oil is going to $85 and will STAY there.
Just thinking about all these stripper horizontal wells gives me LOE nightmares.
A major expense being downhole failures, doesn’t it make practical sense that these wells will be very high cost? Over 10,000’ of rods rubbing up and down against 10,000’ of tubing, and in particular in beginning of the “curve” where the down hole pump apparently must sit in order to keep from pumping off.
We have wells that haven’t been pulled in years, but those are slow pumping verticals that are very shallow. Many drilled with a cable tool. Straight holes, little rod wear.
I just cannot imagine getting a long run without a failure on these hz wells with a 640 Lufkin pounding away 24/7/365.
I drove by 33 Eagle Ford shale oil wells today, Shallow; did a little windshield poll. Twenty one of them were down. Or on pump-off controls. Either way, they weren’t making money. Might be they were all WOR; everybody has fled S. Texas for points West. Hauling frac sand can now make you upper middle class in less than 6 months.
Rod lifting those kinds of wells you describe… been there, done that. It sucks. Steal one in a garage sale, or off eBay and for a while you think you hit a big lick. Then along comes a $135K well intervention that takes 2 years to payout and you wish you’d become a landscape engineer (lawnmower) instead.
So it looks like shale oil is all about getting as much as you can in the first 3 years – the rest is pure luck before equipment breaks down?
All wells on rod lift eventually will have down hole failures. When wells fail often, or are low oil volume, they may become uneconomic to produce.
From what I have seen from actual joint interest statements to non-operated working interest owners, it costs between $3,000-$20,000 per month to operate a shale oil well. Much of the expense depends upon how much water is produced with the oil. Almost all produced water is truck hauled. Water disposal systems are being constructed, but those are very expensive.
The $$ figure I cite does not include repairs of down hole failures such as pump failures or tubing leaks. About the cheapest downhole repair I have seen for one of these wells was $15,000. The highest I have seen was almost $500,000.
EUR estimates for these wells are for a 40-50 year well life. Much of that life the well will produce under 25 BOPD. Most of the wells in TX are burdened with a 1/4 royalty.
So, just for illustrative purposes, let’s say a 5 year old EFS in TX is now producing 6,000 net BO to the working interest owners. At $50 WTI it is providing gross income of $300,000. By the time we subtract LOE, G & A, and severance taxes, there is likely less than $100,000 left.
Then, realize many shale companies, to raise money, have sold their gathering systems, something which kind of astonished me at first. Therefore, the working interest owners are also paying to use those systems. Even less $$ to the bottom line.
So, as Mike says, it just becomes a gamble on how many down hole failures occur. If you luck out and have none in the year, you might make a little at $50 oil, more than one per year and you have likely lost $$.
There will be several hundred thousand of these wells onshore US before it is over. Each with a plugging and abandonment cost of around $250K estimated.
But, at $100+ oil, these might work. Just a big risk.
Hi Shallow sand,
My EUR estimates assume the well is shut in permanently when flow gets to 7 b/d or less. The model EF well I use has an EUR of 213 kb over 155 months (12.9 years), cumulative output is 177 kb over first 60 months and 154 kb over the first 36 months. This well profile is based on data from 2014-2015 wells pulled from shaleprofile.com in April 2016, I have not updated the well profile since then. Chart with hyperbolic coefficients in chart below, a least squares routine was used to fit the hyperbolic to the data (21 months of data at that time).
Assuming $30 total cost per barrel a 60 month payout would require about $72/b. A 36 month payout would require $79/b where a $7.5 million dollar well cost is assumed in both cases.
The rod has to go all the way down the horizontal? I didn’t know that
As a corralary, has anybody ever drilled a horizontal “uphill”? og to the bottom or below the zone such that the fluids later flow don to the vertical part of the well?
Wake,
I think that is how it is done, the pump goes in the vertical section of the well which may be as deep as 10,000 feet, then another 10,000 feet of horizontal lateral for a total length of the well of about 20,000 feet. The bend in the pipe (the heel) is usually lower than the toe (the far end of the horizontal well).
No, the pump is set in the radius and the approximate maximum deviation from vertical is 10-12 degrees. That still creates mechanical problems, as does highly deviated wells drilled with speed records in mind. Drilling efficiencies (faster is better) are eaten plum up when turned over to the production department. Yes, depending on dip rates of the sediment(s), lots of wells are drilled heel down, toe up.
Its still early in the leaning curve but there are thousands of shale oil wells making less than 20 BOPD; at $60, economic limits I believe are closer to 10-12 BOPD and there are also lots of those. Water production and OWR is the deciding factors in economic limits.
Thanks for the correction Mike. The radius makes sense.
If the economic limit is 11 b/d the EUR falls to 201 kb,
time to payout is unchanged. It is doubtful that oil will remain at $60/b in my opinion.
The average EF well (as in the profile I show) reaches 11 b/d 9 years after starting production. The earliest EF wells (from 2011) will get to that point in 2020 (for the average well), some of the more poorly performing wells (bottom 25%) may be at that point about now.
Many wells may be temporarily abandoned when oil prices are low, not sure if it is practical to bring them back on line as I don’t know the industry, it may depend in part on the price of oil.
I suspect the optimum is to push the kickoff point as low as possible, and place the pump right above the kickoff. But I’m not sure about the GOR, which can gas block and overheat the pump if it’s placed too high. In theory, these wells will make a lot of gas, and this makes pumping a real hassle.
Gas lift isn’t much good if a well is low rate and has a 1500 scf/bbl liquid ratio. So gas lift may only make sense for wells making a lot of water. When I had teams designing wells I emphasized they lay out strict guidelines for drillers regarding the directional design. This was even considered in pad design and layout, because it can define the horizontal leg length. It’s even useful to have well drilling performance graded in part using the final directional survey.
I suspect these companies were a bit greenhorn when they started drilling these wells 10-12 years ago, neglected these issues, and now the have a limited well life. Maybe their design was better anyway, or maybe the better option is to let the wells die, put in a gas lift string, and use it to kick off the well at regular intervals? It all depends on the particular well. There must be a ton of money to be made optimizing lift.
Mike, I don’t know much about gas lift, but am reading an article that it is best for these highly deviated hz wells. I guess produced gas is reinjected with large compressors?
Article states these shale wells have gas slugs that are hard to handle on rod lift, and that submersibles also have a tough time handling the gas slugs.
Seems that gas lift might not be so cheap, when I read about large compressors, I see $$$$$$$. A lot of power expense, high compressor rental rates, or spend big $$$ for one and spend big $$$ when it breaks down.
Also, looking at some Bakken well photos. Are those pump jacks 4 or 5 stories high? We use some 10’s and 13’s, and you can fit one of them in the back of a pickup truck.
20 BOPD shale well or 1 BOPD 1,000’ stripper? Hmmmm, seems like an easy decision to me.
Mornin’ Shallow. Work starts early in the oilfield. Again, rod lifting any deep HZ well is a nightmare, particularly shale oil wells that if not pumped properly, do indeed slug, or u-tube gas causing POC’s to kick in and shut the well down for fluid buildup. They also sand up frequently, make scale (many wells in the EF have an increasing H2S component to them), and shale wells make paraffin, to boot. Interventions are very nasty and very expensive. The whole thing requires actually getting dirt under one’s pedicured fingernails, if you can imagine that.
Those are big 640 units you are looking at in N. Dakota, an enormous upfront CAPEX that later becomes overkill in the life of a shale oil well and are expensive to fix, yes. If you want some I suggest you wait a few years and you’ll be able to buy all you want on eBay for little of nothing.
Gas lift can be more economical, depending on fluid conductivity. As wells deplete GOR goes back up (before it goes back down) and a lot of wells are taken off rod lift and put back on gas lift, then they will go back on rod lift when they reach hospice care.
For one’s assets to be “liquid” there always has to be buyer on the other side of the deal. The shale oil industry is selling assets like crazy right now to increased dividends and appease angry shareholders but most of those “assets” are undeveloped Tier 2 type acreage blocks. The wells on those blocks are marginal and getting more marginal and when undeveloped acreage is all gone there will be less and less acquisitions and mergers, etc. because buying marginal stripper shale oil wells, with high incremental lift costs, that are subject to plugging and decommissioning costs, won’t happen. Major integrated oil companies do not want to operate 4,000, 12 BOPD wells that are declining 10% per year. Lots of big shale producers will be forced to ride those horses plum in the ground and when the dust all settles, and UR’s are half of SEC booked EUR’s, folks are going to finally “get” what a scam this has all been.
Sand problems, by the way, in the Permian are nothing compared to water problems that are coming. We have a mutual friend attending a Permian Basin water conference going on right now in Midland and he is appalled at all the lying going on about water in West Texas. Everybody’s “predictions” for the future are all now on the back of the Permian and water problems out there, in the desert, is going to slow that party down and raise costs big time.
Are you participating in the oil price contest? I’ve never seen so many experts so absolutely certain that the price of WTI is going to be $79.87 on November 27, 2018. Is there a trophy or something if you get it right?
For the shale oil industry to get thru the less it made for itself prices are going to have to get much higher, and STAY there. Like they haven’t done in the past.
Hi Mike,
Call it $110+/-10 $/b at the end of 2018, if the annual rate of increase from the last half of 2017 continues. As you well know we don’t know the future price of oil, and you never make any prediction, so I guess you are correct. 🙂
Rystad Energy – Oil and gas production from the Southeast and East Asia region is estimated to decline by nearly 20% (3 million boe/d) from 2017 until 2025, as new projects are not able to compensate for the natural decline in production of mature fields. However, China’s production is expected to decrease the least, supported by the stable output from the giant Changqing field and several ramping up projects, including Longmaxi Shale.
https://www.rystadenergy.com/newsevents/news/newsletters/EandP/eandp-newsletter-february-2018/
[…] EIA USA Reserve Estimates […]
Hi George Kaplan,
There are about 11,337 wells that have been completed in the North Dakota Bakken/Three Forks through Dec 2016 (9300 from Jan 2011 to Dec 2016), probably the average EUR of wells drilled so far is about 325 kb, so with no further drilling this suggests about 3.7 Gb. Another 2.5 Gb added to this would be 6.2 Gb, fairly close to your 7.1 Gb estimate. I would guess that there may be some probable reserves, proved are 4.8 Gb for ND Bakken/TF, at the end of 2016 about 2 Gb of cumulative C+C had been produced from ND Bakken Three Forks, so for North Dakota about 6.8 Gb of proved reserves plus cumulative output at the end of 2016.
A conservative estimate of 30% of proved reserves for probable reserves (about half the rate of UK North Sea) would be another 1.4 Gb for 2P plus cumulative output at 8.2 Gb. Potentially reserve growth might increase URR a bit more to 9 or 10 Gb for URR, especially as oil prices rise.
I set up a scenario with about 40,000 completed wells with EUR decreasing after 2020 enough to give the mean USGS TRR (about 10 Gb) with 120 new wells added per month through 2034 with decline after to no more wells added after 2039. Then economic assumptions applies with oil prices increasing from $55 to 120/b (2017 $) linearly over 9 years, then falls from 2032 (again in straight line to $99/b in Dec 2040).
This price scenario (a pretty conservative one) reduces URR to 9.1 Gb. EUR falls from 370 kb (2018 to Dec 2019) in Jan 2020 to 121 kb in 2032, total wells completed is 31,400 (fairly similar to David Hughes estimate). Peak output about 1300 kb/d in 2020 for this scenario (prices only reach $73/b by mid 2020 in this scenario). Higher oil prices could potentially result in a higher completion rate than this scenario.
As always, the scenario could be changed to higher or lower completion rates, and different oil price scenarios.
As I said 7.1 isn’t my estimate – it comes from extrapolating a curve fit to the E&P estimates. It’s just another wy of looking at it, I make no claims for it being better or worse than any other, for me it’s more interesting as a base line to see how things change as the core area get’s exhausted
George,
Just comparing the estimate that isn’t yours with an alternative, higher prices may lead to more well completions as lower EUR wells may still be profitable, as prices go up reserves may increase for that reason.
It seems likely that as oil supply becomes tight, oil prices will rise.
Norway production numbers for January out. Crude up 77 kbpd, mainly with Goliat coming back on-stream. They’ve stopped breaking out condensate from the total liquids, but it was fairly small. They are down 7 kbpd y-o-y and 23 from prediction. In other news a small dog fell asleep at the local shopping mall.
http://www.npd.no/en/news/Production-figures/2018/January-2018/
Well, as they say, let sleeping dogs lie. Great post. You da man!
Norway’s 2018 production forecast for C+C, average 1.585 million b/day.
I got a large spreadsheet with estimates on field level for 2018. I got to 1598 million b/d as I summarised all the fields. Accounting for outages that normally may affect production some places the number I got is pretty much in line with OD forecasts or somewhat lower. I suspect reality might be even lower and at least the 1.7% decline last year. I am doing this to get a feel for production forecasting offshore when detailed information is available, and in this country it is fortunately also very reliable.
The bigger Norway story might be gas – I think it is going to start dropping, which might come as a surprise to some customers.
https://oilprice.com/Latest-Energy-News/World-News/Surprise-Crude-Draw-Lifts-Hope-For-Oil
And oil price is down. Interest rates are up because traders are confused on what did the Fed really say? And so forth, another day ends. Confused, but it ends.
https://www.reuters.com/article/us-global-swf-kazakhstan-analysis/kazakhstans-frozen-billions-sound-alarm-for-sovereign-funds-idUSKCN1G40MI
Synopsis, Kazakhstan’s SWF has been semi-sued in European court. Assets frozen. SWFs are usually fed by oil. Norway the largest.
In the past SWFs were considered sovereign assets and immune to seizure by other governments (absent debt owed to the govt itself). This situation is a private businessman with investments in K’stan. So he’s grabbing for the SWF money outside K’stan. Court ruled for him and all other SWFs have gotten concerned.
From the previous OPEC thread: one area I forgot that there may be spare capacity is the neutral zone, shared by Kuwait and Saudi. It has a couple of major fields, one operated by Chevron, and has been shut down due to some sort of dispute for a couple of years but could add 400 kbpd I think.
Not entirely surprised
http://peakoil.com/forums/aspo-usa-implodes-t74037.html
ASPO instead of sticking to the facts about oil depletion and providing sober and rational predictions allowed itself to be steered by a few extremist doom mongers.
The likes of Jeff Brown, Ace, Patzek and others were given air time their knowledge never warrented.
http://www.theoildrum.com/node/5154
A typical example of the kind of illiterate research that gained traction between 2005 and 2012.
http://europe.theoildrum.com/node/4202
Just another example of someone putting themselves forward as an expert.
Sam Foucher was another figure fiddler who only got air time, because the people who gave him air time knew even less.
http://www.theoildrum.com/node/3626
I said years ago that unless a calmer and better informed message was put across, the real threat of Peak Oil would be done a great disservice.
This is exactly what has happened.
Peter,
It’s quite nice of you to come in here and ridicule individuals on the timing of Peak Oil. So what that some of the Peak Oil analysts got the timing off by a few years in the whole scheme of things. The negative predicament of peak oil today is far worse than it was in 2005.
Furthermore, it’s interesting to see someone bickering over the timing of the peak oil collapse when the real issue has always been the negative consequences of the collapse.
Peter, you remind of a wife who is pissed off at the Doctors who gave her husband two years to live. Thus, the death of her piece of garbage husband was something she looked forward to due to the $5 million life insurance policy. Unfortunately, the Doctors got the timing wrong, so she had to live with the wretched slob for another ten years.
Regardless…. you have no idea how bad the situation is in the U.S. Shale Oil Industry. Just because peak oil was postponed due in part to a massive increase in debt, money printing, zero interest rates and the swindling of hundreds of billions of dollars from investors to continue the U.S. Shale Ponzi Scheme, doesn’t mean the negative consequences of peak oil aren’t still going to be awful.
Lastly, the market has no idea the tremendous amount of FRAUD, CORRUPTION and CRIMINAL ACTIVITY that is taking place in the Shale Oil Industry. However, in a few years, it will become quite apparent.
I saw a recent comment that Mexico could tap into its Shale Oil Deposits and grow its production tremendously just as quickly as the U.S. Shale Industry. If Mexico and Mexican investors are stupid enough to start another Shale Oil Ponzi Scheme, then they would deserve to lose billions of dollars.
If the market thought ENRON was the biggest Energy Ponzi Scheme in history, they are in for a rude awakening.
steve
Peak Oil collapse?
What in particular are you worried about? Do you feel that civilization will collapse without cheap oil?
“the market has no idea the tremendous amount of FRAUD, CORRUPTION and CRIMINAL ACTIVITY that is taking place in the Shale Oil Industry”
I haven’t heard this much fear mongering since the last time you were pushing your silver and gold sales. Have you tried Tverberg’s, she had her readers all whipped up on the end of civilization that never happened years back. I’m sure there’s still a few doomers hanging out over there. Good luck !
Maybe an investment in an EV is a better idea for you SRSrocco
Our civilization is more addicted to oil, than ever. Oil in nonrenewable, and most of production comes from fields discovered many decades ago. The fact that collapse didn’t happen so far, means that it will only be worse, because every day 200k addicted to oil people show up on this planet.
Are you worried about the oil industry collapsing, or civilization?
If it’s civilization, are you worried about the short term, or the long term effects?
Good gravy Nick, are you serious? Civilization will eventually collapse, and peak oil will only be one of the causes. There are so many other causes. The destruction of the environment will be one of the primary causes.
are you worried about the short term, or the long term effects?
When civilization as we know it collapses, all effects will be long term.
“because every day 200k addicted to oil people show up on this planet”.
Let’s at least defined the problem correctly. A reduction of available transportation isn’t going to be the cause of collapse. Actually, less transportation would slow down the destruction of the environment.
The answer to mass shootings isn’t more guns
A reduction of available transportation isn’t going to be the cause of collapse.
Well, it’s not only transportation we are talking about. A declining oil supply will make everything more expensive. Oil is used in farming and delivering the food supply around the world.
We live in a globalized and mechanized world. And there is no going back. The collapse of globalization and mechanization will cause a dramatic die-off of the population. That will cause political chaos and more destruction of human life. And hoards of hungry people will eat anything with meat on its bones.
The collapse of globalization and mechanization will cause a dramatic die-off of the population.
So, Ktos…is this what you’re worried about??
“The collapse of globalization and mechanization will cause a dramatic die-off of the population.”
The sooner we’re knocked down a few billion the better off the other forms of life that we share the planet with will be.
I’m optimistic for myself. Everyone else is fucked.
because every day 200k addicted to oil people show up on this planet.
Right: • 360,000 births per day—————– • 151,600 people die each day
The root of the problem is the daily growth rate of 200k humans per day that is destroying the environment or mother earth that supports all of us. There are many resources that are being consumed at unsustainable rates, not just oil. We live in an age of an unbelievable buffet of conveniences and riches. We are just spoiled. We waste more resources than we need. In addition, basic economics teaches us we will substitute an expensive resource with a less expensive one. Running out of oil isn’t going to be the focal point of our demise.
Steve
Some of the so called experts publishing their expertise on theoildrum deserve nothing but ridicule.
Jeff Brown in one of his presentations predicted Russia would be a net oil importer by 2022.
Oil is vital for certain things such as pesticides, herbicides, plastics, aviation and marine travel. The main consumer of oil are cars. Cars are not vital, they are a luxury. Obviously some people living in remote areas need cars but electric cars are already an alternative although rather expensive.
Most people live in cities and it is absolutely possible to live your entire life in a city and never get into a car.
https://jalopnik.com/these-ten-cities-have-the-best-public-transit-in-the-wo-1610824583
Indeed London and other cities had excellent electric trams and light railways until idiots like ford had them ripped up.
http://www.tundria.com/trams/GBR/London-1934.shtml
An electric tram can remove hundreds of cars off the roads, if they could build them in the 1910 and 20s they sure can today. Infact trolley buses do not require digging up roads, route could be up and running in a few months.
http://www.geoffbannister.com/tod/two_routes_657.html
Since farming and food transportation only takes up about 15% of oil consumption I do not have a worry about oil.
The five greatest threats we face are soil erosion, deforestation, water depletion, fish stock destruction and antibiotic resistance. I see little attempt to deal with any of these issues.
Then everyone dies. Does it really matter what you die of?
The peak oil “experts” deserve to be ridiculed. I don’t know how to predict when oil production will peak but then I never pretended to have that ability. A lot of people pretended to have that ability and mislead the rest of us (“Nosedive in the desert” anyone? Where is Stuart Staniford?) Maybe peak oil will eventually happen, but it will happen because of demand peak. In a couple of years there will be lots of electric cars and in another 10 years they will cheap. When batteries become cheap there is no reason why trucks, farm machinery, etc cannot run on electricity.
Suyog
Steve, as best as I can recall, a few blogs back you mentioned that some big news was going to released regarding Bakken production. Was the news ever released?
I guess this means that private tank farms & floating storage have been emptying quickly. This is interesting although it is just conference chatter with no details…
2018-02-22 FT – Vitol, world’s biggest independent oil trader, sees “fairly strong” demand for crude this year, leading to a further drawdown in global stockpiles later in 2018.
Speaking at International Petroleum Week conference “Half a billion barrels of oil has been drawn down in a short period of time”
Stockpiles at important oil storage hubs such as Saldanha Bay in South Africa have been “emptied” and crude stored on tankers at sea, such as off the coast of Iran and Singapore, is “all gone.”
(one free read) https://www.ft.com/content/3d812528-17b6-11e8-9376-4a6390addb44
What do you think a “short period of time” is? One year would be 1.4 mmbpd short, or 1.6% negative balance – that would seem to be the biggest oil news of 2017 if true (or maybe second after record lowest discoveries).
He must mean 12 months, and he’s including everything OECD stocks and floating etc
US storage (crude+products) topped in February 2017 and have fallen by 152 million barrels to November. US monthly chart https://pbs.twimg.com/media/DVN7mH3WkAAtWVf.jpg
The floating storage statistics that were available (for free) topped out February 10th 2017 (sadly no longer available)
What’s going to stop stocks keeping on falling? Doesn’t it indicate we are under supplied – there should be a signal to price, but it only seems to be triggered by US crude stocks, which are mostly influenced by refinery outages at the moment, not global numbers.
Yeah, the stocks have been dropping faster than US supply has been increasing, and it has increased a bunch since the first of last year. So, how’s the increase in US shale supposed to keep up with the increase in demand, and the shortage already apparent? I am talking 2018, not 2022.
This is why I expect Brent may be at $107/b by the end of 2018.
See comment further down.
Hi Dennis,
If Brent is trading at $107 ten months from now. California Resource Corporation (CRC) will be trading north of $50 per share, which you can buy today for less than $20. If you want to leverage that trade, you can buy January 2019 $35 calls for less than $3. You can make money with your knowledge if you put it to work. It could make the difference between you buying model S instead of a model 3. It’s why the weekly EIA balance sheet Energy News posted a link to below is so important.
You snooze you lose
Huntingtonbeach,
Trends can change, I am not a gambler.
The “if the current trend continues” is a very speculative “if”.
You are welcome to make that bet, I’ll keep my money.
“I expect Brent may be at $107/b by the end of 2018”
That’s a lot of “if”‘s from such a bold statement from someone who discounts the EIA balance sheet for uncertainty. There is a difference in random chance gambling and risk management. I’m with Goldman Sachs seeing Brent reaching $80 plus in the next 6 months. Remember this opportunity you are pasting on. Because I’m going to remind you of it later this year.
Safe minimum risk 10 year T notes pays less than 3% before inflation. Warren Buffett manages risk and doesn’t gamble.
To each is own.
Snort—-
HighCocaine, you might want to take notes before autonomous driving takes your day job
Job?
You must be kidding!
You can’t acquire wealth working–
Huntington beach,
Place your bet.
My guess is 85/b in 6 months simular to goldman’s guess.
The guess could be right or wrong.
You see the “may” in that bold guess, I assume.
The output estimates in the weekly petroleum update is not very good.
I have never suggested the entire report should be ignored. Import, export, and stock levels are useful. Output data not so much.
Dennis, I already have more than enough CRC to buy a model 3 and bought a whole lot of it for less than $10. If it’s 6 months or 2 years, oil is going up in price. Every time a drill bit enters mother earth, there is a risk of it being a dry hole. I’m just not into getting dirt under my finger nails. If your really that risk adverse, how about a little XOM and a sunroof on your 3?
There are doers and there are talkers, but when the Tesla meets the road. What’s your tombstone going to say ?
Huntingtonbeach,
I could buy a Model S tomorrow, I choose not to and will wait for the Model 3, you may not be aware, but there is a long line for the Tesla Model 3, those who own a Tesla get to jump the line, I am not one of those people.
I choose not to be.
As you have said it’s a free country, thank goodness for that.
OK Dennis, I’m going to stop trying to push your button for now. I wouldn’t buy an S either. I thought the quality of the interior was more inline with a 50K vehicle with a few modern designs to take ones attention away from that fact. The performance is amazing, but I’m not 20 years old anymore. So that doesn’t register that important with me anymore either.
Besides, 100K for a car just doesn’t really make sense. The moment you take ownership, it’s worth 20% less and the idiot parked next to you will slam his door into it, if he doesn’t rear end you. It’s only a means of transportation.
My bike is fossil free and I have electric gardening equipment. They are both good examples that we can live well with less fossil fuel.
Huntingtonbeach,
Agree 100k is too much, every car depreciates rather quickly, but it’s hard to find a used Tesla with the features I want, I’ll buy new and run it into the ground. Bicycles are nice for local transport in nice weather.
To go 100 miles in a couple of hours, not so much and I would rather reduce my carbon emissions when making such trips, I will also get PV to power the car, in the mean time I support low carbon electricity production by buying green tags.
It takes one person at a time to make positive changes.
If he refers to the last 8 months (incl. february) that would mean a deficit of more than 2 mill barrels/d, storage reductions of 60 million barrels a month. Really big numbers, difficult to check them though.
If this was true, we’re in big trouble with demand growing nearer to 2mb/d than 1 adding to the demand.
So we would need 3.5 mb/d new capacity end of the year – with all these frack sand shortages and OPM companies stuffing the scare frack sand in unproductive holes this will get difficult, especially when OPEC doesn’t has much real spare capacities fast. Just 3 month peak capacities won’t do the trick, a fast opening of field in Iraque and Saudi spare fields would be necessary to prevent 150$ oil.
I also have big problems figuring out how the deficit is going to stop. The strange thing is as G.Kaplan commented above, that the market seems unaware of where all this is heading. Stock prices for E&P companies for example are lagging hard compared to other sectors.
“The strange thing is as G.Kaplan commented above, that the market seems unaware of where all this is heading. ”
Can’t blame them for that… There are so many uncertainties and counter-intuitive signals going on that it’s quite a gamble to make a forecast.
The price of oil is pushed down by the prospect of increased LTO production, while the the tax cut from Trump could raise inflation and push the price up… But this could also increase interest rate much quicker, which could harm LTO financials and investments, so push the price higher. But then, consumption could be harmed. And we don’t exactly know what OPEC will (or could) do if the price rise above $70. And the incredible growth seen in 2017 may have some bubble composition that could deflate soon, reducing also the demand.
2018 is a tough year to decipher for analysts.
Ves,
This concept is referred to as Say’s Law. In short, supply creates its own demand.
This “Law” has been discarded by economists to the “dustbin of history”.
See
https://en.wikipedia.org/wiki/Say%27s_law
Today, most mainstream economists reject Say’s law.
Global Offshore Prospects – Westwood Group, from 25th January, but can’t remember if it was posted.
https://www.sut.org/wp-content/uploads/2018/01/Global-Offshore-Prospects-SUT-25th-January-2018-1.pdf
They actually predict continued fairly low investment and offshore drilling for the next few years. They also have a list of new production which I think has a number of errors – e.g. Bonga SW next year and Rosebank in 2020 (I don’t think either has gone through FID yet), Zama in 2020 (appraisal drilling is not even due until early 2019 but I guess production could be fast tracked if successful), Sepia and Horseshoe in 2019 when I think both are scheduled for 2021/2022 (and they can’t spell Egina which you’d have thought they would given the amount of money they charge).
Talking at the same conference
UAE energy minister: People talking about “oversupply”, but “my worry is an undersupply”, as the effects of years of investment cuts into future oil production take effect.
The data on global oil stocks has never been very clear, there may be some proprietary data out there that gives the industry a better idea of what actual stocks are.
People may pay the most attention to US stocks because LTO caused the oversupply in 2014 so if that occurs again it may show up there, also US net import levels should give some clue as to how much US is pulling from the World market.
Prices also give us a clue as to how tight the market is. Brent has been rising at an annual rate of increase of about $40/b, at the end of 2017 it was about $67/b, should this rate of increase continue for another 12 months we might reach $107/b by the end of 2018. Lately the increase has slowed, it is impossible to predict forward prices and futures contracts do a poor job of predicting oil prices 12 months ahead.
The model continues to say $63.
Thank you George for yet another great post.
I’m not sure if I interpret the Westood presentation correctly. Do I miss something or have they forgotten how decline affect supply-demand balance? Page 15 (and 18) seems to only include new projects (another issue I would add to yours: Sverdrup is expected to ramp up instantaneous, but it is scheduled to come online at the end of the year).
Agreed on Westwood – I think a presentation by an economist or management consultant rather than a petroleum engineer; not so sure about the post, from the comments evidently too long and not as readable as it might have been, but thanks anyway. I thought there’d be someone commenting on Permian – the resource looks much higher than I had expected – rather than nitpicking over the smaller areas.
George,
You seemed to throw out the Permian estimate. The USGS estimate (F50) is about 29 Gb of undiscovered TRR for Wolfcamp and Spraberry combined, Delaware maybe another 5 Gb for 34 Gb, plus proved reserves of 4 Gb (at time of USGS estimates) for a total of about 38 Gb.
Verlhulst does not give a very good estimate in general and especially early in the life of a field can give strange results.
If we assume average EUR for Permian basin horizontal wells of 250 kb, the 38 Gb estimate suggests 152,000 total wells might be drilled. (Note that the 250 kb EUR average assumes that new well EUR will decline after sweet spots are fully drilled.)
The average 2015-2016 Permian well has an EUR of about 290 kb (based on data through April 2017).
Definitly made by management consultants, using the first 8 slides for marketing of their services. The consultant guys usually don’t have in depth market knowledge, it is a bit hit or miss what they come up with. Johan Sverdrup is reportedly 70% complete, ahead of plans already. This has been the trend in Norway lately with Maria starting up Dec 2017, half a year ahead of schedule. Surplus oil service capacity seems to help in that regard. Nevertheless the impact of Johan Sverdrup first phase would in large be felt in 2020 as the field eventually ramps up to the projected 440 000 barrels/d.
US exports at 2 million barrels per day
https://pbs.twimg.com/media/DWpthNMX4AAQje-.jpg
Saxo Bank charts https://pbs.twimg.com/media/DWpud-HWsAEN_Na.jpg
EIA pdf file http://ir.eia.gov/wpsr/overview.pdf
SPR is down by 100k bopd. Is that part of the oil Trump wanted to sell? Or are refineries having difficulties finding heavy oil? Imports from Venezuela was only 174k bopd compared to 497k bopd the week before.
By the way, does anyone know how much of the 665 million barrels of oil in SPR is heavy oil?
Here’s the EIA’s article on US SPR sales, I cannot remember whats going on.
February 21, 2018 – EIA Today in Energy
Recent legislation mandates additional sales of U.S. Strategic Petroleum Reserve crude oil
https://www.eia.gov/todayinenergy/detail.php?id=35032
While the SPR storage statistics are only split into, sweet and sour. As it was mostly filled before 2005 at 700 million barrels, we can guess that it’s not Light Tight Oil.
https://www.spr.doe.gov/dir/dir.html
Thanks EN. So then it could be planned sales.
Just a reminder that oil-fed Sovereign Wealth Funds buy stocks. They buy them on autopilot. There’s essentially no discretion. As entities unto themselves, they own about 3% of all stock shares in the whole world.
If oil went to $150, that doesn’t mean markets crash. They will just buy more stock.
US ending stocks February 16th
Crude oil down approx -1.6 million barrels
Oil products down -0.7
Overall total (shown on chart), down -2.3
Natural Gas products: Propane & NGPLs down -5.4
Chart on Twitter: Overall total, crude oil & oil products, down -2.3 million barrels in the week
https://pbs.twimg.com/media/DWqiUgnW4AMhV8i.jpg
And production is already up 4.3% from last year.
Well, they are academics, so we can discount this a bit:
U.S. Vastly Overstates Oil Output Forecasts, MIT Study Suggests
https://www.bloomberg.com/news/articles/2017-12-01/mit-study-suggests-u-s-vastly-overstates-oil-output-forecasts
The article looks like they have read this board: “Much of increased productivity came from drilling core areas.When they are drilled up, things will get more messy”.
https://oilprice.com/Latest-Energy-News/World-News/Exxon-Could-Make-Beaumont-The-Largest-Refinery-In-The-US.html
At least Exxon will be refining their Permian production, looks like.
https://oilprice.com/Energy/Oil-Prices/What-Is-The-Right-Price-For-Oil-In-A-Balanced-Market.html
This belongs with discussions above. Sounds like an understatement on “bullish” after March.
This was quite interesting:
China Is Erasing The Gas Glut
https://oilprice.com/Energy/Natural-Gas/China-Is-Erasing-The-Gas-Glut.html
The market to distribute gas globally is getting a big boost by using ships to regassify LNG at import points. These can be rebuilds or converted, LNG carriers.
The new approach by the Norwegian outfit – Golnar – is aggressively pursuing ship-based liquification plants to cut down both time and expense to produce LNG.
If Tellurian’s Driftwood project succeeds at the extremely low price of $16 billion to produce 27 million tonnes per year, US LNG will have an enormous economic advantage in the global LNG market.
New problems in Libya:
Libya’s El Feel Oilfield Evacuated After Shutdown Threats
https://oilprice.com/Latest-Energy-News/World-News/Libyas-El-Feel-Oilfield-Evacuated-After-Shutdown-Threats.html
Reading an article by Kari Johnson and Tim Beims in The American Oil & Gas Reporter about Permian Basin sand.
Article says 50 billion pounds of proponant used in the Permian in 2017 and forecasts call for 120 billion pounds annually by 2022. 120 billion pounds fills 2.5 million hopper trailers to the brim.
Looks like diesel demand will be heading up.
SS
So many data points in that excellent article that an open minded reader could get a sense of where future production trends are headed.
“15/20 percent fractures currently propped”. (Former Core Lab CEO said only about 10%).
Meaning that the scouring/propping effects of the micro proppants will vastly increase propped Stimulated Reservoir Volume.
Recent comments on this site noting the long-recognized productivity increase in the heel versus toe portions of the laterals are being addressed by the neuturally buoyant family of material. This includes the low density, high crush characteristics of proppants being used in the deeper Utica wells.
(EOG’s 16,000+ foot deep Austin Chalk may show what is possible at increasingly deeper depths).
The tracing in real time will continue to allow more precise control of the frac along with effective diversion products.
This in depth article deals only with one small part – proppants – in a very complex arena, unconventional hydrocarbon development.
The broader, ongoing innovations such as water processing involving emerging technologies (graphene implementation and various nano technologies being only a few), pumping mechanisms using fluid pressure transfer like the still-unsuccessful Vorteq approach, new modes of micro seismic, improving artificial lift innovations, and on and on.
Folks who continue to ignore what has been demonstrated these past dozen years will continue to make erroneous projections that will be deemed credible to a diminishing audience.
Coffeeguyzz,
Do all of these innovations reduce costs in Capex per barrel of EUR? That remains to be seen.
Eventually all oil fields run out of room in their sweet spots, regardless of technological innovation. It’s not magic, though you seem to believe it is. 🙂
You take every speculative estimate and assume it must be an underestimate.
I on the other hand take main stream estimates from the USGS and simply assume they are roughly correct.
Again when choosing estimates from physical scientists (such as a geophysicist or geologist) and social scientists (such as an economist), I choose physical science estimates every time. Can opener anyone?
Going to need a lot of water too. Not sure West Texas has enough.
John, I appreciate your awareness of this issue; lots of folks with the dreaded shale abundance disease don’t care about debt, dismal finances, decline, depletion, fake reserves, etc., and they sure don’t care about water. Particularly if it is not their water. I guess, come to think of it, the same can be said about what must be close to $300B of shale oil debt. If it isn’t there’s, who cares?
As I said uphole, I have a buddy who just attended a big Permian Basin water conference in Midland and everything, apparently, is okeedokee. Nobody discussed costs, availability, declining avilability…it was all a bunch of bullshit about what they are trying to do, or going to do…when water gets to be a problem and when they are told to stop. Until then it is money first.
I sat a 15M pound frac not long ago and it took slightly over 460,000 BW to pump. That’s typical for the bigger frac’s these days and depending on water spacers between stages, etc. they can actually be more than that. That’s 19 million gallons of water. Enough water for 227,000 homo sapiens to use in one day. The population of the Midland Odessa metroplex is something like that, 250K maybe, and what, they complete 300 wells a month in West Texas?
West Texas does NOT have that kind of water.
How much water is used for farming and cattle, vs residential?
If a pound of cotton takes two barrels of water to produce, and a barrel of oil takes 2 barrels of water to produce…which is more valuable, the pound of cotton or the barrel of oil?
How about 40 barrels of water to produce a pound of hamburger? That’s 20 barrels of oil…
40 bbls. of water for a pound of hamburger? I am making an example of fresh water use in an arid desert, to drill oil that gets exported to China. And to make a dent in the minds of the estimators; that there are extenuating circumstances to shale oil growth other than just price.
Otherwise, I like to eat and stay warm in the winter.
So, what is exactly your point, Nick; besides the obvious, I mean?
Yes, 40 bbls of water for a pound of hamburger. It takes a lot of water to raise, feed and fatten a cow.
Yes, West Texas is pretty arid. But, for some reason there’s quite a bit of farming in the area. It uses way, way more water than residential use. About 95% is for farming.
So, what’s my point? I would have hoped it was indeed obvious, but based on your answer that’s not clear. The point is that it’s unrealistic to worry about water consumption for oil production, when it’s mostly being used for things that are way, way less valuable.
That farmer may not own the mineral rights, but only the cows and crops he/she can raise on it to feed their kids. What’s more valuable, the kids or someone else’s minerals? The Permian has been going for decades, and mineral rights often belong to others, and not the land owners. If you bought some land there now, you would probably not wind up with very much mineral rights, if any. The same would have been true twenty or thirty years ago.
I’m not saying it should not be developed, and I am sure Mile is not saying that. It should be developed responsibly. That’s a word quite foreign to E&Ps, but should be looked at by the Texas RRC. That is one of their responsibilities.
What’s more valuable, the kids or someone else’s minerals?
It takes a lot of land, and an enormous amount of water to clear enough profit to raise a family decently. Farmers measure water not in gallons or barrels, but in acre-feet: the water needed to cover an acre to a depth of a foot. That’s 326k gallons.
So, if farmers could sell their water rights for, say, a penny per gallon, most of them would be far wealthier than they are raising cotton or cattle.
The idea that water shortages are a problem for oil production is highly unrealistic.
It was then not clear, no; now it is the dumbest thing I’ve ever heard. So dumb, in fact, I won’t even ask for clarification as to the relationship between exported oil, for the sake of corporate dividends, or loan covenants, and food, or a nice drink of water on a hot summer day.
Some farming occurs in the northern reaches of the Midland Basin, very little to none in the Delaware Basin, and both are heavily dependent on different groundwater sources, at different depths, with different qualities of water, etc. etc.
But you’re from New York, aren’t you, and don’t understand water, or what water means to people who don’t have it, or who might be afraid of another drought, or falling water tables in their water wells, or low TDS water that starts getting funky tasting, do you? Whose ownership and ties to the land go back five centuries, who don’t want to sell their water, at any cost, and don’t want to see it drained out from underneath them, either. Those are things that city boys struggle with understanding, I suspect. Nevertheless, from the comfort of your keyboard, in New York, you are inclined to advise me, a Texan, that I am being “unrealistic” about the amount of water being used for oil extraction? Highly unrealistic, in fact. Good grief.
Gotcha, Nicki. Have a nice comfortable weekend, pardnor.
Hi Mike,
Won’t Texans be able to figure it out?
Your state, your decision. Simple as that.
I assume the people producing oil in the region are aware of the availability of water in the region.
I’ll jump into this fray.
I assume Nick is referring the the Ogallala Aquifer, which runs under a lot of the Great Plains, including the Northern part of the Permian Basin. It is true there are areas of this massive aquifer that are not recharging and agricultural irrigation is causing the water table to fall. There are other areas where the recharge is close to the draws, and still other areas where the table is rising.
A very significant portion of US meat is raised above this aquifer, as wells as considerable amounts of grain. There are huge meat packing plants there, employing tens of thousands of people, almost all of Mexican heritage. So yes, without these immigrants, what would we do for meat? But I’m getting off topic.
I presume the massive amounts of water needed for the PB wells are not coming from “non-recharging” areas of the Ogallala.
Maybe it would be a good idea to examine just where specifically the frac water is coming from, competing uses, etc.
(We grow irrigated crops, and water issues are of importance to us. Fortunately, we are in an area that has significant rains most years, a high water table and plenty of recharge).
Dennis, what does your comment have to do with Nick’s? If you are defending his comments perhaps you can explain them to me because they seem really stupid to me. You folks with no vested interest in reality are confusing me. Anti-oil folks defending fresh water use to drill oil wells, buy an EV, get off fossil fuels ASAP, in the mean time, buy oil E&P stocks and make some bucks, toilet water going down counter clock-wise, cats sleeping with dogs…you folks need to get your shit straight.
Actually, homo sapiens are pretty short sighted and have a hard time thinking past next week, even sadly, Texans. I mean, just look at Tee Tee. At the moment money rules in West Texas and that money is so vast that most, but not all, people don’t give a shit about water, they’ll make their lick and move to…Maine, I guess. I don’t know. Nobody has any huevos in Texas anymore; its all about money. No body with any authority has any huevos, they just need votes.
I dislike the anointed, intellectually superior from both coasts who think they understand life so easily, that it is all so black and white, so science-like, and that we dumb asses in middle America, that get dirt under our finger nails, always need…help understanding things. That we need advise.
Just read Cadillac Desert— the picture will become clear, but one may have a little trouble sleeping.
Hi Mike,
My observation is that the people of Texas are smart. They will determine the best way to allocate a scarce resource.
One way often recommended by economists is to use free markets to efficiently allocate a scarce resource.
Often Nick points out that the lack of a good pricing mechanism for water leads to it being used inefficiently.
I do not know if that observation applies to Texas or not.
I agree with you that it is likely that scarce water resources will be a problem.
I imagine the price of water will increase, making the cost of well completion more expensive and the oil production will be less profitable.
If oil prices remain at $65/b or less, much of Permian Basin oil may never be recovered, in my opinion.
Hi Dennis,
What happened with my 2 post in conversation with you? Did you deleted?
I deleted you and will again. You are obviously too dumb to read a graph and too self important to try to learn. That is your choice, and you can choose to argue against my assumptions and conclusions too; but don’t use a post that has taken a bit of time to create, and is specifically aimed at the non scientifically illiterate, to complain about that approach with your snide little, passive aggressive bullshit, just ignore it – I’m going to help you along on that path.
You are not welcome to comment under any post that I have taken the trouble to produce so go somewhere else.
https://www.mrt.com/business/oil/amp/Oil-and-gas-operators-push-for-use-of-recycled-12631652.php
Apache, Pioneer, and a buch of them are now using recycled water for completions. Much smarter than shoving it down holes, or letting it dry up in the sun in ponds. They’ll work it out, RRC is heavily invested in this, too. I am sure the recycled water is not necessarily potable, but the idea of drinking anything out of a tank truck turns me green, even if it is considered “safe”.
“Chesapeake Energy’s Eagle Ford fact sheet estimates a single well may use as much as 125,000+ barrels (6 million gallons) of water. CHK reports that is the same volume that:
Flows by the city of Laredo in the Rio Grande every 4.5 minutes
Is used to irrigate over 14 acres of vegetables
Used by the city of San Antonio every 22 minutes
The usage reported by Chesapeake was commonplace early in the development of the play, but the drought and cost of water has motivated companies to rein in their use.
ConocoPhillips has brought water usage in each well down to 85,000 barrels or less (3.57 million gallons) in 2011. That’s a 30% drop in consumption per well and we haven’t quite hit full stride in development of the play. Conoco also estimates that at its peak the Eagle Ford will account for 5-7% of total water consumption across the 16 county area studied.”
Conoco’s estimate is just for the 16 county area. The better comparison is a much larger area, as oil production is geographically very concentrated, while agriculture is much more widely distributed.
A well that uses 85k barrels of water will produce at least that much oil. Farmers value water in the range of 1 cent per barrel, while oil goes for 5,000 cents per barrel.
Think of it this way: oil producers measure water in barrels. Farmers measure it in Acre-Feet: there are about 8,000 barrels per acre-foot. So, one well uses about 10 acre-feet.
Texas used about 16,012,545 acre-feet in 2012. There were about 11,000 oil wells drilled in Texas that year, so that’s roughly 2/3 of one percent of overall water consumption, assuming they’re all LTO (which they’re not).
And that’s in relatively desert-like Texas – it would be much lower for the country as a whole, which used about 400M acre-feet. There were about 50,000 wells drilled in 2012. If 30k were LTO, then that’s less than one tenth of one percent of overall water consumption.
MIke,
To provide good information about water is not the same thing as defending the LTO industry. As it happens, I don’t really have a strong opinion about the LTO industry – as I’ve pointed out many times, if we’re going to transition away from fossil fuels, we need to do it on the demand side, not the production side. I think we agree on that.
If the LTO industry is defrauding investors, it’s useful to convince your readers of it, with good evidence and arguments. If the US would be better off in the long run to pay attention to conserving it’s oil (which I think it would), then it’s good to make that argument.
But, we shouldn’t waste our time on stuff that’s not important, like water for LTO production.
Use produced water. It has some kinks, has to be ultra filtered and deoiled, but it’s feasible.
There are 2-3 million heavy trucks on the road in the US. So it sounds huge, but if I understand the amount right, that would be 1 days work for trucks. I didn’t check to see if the weight means each hopper trailer is carrying weight limit but I figured that is how you did it
Mexico 2P oil reserves dropped slightly for 2017, 3p increased because of the about 600 mmbbls discoveries in the GoM, which should be converted to 2P after some appraisal drilling and FID).
https://portal.cnih.cnh.gob.mx/dashboard-reservas.php
Baker Hughes, US oil rig count +1 to 799
Permian +2
Natural gas +2 to 179
http://phx.corporate-ir.net/phoenix.zhtml?c=79687&p=irol-reportsother
After looking at a million of these horizontals, a well just permitted in Atascosa County just caught my eye. A 500 foot vertical into the Sparta sand near Jourdanton.
For a while, many have sought a geological reserves estimate. Just about all discussions of reserves devolve into SEC rules and the 1P 2P stuff.
Why hasn’t someone set a price assumption of $1000/barrel in order to get a geological, non technical non economic reserves estimate? One would think that is OOIP, but even those discussions have technical issues.
USGS estimates are “technically recoverable,” i.e. at any price given the best current technology. The ultimate limit is likely EROI, i.e. when the energy needed to extract the oil equals what you get back. That could likely be equated to a price with a bit of work (and might already have been done so by some ecological economists). If you want to take it as far as possible then I think there is enough reduced carbon and hydrogen dispersed around the earth, mostly at really low concentrations, to burn all the oxygen in the atmosphere several times over (I think that was in one of David Archer’s books).
But EROI is not a limit. A stripper pump could run on nat gas or coal derived electricity. That doesn’t limit how much oil you get out when you HAVE to have it. And when you HAVE to have it, price would be irrelevant too.
Oh, speaking of which, was there a solid array of numbers, average of all global fields and field by field, for number of barrels reserves per dollar of price?
There probably is some sort of effort limit. A Coke can sized bubble of oil probably won’t be pursued if it’s a 6 month task to get it out.
But price and technically recoverable . . . those are not real limits when both can change. I suppose the abiotic wackos could make a case for OOIP changing, but the magnitudes of that would be insignif.
If you get to that point the gas and coal would be used directly – GTL and CTL have better EROI than one, though it’s still pretty bad, especially if there isn’t a good use for the waste heat (and maybe the liquid nitrogen from the air plants as well, I don’t have enough knowledge to know for sure).
I don’t fully understand the second paragraph.
Point was that EROI is not a limit if the energy used to extract oil is not derived from oil. Natural gas or coal generates electricity and that electricity might be the source of energy used to extract oil. So even if more such energy is consumed extracting a certain number of joules of oil energy, that doesn’t matter because you have to have the oil joules to eat. Thus, EROI is not the endpoint for oil extraction wherewithal.
Second paragraph is looking for additional barrels of oil declared in reserves per price dollar, in a given field and globally. I suppose it’s not linear for all price levels.
Like I said, well before the EROI gets to one the available energy would be used elsewhere with higher EROI to do effectively what the oil would be doing (e.g. if not gas to liquids then gas to wire powering EVs).
For the second point I don’t know of anything like that. I don’t know how much you know of reservoirs but the oil that is left behind isn’t in some blobs that could be extracted if the right well was drilled. It is dispersed within the rock pores, and is pretty much immobile. There is no way to extract this without mining and treating the rock like tar sands, except it’s really deep and most will also be surrounded by high pressure water. So it’s not like there’s some gradual increase in recovery with price (there may be an impact on abandonment rate, but this would represent a very small proportion of the total recovery). To a first approximation a reservoir pressure is equal to the head of water for a column of the field depth. Water flood reservoirs won’t flow naturally once they are mostly water – they need the lower density from the oil and released gas to allow a pressure difference. With very high water cuts they need artificial lift – like injected gas lift or downhole pumps, these all take a lot of energy to build and operate for sometimes not much return.
EOR methods try to make a bit more of the remaining oil mobile, e.g. by heating, or adding stuff to the injected water so it penetrates the pores better, or adding lighter oil or gas that gets absorbed into the in-place oil and frees it up, but it’s usually at most a few percent addition for a lot of effort, and you need a flowing system, i.e. not one that’s been shut down.
Offshore the biggest impact of higher price is that it allows smaller pockets oil to be tied back to, or drilled from, a central platform, so these would move to newly discovered reserve or reserve growth (e.g. if a small fault block in a producing field becomes commercial).
For additional clarity – some of those additional recovery methods or tie-backs may already have been assumed in the 2P estimate as probable, and would be turned to proven, but even with price rises there are moves the other way from elsewhere in the field that can, and often do, cancel these gains as more field knowledge is gained.
But wait, that suggests the SEC . . . is purely forcing revaluation of a constant quantity of reserves — without any change of the reserves total? That can’t be right. The whole concept of booking reserves would be invalid.
Sure, price might determine what flows because poor areas aren’t drilled at low price (one supposes) but is there not an enforced SEC rule that would not just lower value of reserves, but amount of them — because they no longer pass the criteria for economic development?
You description sounds like technically recoverable reserves, but they can’t be declared unless the company is going to start recovering within some period of time, which is price dependent?
I said some, not all. It’s not an exact science and has a lot of unknowns there are always revisions down and up, especially on newer discoveries (as given in the post above last year there were >5Gb revisions down and up on 32 Gb total in the USA). I guess I shouldn’t try to add clarity.
What I don’t understand is why there is an assumption that a higher price will result in more oil production.
Yes, a higher price makes drilling more attractive, but if you are a company looking for something to do with your money, why confine it to oil?
Even if the price of oil greatly increases, if it isn’t the most profitable business you can be in, why continue to pursue it?
If we are looking at global economics, energy isn’t currently to best place to put your money.
They don’t necessarily use the money to drill – recently share buy backs and increased dividends probably took as much, but the companies exist only to make money for the shareholders, not for the good of society in general, and recently only really for this year’s numbers with not much longer term thinking.
That’s what I see. And I take it as a sign that at least some gas and oil companies see less benefit in getting more gas and oil out of the ground than in cashing out as they can.
I’m not confident that higher prices will lure companies into committing “their” money into more production. Unless profits rise or unless they can continue to tap investors and lenders they won’t pay back, why pursue a low margin business when there are other ways to spend the money?
I agree. I think another issue is that the upper management in the IOCs and NOCs have developed their career in a period when there was lot’s of oil to be found and plenty of projects to choose from. They are pretty conservative and mostly just follow company policy, without too much independent thought. I think they are going to find it very difficult as the projects dry up and exploration risk keeps growing. Probably deer in the highlights, which will lead to more sluggishness and decline.
Hi Boomer,
Those will skills finding and producing oil will try to utilize those skills. When the price of oil is high a good living can be made producing it, so the oil will be produced.
It seems to me that the price of energy will rise to the point where investing in it is worthwhile.
If not, we would need an economy that runs on zero energy. I doubt that will happen, we may continue to reduce the energy intensity of economic output as energy becomes more expensive, but some energy will need to be produced.
Hello Dennis,
Work = Energy = Force * Distance
Anything that moves if a force is applied consumes energy even if there are no dissipative losses .
Anything that moves that is not the direct result of human or animal effort requires an energy source.
Therefore, all automation requires non-human energy.
The GDP is net production of goods and services. Services may be totally human powered but goods in advanced societies are commonly not.
Generally, energy consumed will be proportional to GDP even at 100% efficiency.
Also energy consumed will be proportional to complexity.
As available energy declines so will GDP and complexity.
Anything that moves if a force is applied consumes energy even if there are no dissipative losses .
If there are no dissipative losses (aka friction) then it is acceleration: an energy conversion from motive power to kinetic energy. That kinetic energy can be recovered with regenerative braking.
Energy consumed will be proportional to GDP
Maybe, in the long run. In the short run the ratio can be reduced dramatically. US GDP is 3x higher than 1979, but oil consumption is lower.
As available energy declines so will GDP and complexity.
Not “As”, but “if”. The sun drops 100,000 terawatts on the earth continuously. We’re quite a ways from reaching that limit.
Hi Paul,
Even human and animal energy needs input – you can’t drive a Tour de France on 2000 cal a day. It’s more 10000.
Early automation was even on human energy – spinning jenny for example: https://en.wikipedia.org/wiki/Spinning_jenny
was first powered by human energy before they started with water power.
So even with only human and animal power you need extra land to grow extra crops – it’s bio fuel. Everyone working really hard physical knows this can’t be done on an office worker diet.
Currently food production has eroei far lower than 1:1, and we still produce it. But you have to have energy to subsidy things with eroei lower than 1:1.
Too much work. I used to set “technical reserves” at $150 per barrel to reduce the amount of baloney engineers and geologists began to spin to estimate reserves in marginal areas, increased recovery from pushing EOR to the outer limits, etc. if you set $1000 it would make us into fulltime bs generating machines.
Hi Fernando,
What price would you use today for technical reserves, if you used $150 when oil was $30/b, that would suggest that today the “technical price” to determine TRR might be about $300/b (in 2017$)?
Westwood Highlights Exploration Hits & Misses of 2017
https://www.westwoodenergy.com/news/press-release/westwood-highlights-exploration-hits-misses-2017/
Half the ten high impact discoveries were gas. Looks like Whale goes against last year, but Ballymore against this.
https://oilprice.com/Energy/Crude-Oil/Frac-Sand-Shortage-Threatens-Shale-Boom.html
Probably a reality if Halliburton is adjusting their first quarter earnings downwards for 2018.
https://www.theglobeandmail.com/amp/report-on-business/halliburton-says-profit-being-hurt-by-cn-service-delays/article38001788/
Looks like almost a two week delay.
https://www.eia.gov/petroleum/drilling/pdf/eagleford.pdf
If you want to see a real oddity, look at the legacy decline in the Eagle Ford on the EIA drilling productivity pdf. Not sure if the 100 plus wells that EOG is conducting enhanced recovery on has anything to do with this, or someone had a bad nervous tic while drawing it. Going back and reviewing past months, they keep revising the decline curve upwards. The down tic was in August, so may be more related to Harvey.
https://seekingalpha.com/amp/article/4149014-resolute-energy-trips-new-wolfcamp-c-wells-c-stands-colossal-mistake
Eagle Ford went through its discouragement on overhype, sure that will happen some in the Permian, too. Wolfcamp C and D seem to have more than question marks per this article. In the Delaware, that is. No study in the Midland. However, it certainly makes me wonder about some of the future value of some of these cube DUCs. Ten million dollar well yielding less than 200k EUR oil, is more than questionable.
https://oilprice.com/Geopolitics/International/Despair-In-Venezuela-We-Are-Dying-Of-Hunger-In-The-Oil-Industry.html
700 to 800k drop??
Venezuela -750, Mexico -300, Asia-Pacific -200, Norway -100, Colombia -50, Azerbaijan -50, smaller OPEC – 100, GoM -50: might get a bit tight.
Which totals 1600. We are short, at least 50 now, and demand is expectected to be 1600 more. Meaning that the US, Kazakhstan, Guyana, Argentina, and Bolivia need to have an increase in their production to equal 3.25 million in 2018 to break even. They couldn’t get half of that, so even if OPEC and Russia dissolved the “cut”, and produced normally, we would still be more than a million short. Whatever I am leaving out would probably not count much. Sure, yours are estimates of decline, but over a million barrels leaves a lot of wiggle room. 2019 looks really scary.
US can’t see past the end of their nose, so when Maduro has his “election” in April, the US is posed to shut it off, quickening the decline as we are the only cash buyer of the oil. Supposedly, the last 1.2 million of Venezuela production is “immune”, because it is in JV’s with others. What’s to stop him from getting greedy and panicky enough to make them want to exit the ventures? It’s going to be tough to replace it, and some refineries will be competing for, and paying a higher dollar for heavier oil. But if you dance to the music, you have to pay the piper. However, overall, the US will not panic, because of the supposed never ending stream of oil from the Permian. That song is getting older than Bing Crosby by Dec 24.
In the meantime, we are selling as much SPR as we can, and trying to figure out how we can export more of the shale and GOM oil that we can. Grasshoppers, not squirrels. OPEC and Russia have this already figured out, the US is now the dull tool in the tool shed.
Correction to the above. The shortage now is closer to 500k, not 50k. Based on estimates of world inventory deceases last year. Which means we would have to come close to a 3.7 million increase to even supply/demand. Leaves a whole lot of room for estimate vs actual differences.
Your analysis is off. Venezuelan shipments to the US are below 200KBOPD, the oil is going to India and others, contracts are standard. JV production has never been immune, quite a few JV contracts say the oil is transferred to PDVSA. And 60% of JV shares are owned by pdvsa for those that allow investors to lift (the Chinese Sinovensa JV being an exception). Venezuelan blends are easy to replace, the crude is heavy, acidic, sour, and sometimes unstable (there are exceptions but the generalization is valid).
But production continues to drop, and there’s no end in sight. The dictatorship put General Manuel Quevedo in charge, he’s a hard core communist known for squashing protests, and from his daily activity log it appears he spends his time either going over which pdvsa employees get arrested, having talks with the Iranians to receive advice, and holding carnival parties at the pdvsa main office in Caracas (I got a video from that party with half naked dancers and pro Maduro chanting which really made my day, because if that guy stays on the job production will crater a lot faster).
Since USA oil refineries are able to process Venezuela’s garbage oil, they can process other oils as well. The light crude can be exported, and the refining margins may be a bit lower, but it’s not a huge deal since we are dealing with refining margins for Citgo, a pdvsa subsidiary which is in turmoil, some of its managers were arrested on fake charges when they were lured to Caracas. Lower Citgo profits are good for humanity. Anything which helps take the regime down is useful.
The point I was trying to make was the extent of the possible Venezuelan drop. George put an estimate of 750k possible for 2018, and I was trying to make a point that it may all be in jeopardy. Do you have a projection on how much it may drop in 2018 and later? As for everything else I said about Venezuela, you are probably much more knowledgeable. I said some refineries, which includes Citgo. “You dance to the music, you pay the piper.”
I said George’s estimates, were just that, estimates. The whole point of the post was to indicate that all estimates taken together indicate we are far short to meeting demand in 2018. Even if we eliminate any drop in Venezuela, we would still be short. So, ignore any estimate or comment concerning Venezuela, and insert your own. Still short.
On second thought, I see what caused your ire. The comment about the US not being able to see past its nose. Which is true in most circumstances, but it is probably true, I shouldn’t have inserted it in this sentence. I really don’t know which is best, to shut them off or go forward as is. Having less income surely would harm the people more short term, but long term it may be better to help oust him. Quien sabe?
What happened to the communists who used to come here to brag about Chavez? It’s incredible to see that EVERY TIME communists take over a country they abuse human rights, murder a bunch of people, cause famines and a massive exodus, and yet we still see Marxists babbling on about their utopia? Why are they allowed to take over and destroy country after country? And what about stupid or inmoral politicians who openly applaud this genocide? Why do people like Sanders and Lopez Obrador have followers? Why did Obama go to Cuba to hobnob with these mass murdering maniacs? What’s wrong with the world that this happens over and over?
Hey, peak oil has arrived in Asia. Those damn fools who said peak oil was decades away just had their head up their ass. We are now on the bumpy plateau. There may be some uptics from here on out but there will likely be more downticks than upticks. End of story.
Asia Set To Lose 3 Million Bpd Of Oil Production
Oil production in Southeast Asia and East Asia will decline by 20 percent between 2017 and 2025, according to a new report from Rystad Energy.
Natural depletion from mature oil fields will significantly erode oil production in the region, and new projects will not be able to makeup for the decline. Rystad Energy expects total oil production in Southeast Asia and East Asia to decline to 10.4 million barrels of oil equivalent per day (boe/d) by 2025, down from 13.1 million boe/d in 2017.
Oil production from China, Rystad Energy predicts, will decline by the least, “supported by the stable output from the giant Changqing field and several ramping up projects, including Longmaxi Shale.” The predications show the Changqing field contributing more than 1 million boe/d over the next five years.
But production in Southeast Asia doesn’t fare as well, with output dropping sharply. Rystad cited the example of the ExxonMobil led Banyu Urip project in Indonesia and Shell’s deepwater project Gumusut-Kakap in Malaysia, both of which to peak and decline over the forecast period.
Underpinning the decline in output from mature fields is the dwindling volume of new oil and gas discovered over the past decade and a half. In fact, since the broader oil market downturn began in 2014, discoveries in East and Southeast Asia have plunged. In 2017, the worst year for discoveries, only about 300 million boe in reserves were discovered, down from over 4 billion boe in 2012 and 6.5 billion boe in 2000. Fewer discoveries will mean fewer and fewer new sources of supply coming online in the years ahead.
More importantly, even the limited volume of oil that was discovered recently may not necessarily translate into production. “Most of the recent key discoveries,” Rystad said in its report, “are still unsanctioned.”
Yeah, decline curves are a bitch. To top it off, there are far too many grasshoppers, and not enough squirrels. Winters coming.
I think China will go down faster than shown there.
TechnipFMC Cut 3,000 Jobs in Recent Months
https://www.oilandgaspeople.com/news/16171/technipfmc-cut-3000-jobs-in-recent-months/
How much longer can the industry cheerleaders keep pretending that the offshore turndown is solely due to the price, and is bound to turn around, and not partly that we are running out of prospects. The really front end technology companies for deep water drilling and subsea equipment are the ones suffering the most and I think because they expanded assuming the trend would just keep continuing into deeper water, whereas in fact it just stops when you run out of suitable sedimentary rock.
The Venezuelan oil industry is on a cliff’s edge. Trump could tip it over.
The Trump administration is threatening to embargo Venezuelan oil, a potentially ruinous blow to the Saudi Arabia of South America. But here in the home of the world’s largest crude reserves, Venezuela is killing its largest industry all on its own.
Speculators once joked that all it took to strike oil on the vast plains of eastern Venezuela was a guy with a shovel. These days, the socialist government cannot seem to make the industry work. This vast extraction site near the eastern town of Punta de Mata, which once churned out 400,000 barrels of oil a day, is a tableau of hungry, idle workers and broken rigs.
The site about 280 miles east of Caracas, the capital, has been partly paralyzed since last summer. Of its 30 drills, only six work, in large part because of a lack of maintenance and spare parts. With time on their hands, many oil workers are functioning as security guards.
And with good reason. In decline for the better part of 15 years, Venezuela’s oil industry has entered a free fall in recent months, contributing to the nation’s economic and social chaos. The crude-heavy countryside is a lawless, bandit-ridden land. Three hours south of this industrial town, a gang of thieves recently raided another drilling site run by PDVSA, the state-owned oil giant. They tied up work crews and stole their cellphones before swiping air conditioners and kitchen appliances from company trailers.
There is a lot more to this article. The rest is a testament to the total incompetence of the Venezuelan government. They have a military general, with no experience in industry or oil, running the oil company. These guys are bigger fools than Trump. And you have to be a really big fool to be a bigger fool than Trump.
Gee, I dunno, he’s kinda inspirational. Everytime one of his tweets comes to press, I keep trying to make extra lyrics to Pink Floyd’s “The Wall”.
UK December crude oil production was down -232 kb/day month/month (Official figures released Feb 22nd)
Average production for 2017 was down -2.6% from the average in 2016. Without the Forties outage, if you ignore December 2017 and just take the average of the other 11 months, then production was almost flat y/y.
2017-12-11 Forties Pipeline closed over 400 kb/day
Chart on Twitter https://pbs.twimg.com/media/DW93p4LW0AITiUE.jpg
I’m only really posting this because I just happened to be looking at it
Table 3.11 Highlights – crude stocks held at refineries and offshore were drawn down to meet demand following closure of the Forties Pipeline for maintenance in December 2017. These stocks were drawn down -2.7 million barrels month/month or -87 kb/day
It’s going to go up this year though: Stella, Flyndre, Callater, Shaw, Kraken, Cayley, Schiehallion,
Kraken North, Arundel, Loyal, Edradour, Glenlivet,Cawdor, Barra, Harris, Catcher, Varadero, Burgman, Clair Ridge, Mariner, Harrier – all fields starting up this year or last, I think about 300 kbpd new, but this year will be the last peak. The FIDs due for this year are pretty small and more gas than oil, plus Penguins which is a redevelopment is the biggest, and at some point soon Buzzard and Golden Eagle are going to crash
George Kaplan, thank you ever so for you post.Much thanks again.
Thanks.
SHELL LNG OUTLOOK 2018
https://www.shell.com/energy-and-innovation/natural-gas/liquefied-natural-gas-lng/lng-outlook/_jcr_content/par/textimage_864093748.stream/1519645795451/d44f97c4d4c4b8542875204a19c0b21297786b22a900ef8c644d07d74a2f6eae/shell-lng-outlook-2018-presentation-slides.pdf
I don’t know if they’ve done one of these before, but it’s quite good, and a sign of the IOCs moving more the gas. There was an LNG boom almost in parallel with the oil one up to 2014. Lot’s of countries looking to it to fill the gap from declining local production (UK) and/or as a cleaner alternative to coal, but there may not be enough, and quite soon. I think if there is a shortage we are likely to see a coal resurgence just as much as new renewables.
Also interesting that it looks to be rapidly moving to a spot price market like oil, rather than long term contracts (that trend might reverse if there’s a shortage though).
Mr. Kaplan
I second the above appreciation for your contributions to this site, a!ong with Dennis’ and Mr. Patterson’s input.
Regarding the shift to gas … that may well be a multi-year long trend for various reasons.
China’s unconventional wells are producing much more than originally anticipated.
Argentina continues to attract international investment along with steady gains in productivity in the Vaca Muerta.
The first 2 UK unconventional wells are scheduled to be fractured shortly and the early descriptions from the operator are quite bullish.
The processing and handling of LNG continues to decrease in price, and the hardware for micro grids is advancing rapidly in efficiency.
As the production of hydrocarbons continues to swing from traditional to unconventional, operational advantages of dealing with gaseous – rather than liquid – product will rise in importance.
At today’s $2.70 HH and $64 WTI, $16 will buy the equivalent heat energy if purchased as gas rather than liquid.
Apples to oranges analogy in many respects, granted.
But the pressure on oil from gas will continue ongoing.
I don’t know what a microgrid is but I’m pretty sure almost all LNG on the market comes from big, high efficiency base load plants built around the biggest gas turbine compressor drives available. The rest of the costs in the supply chain are pretty minor compared to the liquifaction.
The micro grids are part of the so-called distributed demand sub industry whereby complexes such as college campuses, government buildings, entire cities (Denton, Tx for one) set up a quasi independent electricity and heat plant for immediate needs.
The term co-generation used to describe this, but CHP (Combined Heat and Power) is now the commonly used terminology.
Most hardware is gas fueled with various configurations to capture and transmit the heat.
Islands, remote areas and entities striving to distance themselves from centrally transmitted power are prime customers.
The tie in with LNG is the spreading adoption of natgas as a viable fuel due to the decreasing costs of production and handling.
Golnar’s ongoing efforts at making ships economical liquification plants will accelerate this transition.
As an aside, Australia – on track to be the global leader in LNG production, is now said to be considering a second LNG import plant.
This should signal the challenges the Aussies are facing with the myriad players in their domestic energy markets.
Yoy seem to be indicating the likelihood of LNG demand increasing more than Shell predict – but please confirm. But Shell are indicating a growing shortage from 2019, so where is the extra supply going to come from. LNG plants are multi-billion – $10 to $50 billion. Even the biggest IOCs have trouble with the financing and risk, they need input from the buyers, outside financing (World bank used to do something on this but may have stopped now), sometimes the local government. They also take many years, a lot of which is regulatory approval, and if a lot get going at the same time (it’s always boom or bust just like oil) there can be really big cost escalation and schedule delays.
One thing that surprised me on the graph is the decline rate, I didn’t think it would be that fast as most projects are built with 15 to 20 year plateaus and, unlike oil, there isn’t much chance or advantage to accelerate production above nameplate in the early years.
Hi George
I hope you find this as amusing as I did.
http://www.worldoil.com/news/2018/2/26/uk-set-to-become-net-crude-oil-exporter?platform=hootsuite
Thanks – it is funny. Bloomberg is getting worse – do you think it is a bot gone rogue, or a junior with nothing much to do? And WorldOil seems to have nothing much to report on any more, like a lot of the oil blogs. Who could possibly think UK will join OPEC, apart from the fact we are not going to be a net exporter (we imported 500 kbpd last year). I guess with the refining downgrade we could be exporting crude, but importing more product, that might have been an interesting story to expand on, but it’s only going to be for a few months at most (and I bet there’s no “UK soon to be a an importer again” story when it happens).
I had a look at JODI Data for UK net exports, if anyone is interested.
Combined UK net exports of crude oil + total products
https://pbs.twimg.com/media/DXCyfb2W4AA_XZ7.jpg
(On the chart published with the original Bloomberg article it looks like the axis is labelled incorrectly)
Mr. Kaplan
In August, 2012, the first shipment of pre fabbed, modular components for one of the Gladstone LNG projects was delivered to Curtis Island.
2 1/2 years later, the first load of LNG was lifted and shipped out.
Although the engineering, regulatory and prep work were several years in the doing, to assemble a massive plant in 30 months is an impressive achievement.
However, the traditionally huge 4/5 mtpa trains are being replaced with smaller (.25/1.4) mtpa units that are quicker, cheaper to assemble and offer more flexibility.
The fact that Tellurian signed an EPC agreement with Bechtel to produce over 27 mtpa for $15.6 billion is a huge game changer in the LNG world.
I believe the chances are high that LNG demand and production will increase in 5 or 6 years time.
The amount of associated gas coming out of Oklahoma and Texas combined with Haynesville and Appalachian Basin production should provide economical supply for the foreseeable future.
To assemble and start a plant in 30 months – I don’t think particularly impressive actually, having done similar things in my working life. The whole idea of pre-fab is to cut this phase down as short as possible so there is not a large construction crew kept around on site for a long time. I see no evidence the big trains are being replaced, just that some smaller fields are getting developed, which couldn’t support the big trains. Flexibility is far less of an issue than effiiciency for most LNG – the feed is known and stable over many years, it’s not like an oil plant.
Some time ago came across a quoted loss per day to thermal effects in storage. Something like 1%.
Seemed surprising, but those big LNG carriers don’t take their time going places.
It all get’s reliquified, which takes a bit of energy (maybe 8% of the gas evolved) or used for fuel on the tankers. I think 1% per day is high though more like .02 to 0.1% and that includes loading which is the biggest hit during trasport.
It’s my understanding that LNG carriers run their engines on the gas that boils off because it’s impossible to insulate the tanks well enough to prevent losing some gas.
So they might as well run as fast as they can, if this is correct, rather than just vent or flare the otherwise wasted gas.
And of course anybody in the shipping business likes to turn his equipment around for another trip in the least practical amount of time.
Just the carry ( interest on the money ) value on a tanker load must run into enough bucks to matter.
Some do, it’s not great fuel because it contains a lot of nitrogen, and there are issues with flexibility (what do you do for the return journey – you have to leave enough heel to keep the tanks cool after whatever’s been used for the journey etc. so you need a back up anyway – are the opex savings worth the capital?). Most have small refrigeration plants which reliquify the gas. You get much more gas coming off during loading when the ship is stationary and would otherwise be wasted.
EIA Monthly Energy Review: World crude oil production
November World crude oil production is up +664 kb/d month/month
(I guess that you know the increase is due to the USA & Canada)
Average production in 2017 (11 months) is up +288 kb/d from 2016 (full year)
https://www.eia.gov/totalenergy/data/monthly/index.php
I don’t know how much spare rail capacity there is to take the increase in production
U.S. Receipts by Rail from Canada of Crude Oil
November 143 kb/day
Record high was 200 kb/day February 2017
https://www.eia.gov/dnav/pet/PET_MOVE_RAILNA_A_EPC0_RAIL_MBBL_M.htm
I guess Euan Mearns was far ahead of me, and technically way above me, but we wind up at approximately the same point. He has stock draws occurring at the rate of close to 2.5 million barrels a day by that last quarter of 2018. Plus, he has OECD begging OPEC to bring up more oil due to price escalations. As it is debatable whether OPEC could do that, even if it could, 2019 will widen the gap further.
http://euanmearns.com/oil-price-scenario-for-2018/
There are some starting to predict a Permian peak beginning in 2021. Up until that time, it will only partially offset declines. Looks bleak for later, with no new significant discoveries. Hence, Ron’s call of peak looks justified. Nice Russian chess game, too. They wind up with Iran and Saudis Arabia in the back pocket, and a huge expanse of land to develop very expensive oil.
Euan is way above me, and so is George. Thanks again for the posts and all the info in the discussions, George.
I know a bit about some stuff, not much about a lot – just like most people, I think the mix of perspectives here is pretty good and I get something new most days (if only amusement sometimes). I just can’t stand the ones unwilling to admit they might be wrong, or not have the full picture or whose every argument is basically from emotion rather than facts (more of those on the other thread though, and mostly drive-bys).
On the Russia thing – I think one aspects that needs to be added to all considerations is that Putin is trying to find a way out while hanging on to his life and most of his fortune, historically that has proved very difficult for someone who has been in his position; his decisions are now even less for the good of Russia or even his cadre of oligarchs, but more only about him.
Putin will probably fare health and security wise, better than those who choose to run against him?
Putin put things back together after the idiots ( Boris Yeltsin’s western ‘Advisors”) were finally forced out.
It has been impressive, and popular, but a bit heavy handed.
I would be cautious, as Russia does seem to be holding the trump cards, and getting little help from the outside world.
Its agricultural production has risen 600%, and while hydrocarbons still dominate, ag is second.
Anyway, enough from someone with a degree in Russian History.
Thanks Guym,
I agree Euan’s post is a good one.
For those who don’t click the link, his forecast for Brent is $80/b or more in Dec 2018.
Euan’s forecast seems very reasonable, I think $90+/-10 per barrel in Dec 2018 for Brent crude.
Dennis
Euan is well informed and may very well be right with price.
At the moment anything could happen, I think the US oil production will be towards the upper end of predictions for this year and next.
https://www.marketwatch.com/story/us-set-to-become-worlds-largest-oil-producer-as-early-as-2018-iea-says-2018-02-27
The US is just about breaking it’s 1970 all time high. Who would have thought it 10 years ago.
Russia and OPEC may cut production again if US production does start to bring prices down. Who knows.
Venezuela production collapse is far more likely than at any time in the last couple of decades.
https://oilprice.com/Energy/Crude-Oil/Venezuelan-Oil-Production-Could-Further-Collapse-On-New-US-Sanctions.html
How much is China filling up strategic reserves, and when will they be filled?
https://www.reuters.com/article/china-crude-reserves/update-2-china-accelerates-stockpiling-of-state-oil-reserves-over-2016-17-idUSL4N1OT2HF
The uncertainties appear more extreme than ever
Peter,
I agree with Euan’s estimate that output of World C+C is likely to be similar in 2018 to the output level in 2017. In 2017 World crude stocks fell by a level that suggests demand was greater than supply by approximately 500 kb/d. So in 2017 supply was already short of demand by 500 kb/d, demand is expected to increase further by about 1200 kb/d in 2018, so if Euan’s estimate is correct and these demand estimates are also correct then supply would be short by about 1700 kb/d in 2018. Now perhaps Euan has underestimated the increase in US output by 400 kb/d (his estimate is 700 kb/d, similar to my estimate, but perhaps it will be 1100 kb/d of LTO output increase). That scenario still leaves us 1300 kb/d short.
It is possible that there is another 1300 kb/d of increases from somewhere (perhaps OPEC and Russia), but whether OPEC and Russia will wait for higher oil prices and what they consider and ideal price level is not known.
I speculate that they will wait for $90/b or more before opening up the taps (if indeed there is anything behind those “taps”, also unknown).
Recommend you guys have a look at General Electric’s announced restatement of earnings. The change will add up to hundreds of millions and more likely over a billion dollars declared as earnings that were not.
Keep this in mind when we look at shale companies. Even complete compliance with the SEC rules can still result in The Bluest of Blue Chips informing the public that they don’t have a billion dollars that they claimed to have. Each of the last two yrs.
And guess what, guys. Nobody’s going to go to jail. None of the shale CEO’s will go, either.
Latest update from Art Berman on oil inventories http://www.artberman.com/oil-price-crossroad/. I don’t agree on all of his TA-finance stuff but I like his inventory charts. It’s worth to skim through some of the comments too. Bottom line: comparative inventories (history) is in balance, number of days covered by inventory (future) is in balance, and “the market” expects a lower equilibrium price than before the price collapse in 2014 – room for a surprise?
Big room for a surprise, as in Euan Mearns article above.
I think Art is closer to what is going to happen with prices, at least within the first half of this year. He is right, the E&Ps are responsible for this idiocy. Statements like we can be profitable at $20, 40, or 50 oil, is the exact reason for price complacency. Stupid comments. The other major reason for price complacency is from what IEA and EIA are predicting for supply/demand balance. Art points out their error. From all of this the oil market is going to be reluctant, and very slow to react to reality. IEA has been long known for its sluggish ability to react to reality. EIA and IEA will both be singing the Permian song until people start buying earplugs to shut out the noise.
But, I really don’t know for sure when the change will really occur. Spot prices should give a clue to when the real players are tired of the same old songs, and are having competition with the same barrels. I just believe both Art and Euan are right, eventually. Art points out a lot of problems, and Euan quantifies them.
Understanding the drop in inventories will take a while for analysts. Just looking at US numbers, it does not look like much. Significant, but not earth shattering. Looking at OECD numbers it is more. The level of inventory hides the fact that Europe must have dropped, because US is included. When I look at some of estimates by some of world inventories, it could be implied that supply was under demand by closer to one million barrels, at least towards the end of the year.
MEXICO CITY, Feb 26 (Reuters) – Mexican state-owned oil company Pemex reported a nearly $18 billion fourth-quarter loss on Monday after both crude output and processing slid, though the company said refining levels should rebound as major maintenance plans are completed.
https://www.reuters.com/article/mexico-pemex/update-1-mexicos-pemex-posts-nearly-18-bln-4th-qtr-loss-as-output-refining-dip-idUSL2N1QG0ZP
They always lose money, I don’t know how it is really organised as a company, they have to pay big royalties/tax no matter what the oil price and then somehow get just enough back so they can keep operating.
Maybe they should do with GE does. Declare a profit and then restate it down a billion dollars per year later.
But I guess that option is not available in Mexico, because their regulations are so inferior.
Rystad Energy’s Artem Abramov sees US production surpassing 11Mb/d in Q4 2018, 12.5Mb/d in Q4 2019 (if WTI holds above $60). Output to avg 100,000 b/d monthly growth “There are so many downside risks which have to materialize simultaneously for this not to happen,” he tells CSIS Energy Program
chart https://pbs.twimg.com/media/DXDJFGNXUAEXpIg.jpg
https://twitter.com/CSISEnergy
Wood Mackenzie – Iraq has the second biggest oil growth profile after the US.
Chart on Twitter: https://pbs.twimg.com/media/DW9ZkXUXUAA10-4.jpg
https://twitter.com/Woodmac_MENA
From Berman.
“The IEA and EIA have promoted widespread belief that U.S. tight oil production will surge in 2018 and 2019. Producers and analysts claim that efficiency and technology have lowered break-even prices substantially below current benchmark levels. The market may have decided to believe those narratives.
If higher oil prices are what producers want and need, they should be careful about what they ask investors to believe. The market is rarely generous.”
Couldn’t the tightness of frac sand become an issue? All these super wells need more and more of it so price is up and away – especially for Northern White.
Shipments were behind about two weeks, because of bad weather first of the year. Articles posted above. Not supposed to be a long term issue, and local sand will be more available later in the year.
The biggest issue will be gas takeaways. Need more lines.
An article about well costs in Oklahoma although this data is from 3Q 2017, it’s not the more recent sand logistics…
Rystad Energy – Average drilling and completion costs per well reached a low point in third quarter 2016 and have since increased gradually by 13% in SCOOP and 25% in STACK for wells completed during third quarter 2017
https://www.rystadenergy.com/newsevents/news/newsletters/UsArchive/shale-newsletter-february-2018/
EOG Resources 2018 target for oil production growth: +16 to 20%
Average rigs in 2018 at 39 (compared with average 2017 at 26)
https://pbs.twimg.com/media/DXE2pKjX0AE3cFI.jpg
So eog made 2.5 billionion dollar profit in 2017. 2.2 billion due to taxbreak and 0.25 due to asset sales… yet the headlines read different
Yes, but they and most of the others shalers stock prices aren’t doing so great, despite WTI holding in the $55-65 range.
Market seemed disappointed that EOG is going to spend another $1.1 billion in CAPEX over what they spent in 2017.
I am just hoping (praying) that US over production doesn’t drop WTI below $55. For the first time since mid-2014 (before the price started dropping like a rock) we are having some fun in th oil patch. Ironic considering we operate in such a old, tired field.
I think investors have finally hit on what us stripper people have been saying, shale isn’t ever going to make money. There is no “cash in” phase, where you just operate the wells, do a little infill drilling, and generate a lot of income. All income will always be gobbled up with new wells. When prices go up, service costs go up too, and the magical KSA like costs (which never existed anyway, despite what PXD management was trying to sell) suddenly go back to 2014 levels, or higher.
In the end, there will be several hundred thousand stripper wells with 1-2 mile laterals and 15-20,000’+ TD. Those will need sky high oil prices to work, much higher that what Mike and us are operating.
Our stuff hasn’t been “low cost” since the first floods were started right after WW2. It appears it might be low cost just around the corner?
On another note, a whole bunch of oil weighted upstream publicly traded MLP’s were created 2005-2007. I think about every single one went BK during the 2015-17 downturn. Just three years and they almost all went bust. Not on shale, but on low decline conventional onshore.
These companies operated stuff like we and all our neighbors operate. In fact, I would love to own some of the production they owned. Yet they all went broke, except for a couple that are hanging on by a thread.
Oil is now $60+ WTI, the price that oil was when these companies were formed. But they couldn’t last 3 years of hard times.
I know some of our neighbors are still hurting, but no one has BK yet.
So what happened? Why did all these MLP’s go bust? I have my opinions.
Finally, look at the share prices of Range Resources and Southwestern Energy.
Doesn’t matter how awesome your wells are if the gas price stinks.
All these super long laterals snaking all over the place reminds me of a house of cards built upside down. How would a significant earthquake affect all these pipes deep underground, centered somewhere in West Texas? Any guesses?
I’ve read how in OK fracking has lead to a dramatic increase in earthquakes, and that area is not as vulnerable as West Texas I don’t believe.
Reduce well costs by 5% – good luck getting a service company lowering the prices in the middle of a boom.
They will be lucky if they only have 5-10% increased costs.
George Kaplan, thanks so much for the post.Much thanks again. Really Cool.
Russia back to growth, of a kind
Petroleum supplies to the international market should rise in 2018
We expect further production growth from Russia’s oil sector in 2018. Despite the oil price, which remains relatively low, technological and financial sanctions against Russia, which were strengthened in 2017, and the deal with Opec to cut production, which curbed Russian supply last year, 2018 will bring more oil. It will be the resumption of the trend. Between 2012 and 2016, Russian oil output rose by 6%, from 10.4m barrels a day to 11m b/d. And according to our estimates, in 2018 the number should increase to around 11.4m b/d. It’s not all straightforward, because the producing profile has been changing over recent years. Oil production in older fields, the brownfields, fell by 5% (or 4…
Sorry, most of this article is behind a paywall, but the teaser should interest some here.
http://www.petroleum-economist.com/articles/markets/outlook/2018/russia-back-to-growth-of-a-kind
Reuters – OPEC February oil output falls (70 kb/day) as UAE over-delivers on cut – survey
UAE output has fallen by 50 kb/day to below its OPEC target, sources in the survey said, reflecting an effort to step up compliance and planned oilfield maintenance.
https://af.reuters.com/article/algeriaNews/idAFL8N1QI6ED
Chart https://pbs.twimg.com/media/DXIredHX0AA2zmO.jpg
US December crude production down -108 kb/day to 9.949 million b/day from 10.057 million b/day in November (November was initially reported at 10.038 million b/day)
US crude production m/m changes:
Gulf of Mexico -131 kbpd
North Dakota -15 kbpd
California -13 kbpd
Colorado +14 kbpd
New Mexico +26 kbpd
Texas +36 kbpd
GOM – 131 kbpd??
Whats up there, maintainance? Or are these prelimitary numbers where some produceres haven’t reported yet.
At least Texas is growing – but still not the 100kbpd monthly growth that are promised.
Another thing – when Venezuela goes down completely due to civil unrest, this will tap out OPEC spare capacity completely. The current drawdown was buffered by Nigeria and Lybia – both a little bit unstable still.
These are the monthly 914-Survey numbers (not the weekly ones)
EIA page: https://www.eia.gov/petroleum/production/#oil-tab
I’m not sure why GoM is off -131 kb/day for December, there was a fire in November that shut in some production into December?
2017-11-15 72,506 barrels/day Crude Oil Production Shut In Across 4 GoM Platforms Following Enchilada Fire BSEE
Dennis, were playing horseshoes, now. My prediction for Texas in the email I sent you predicted 1940kbd to 1946kbd, EIA has 1933. 10k is not off, it’s a ringer.
EIA make estimates to cover missing data. BOEM lease numbers will be out tomorrow, I’d guess one of the big platforms has been offline, probably for planned maintenance as there’s been no news of any incidents. The Enchilada shutdown was early November and took out 75 kbpd, and is still not fully back, so there’s something else going on.
Tahiti and Caesar/Tonga are down 110 combined. They are in the same lease but with different production platforms so could be a pipeline issue, Genesis also had a big drop, don’t know if that is nearby. Enchilada took another 15 compared to November as it was offline for more days, and the rest is normal variance and overall decline on mature fields.
Looks like your 50 estimate started early.
I read the BOEM report Dec 2017, and while they paint a rosey picture, it nowhere gets near EIA estimates. I imagine it is tough to get budget increases, if you say it will decrease.
US weekly ending stocks February 23rd
Crude oil up approx +3 million barrels
Oil products up +3
Overall total, up +6 (shown on bar chart)
Natural Gas: Propane & NGPLs down -2.4
https://pbs.twimg.com/media/DXJSgGaWsAA9Ich.jpg
https://pbs.twimg.com/media/DXJTYeGW4AYz5g5.jpg
gasoline https://pbs.twimg.com/media/DXJUM1iWkAIq0X-.jpg
https://oilprice.com/Latest-Energy-News/World-News/Exxon-Makes-Seventh-Oil-Discovery-Offshore-Guyana.html
These articles never discuss the time frame of “500k” barrels. As I read it, the most they can bring online by 2020 is 120k bbls a day. Anyone know the time frame?
Liza-1 is 100kbpd which would ramp up through 2021, it’s also coming from SBM who haven’t always had the greatest performance in delivering new projects on schedule and working properly. Liza-2 is going to be pretty big I think, maybe 200 kbpd so would take a few years, even if fast tracked, so maybe 2023. There’s a Liza-3 as well, the other discoveries might be tie backs.
https://www.wsj.com/amp/articles/forecasts-for-oil-prices-rise-for-fifth-straight-month-1519801200
This consensus won’t last too long. We can look again at this in Sept.
For those unaware there are new posts up.
http://peakoilbarrel.com/brazil-and-mexico-2017-summaries/
http://peakoilbarrel.com/open-thread-non-petroleum-march-1-2018/