BP has released its Statistical Review of World Energy 2014. There are a lot of things in this report but I am only posting charts on liquid petroleum only. The BP report includes crude oil and NGLs. Their data does not include ethanol or any type of biofuels or process gain. The report actually has data from 1965 but I started all charts from 1990 in order to highlight more recent production. All data is in kb/d.
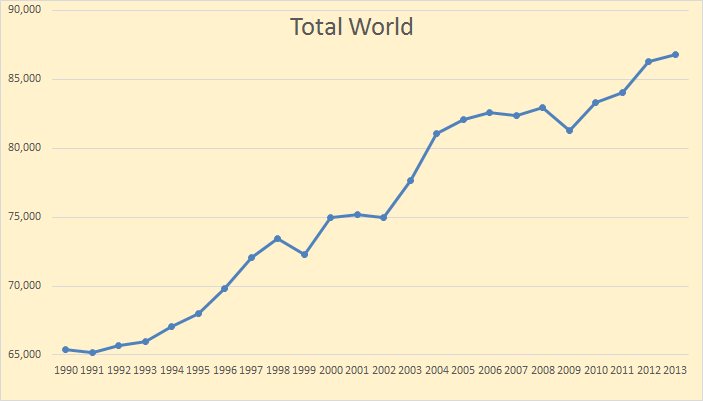
BP has World liquids output up 557 kb/d in 3013.
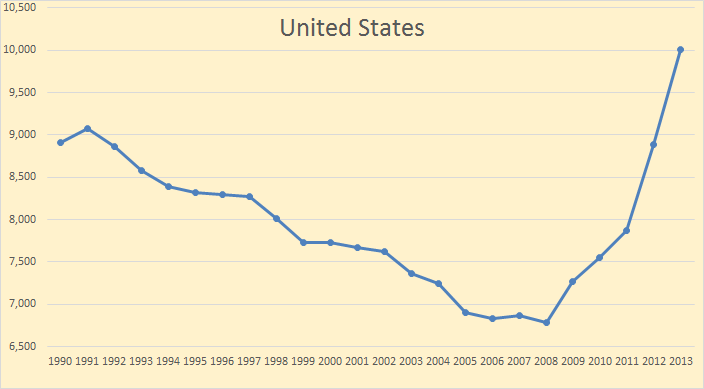
USA liquids were up 1,111 kb/d in 2013.
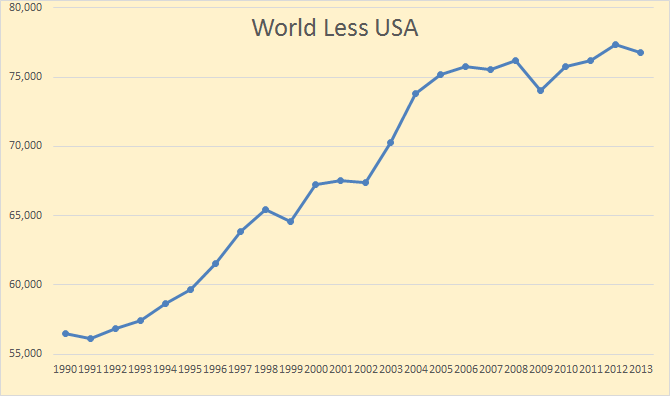
World liquids less USA were down 554 kb/d in 2013.
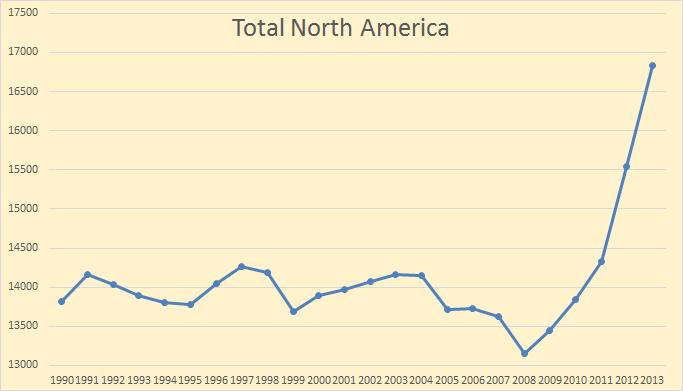
North America is USA, Canada and Mexico. The increase is USA plus Canada minus Mexico and was up 1,283 kb/d in 2012.
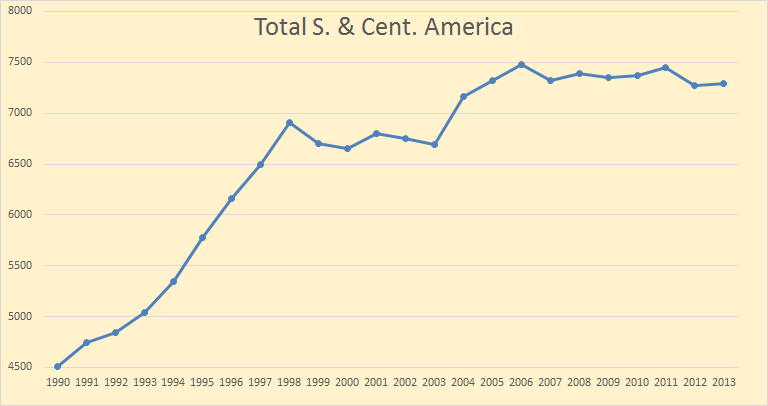
Central and South America was up 19 kb/d but is down 181 kb/d since peaking in 2006.
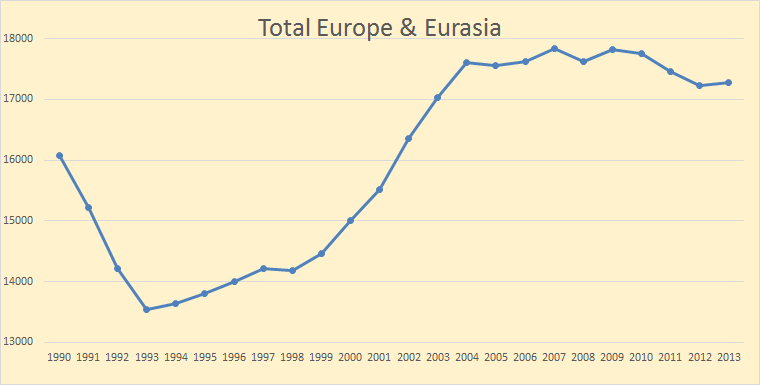
Europe and Eurasia was up 50 kb/d in 2013 but is down 531 kb/d since peaking in 2017.
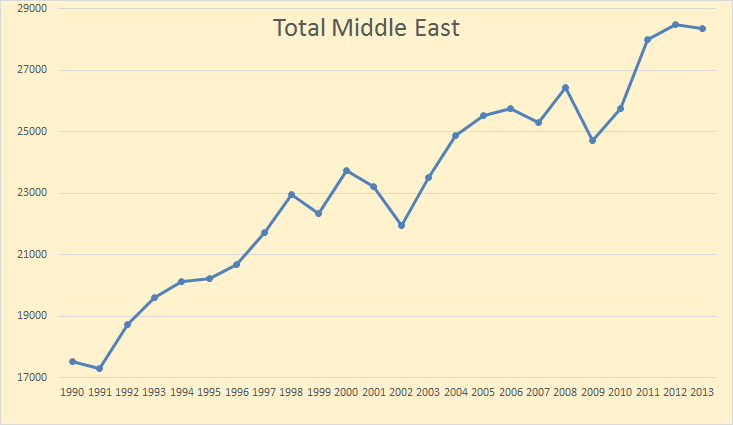
Middle East liquids production was down 126 kb/d in 2013.
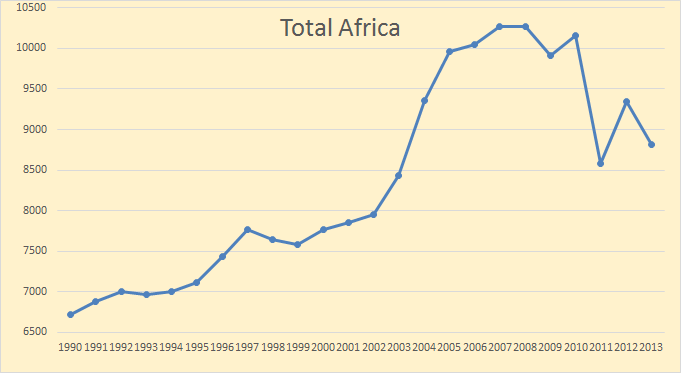
Africa was down 531 kb/d in 2013 and is down 1,457 kb/d since peaking in 2007.
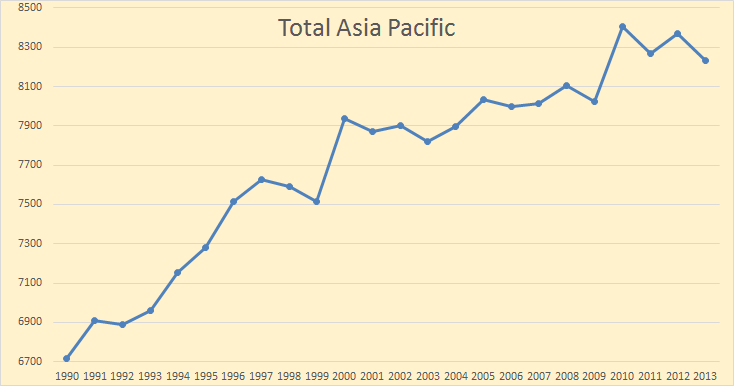
Asia Pacific was down 138 kb/d in 2013 and is down 221 kb/d since the peak in 2010.
Highlights:
World oil production increased by just 560,000 b/d in 2013, less than half the growth of global consumption.
The US (+1.1 million b/d) recorded the largest growth in the world and the largest annual increment in the country’s history for a second consecutive year. The US accounted for nearly all (96%) of the non-OPEC output increase of 1.2 million b/d (the strongest since 2002) to reach a record 50 million b/d. Increases in Canada (+210,000 b/d) and Russia (+150,000 b/d) offset declines in Syria (-120,000 b/d), the UK and Norway (-80,000 b/d each) and Australia (-70,000 b/d). OPEC output fell by 600,000 b/d, the first decline since 2009, driven by a decline of 520,000 b/d in Libya.
90 responses to “BP Statistical Review of World Energy 2014”
My latest post:
15/6/2014
World’s untested assumption on 6 mb/d of Iraqi oil by 2020
http://crudeoilpeak.info/worlds-untested-assumption-on-6-mbd-iraqi-oil-by-2020
BP seems to be showing consumption data for fewer and few countries. In any case, they showed that Libya’s production fell from 1.5 mbpd in 2012 to 1.0 mbpd in 2013. The presumed swing producer, Saudi Arabia, did not offer much help. BP shows Saudi net exports falling from 8.6 mbpd in 2012 to 8.4 mbpd in 2013.
The Saudi ECI Ratio (ratio of production to consumption) fell to 3.7, which falls on the predicted ECI glideslope, based on the 2005 to 2012 rate of decline in the Saudi ECI Ratio:
http://i1095.photobucket.com/albums/i475/westexas/Slide10_zpse47cfe8a.jpg
(EIA data for ECI graph)
If the North Dakota data comes out tomorrow I will have a post with that data a few hours later.
Also, the Texas RRC data is due out this week also. I will have a post with that data also.
The EIA has not updated their “International Energy Statistics” in almost two months. The last time it was updated it was for two months. So I guess they are updating it every two months now instead of every month. Pity.
Ron,
Thanks for the update. I just looked at the 2014 BP Statistical Review and noticed a lot of increases in consumption with very little in the way of increases in production. While overall production did increase, that was mostly due to North America.
Anyhow… Jeffery Brown, it looks like South American and the Middle East Net Oil Exports will continue to decline in 2013. Can you imagine the kind of net oil export declines we will experience by the end of the decade?
Lastly, I wanted to post a link to my article on the GOLD-OIL RATIO:
http://srsroccoreport.com/why-golds-base-price-should-be-north-of-2000/why-golds-base-price-should-be-north-of-2000/
According to past ratios, the price of gold relative to oil is well below its 4 decade average of 18/1. Currently gold is trading at a 11.2 ratio to the price of oil.
While the Central Banks manipulate the paper prices of precious metals LOWER, they continue push up the Stock and Bond markets HIGHER. Of course, this will end badly.
steve
Aside from a correction in the aftermath of Sept. ’08, it would appear that the GOR has oil in a upward trend since 1980 or so…
http://pricedingold.com/charts/Crude-1950.pdf
Needless to say this is WTI and out of date…
Pretty clear to me that gold is deflating against oil while gold becomes commoditized and now trades at close to the cost for marginal new extraction…
For example, today’s close would give 2.84 gr per barrel of Brent….
Flak,
While the charts show that Gold is falling against the price of a barrel of Brent Crude, I don’t see it as deflation, rather I see it as manipulation. I am doing a study-report on U.S. Gold Import-Export-Scrap-Mine Supply & its annual deficit-surplus.
One of the data points I am trying to uncover is the 199 million oz of gold held at the New York Fed which 95-98% is foreign owned stock. I believe a large percentage ot of this gold has been leased and over-subscribed into the market over the past 15+ years… thus adding more fictitious supply which depresses the price.
Thus the value of gold is not DEFLATING per say, rather its being kept artificially low s0 the rest of the world is DELUDED into believing (the abortion called) the U.S. Dollar is still worthy of owning.
steve
As I said, deflating against oil, the real alpha asset…
And your data is even more suggestive of that conclusion…
Based on the historic (1950 to present) GOR ratio, the most you could say gold should be is about 2.5 gr per barrel or $1400, i.e. ~10% higher…
And your data is clearly at odds with the Federal Reserve data set. Pre-BW II, a ratio of 2.6 gr/barrel would give 11.8 barrels per oz, not 20 as you claim….
Moreover, the period over which oil and gold were freely traded starts with the introduction of NYMEX crude futures in the early 80s and using that as a starting point clearly indicates that oil has been slowly deflating against gold…
Flak,
So how did the Gold/Oil ratio increase in the 1981-2000 period at 19/1 compared to 16/1 during the 1971-1980 period?
steve
Flak,
Here is the `1981-2000 chart which shows a two decade increase in the Gold/Oil Ratio to 19/1.
steve
This figure based on the London fix and monthly data from the Fed begs to differ:
http://pricedingold.com/charts/Crude-1950.pdf
From the EIA the average WTI spot price in 1998 was $14.42
http://www.eia.gov/dnav/pet/hist/LeafHandler.ashx?n=pet&s=rwtc&f=a
That is clearly more expensive than your plot shows..
Here
for pre NYMEX data
http://research.stlouisfed.org/fred2/series/OILPRICE
Here is the London fix
http://research.stlouisfed.org/fred2/series/GOLDPMGBD228NLBM
Flax,
I reached the same conclusion, I too went to the St Louis Fed site.
Maybe we ought to suggest to Ron that he make this subject of a future post.
L
Flak,
Sorry, I see the mix-up. Here are the DATA POINTS that I used to determine my annual average price for oil.
1) 1861-1944 = WTI Crude
2) 1945-1984 = Arabian Light
3) 1985-2013 = Brent Crude
I don’t go by WTI 1998 price for crude because it doesn’t reflect the true global spot price for oil. If I am going to compare the price of gold with oil, one must use the global benchmark for the period.
For 1998, Brent crude had fallen to $12.72. You can check the oil data prices I used at the link below:
http://chartsbin.com/view/oau
Again, Those different benchmarks indicated more the global average price of oil. Using WTI especially since 2011 doesn’t reflect the true global price.
steve
What I call Global Net Exports of oil (GNE*) were at 44 mbpd in 2012. I’m estimating that GNE were down to around 43 mbpd in 2013. Libya had a big impact, but as noted elsewhere, Saudi Arabia seems to have showed a small decline in net exports.
BP shows that Chindia’s Net Imports (CNI) were up to about 9.4 mbpd, which would put Available Net Exports (ANE) at around 33 to 34 mbpd in 2013, versus 35 mbpd in 2012 and 41 mbpd in 2005.
I suspect that the EIA data base will show that the 2013 value for the GNE/CNI Ratio fell along the projected line, based on the 2005 to 2012 rate of decline in the GNE/CNI Ratio. As I have occasionally opined, the implied rates of depletion in the remaining volume of Global CNE (Cumulative Net Exports) and in Available CNE (Cumulative remaining volume of ANE) are enormous.
*Combined net exports from the top 33 net oil exporters in 2005, total petroleum liquids + other liquids, EIA
Hi Steve,
You need to look at the notes to the spreadsheets.
In the Statistical Review of World Energy, oil production includes C+C+NGL as Ron pointed out in his post.
Oil consumption is more similar to IEA “oil supply” or EIA “all liquids” where along with C+C+NGL, biofuels are added .
From the 2013 oil consumption spreadsheet:
” * Inland demand plus international aviation and marine bunkers and refinery fuel and loss. Consumption of fuel ethanol and biodiesel is also included.”
In the Oil production spreadsheet Oil is defined as:
“* Includes crude oil, shale oil, oil sands and NGLs ( the liquid content of natural gas where this is recovered separately). Excludes liquid fuels from other sources such as biomass and coal derivatives.”
Due to the different definitions (along with stock changes), we would not expect the production and consumption numbers to match.
Dennis,
Thanks for the added info. However, I don’t believe it really changes the overall NET OIL EXPORT figure all the much. Basically, we are seeing more domestic consumption from these exporting nations while overall production stays flat or declines.
Sure, we can split hairs on some of the details, but I would imagine the overall net export figure will continue to decline.
steve
At the nitty gritty level of consumption versus production can anybody say whether stocks of crude are being drawn down significantly on a world wide basis?
China is building its strategic reserve , I read a figure of 1.2Mbpd, so I suspect that alone would offset falls in commercial oil stocks in the West.
Steve-
It’s not manipulation, per se. It’s that physical demand has finally broken western gold derivative markets.
The “price of gold” you quote is the price of a western derivative which can be created in infinite amounts by bullion banks backstopped by the Fed with dollars, and is in fact already levered 100-to-1.
The value of western derivative gold should be $0.
The new BP review is out. What a disappointment. Look at this picture. I opened two windows. The top layer is the 2013 review, the bottom layer is the new 2014 review, so the columns are shifted one year ahead for reasons of easy comparison. It’s about natural gas production. I laid the United Kingdom-numbers right on top of each other. See what happened? The UK just shifted the data 3 years ahead!! They didn’t even bother to cover this fraud up properly. They used exactly the same numbers. They just turned the clock of their decline three years back.
UK natural gas production in 2013 was 38.4 bcm: https://www.gov.uk/government/uploads/system/uploads/attachment_data/file/314869/et4_2.xls
Verwimp – L. F. Buz Ivanhoe on BP statistical methods 1996. Fraud, laziness or what?http://hubbert.mines.edu/news/Ivanhoe_96-1.pdf
Robert,
This is an excellent link, Thanks.
Wow, this is truly amazing, did you send them an email ?
(still think it could be an unintentional error)
Kam has this right. The only difference I get is that there are several different conversion factors from GWh to BCM(billions of Cubic meters), I used the BP conversion factor of 11,630 GWh per billion cubic meters of natural gas, but there are several see http://en.wikipedia.org/wiki/Billion_cubic_metres_of_natural_gas
Using the BP conversion factor and the Energy Trends Table 4.2 spreadsheet that Kam gives the link to above, 2013 gross production was 36.47 BCM (424,153 GWh).
Chart below for Gross and net natural gas production from 2000 to 2013.
@Verwimp
Good eye.
Since there are no (zero) negative consequences for institutional dishonesty and cheating anymore why bother putting any effort into it.
Ron,
You must getting someones attention, certainly a rash of spam lately and some interesting new followers.
It will fade during the next oil price drop (checking watch for the next SPR release threat).
Mr. Patterson, this seems unnecessarily confusing. Do you mean to say that the charts represent crude plus condensate? Can we not break out crude only from their data? I think you are saying that your new term, “liquid petroleum,” is equal to crude plus condensate. Is that correct?
Insofar as we know, no one tracks actual global crude oil (generally defined as 45 or lower API gravity crude oil).
In my opinion, actual global crude oil production probably peaked in 2005, while global gas production–and associated liquids, condensates and natural gas liquids–have so far continued to increase.
In any case, BP defines oil production as crude oil + condensate + natural gas liquids.
No that is not correct. It is crude plus condensate plus natural gas liquids. The “petroleum” part of it means that it is all fossil fuel. The EIA includes ethanol, palm oil and any other biofuel in their “all liquids”. The BP does not.
It seems to me that without the growth from the USA’s shale “boom” the world’s oil production is somewhere between plateauing and decreasing. Only North American production is increasing significantly and we know that the shale sites will soon fall into decline after reaching a peak.
It will be interesting to watch world events from now on. As production will begin to steadily decrease each government will be looking to secure oil for themselves from sites which can still produce large amounts of oil for a fair few years.
There are phases of reaction:
1) Secure supply so that it will flow — wherever.
2) Deny supply to competing consumers, through use of the military should price not achieve national objectives (i.e., the Chinese outbid the US and create lost elections from discomfort).
3) Suppress competing consumption, using military to achieve rapid enemy population decline, where anyone who is a competing consumer will be defined as enemy via whatever manufactured offense.
Oooh, quirk, if your comment is the last one, a reply doesn’t indent.
Mr. Patterson, thanks for the clarification. I was under the impression that the term “condensate” referred to NGL. Any comment about the BP figures for North American liquid petroleum? Doesn’t it seem to be very high in comparison to EIA and IEA publications? Of course, the recent IEA data for U.S. production, which was purported to come from the EIA, I see was retracted, and the real EIA data substituted, which in itself was contradicted by the EIA’s recent revelation about the Monterey Shale play.
Mr. Brown, I understand your position concerning a crude peak in 2005 ( I have been following the “peak oil” issue for many years) and it seems reasonable looking at the many charts that have been produced showing crude production. Now, here, you say that no one provides crude only production figures globally. That makes me hesitant to draw any conclusions about crude production. Does the EIA not publish crude production data for the U.S.? I thought I had been seeing that data in various places, including here. If that is not the case, then I would say we are really in the dark. I also very much doubt that crude production figures are not known, very precisely, within the petroleum industry. It would be difficult to comprehend just how they could do business otherwise.
Natural gas liquids are not really liquids, at least not at room temperature or sea level pressure. Condensate is a liquid at room temperature and sea level pressure. NGLs are ethane, propane and butane, or what I call bottled gas. Condensate a mixture of mostly pentane but also has some lighter and hydrocarbon strings.
I don’t find BPs North American production figures very different from the EIA or the IEAs. Remember they are measuring different things. BP does not include biofuels in their data and the EIA does. The EIA also measures “Crude+Condensate” while BP and the IEA does not.
No the EIA does not have a “crude only” category. Only OPEC has that and then only for OPEC members. No one tracks crude only for non-OPEC nations.
I think you are mistaken about crude production numbers being known very precisely within the industry. Companies know their own production and no one else’s. They all produce all they can and hope for the best.
Hi Ron,
You are correct that NGL is mostly “bottled gas”, but there is a small component of pentanes in the NGL stream. See
http://www.eia.gov/dnav/pet/pet_pnp_gp_dc_nus_mbblpd_a.htm
The amount of pentanes plus in 2013 was only 13% so ignoring NGL makes perfect sense in my opinion.
Another consideration is that some of the butane is mixed into gasoline and propane substitutes for home heating oil in rural areas that have no access to natural gas pipelines (parts of the northeast and upper Midwest in the US), the ethane component is mostly used for producing plastic and some chemicals and is not really used for energy.
Actually I just looked at some of the refinery numbers and 500 kb/d of NGL are inputs to refineries, in the form of butane, isobutene, and pentanes plus. Not a lot but by comparison renewable liquids (ethanol and biodiesel) are about 900 kb/d. See
http://www.eia.gov/dnav/pet/pet_pnp_inpt_dc_nus_mbblpd_a.htm
The larger problem is that most agencies (both the IEA and the EIA) do not adjust for the lower energy content of NGL relative to C+C, if NGL is discounted by about 70% at least it is then equivalent on an energy basis.
Hi Dennis,
“You are correct that NGL is mostly “bottled gas”, but….” To be frank, I find this a rather condescending introduction to your post. It implies Ron isn’t aware of what follows which I doubt is true. I mostly enjoy your comments but sometimes find the aura of superiority a tad irritating; this is an example.
Some of us have had a career in the petroleum exploration/development business and we all still have a lot to learn but that doesn’t mean we like being talked down to: Info is great, that’s why we’re here, and I’m the first to admit that you make a major contribution but sometimes………….
Doug
My apologies, I did not mean to be condescending.
Ron said,
“NGLs are ethane, propane and butane, or what I call bottled gas.”
As I read the quote above I do not see pentanes plus included.
My understanding is that they are a part of NGL, if that is incorrect I am sorry, along with whatever else you find annoying.
If you would prefer I will not comment at all.
Dennis,
“If you would prefer I will not comment at all.” Please, please, please: That’s not my wish or desire at all. For the most part I love your comments; I have learned a lot from your comments and Ron’s Blog benefits from you comments. OK?
Just one request: Please don’t send me a dictionary definition of TRR because I’ve participated in reservoir calculations on the North Slope, in the North Sea and in China and I really do know what it means (and what it doesn’t mean). [smiling yellow face]
Doug
Hi Doug,
When I talk about TRR it is usually in response to comments which imply that TRR should be ignored entirely. The responses are intended to educate others who may not know as much as you, but I will refrain if you find it as annoying as I find comments to the effect that TRR does not matter at all.
It is correct that TRR matters much less than proved reserves and economically recoverable resources.
I will try not to mention it again and will ignore any future comments about TRR.
Maybe if I say “Hi everyone (except Doug),” if I have anything to say about TRR 🙂
Now that sounds like a compromise. 🙂
My understanding is that they are a part of NGL, if that is incorrect I am sorry, along with whatever else you find annoying.
Yes, technically pentane is definitely a natural gas liquid.
No, pentane is not counted as a natural gas liquid. (Unless it is mixed with lighter hydrocarbon compounds as pressurized gas.)
Pentane, when it is mixed, as it usually is, with heaver hydrocarbon compounds, is called “condensate”.
Bottom line, though pentane is technically a natural gas liquid, the EIA and just about everyone else calls it “condensate” and does not count it as a natural gas liquid.
Edit: The pentane plus means C5+ That is C5 + some C6, C7 and even a little C8 or Octane. They are all mixed when they condense out of natural gas. They are all a liquid at room temperatures and sea level pressure.
I am sorry Dennis, I just assumed you were aware of that fact. Had I known you thought it was counted as a NGL I would have replied to you differently above.
Hi Ron,
I may in fact be confused about this.
I am aware of the various types of C1 through C8 and so forth. You are absolutely correct that condensate is mostly pentane, I think where one of us may be confused (and it is probably me) is on the distinction between “lease condensate” which condenses out of natural gas at the wellhead and “natural gas plant liquids” which are processed at a separate facility where the non-methane parts are removed from the gross natural gas to produce dry natural gas.
Amongst the products of this process are ethane, butane, isobutene, propane, and pentanes plus.
My understanding is that these pentanes are counted as part of the NGL stream (about 13% of it in 2013).
See http://www.eia.gov/dnav/pet/pet_pnp_gp_dc_nus_mbblpd_a.htm
and
http://www.eia.gov/cfapps/ipdbproject/iedindex3.cfm?tid=5&pid=58&aid=1&cid=regions&syid=2009&eyid=2013&unit=TBPD
The numbers for NGL at these two pages are the same which leads me to the conclusion that the pentanes plus (340 kb/d in 2013) are counted as NGL rather than as a part of C+C.
This is indeed confusing. Are there two pentanes, those that condensate out of natural gas and those that are separated at the gas plant?
This is confusing but I am working on another post right now. If you can find anything else on this subject please post it.
Isomers with differing boiling points separating at different stages?
NAOM
I think that the following chart showing normalized values for Global Gas, Global NGL’s and Global C+C (2005 values = 100%) is the key chart.
Global Crude + Condensate (C+C) production increased at about the same rate as global dry processed gas production from 2002 to 2005, but then we saw a significant divergence between the rates of increase in global gas production and global C+C production from 2005 to 2012, 2.8%/year versus 0.4%/year respectively.
My premise is that condensate, a byproduct of natural gas production, continued to increase at about the same rate as the rate of increase in global gas production, and I suspect that rising condensate production accounted for virtually all of the post-2005 increase in Global C+C production.
This is a great plot…
Looks like all the regions are up since 1990-91. The overall rate of rise in production is slightly less than 1 million b/d/year. The conundrum is in cost and quality of the total product accounted. If I recall correctly, 1990,-91 had a price of about $10 per barrel while lately we are hitting roughly $110 per barrel. Excluding inflation, that is 1100 percent rise in cost for the graphed time period for a 33 percent gain in liquid production. At the same time the quality has fallen. More low molecular weight components are being counted as are very high viscosity (tar-like) oils. Sad that we are getting pennies on the dollar for our energy, in less than a quarter of a century.
To compensate for increased cost and lower quality, cars would have to be getting over 60 mpg.
Gasoline was about a one dollar to $1.50 per gallon in the 90’s.
With the increased cost of fuel, insurance, the cars themselves, increased cost of maintenance, tolls, licensing, etc. being exacerbated by a general lowering of wages and buying power; car ownership and use may fall off due to overall economics. “Money talks, nobody walks” doesn’t work when the money is merely mumbling against a rising tide of cost factors.
The sad part is that I observe a lot of people struggling economically. Their general response is to work more and harder to make more money and have less and less or owe more and more. Truly we are re-entering a time where many owe their soul to the “company store”. The “store” now encompasses a larger context, but the same idea is applicable. Life in a giant hamster wheel that needs to turn faster and faster to get the same effect. Not a desirable end nor the much touted progress.
Except US car sales are essentially booming as sub prime lending moved into autos. Check around. You can buy a car for 0.5% interest. If you move around enough, and the subprimes do, you’ll never have it repossessed when you stop payments.
It’s about 30% of all car buys right now, which is the highest % on record.
Why don’t the lenders care? The funds come from asset backed securities. These are the new version of securitized mortgages. You package up lots of car loans and trade them back and forth and with no mark to market in effect, you just keep it going as long as you can (earning a commission for each transaction).
Interesting, so the bankers have just moved their games to another, smaller, neighborhood. So what happens when this bit of snake oil runs out of steam? Is it big enough to have a major impact or will it just be absorbed into that black hole of government debt?
Hi Watcher,
You apparently are rather well informed about some of the ins and out of the banking and finance industries that are not well known to most people.
I would really appreciate knowing where you get most of your info and if it is necessary to have professional training to understand it in the form you access it.It would not do me any good to read highly technical reports published by the fed for instance since I don’t have the necessary background to understand the jargon and technicalities in such reports.
Global Energy Trends – BP Statistical Review 2014
Hi Euan,
As far as the failure to reduce the rate of growth of carbon emissions, I thought your position was that carbon emissions were of little importance. Is that correct?
Dennis, that is in fact untrue. My scepticism is divided into two parts 1) I’m highly critical of climate science and the IPCC and 2) I am actually cautious on emissions longer term and would for example opt for nuclear in Europe rather than allowing shale gas developments to go ahead. I have little time for the hysterics who see a connection between 400 ppm CO2 and near record cold winter conditions in the USA this past winter.
But I can be highly critical of those plugging an energy policy aimed at reducing global CO2 emissions that is clearly not working. What it is doing in Europe and the UK is destroying landscape, pushing up power bills significantly, spreading energy poverty, making industry less competitive and undermining the stability of the grid and the financial position of the grid operators. Its really quite an achievement to have so much negative impact from a policy that has totally failed.
This would work in the UK. Its one of the cheapest and lowest emissions plans that has been published.
Energy Matters’ 2050 pathway for the UK
http://euanmearns.com/energy-matters-2050-pathway-for-the-uk/
Hi Euan,
Thank you for the clarification. My (very possibly) incorrect interpretation of earlier work that you had written was that carbon emissions were not a pressing problem. (Return to Olduvai especially.)
I agree that policies to reduce carbon emissions have failed.
I my opinion there are two problems, climate change due to carbon and other green house gas emissions (which I had the mistaken impression that you thought was not a pressing matter due to your low estimate of equilibrium climate sensitivity, similar to the F17 probability level of AR5, or 1.5C for 2x CO2) and the coming peak in fossil fuels. In my mind the solution to both problems is a transition to non-fossil energy sources.
I do not have a problem with nuclear, though I think the costs may be higher than you imagine, I think a combination of solar (placed appropriately), wind, tidal, geothermal, nuclear, and energy efficiency in whatever combination minimizes costs makes the most sense, with a large dose of HVDC transmission to move power from places where there is excess to where it is needed.
Dennis, I have backed away from the Olduvai constraint on emissions meme. Shale that we didn’t know about back then comes into play – I’ve updated my views. And China still manages to dig more coal.
Virtually all the data I look at suggests that climate sensitivity is 1.5˚C or less. Hence I am cautious on emissions – but I don’t run around trying to undermine the viability of the FF industries upon which our well being depends.
As to working out a solution? How did this work in the past? Here I find myself in a quandary. Markets have served us well. But in the UK most of our legacy generating assets were actually built by The State. Do you think it is possible for a handful of unelected technocrats in Brussels to work out the best configuration for European electricity generation in 2020, 20 years ahead of that date? The cost of nuclear is forced up by the principle of “safe as is reasonably practical” as opposed to as “safe as reasonably required”.
Renewables don’t mix with nuclear and a point that Hansen makes is the renewables route locks us into a FF future. Grid scale, affordable and efficient storage changes everything – but I don’t see it coming.
Hi Euan,
Thanks. When I look at the data and realize that a lot of the heat is being stored in the ocean, I see more like 4 C for equilibrium climate sensitivity. When there is uncertainty ( and I agree that there is a great deal of it in climate science especially on aerosols), it seems wise to err on the side of caution.
On bureaucrats deciding on the energy mix, just raise carbon fees and let the market sort it out if you don’t trust the bureaucrats. The problem with the policy so far is that too many carbon credits were given away.
Energy will have to get more expensive. Nuclear is not the only option, but I don’t think it should be ruled out, that is for individual nations to decide. I like nuclear better than coal and other fossil fuels, but my preference is wind, solar, HVDC transmission, and energy efficiency.
I say we will be lucky to keep it at 4c.
Of course, it will be a moot point at that point.
In the grand scheme human era temperatures are pretty tame.
http://upload.wikimedia.org/wikipedia/commons/5/5f/All_palaeotemps.svg
As the arctic warms plant life will increase consuming more CO2. The Tundra will defrost and grass will start growing again. Ocean plant life will also increase.
Even if we stopped all fossil fuel consumption (never gonna happen!) the Earth will still get much warmer in the future, just not as fast.
Long before we see dramatic CO2 increases we’ll run out of cheap liquid fuels and the global economic will collapse to pre-industrialized levels (before 2040). The biggest threat to the Planet is the 430+ nuclear reactors and there spent fuel pools which is a doomsday machine. Spent fuel pools need constant cooling 7/24/365. If the global grid crashes for more than a week we will set off the doomsday machine as the spent fuel pools start boiling off and start catching fire. Once Liquid fuel shortages begin, nuke plant operators will no longer have the resources needed to properly maintain the plants. Soon or later a tragedy will happen, setting off a cascade events. For instance if the SFP #4 at Fukashima collapsed, it would have rendered most of Japan uninhabitable. Any reactors in the lethal zone could no longer be maintained because anyone in the lethal zone will die. So without manpower on site, the other reactors will also meltdown. This isn’t even considering the chaos when close to 100 Million Japanese would need to flee.
Worry about the raging fire that burning in your backyard (ie the Nuclear Power Doomsday machine) and less about the camp fire that is 2000 miles away (global warming)
Odds also favor WW3, as energy and other strategic resources become difficult and expensive. The precusors to WW1 and WW2 where resources, as industrialized nations competed for resources. Japan use military expansionism to obtain the resources it needs. Europe fought proxy wars in Africa, the Middle East, South America and Asia during the error of Colonialism to obtain resources. This time will not be different. The US attempted to colonize the Middle East (ie Iraq/Afganastan) and initiates proxy wars in the region too. China is in the early stages of Miltary expansionism with it take over of oil/gas resources off the coast of vietnam and the Philipines, and it ongoing dispute with Japan over the senkaku islands. We haven’t even breached Peak Oil yet and they’re beating war drums!
Might want to examine that a bit further, and discard the simple stories and myths:
http://www.news.ucdavis.edu/search/news_detail.lasso?id=9479
cytochromeC Wrote:
“Might want to examine that a bit further, and discard the simple stories and myths: [Link about CO2 harmful to Plants]”
Nonsense!
http://www.omafra.gov.on.ca/english/crops/facts/00-077.htm
“For the majority of greenhouse crops, net photosynthesis increases as CO2 levels increase from 340–1,000 ppm (parts per million). Most crops show that for any given level of photosynthetically active radiation (PAR), increasing the CO2 level to 1,000 ppm will increase the photosynthesis by about 50% over ambient CO2 levels.”
http://www.geocraft.com/WVFossils/Carboniferous_climate.html
“atmospheric concentrations of carbon dioxide (CO2) in the Early Carboniferous Period were approximately 1500 ppm”
“Earth’s atmosphere today contains about 380 ppm CO2 (0.038%). Compared to former geologic times, our present atmosphere, like the Late Carboniferous atmosphere, is CO2- impoverished! In the last 600 million years of Earth’s history only the Carboniferous Period and our present age, the Quaternary Period, have witnessed CO2 levels less than 400 ppm.”
“To the consternation of global warming proponents, the Late Ordovician Period was also an Ice Age while at the same time CO2 concentrations then were nearly 12 times higher than today– 4400 ppm.”
[As the environment changes plant life will adapt to the change and take advantage of it. Worry about the Nuclear Power Plant Doomsday machine, not about global warming!]
Euan,
I am not sure what you mean by “I’m highly critical of climate science and the IPCC”. Even if one chooses to ignore the mountains of evidence for, and very basic physics of global warming, the fact of ocean acidification alone makes the increase in atmospheric CO2 an ecological catastrophe.
http://www.pmel.noaa.gov/co2/story/Ocean+Acidification
Best,
Tom
“I have little time for the hysterics who see a connection between 400 ppm CO2 and near record cold winter conditions in the USA this past winter.”
Air mass usually contained within the Arctic vortex (winds circulating in the Arctic) is randomly spilling into lower latitudes while warmer air (and water) is moving into the Arctic. If the temperature gradient (difference between the Arctic and tropics) was greater than it is now (due to 400 ppm CO2) cold winter Arctic air would remain in the Arctic and not spill down. So yes there is a connection between climate change brought on by higher CO2 emissions and periods of extreme cold in lower latitudes. It’s not hysterics, just good science.
It was cold here in the states no doubt- but I kept some sites marked that reported the weather in Europe and Asia and it was as much warmer in the far north there as it was colder here and over a comparably large territory.
The black box problem is pretty simple. Heat is coming in faster than it is going out and we are adding insulation all the time.We are witnessing the an average increase in open waters formerly ice covered and the greening of the ground farther north and south and earlier than usual which is reducing the reflection of incoming light.
Maybe things will turn out ok but I am putting my money on it getting hotter every year on average from here on out in terms of human time scales. The heat that is being trapped in the upper layers of the oceans is going to find it’s way into the atmosphere at some point.
I don’t mean that I expect average temperature to set a new record every year. I expect each decade taken as a rolling average will be warmer than the previous one in times to come.
The only real possibility that I can see that would prevent this overall warming would be a big average increase in the global cloud cover.I don’t think any body much is predicting this to come to pass- at least not to such an extent it will counteract the greenhouse effect of more water vapor in the atmosphere. Water vapor is a monster of a greenhouse gas.
Mac, this is a good discussion today, but I simply don’t have time to sit here and answer questions all day. I will dip in and out.
In fact most of the cyclical historical variance in temperature can be explained by cyclical variance in cloud cover both at the UK and global scales. I say most, since at both Global and UK scales we had to call upon additional CO2 forcing of temperature to explain all the data. That was at a climate sensitivity level of around 1˚C.
I made the chart myself from Global D2 cloud data downloaded from NASA using software that they provide. If you have never seen a chart like this before, you need to ask why not?
And the links in a separate comment in case they get put into the moderation Q.
The link between sunshine and temperature based on UK climate records since 1933
http://euanmearns.com/?p=730
UK temperatures since 1956 – physical models and interpretation of temperature change
http://euanmearns.com/?p=810
Do clouds control climate?
http://clivebest.com/blog/?p=5694
Mac, on the planet I live on global sea ice anomaly has been largely positive for 18 months or more. What’s more, it is Antarctica that has positive anomalies more than offsetting the negative anomalies in the Arctic. This is important since the Antarctic sea ice lies at lower latitude and will therefore reflect a lot more heat back to space.
The severe Arctic melt backs of 2008 to 2012 appear to be healing. I dare say we may see a new phase of accumulation of multi-year ice.
I don’t recall being told before hand that more CO2 would lead to a meandering Jet Stream that was the principle cause of the cold US winter. It seems to me that every little quirk in the climate is now explained by CO2 and climate science. You may call it good science. I don’t regard it as science at all since this methodology excludes the possibility of natural variance in the climate system. What happened in N America this year has happened many times before.
This paper published by the highly regarded UK MET Hadley centre seeks to explain similar phenomena in Europe by much larger than expected variances in solar spectral output than previously known about.
Solar forcing of winter climate variability in the Northern Hemisphere
Sarah Ineson1*, Adam A. Scaife1, Jeff R. Knight1, James C. Manners1, Nick J. Dunstone1, Lesley J. Gray2 and Joanna D. Haigh3
Nature Geoscince PUBLISHED ONLINE: 9 OCTOBER 2011 | DOI: 10.1038/NGEO1282
Euan,
I don’t have time to reply to your comments right now and I don’t have time to find links to back up my comments but….
“I don’t recall being told before hand that more CO2 would lead to a meandering Jet Stream that was the principle cause of the cold US winter.” But I do, a paper came out a few years ago predicting exactly what we are now seeing. Just because you are not aware of something does not mean it does not exist.
“What’s more, it is Antarctica that has positive anomalies more than offsetting the negative anomalies in the Arctic.” This statement is simply stunning in how you are taking a fact and completely misinterpreting it.
Best,
Tom
So Russia hasn’t peaked?
The BP data is annual data only. It is through 2013. It remains to be seen whether or not they have peaked but they are well below their December 2013 high.
Based on EIA production data* and based on BP consumption data for 2013 (and based on EIA data for prior years), Russia’s net exports have been at or below 7.2 mbpd for 2007 to 2013 inclusive.
Based on the 2007 to 2012 rate of decline in the Russian ECI Ratio (ratio of production to consumption), Russia would be at 3.17 in 2013, which is what the EIA production and BP consumption data show (10.47/3.3).
Based on the decline in the Russian ECI Ratio, I estimate that Russia shipped from 2008 to 2013 inclusive, about 22% of their post-2007 CNE** (Cumulative Net Exports).
*EIA the BP have different production numbers for Russia, and given the declining number of countries that BP tracks for consumption purposes, I have switched to all EIA data, when available.
**Estimated Russian post-2007 CNE are about 68 Gb.
Looking at the North America chart shows close to 17mb/d. The chart says that excludes Mexico.
I was under the impression that Canada’s tar sands were producing between 3.5 and 4 mb/d. If the US is close to 10mb/d where does the extra almost 3.5 mb/d come from?
Canada producing 7mb/d is news to me.
Great site by the way. Cannot believe i only discovered it recently. Missed reading your stuff on theoildrum.
Please keep up the great work.
Tom
Tom, I worded that poorly. I have corrected it I think. I meant North America’s gain was the total gain of the USA and Canada less Mexico’s decline. The totals are Crude + Condensate + NGLs.
The below is each country’s total production in thousand barrels per day, percent change over 2012, their share of total world production and the amount of change in kb/d last year.
kb/d % Change over 2012 % World Total kb/d change in 2013 USA 10,003 13.5% 10.8% 1,111 Canada 3,948 6.0% 4.7% 208 Mexico 2,875 -1.1% 3.4% -36Angola is heading down also:
http://www.macauhub.com.mo/en/2014/05/21/oil-exports-from-angola-fall-again-in-march/
Just putting some flesh on those figures – I realise they are EXPORT rather than total production (which one would assume would be higher).
Back in April last year they were apparently exporting 1.85mbpd
In March of this year that seems to have fallen to the equivalent of 1.47mbpd (if my maths is right)
That is a fall of around 400,000bpd in a year or around 21%.
That seems incredibly steep! I realise it is offshore production and so decline rates like that can happen (and has happened in the North Sea etc) but even so…….
UPDATE 1-BP says operations in Iraq so far unaffected by violence
http://in.reuters.com/article/2014/06/17/iraq-oil-bp-idINL5N0OY1AJ20140617
(Reuters) – BP chief executive Bob Dudley said on Tuesday the oil company’s operations in Iraq were so far unaffected by violence in the country.
“We are just very vigilant in Iraq. Non-essential production people have left but operations continue,” he told reporters on the sidelines of an energy conference in Moscow.
Iraq’s biggest oil refinery shut down, foreign staff evacuated
http://in.reuters.com/article/2014/06/17/uk-iraq-security-oil-idINKBN0ES12120140617
“Iraq’s biggest oil refinery, Baiji, has been shut down and its foreign staff evacuated, refinery officials said on Tuesday, adding that local staff remain in place and the military is still in control of the facility.”
Thousands of Sunni Muslims flock to recruiting centers to fight back ISIL
http://www.islamicinvitationturkey.com/2014/06/17/thousands-of-sunni-muslims-flock-to-recruiting-centers-to-fight-back-isil/
Do the State Department, CIA, or which ever bunch of smart guys currently trying to pull strings really think they can control this?
http://www.theguardian.com/environment/earth-insight/2014/jun/16/blowback-isis-iraq-manufactured-oil-addiction
After the shale boom, even just once it’s clear it’s peaked, this is going to get a whole lot more desperate. Especially as it’s not possible to bomb a place into exporting to you. Is it really so smart to use up hard to reach domestic supply so frantically in order to keep the price down for a bit longer? A bit more sugary jam today, instead of a little more reality in the form of more realistic prices?
Patrick,
Most people look as far ahead as their next paycheck, companies as far ahead as their next quarter and governments as far as their next election: When do you expect it to be different?
From http://english.alarabiya.net/en/News/middle-east/2014/06/17/Maliki-blames-Riyadh-for-rebellion-against-him.html
The Iraqi government of embattled Prime Minister Nuri al-Maliki blamed Saudi Arabia on Tuesday for an expanding armed uprising led by Islamist militants and tribal forces against his rule.
A statement issued by Maliki’s office accused the kingdom of “siding with terrorism,” adding: “We strongly condemn this stance.”
“We hold it (Saudi Arabia) responsible for what these groups are receiving in terms of financial and moral support.”
It continued: “The Saudi government should be held responsible for the dangerous crimes committed by these terrorist groups.”
Canada approves Enbridge pipeline to West Coast
The Canadian government approved the construction of Enbridge Inc’s C$7.9 billion ($7.22 billion) Northern Gateway pipeline on Tuesday, contingent on the company meeting all conditions set out in a report by a regulatory panel.
The federal review panel had urged the government to approve the project, which would link Alberta’s oil sands with a Pacific port, after concluding that it would pose little risk to the environment if the company complied with 209 environmental, technical and social conditions.
“After carefully reviewing the report, the Government accepts the independent Panel’s recommendation to impose 209 conditions on Northern Gateway Pipelines’ proposal,” Canada’s Natural Resources minister Greg Rickford said in a statement.
It’s about twice as far from Fort McMurray Alberta to Houston Texas as it is from Fort McMurray to Kitimat on the BC coast: About 2428 miles (3250 km) to Texas (Road/Air???). In any case, it seems to me like a hell of long way to send a bunch of tar.
That tar has to be pushed up and over a few mountain ranges to get to Kitimat!
II rc the Chinese have indicated their willingness to finance the pipeline and build it too if allowed to do so.
Predicting what the local people along the route will do in the short term is not easy but in the long term unless we allow that tar to transit the US it will find its way to the Pacific. The rest of the people of Canada will find a way to make it happen eventually because that is how politics works.
They will up the ante in goodies for the locals until enough of them are ready to cash in and the rest of them will get shoved aside.
The same thing will happen to the farmers in California. I am not worrying about them because although they are farmers almost all of them are the sort of people who wouldn’t speak to me – they’re mostly multimillionaires.
But all their money is not enough to keep the tens of millions of people short of water from figuring out ways of taking it away from them if the drought hangs on. They will buy the water rights at first and after that they will simply declare an emergency or something of that nature and close one set of valves and gates and open another set.
Ten thousand rich farmers cannot forever stand off ten million or twenty million voters determined to have that water.
A few local people along the proposed pipeline routes will not be able to stop the pipeline forever.
I am in favor of building the Keystone for two reasons. One is that stopping it is not going to keep the tar sands off the world market.
The other is that the environmental issues associated with the pipeline going thru this country are trivial in terms of the geopolitical implications of having it denied. Peak oil is not a joke.
We need to remain on the best possible terms with Canada.At some point in the not so distant future the fecal matter is going to well and truly hit the fan in terms of oil supplies and trade wars and international crises that may extend right up to hot war between major powers and even WWIII.
It will be a lot easier for us, and for Canada, to work together when this scenario comes to pass than it will be if Canada has contracted a huge amount of oil long term to the Chinese and other Asian countries.
Getting a pipeline built to the Pacific will almost certainly involve entering into such long term contracts. Shipping the oil thru the US will remove most of the incentive to contract the sale of it way ahead.
So far as I can see it is not an ” if ” scenario. It is a ” when ‘ scenario.
Now maybe I am a fool and everybody is going to be real nice to everybody els at the national level and there won’t be any more resource wars.I will be more than glad to wear the dunce hat if I am proven wrong.
If Canadian oil diluted with American condensate can’t be exported from an American port due to the export ban on US petroleum exports. Can this same condensate in Canadian oil be exported from from a Canadian port, or will they need to strip the condensate before exporting to China?
Anyone have any ideas?
It is only 687 ft from Dawson Creek to the summit of Pine Pass on the continental divide. That is not much of a mountain range to pass over.
[…] Kopits slides go here. Check out these graphs from the recent BP report, […]
[…] BP Statistical Review of World Energy 2014 » Peak Oil … – Peak Oil, BP Statistical Review of World Energy 2014, OPEC, Non-OPEC, Africa, Middle East, Europe, Eurasia, Asia and Pacific, Central and South America… […]