The North Dakota Industrial Commission is out with the Bakken November Production Data and the North Dakota Production Data.
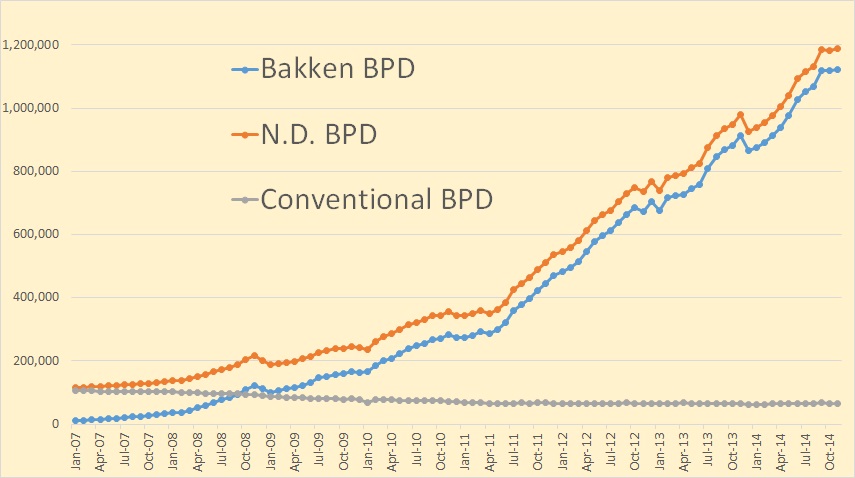
Bakken production was up 5,293 BP/D while total North Dakota was up 3,691 BP/D. Total North Dakota oil production is up 901 barrels per day from two months ago, October production.
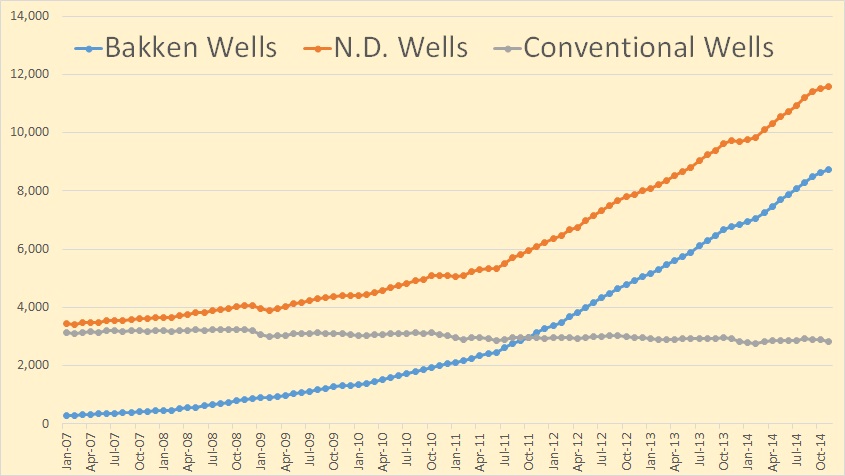
Total wells producing was up by 110 in the Bakken but only up by 63 in North Dakota. That means a lot of conventional wells were shut down.
From the Director’s Cut:
Oct Sweet Crude Price = $68.94/barrel
Nov Sweet Crude Price = $60.61/barrel
Dec Sweet Crude Price = $40.74/barrel
Today Sweet Crude Price = $29.25/barrel (lowest since December 2008) (all-time high was $136.29 7/3/2008)
Oct rig count 191
Nov rig count 188
Dec rig count 181
Today’s rig count is 156 (lowest since Oct 2010)(all-time high was 218 on 5/29/2012)
The statewide rig count is down 28% from the high and in the five most active counties rig count is down as follows:
Divide -62% (high was 3/2013)
Dunn -39% (high was 6/2012)
McKenzie -23% (high was 1/2014)
Mountrail -32% (high was 6/2011)
Williams -28% (high was 10/2014)
The drilling rig count dropped 3 from October to November, 7 more from November to December, and has since fallen 25 more from December to today. The number of well completions decreased from 145(final) in October to 39(preliminary) in November.
Oil price is by far the biggest driver behind the slow-down. Operators report postponing completion work to avoid high initial oil production at very low prices and achieve NDIC gas capture goals. There were no major precipitation events, but there were 11 days with wind speeds in excess of 35 mph (too high for completion work) and 7 days with temperatures below -10F.
The drillers far outpaced completion crews in November. At the end of November there were about 775 wells waiting on completion services, an increase of 125.
Crude oil take away capacity is expected to remain adequate as long as rail deliveries to coastal refineries keep growing.
Rig count in the Williston Basin is falling rapidly. Utilization rate for rigs capable of 20,000+ feet is currently about 80%, and for shallow well rigs (7,000 feet or less) about 50%.
145 well completions in October led to a decline of 2,790 barrels per day, (revised) while 39 completions in November led to an increase of 3,691 barrels per day. That math makes no sense. But Bakken “wells producing” increased by 110. How did that happen? Bakken “wells producing” increased by 118 in October.
There are now 775 wells awaiting fracking crews, an increase of 125 in one month. What will happen to North Dakota production in the next few months becomes a real guessing game. Nothing can be predicted by the number of active drilling rigs and we have no idea what the fracking crews will be doing.
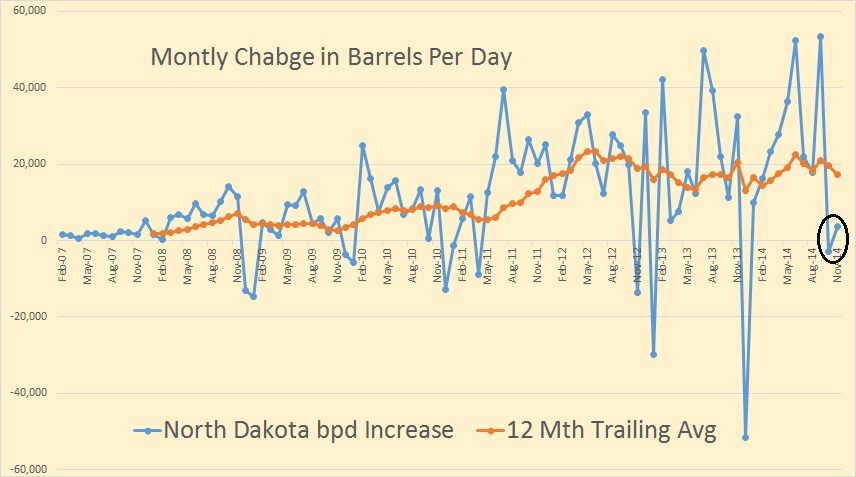
One thing for sure is production growth has dramatically slowed in the last couple of months, (circled above). I expect that slowdown to continue to get even slower. But because of the huge inventory of uncompleted wells the immediate future of Bakken production becomes a real mystery.
Addendum: The reason “Wells Awaiting Completion” jumped by 125 in November:
Helms: Oil production could decline by third quarter
Lawmakers and oil officials alike are expecting the smaller trigger to take effect Feb. 1 through June. For that to happen, the WTI price must average less than $55 a barrel for a single calendar month.
That will reduce the oil extraction tax from 6.5 percent to 2 percent for a set amount of production, and applies only to wells completed after the trigger is pulled.
That possibility, which is expected my most officials, is leading to an increasing number of wells awaiting completion, as companies wait for the incentives to take effect. Helms said he was “stunned” to hear 775 wells were awaiting completion as of the end of November.
This means there may be a mad rush to complete wells after the the lower tax kicks in on February first.
Note: For those who would like to be added to my new post notification mailing list please post me at DarwinianOne at Gmail.com
340 responses to “Bakken LTO Production, November Data”
Clearly, the (bankrupt) customers are leading the petroleum industry (by the nose, kicking and screaming) into the Promised Land …. absolutely free oil! Time to get your guzzler on …
… right?
Hard to predict how much (how little) absolutely free oil will be made available but teams of government scientists (economists) are certainly working hard around the clock to come up with an answer.
These effects are in place before the real hits start coming. This is November data! The Bakken price was DOUBLE then what it is now.
That guy needs to take a lump sum on his pension money.
Watcher,
Why be so negative. Don’t you realize the FED can print Barrels of Oil? We will never see peak oil with the FED at the helm.
steve
There are phases.
Right now, the Fed could finance increases in global oil production and push the peak upwards. It’s traditional to say to-the-right, but upwards is the correct direction if created money is used to finance increased production higher and higher, because if you are given free money, you’ll hire every one you can to get more oil out, since your primary cost (financing) is being backstopped and the more that comes out, the more money you make (a lot like bigger burgers vs 1970s size burgers, the bigger they are, the more money you make).
When a physical limit is reached, then the nationalization of output arrives as the decline unfolds and capitalism in general has to stop because whatever comes out of the ground will be rationed to grow and transport food. The transport of nothing else will be permitted, or in effect, possible, and thus neither will be capitalism.
Then, soon after, the food can’t be grown or shipped and some new rationing categories will unfold for backhoes at cemeteries.
Watcher,
Have you ever thought that the Fed could Print TRUCKS, DIESEL FUEL, FOOD and ETC. I don’t see PEAK ANYTHING when the Fed is running the show. Don’t you realize a BIG MAC from McFats would be the same quality as one printed by the Federal Reserve?
steve
Yep.
http://www.theguardian.com/technology/2014/apr/01/3d-food-printer-foodini
Steve, Perhaps the FED can get creative and print certificates representing barrels of oil to distribute to the public. Oh wait, That’s what Steve from VA. says dollars are! So I guess if you believe hard enough they truly can print crude. I make a prediction that we still have not seen peak “leadership” psychosis ..some could choose to argue that point though.
Philip,
Excellent points indeed. As I stated above to Watcher, I see no difference in quality of a BIG MAC from McFats, then one printed by the clowns at the Federal Reserve.
Americans have become disillusioned that all we need is MORE PRINTING and everything will be fine. Well, if that is the case, then I say… let’s start with printing more IQ’s. That would really help things right along over the CLIFF.
steve
Well, absent caps, there is some merit in noting that it’s not just the US happy with printing. Pretty much about 85% of Europe is demanding Super Mario buy some ink. He may start January 22, three days before the Greece election. How cool is that?
Watcher,
While you are correct that the NITWITS in Europe are also clever at running the Printing Press, but they can’t hold a candle to the CLOWNS at the Federal Reserve. Well.. then again, we can’t forget about the Japanese and their wonderful way of blowing the YEN off the charts.
Things will continue to get more insane until we wake up one day and see a blank screen with a blinking dash showing the system has totally crashed and is awaiting a REBOOT.
“I’d buy that for a Dollar”
steve
This seems to at least partially confirm what I thought, they are not going to frack drilled wells unless they absolutely have too for some unforeseen reason. I heard another repot on Monday night from a friend of mine who’s son works on the rigs. He said basically as soon as they finish a well they stack the rig. The company he works for is letting the least desirable people go and then moving those they want to keep to rigs that are still drilling but he knows that will not last for long. There is an overwhelming sense of denial in the air but I think life is about to get interesting.
Yup, the cancellation clauses in the drill rig contracts might be uglier than the fracking sand and rail contracts. Those sand and transport suppliers need to tighten that up and put the screws to these guys.
If they can’t pay, have them borrow. If they can’t borrow, you didn’t want to be doing business with them anyway, since the bank knows better than you do.
Hi Watcher,
My guess is the sand business is pretty competitive. If one company won’t provide sand, there are plenty of others willing to grab that business. Rigs are a little harder to come by, not a lot of those can be dug up. But when the lease is up on the rig, if prices are still $35 or less at the wellhead, the lease probably will not be renewed. The lease can also be broken and the penalty will be paid if they run out of room in the sweet spots. Nobody will be bothering to drill in the less productive areas.
Based on the current ND oil price, the only wells worth fracking are the best ones. There are still hedges in place so some wells will be fracked. Unhedged production has no payback for fracking at these prices unless its a gusher. Helms had it right when he said operators were not keen to bring up the big first year well output and get $30 a barrel for it. They all think that if they sit on it for six months to a year they can get $50 or $60 a barrel so if you don’t have to, why frack?
It’s like F-16 assembly lines. If you don’t need them, why build them? Because the guys who know how don’t grow on trees.
So these things will be fracked if that is a consideration. The more likely consideration is the price could be low for years, in which case the lenders are going to be taking ownership of all these companies.
Your last sentence is the one that is exactly right. Which is why they will not lend more money now to frack a new well.
It will be interesting to see what happens if prices do recover. It could become a game of fracking chicken. Some may want to hold out for a better price but as soon as one sand truck rolls they will all have to roll and it may smack the price right back down.
I suspect other oil producers are taking action to reduce activity. They may not have wells with such high decline rates, but in most cases production does go down as activity slows. This means the overall market doesn’t necessarily get forced by the Bakken wells.
Presumably any well that had operating costs equivalent to 50% or more of wellhead revenue six months ago now has no positive, or actually negative, cash flow.
Of course, as I think you noted, the abandonment costs are so high in offshore areas likes the North Sea that a lot of operators may be postponing the day of reckoning and absorbing, for the time being, the negative cash flow on some older fields.
I suspect the shut ins are taking place randomly, for example when electric submersible pumps go out, or a well sands up, they may be allowed to sit for months. I bet the workover rig market is lousy.
Other shut ins are studied a bit before the plug gets pulled. For example, take fields like Rubiales in Colombia. I assume they will cancel drilling rig contracts and hunker down.
Jeff, according to my Niece (Petroleum Eng., Statoil) the biggest hits to new production will be in the Arctic because of high costs and long lead times there. Apparently Norwegians are the biggest players in the Arctic right now so this is probably a good call: This conversation was just ten minutes ago so very current! She reads Ron’s Blog and likes your input.
Doug, 10 minutes ago was $1.50/barrel higher. Try to keep up, please.
Doug, I guess it depends on the time prices stay real low. If we shorten our time horizon, the biggest hits on new production must surely be USA light crudes from tight rocks. I don’t think there are significant ongoing Arctic projects.
Let’s see if we can pump your relative…where are these arctic projects supposed to be?
North Sea operators also lobby for tax breaks:
http://www.theguardian.com/business/2015/jan/15/oil-chiefs-call-for-north-sea-tax-cuts
The UK uses a primitive tax system. They ought to talk to the Angolans.
As a computer guy I have to smile at this. The prices for computer hardware have fallen by half every 18 months since the late sixties.
Oil prices are still much higher than they were when Bush II got into office. Why should there be a tax break?
Computers and similar electronic goods are just about the ONLY things that have steadily declined in price over the last few decades.Everything else that matters that comes to mind has been steadily going up on average-at least everything that comes to mind immediately.
This steady decline in the price of electronic goods seems to have had the effect of causing people who work in the electronics industries to believe in eternal growth and prosperity.
It just doesn’t work that way in other industries.
Now here is a thought that I find sort of intriguing.
Suppose the cost of the chip needed to run a small device such as a phone or tablet drops to let us say one dollar.That sort of chip may never get to be this cheap but let’s say it will for illustrative purposes.
If the electronic guts cost so little then the actual price of electronic goods may start going up eventually simply because the cost of the rest of the device and shipping and retailing etc increase faster than chip prices go down.A chip can’ t possibly cost less than zero.
I believe the prices of some consumer goods have already followed a similar pattern. The cheapest name brand digital watches cost more now than they did three or four years ago in my experience.
At any rate in the non electronics world a government may have the choice of choosing between a lower tax rate and more oil – or between the current tax rate and less oil- maybe even no oil at all.And no oil tax revenue at all.
With the local price at fifty bucks and operating expenses including taxes at sixty bucks including twenty in taxes you get zero oil and zero taxes.
Cut the tax rate to five bucks and with operating expenses falling to forty five bucks you get oil and a little tax revenue.
The really scary thing is when the price falls so low that even a zero tax rate doesn’t allow cash positive extraction.
Then EVERYBODY’s MOMMA has to start paying the oil producers instead of the oil producers paying her.
Ya can’t get by without some oil no sireee.
Gotta have SOME o’ that stinky black slick stuff.
It’s easy to underestimate how fast the price of computer equipment has fallen. Chip prices don’t go below zero, but most of the equipment I was selling in the early nineties cost literally nothing.
For example, nonvolatile storage prices (hard drive space for example) have fallen 99.9999999% since I started.
Components get integrated onto chips because the cost of keeping them separate would be higher — two chips costs a lot more than one.
For example, the Intel 386 was introduced in 1985. It had a quarter of a million transistors and ran on 5 volts. It cost something less than $1,000, not sure any more.
In the mid nineties we were buying a 3V version that ran 4x speed and much smaller SMT style packaging in Hong Kong in bulk for $2. A couple of years later the circuit logic was integrated into embedded systems like CD-ROM drive controllers.
So the product ceased to exist, although the logic was integrated into hundreds of millions if not billions of systems. You need a microscope to see a 80s style desktop PC, and chips are still shrinking quickly.
I read an estimate that over 1,000,000,000,000,000,000,000 (a sextillion) transistors have been shipped. Each one does the duty of the original transistor in the fifties.
Solid state manufacturing started by eating the electronics industry, but it didn’t stop there. Twenty years ago the main industrial use for silver was camera film. The camera and film market collapsed. A whole world of mechanical logic, like carburetors and machine tools is being replaced by chips and actuators weighing much less. Most of the consumer electronics devices of the nineties are just apps today, so despite your claim there is no bottom to the price. Commercially available cars can get 80MPG. New planes do even better per passenger thanks to better design, manufacturing and route optimization. 20 years ago, nobody expected Africa would be able to afford the copper wiring to get telephones — now 800m Africans use dirt cheap mobile technology instead. The real cost of lighting is collapsing. New houses need almost no heating at all around here anyway. Air conditioning may soon go solid state as well. American consumption of newsprint has fallen by 2/3 since the Clinton era. Improved renewables are poised to eat fossil fuel’s lunch in the electricity business. Nobody blinks when solar or wind prices fall 20%.
Computers are at the crossroads of better material sciences and improved design/analytics, but they are only part of the story. Mankind could easily reduce its ecological footprint by half while improving living standards. We could even start undoing the mess we made in the past few centuries. Whether we will before we hit a wall is another question. My guess is that some societies will do better than others.
Basically it all comes down to the ability to produce an oil glut when the world economy is weak and demand is still relatively low. Even after massaging the numbers the US and Europe can only come up with a small gain in the economy. As far as I am concerned, other than a few areas, inflation is still eating that so called growth ( a good portion of which was the oil and gas industry growth in the US). Reality is we are still near zero growth. Don’t let the funny money fool you.
So after putting trillions of dollars into developing oil production in the US, the industry was able to outstrip the demand. Oil was somewhat overpriced anyway and is definitely hung out on heavy debt. Mines experience this effect and shut down for periods until the price goes up. Debt and public investment force continued production or bankruptcy.
Hi. Here are my usual graphs. First the production profile. I have used sales (runs) for confidential months. This tends to give lower initial production. Probably there is a lag between production and sales. So don´t use this data for calculating cumulative production. But the months after that should be more accurate and comparisons between years should be more accurate. So that´s why I used this method.
This time I have included all data points. I used to skip the last one including only January, because it tends to be divert alot with only one moths of data. But it there are some intersting information for 2014. January was actually a rather good month in terms of initial first months of production. But the last data point for 2014 (including only January data) we can see that it is now bellow 2011 and 2013. Also the data point before that (including January and February data) was slightly above the 2012 line using October data, now it´s slighly bellow it. So there are indications that decline rates for wells drilled in 2014 may be higher than the years before it. It´s too early to draw any conclusions, but interesting to note.
Here are the water cut profiles. I was a bit suprised to see that the wate cut for month 0 and 1 for 2014 actually decreased from 47% to 46%. Ron´s 24 hour ip data suggested that water cut should increase. 2014 is still higher that earlier years though. All data points are included here also.
Did total water production decrease?
Lets see. Average oil production for month 0 increased from 290 to 293. So yes, average water production decreased from 257 to 250. But only not confidential wells are included. So it is uncertain.
Here is the one month after first production data for oil production, water cut and gas production. Here we can also see that water cut has decreased.
Hi FreddyW,
It looks like the water cut has increased because the right axis is reversed or do you mean the uptick at the very end?
Yes I mean the last data point.
And finally the Mountrail data. Here production has continued to decrease. It´s now the lowest ever for the period shown.
“So there are indications that decline rates for wells drilled in 2014 may be higher than the years before it.”
I recall this being noticed, that the late graph was declining faster and intersecting previous year lines, and you properly cautioned about the relevant January.
Now, it looks bad. It looks ENORMOUSLY worse with lower price. This can be yet another mechanism of hysteresis — recovery price may be far higher than destruction price.
It’s not enormously worse. The best way to look at it is the cumulative rate versus time.
FreddyW. Something I note is the tail end of 2009 and 2010 wells. 2010 has an uptick, while 2009 drops off sharply to about 25 bopd. It had looked a couple of months ago that these wells would flatten out to around 50 bopd. Do you think that is accurate, or is 25 or less more probable? With nearly 9,000 Bakken/TFS wells, I thought hitting a 4% or less decline at about 50 bopd per well would create a base of 450,000 bopd. My view of EFS is those wells fall off to under 30 bopd in about 4 years. Horizontal in Permian also looks this way to me, although there you have many more zones and therefore tougher to generalize.
I know it is just guessing, but let’s say we look out from now to 2025. What do the wells drilled 2009-2014 look like in your opinion? I am having a tough time understanding how water flood would work in the shales, although middle Bakken doesn’t really look like a shale. Would welcome opinions on this. Seems like whether the 150,000 or so 15,000′-20,000 horizontal wells projected in these fields in next 8-10 will average 5 or 50/bopd is a big deal. I suppose if economy doesn’t have the demand, those wells won’t be drilled. However, welcome opinions assuming they are.
Hi Shallowsand,
I can easily show you what things would look like out to 2025, if you give me some assumptions. How many new wells per month are drilled between now and 2025?
Do we assume that the estimated ultimate recovery(EUR) of new wells remains at the 2009 to 2014 level or does the new well EUR decrease as the sweet spots get drilled up?
If we expect EUR to decrease when does it begin? How quickly does it ramp to its maximum rate of decrease (1 year, 6 months)? What is the maximum annual rate of decrease in new well EUR? With these assumptions I can give you a TRR, where price is assumed to rise enough to keep wells profitable (10% IRR minimum). If you give me some price assumption (real oil prices rise by 5% per year), I can show you output levels that would be profitable based on the assumed oil prices and other underlying assumptions.
In previous posts I have shown scenarios where new wells added decrease to 130 new wells per month by March 2015 and remain at that level. New well Eur starts to decrease in June 2016 and reaches a maximum annual rate of decrease of 7%/year 12 months later. Oil prices rise from $58/b at the refinery gate ($46/b at the wellhead) in August 2015 by 4.9%/year. Some people seem to dislike the endless charts, so I will not bother to post it.
This scenario keeps output pretty flat in North Dakota at about 1.15 mb/d to 1.2 mb/d. If you are wondering what output would look like with no new wells drilled after Dec 2014, that scenario is below.
Dennis, thank you very much for the response. So looks like in 2025 the wells drilled and completed through 2014 are only at about 200,000 bbl per day per your analysis. The number of wells that must be drilled to maintain production long term is staggering. Surprised the market is not taking this into account. Or maybe it is, but is also assuming world wide demand will be peaking soon, which would not be a good thing given no good substitutes on a broad scale in the immediate future.
Also, thanks for the response, Fernando. Wonder if they have a good water source to flood with in ND? Also wonder about these wells long term from the stand point of the lateral
was cut off. from the stand point of the lateral plugging off. Would seem like working over these wells would be very expensive.
Shallow Sand, though there has been some testing with water injection in shale, none were successful. Here is a long PDF on one such test. They found water flooding almost totally useless in shale formations though they did not rule it out completely because they thought perhaps their testing could have been better.
I have read many opinions on water flooding shale and no one seems to think it will work.
EVALUATION OF EOR POTENTIAL BY GAS AND WATER FLOODING IN SHALE OIL RESERVOIRS
2. In our work, although water injection in shale oil reservoir did not have a result as well as gas injection, we cannot conclude that water injection has no potential in the development of shale oil reservoirs absolutely, because we have not optimize the injection process and may factors have not been included in our simulation model.
Miscible CO2 flood is a better option then attempting a waterflood in an unconventional carbonate like the MB and TF.
I would check a huff and puff. I wouldn’t bet much on a sweep process unless you have 200 years.
As you say, the rocks being exploited aren’t shales. They are very poor quality dirty carbonates and silts. The wells were fractured. This means injected water will enter the fractures and bypass the bulk of the rocks. I visualize a little bit of imbibition taking place. But the economics ought to look terrible.
If I owned one of these fields I would try using a two well pilot. After all we did get a surprise when we flooded the North Sea chalk. But it sure looks uphill.
Hi. The last data points for each year contains data only for wells that started production in January. The data is rather noisy, so it gets very unrealiable with only one month of data. So don´t draw any conclusions from it. The last 11 data points for each year does not contain data for all month. So they are subject to change.
This article does a pretty good job of touching on many of the things being discussed here.
http://www.opednews.com/articles/1/Peak-Oil-and-the-Fracking-by-Allan-Stromfeldt-C-Debt_Economy_Energy_Fracking-150112-505.html
Excellent article. I passed it on. Thanks for the link!!
Bottom line is tell me what the best oil futures back month contract should I go long on ….. I think just going with front month won’t make the most.
Somebody ran out of oil and now it’s at 48.53, the tether let loose. Two dollar oil must mean two dollar per barrel price increases.
Up 2.64 at Bloomberg. Bound to change at any moment.
Any kind of wild speculation for the price increase might include a shrinkage in inventories and an increase in demand, the old supply and demand ploy, fall for it every time, never fails. Whoddathunkit?
100 million cars adding twenty-four gallons into the tanks in the past two weeks totals 2 billion 400 million gallons of gasoline. 1.2 billion vehicles adding two gallons on average is still 2.4 billion gallons of fuel, gasoline and diesel. How can the globe trekking jet set travel to Tibet without jet fuel and gas needed to reach the base camp at Mt. Everest? New Zealand needs some tourists this time of year, more jet fuel, more gas, more adventure. Gotta go for the gusto. Might want to squeak in some fishing for salmon. Without oil, you’ll need to find something else to make it all go. Sails and yaks, some gear and food, you might accomplish your goal.
23 gallons of gas in each barrel of oil. All armies, all navies, all air forces, coast guards, all were going to have to have some more, it has to come from somewhere. The merchant marine has to have some diesel for the power plants on the trawlers. Can’t run empty, you’ll be stranded at sea, then the coast guard will have to have a helicopter rescue, more fuel. Fill’er up. Your stomach is empty, you eat, you’re going to live, life is good.
All of a sudden, an additional 55 million barrels have been burned in the past two weeks. Might as well get as much as you can at the low price, it’s probably not going to last very long, you gotta get it while you can, don’t know what you’ve got until it is gone. Those empty tanks are like empty stomachs, when there’s nothing there, nothing works.
On top of that, the Williston Basin production is one million barrels per month lower in November.
https://www.dmr.nd.gov/oilgas/stats/historicaloilprodstats.pdf
Supply and Demand
Those two evil, wicked, mean and nasty devils, the dirty dogs that they are, might be calling the shots, but it is just a guess. Could be all wrong, again, it has happened before.
First, it’s all ecstasy, then agony follows, then ecstasy again, then more agony again and then even more agony again, the misery index must be ebbing from its high, always seeking a low, a never ending quest.
Agony, agony, agony, agony, agony, agony, agony, agony, agony… agony… agony
– Bugs Bunny
If the shale companies are not interested in completing their drilled holes, and they are drilling their holes on borrowed money, then the only reason to drill the holes will be because they can’t get out of the contracts for their suppliers, be that drilling rigs, casing, or other service companies.
If the the delay in completion is by choice, they must be expecting a fast and quick rebound in price.
If the delay is, because they have no other choice, then they are digging themselves one very big hole.
I doubt, many of the shale companies have big enough cash reserves to carry this game on for very long?
”big enough cash reserves to carry this game on for very long”?????????
This question seems to be at the very heart of who survives among the little guys and who gets bought out or sold out.
The price of oil is not going to go back up for a LONG time -as long as it takes the world economy to grow enough to dry up the current glut- unless a whole bunch of somebodies cuts back on actual deliveries.
I use the term delivery instead of production because a few outfits may have ways to store a hell of a lot of oil and can continue producing it. Who these folks might be is hard to say but at different times over the last year or so I remember reading about some HUGE tank farms being built.
At the time I thought the builders were making a bad mistake anticipating business that would probably not be there.
Now I am thinking differently.
All the really big boys started cutting back very heavily on capex well over a year ago. Now the usual explanation is that they could not see adequate justification going forward for investing the money given the high cost of any new production.This is certainly a reasonable explanation- so reasonable that maybe it is TOO reasonable to take it at face value.
IT is ENTIRELY reasonable in my opinion to assume that super major and nationalized oil companies have the very best in house economic expertise that money can buy plus the maximum possible level of intimate communications with OTHER big players – the super banks being the other players I have in mind- plus access to the supposedly secret insider data that is gathered by various national governments thru spying both polite and impolite..
This assertion at first glance might seem sort of farfetched but to take the simplest and biggest two cases- the Saudis and the Russians – it the first case the government and the oil company are one and the same and both the company and the government are the defacto property of the royal family.In the case of Russia the people who own and operate the country for the most part these days are also for the most part alumni of the old soviet government – men who go way back together as apparatchiks and executives with state security agencies.
Here in the US we have what we call the revolving door – the very WORST example being the fact that our supposedly impartial banking regulatory apparatus and government oversight agencies are almost totally staffed by industry insiders. You do not have to be a conspiracy nut to understand that when top a flight executive at a super bank gets a top flight post at THE FED or anywhere else in the government that information does not pass quietly in all directions among people able to keep their mouths shut and their peckers in their pants as well -most of these guys being too old to get in much pecker trouble anyway.
The sort of people I am talking about have OWNERSHIP interests in the businesses they regulate- maybe not in the form of stock but at least in the form of an expected super high paid job back inside the industry once they leave government.
The OWNERS of big banks OWN big chunks of other industries – including the oil industry.I am about as far from a conspiracy nut as it is possible to be but there is no doubt in my mind that when you get to the top and get your stack jack you have ways of letting your managers know that keeping their jobs involves keeping you INFORMED. Regulations be damned.
So -it just might be possible that some of those big storage facilities that I read about in passing belong to people who ANTICIPATED the possibility of a crash in oil prices. If they were wrong they still have the facilities which in terms of conventional thinking will still be useful if unprofitable for a few years – years spent waiting for the economy to grow until the facilities are needed.
BUT – if they very strongly suspected the crash was coming- then they could reasonably anticipate leasing their brand new storage to people with money enough to fill it up with cheap crude – people able and willing to wait on the price going back up.
The price of oil IS going to go back up. The price of any given commodity has NEVER gone down and STAYED down over the long or even the medium term unless demand for it has permanently shrunk.
Whale oil crashed for the long haul because it was DISPLACED by petroleum.
There simply isn’t anything out there to replace oil for the foreseeable future and the potential supply is depleting at minimum rate of around eighty million barrels a day depending on the exact definition of oil.
Maybe all the really big players saw this crash coming. I know hardly anything at all about the history of the oil industry beyond the bare outlines.
But I have spent THOUSANDS of evenings reading history and in particular the history of the nineteenth and twentieth centuries with a favorite aspect of it being war and peace.
By 1937 or so just about all professional military men whose rank was high enough that they were well informed politically believed WWII was baked in. It took most of the political and business leadership a couple more years to believe it since they preferred not to.
The best place for a secret might actually be right out in the open sometimes.
I am NOT actually saying I take these speculations seriously. But I don’t think they can be dismissed with a wave of the hand.
When I commented immediately above that maybe the big boys saw the glut coming I didn’t mean to imply that they expected the price to crash by HALF.
But then the French generals who expected a war with Germany didn’t expect the Germans to kick their butts without even working up a real sweat.
I find very interesting that I have seen hardly any speculation at all from any quarter about the top dogs in the industry suspecting not only stagnant prices but also a possible price busting glut.Maybe I haven’t looked in the right places.
If I remember right I think Shell sold off their fracking interests about two days before the price turned downward.
http://www.wsj.com/articles/big-oil-feels-the-need-to-get-smaller-1414973307
Well, maybe it was a couple days after.
Best to remember that the BoJ is explicitly provided permission to trade in equities and I believe commodities futures too (have to go back and check). If so, the easiest, least threatening-to-normalcy-narrative path is to buy crude contracts and force it up.
Of course, that would be counter to Japanese interests, but they’ll probably do as they’re told.
We found out pretty quick that a minor oversupply of baby formula – more than the collective baby needs – means the price of formula will crash. Mom and Dad will buy more formula- but only if they can get it cheap enough to feed it to the cat.
But this figurative description of oil markets holds only in the very short term. Give Mom and Dad a few weeks or months to think about the cheap price of gasoline and they will decide on that extra trip to Grandma’s house . The guy with the bulldozer may call up a few customers who turned him down earlier and tell them he can trim ten more percent off his last estimate now that diesel is down some.
Some of the young guys with a wife and kids will decide on the v6 model family hauler rather than the four banger.
Everything else held equal consumers are going to start buying noticeably more oil products soon.This may be happening to a large enough extent already to show up in the statistics within the next couple of months.
My own seat of the pants estimate is that some people are already changing their oil consumption habits noticeably. We are crowd animals – and when we see other people having a good time we will do the same.
I am already hearing from acquaintances about how much fishing they expect to do this summer. Fishing is a cheap pastime for me that actually costs me almost nothing. I fish mostly in nearby farm ponds and catch enough to offset the gallon or so of gasoline I burn to get to the ponds.
But I have acquaintances who when they can afford it drive two or three hundred miles one way go fishing any time they can manage three consecutive days off and can come up with five hundred bucks expense money- towing a large boat with a large pickup truck. The boat itself can be counted on to burn thirty or forty gallons in two days.Sometimes more. These guys are going to get in half again more trips this year than they did last year on the same amount of gas money.
Everything else may not be equal though – the economy could have so many other problems that it gets sicker rather than healthier.Some cheap oil vitamins aren’t going to cure debt cancer.Cheap gasoline is not going to fix all the things wrong by any means.
But it will help some people a lot depending on what line of work they are in.
Oooh, Ukraine has been stealing nat gas and Russia just put a stop to it. Cut gas to Europe by 60% via ZH.
Should be able to squeeze a buck or two a barrel out of that hype.
Some German newspapers reported that ZH by mistake used data from an 2009 article. Ather papers picked it up without checking. And so did the oil traders.
I left Santa Cruz, CA on Friday 09 Jan 2015 and drove the 1,550 miles to McKenzie County having been invited to work on a startup of some new saltwater recycling equipment. I arrived on Sat afternoon and have been looking and listening to the rumors, speculations and opinions regarding Bakken oilfield prospects for the immediate future. Here are a few of my observations from a “Boots on the Ground” perspective.
1. People leave -20deg F weather to go back home this time of year.
2. Low oil prices will cull marginal and leveraged outfits who don’t have the reputation needed to continue.
3. Good companies are still hiring workers, and are still turning away work.
4. The “Boom Hysteria” is quite possibly over here, but there is still quite a bit of oil to get out of the ground.
5. Outfits here are betting on rising prices in the next three to four months.
6. The Bakken in January ain’t fer pussies.
O3K, Out.
O3K
Welcome to North Dakota!
Thanks Nick. I’ve met lots of really nice folks trying to get something done under significantly less that ideal conditions.
Anecdotal data remains very important in this environment. Thanks for the observations.
O3K,
Thanks for the info.
I am interested in the water recycling. Is that produced water for fraccing?
If so, I would love to know the quality of water you are producing, salt concentrations etc and what processes you are using.
today’s retail results a miss. And I remember people were adamant that declining oil prices and extra $200 gas savings would boost the economy.
All things are relative Ves, just imagine what the retail results would look like if oil was still $100 a barrel.
Here is 3/4 Smidgeon of tidbit. Retail numbers include retail gasoline sales. So if one sub category isn’t bought then something else is (maybe, or maybe they pay down a student loan), but there is no net goose to the final parameter derived from not spending on gasoline, because that decrease hits the total. There is exclusionary drill down data that will provide some info, but the headline number won’t say anything other than people are getting high paying jobs, or they are not.
Here ya go:http://www.bloomberg.com/markets/economic-calendar/
If anyone cares, Singapore isn’t following suit with the contract expiration spike of this afternoon. Price currently flirting with sub 48.
Gift cards are not counted as sales until they are used. Anyone else besides me give/receive any gift cards??
I heard around xmas time that some godawful HUGE number of giftcards are never cashed in. Hence, popularity.
The money that corporations receive from un-cashed gift cards are subject to the states’ escheat laws. That is, they must be turned over to the states after a period of time determined by each states’ laws.
Cool. But the money is paid to the company. It has to appear as top line, yes? The cost would be later?
I believe it would be at time of sale of card
debit cash
credit unearned revenue
BS items, touches income statement upon redemption
Good catch
Oh and btw, let’s talk about GAAP and non GAAP. Generally Accepted Accounting Principles and that which is imaginary bullshit.
I give you Elon Musk. Non GAAP is supposed to allow companies to exclude special events that occur in a quarter. Like lighting hit a particular machine that is required to make product and since product could not be made until the machine was repaired/replaced, you declare that the decline you’re reporting in sales or earnings do not reflect the reality of the business and was a “special non recurring item”.
Today we have this:
Tesla Motors Inc. Chief Executive Elon Musk told an auto industry gathering the Silicon Valley auto maker will need until 2020 to be profitable on a basis that includes charges and executive compensation.
Uhm ARE YOU KIDDING ME???? He’s calling executive compensation a special non recurring that happens to recur every quarter. God knows what other “charges” there are. Hell, maybe those are the cost of materials to build the cars. Completely non recurring.
THIS is the kind of thing that explains why that GAAP vs Non GAAP chart that ZH splashed a few months ago was what it was. This company isn’t going to make a cent for 5 years, assuming it lasts that long.
Hi Watcher,
Amazon has operated for years without GAAP profits. This is often true of fast growing companies that plow every dime back into the business. It is not possible to run a business without some executive compensation, though I agree that this seems strange as a non-recurring item, I imagine they are referring to bonus compensation, which should not occur every quarter unless a company is doing very well every quarter.
Right – publishing a non-GAAP number along with the GAAP number has become very popular because, they say, “investors” prefer the non-GAAP number to the GAAP number. That would be right if they put the word “stupid” in front of the word “investors.”
However, GAAP screwed up about 15 years ago when they established the “qualified hedge” rules. As a result, virtually no hedging (interest rates, oil costs by users, oil prices by producers, etc.) can qualify as a “qualified hedge.” Thus those swings in whichever leg of the hedge that you own must flow thru the income statement quarterly. So, e.g., if an oil producer, in effect, “sells” its 1st qtr 2017 oil production by selling a hedge contract at $95/bbl and the price in the 4th qtr of 2014 falls to $55/bbl., they have to report $40/bbl of GAAP income for each such barrel sold in the 4th qtr of 2014. If they closed out the hedge on 12/31/14, they would in fact have $40 of income. But, of course if they hold it until the 1st qtr of 2017, then they get their $95/bbl. Say the price in 2017 was $78, that is what they would receive from a buyer, and the hedge would be closed at that point with a $17 hedge gain – $95 total. So, in such a case, I believe that the non-GAAP info is useful. If they hold the hedge, they will disclose that 4th qtr GAAP income includes an “un-realized hedging gain of $40/bbl on x-number of barrels.”
I could see the price of Tesla stock crashing but the company has physical assets and patents worth a substantial fortune – assuming the auto industry remains alive and well. Now that is a big ASS U and ME in and of itself.
My own guess- assuming a moderately healthy economy is that Tesla is going to continue to grow like gangbusters with a big built in advantage of owning near state of the art manufacturing facility and half of the uber battery factory. Tesla has not yet been around long enough to accumulate the sort of deadwood management that afflicts a lot of companies.
Not many people have even seen a Tesla yet in fly over country anyway. I
I will venture a wild guess that the average regular here expects the price of oil to be back around a hundred bucks within a couple of years and that it will continue to go up gradually from that price.
The future of the electric auto is very very bright in my estimation.
There will be another oil price shock – upwards the next time.
I wonder how far a really stripped down car – an honest to Jesus subcompact with NO frills at all would go at a governed maximum speed of forty five mph with a Leaf drive train.Well over a hundred miles for sure. Maybe even a hundred and fifty.
One of the things Leviathan is going to do when the shit hits the fan is to institute very low speed limits.Enforcement will be draconian- for two good reasons. One is that slowing down nets a MAJOR improvement in fuel economy. The other is that the localities town, city, county, states are going to instruct their cops to write tickets as often as possible to get the money.
I have already noticed- as have many other people in this area- that what used to be a friendly warning about a burned out light on the back is an automatic can’t win ticket that costs the county or city about dime or less to write since the court process is mostly automated.
The cop is already on the payroll. So you pay the ticket in advance rather than sit in court for hours.You hand the money to a court clerk who is already there all day every day anyway.She takes you off the docket.
And your wallet has been lightened by a hundred to two hundred bucks depending on the exact locality. This is happening in the town next door probably twenty times a day. It is a small town.
I wonder how far a really stripped down car – an honest to Jesus subcompact with NO frills at all would go at a governed maximum speed of forty five mph with a Leaf drive train.Well over a hundred miles for sure. Maybe even a hundred and fifty.
Are you familiar with the Rocky Mountain Institute? They have been advocating a total redesign of the car for quite awhile now.
http://www.rmi.org/impact_driving_a_clean_future_with_ultralight_autos
posted below…3-D car body printing for electric cars
http://blog.caranddriver.com/made-in-detroit-local-motors-printed-a-car-at-the-auto-show/
Of course, for mass production, I don’t think 3-D printing offers much.
But check out what the RMI is advocating for carbon fiber bodies and the like.
http://www.rmi.org/autocomposites
And this is what they have been doing in the past.
http://www.rmi.org/Platform+Fitness
The key to taking significant amount of weight out of a vehicle without making it smaller is to substitute lighter, yet stronger materials such as advanced composites, aluminum, or lightweight steel for heavier materials. Once the platform is lighter, the engine (or battery) can be downsized while maintaining original performance.
Simply put, every pound removed from the electric vehicle fleet will make electrification easier. Trying to put a battery into a heavy automobile designed to run on an internal combustion engine creates unnecessary challenges. By reducing weight, cars can be designed to run on electricity and reap the multiple benefits of efficiency.
“The Strati is made of 80 percent ABS plastic and 20 percent minced carbon fiber and weighs a claimed 1500 pounds.”
https://localmotors.com/3d-printed-car/
My friends and family have always noted , usually in friendly fashion, that the ONLY four letter word I really try to avoid is WORK. Avoiding as much work as possible is essential to pursuing all the more interesting things in life such as hanging around in garages and drag strips or pool halls.OR libraries.
I am well acquainted in laymen’s and tradesman’s terms with the possibilities involved in building light weight cars.
While whatever can be done in the way of reducing the weight of a car really does make it much more fuel efficient everything else held equal the actual cost of weight reduction engineering is high to prohibitive because of the law of diminishing returns and the high cost of premium or exotic materials. Aluminum is triple the cost of steel. Carbon fiber sky daddy alone knows how much.
A real problem with the RMI approach is that RMI is focusing on promising people they can have their cake and eat it too- that technology is going to enable them to continue to drive cars as large fast and comfortable as todays cars.
There are good reasons for doing this. It is hard enough to get people to even consider unpleasant news- never mind to accept that unpleasant lifestyle changes are unavoidable.
My own thinking is that it just won’t be possible to build very light cars as big as the ones we drive today at an affordable price.
In my estimation the only way we are going to be able to successfully deal with peak oil in terms of automobiles is to take a four pronged approach to building a car.
Light weight is one prong for sure.
Another is a more efficient drive train.It may be that batteries will get to be cheap enough and powerful enough that we can keep on driving cars of the usual size while reducing the weight as much as possible without making a car unaffordable.
The other two are downsizing and lowering speeds.
There is no question that the single best way to reduce fuel consumption is to reduce the frontal area of a car that is going to be driven at moderate to high speeds everything else held equal. Aero resistance is the big eater of energy out on the road once you are up to cruising speed.All the low hanging fruit has already been picked in terms of improving aero design of modern cars. There is not much left to be gained in terms of the SHAPE of a car.
But you can build a low narrow nicely streamlined two seater fore and aft car for no more than any other two seater and it will get awesome mileage even without using exotic materials. It is my belief that the reality of peak oil will FORCE the acceptance of cars of this sort.
The ONE thing that can be quickly and easily accomplished from the technical pov at essentially no (direct ) cost at all is to force everybody to SLOW DOWN substantially. The improvement in fuel economy is simply mind blowing.
Anybody who doubts this can try it some day.
And when the cops start impounding the cars of drivers doing over the new forty mph emergency limit and the public ( make ) works programs include hiring lots of traffic cops … well then people WILL slow down.
It might happen courtesy of an emergency national security executive order from a republican press supported by a republican congress forced to recognize the reality of peak oil one of these days.
All it would take once oil is scarce again is one really important oil exporting country falling to terrorists determined to hurt Satan…Maybe just a few ships being sunk in just the wrong spots.
Damned spell checker changed prez to press on me. Wish we had an edit button.
http://www.bloomberg.com/news/2015-01-14/qatar-shell-scrap-6-5-billion-project-amid-oil-price-collapse.htmlhttp://www.bloomberg.com/news/2015-01-14/qatar-shell-scrap-6-5-billion-project-amid-oil-price-collapse.htmlhttp://www.bloomberg.com/news/2015-01-14/qatar-shell-scrap-6-5-billion-project-amid-oil-price-collapse.html
http://www.forbes.com/sites/brighammccown/2015/01/14/amid-tumbling-oil-prices-alaska-lng-must-go-forward/
Hi OFM,
I would suggest including a teaser quote from your links that gives a flavor of whatever you think is the most interesting part. Otherwise most people will not bother to click the link.
Thanks all suggestions appreciated. And all replies that add to my layman’s insight into the oil business are especially appreciated.
If I ever get my novel published everybody who has helped me will get a thank you on the jacket by name or blog handle.I will most likely finish it – and most likely have to give it away free on the net.
The novelist racket is about like the pro athletic and musical rackets.For every paying job there are a thousand wannabes.
But if it attracts a lot of readers I might make a few new three dimensional friends and maybe be able to leverage these new relationships into something materially useful. They tell me there are groupies for authors too. ;—)
But I fear any that happen to be interested in me will be less than attractive. There is a joke that with the punchline that goes this way.
The martyr makes a disparaging remarks about the esthetic quality of his hard won harem and the reply is ” Why do you think they are still virgins?”
Forget the teaser.
Alaska is ”moving forward on an ambitious infrastructure project to develop and export its North Slope gas reserves.”
This project is expected to run well into the tens of billions.
Here is a link to a description of the LNG project. This should take about 10 years to be ready to deliver the first load.
http://www.arcticgas.gov/alaska-lng-project
Fernando L,
This is the first time I’ve come across a project such as this, in the US, where a state is one of the partners. Is this unusual?
Synapsids, I’m not sure about other states. Alaska got involved in this project because they wanted to have both an export market as well as produce gas to replace dwindling supplies from Cook Inlet.
However, once the state got the idea rolling the North Slope oil companies began to participate.
I think the overall idea is pretty decent. It can also be suplemented with a coal to liquids plant in the Fairbanks area, which probably needs to start up around 2035.
Oh, and I forgot, the concept takes a large amount of CO2 and uses it as injectant for EOR. That project will also require a huge pile of money.
Thanks Fernando.
Where will they get that CO2?
The Sadlerochit main reservoir gas is loaded with CO2.
If the coal to liquids plant you mention gets built they should have plenty of co2 handy if the plant is near the gas fields.
I take it you expect coal to liquids to be a commonplace technology twenty or thirty years down the road.
So do I- unless there are unexpected breakthroughs in other energy industries such as fusion and wind and solar. It seems like a pretty good bet than coal to liquids will be the cheapest bet to make up the shortfall of needed liquid fuels for trucks and aircraft etc.
I really expect battery propelled electric cars and very light trucks to pretty much own the market by then unless fuel cell tech gets to be really cheap.
In that case it might be economical to manufacture free hydrogen using surplus off peak surplus wind solar or nuclear power or to run a fuel cell on natural gas with an onboard gizmo to free up the hydrogen.
It seems I have read about such devices but not recently. Maybe they can’t be made to work or to work reliably and cheaply enough to be practical.
If affordable batteries are not good enough to propel a car just about all day by then – well travelers will get used to the idea of having to take charging breaks along the way on trips.
We got used to sitting in traffic jams. We will get used to battery breaks if we have to.
OR you really might be able to rent a little trailer with a very small diesel and generator mounted in it and hook it on behind to your electric and stay on the road for ten hours at a stretch. Such trailers might be available at just about any large car rental store someday.
“At the end of November there were about 775 wells waiting on completion services”
The average number of net wells additions in the Bakken for January-November 2014 was 172.
I don’t know how many wells are shut in on average per month, but if no wells are shut in, 775 wells waiting on completion services equal 4.5 months of average well additions, even if no new wells are drilled.
Why the number of wells waiting for completion services was rising in late 2014? My guess is that:
– until recently, oil companies were unwilling to early terminate drilling contracts and pay significant penalties
– contracts with frack firms are probably shorter-term and more flexible, than drilling contracts (but that’s only my guess)
– drilling accounts for only about one third, or slightly more, of the total well cost. Meanwhile fracking services account for about one half, and total fracking+completion even more. Oil companies made it clear that they expect fracking cost to decline by some 15-20% due to the glut in the market. Fracking equipment utilizationin the US has grown from 74% in 3Q13 to almost 85% in 3Q14, but will likely fall again this year due to increasing capacity and lower demand. Hence, the pricing power will be in the hands of oil companies and they expect frack costs to fall.
– oil companies expect oil prices to quickly rebound (as we now from they guidance for 2015 and interviews with people like Harold Hamm). So they probably don’t want to spend a lot of money on fracking and completion as long as oil prices remain extremely low and frack prices are still high
Correction: The MONTHLY average number of net wells additions was 172
Alex, Though I know next to nothing of frack services other than what I have read on this and other sites I know that all businesses have their’ break even point after which they just stop providing the service. Just how much cheaper can the frack service providers go until they hit this point? If you or anyone else here can enlighten me on this I would be grateful. I feel that we are in a deflationary spiral as concerns a number of things in our economy and that once at least some products or services cease to be provided you can’t just flip a switch to make then reappear when an up tick in prices occurs. This would be particularly true with a service that requires highly skilled labor willing to work in sub freezing temperatures.
Philip, Halliburton, an oil service firm, with a big share in the frac market, has recently asked his providers to lower prices of equipment and various materials. When oil prices drop, there is usually deflationary trend in the whole supply chain.
Look up prices 5 years ago. That should give you an idea.
Hi AlexS,
I agree with all of the above. In addition one of the oilmen has suggested that waiting to frack the well until oil prices rise makes sense, that leaving an unfracked well for 6 months or so will do little damage to the well, once it is fracked it only will be shut in for maintenance or the well will be damaged. It seems that many companies have made the decision to hold off on fracking their wells until oil prices rise.
good point, thanks Dennis!
“oil companies expect oil prices to quickly rebound”
Whistling past the lender graveyard. They will pitch exploding oil price every time they go to a workout session at a bank, or talk to their HY paper underwriter. This will quickly move well past “natural optimism” of oil drillers into “outright delusion”.
I will add this about the disappearance of skilled workers. There simply weren’t a whole lot of skilled fracking workers as little as three or four years ago compared to today. If they get laid off -which is happening to most of them – they will come back almost for sure given the scarcity of high paying jobs. People who chase the top money in the trades are generally ready to hit the road .
I guess it is a little different in the case of Fracking since the wells are mostly drilled in the same immediate area year after year.
A Fracker might actually be able to buy a house and put his family in it and his kids in local schools but welders and pipe fitters etc expect to work out of campers and hotel rooms sometimes for years at a stretch.If you find a stationary job it is apt to pay a lot less than a temporary traveling job which typically lasts from a few weeks to a couple of years.
Beyond that something tells me that most of the job of Fracking an oil well is somewhat generic in that most of the people are not really doing anything exotic. Driving a truck is driving a truck. Rigging is rigging. If there are fifty people in the immediate vicinity of the well when Fracking is actually happening probably not more than half a dozen of them are actually ”frackers” in the sense that they know how to MANAGE the process. I bet most of the rest of them can learn their jobs in a matter of days or weeks by working alongside an old hand.
When I lived thru a couple of construction busts I saw guys who were general superintendents get laid off- and others who didn’t. They just hung in there and took the pay cuts and went from project manager to foreman all the way back to skilled tradesman.As business picked up they moved back up the ladder very quickly.
OFM,
A lot of people that are going to be laid off in this current downturn, are from the baby boom and was dragged into the oilfield during 70/80s boom. A lot of them will not be going back to work, as retirement beckons.
That is going to be a big hole to fill next time around.
You have a good point about folks who are close to retirement age not coming back. That happens a lot. Even when times are good skilled labor guys in their late fifties have a hard time finding a job.
Guys past fifty just can’t keep up with the younger fellows when the work involves a lot of physical activity.
But I have been hearing about this supposed un met demand for skilled workers most of my life and I long ago concluded this sort of talk is mostly coming from people who are purely and simply running their mouths for reasons involving politics.
When they say they have this huge unmet demand for workers in so and so trade what they really mean is that they want another million men for peanuts wages and that they would gladly hire some for half the going rate.
If the oil industry is making money enough to put millions of dollars worth of sand and water in holes in the ground it will be able to pay men to do the putting. At ten million bucks a well drillers and frackers can afford to pay some old guys to basically just closely supervise new hands.
There will NEVER be a time again when there won’t be PLENTY of young men ready to do even the roughest ,nastiest, and most dangerous work under the most MISERABLE conditions- so long as the wages offered are enough to live well according to red neck standards- fancy new truck for him, nice car for her large newish house within reasonable distance of her favorite mall,bass boat for him, and enough money to send the rug rats to the university the parents never got to attend.
I could go thru the country side near here and get together a hundred guys in a month with hands like hydraulic claws who can RUN -guys who walk walls as they build houses, cut trees close to high voltage wires, operate bulldozers on eyebrow rock ledges on mountain sides, rebuild diesel engines, weld pipe – for sixty hours or more and twenty bucks and per diem enough to eat and sleep.
But the people who SUPPOSEDLY want them want them at twelve or fifteen bucks and half enough per diem to eat and sleep.They are making that where they are if they have work even in this economic backwater.
My deceased brother used to be such a guy. He was offered work many times well away from home – ” road work ” for not much more than he made locally. His standard reply was that he would sooner starve at home.
I was different in that most of the time I did not have a wife and never had kids.Steady work never appealed to me.
So when somebody wanted a warm body at a nuke for a maintenance shutdown I was ready to hit the road for a couple of months. I made eighty G on an annual basis back in the eighties on such jobs.Long hours of course. Seven twelve twenty nine days in a row once. But then I could play around on the farm for a few months and just take it easy.
I never really wanted a new car- never owned one in my life.An old truck and freedom are by far the best deal to my tastes.
Beyond that being an EDUCATED redneck I was able to understand the power of the exponential function as it relates to inflation and leveraged money and leveraged self employed tax free labor.
So I found a couple of other guys with similar backgrounds and we bought an old dirt cheap house once in a while and fixed it up and rented it for ten years or so and rode the boom ALL THE WAY up until we retired.I have collected fifty grand a bunch of times for a month of actual steady work- not immediately of course but over a period of ten or fifteen years as we divided the cash flow and then sold out.
That’s lawyer doctor engineer money with a pickup truck and a load of hand tools.
Good article by Reuters’ John Kemp
Breakeven and shut-in prices for oil wells: Kemp
http://www.reuters.com/article/2015/01/14/oil-shale-prices-kemp-idUSL6N0US33G20150114
On this average measure, the approximate wellhead price for North Dakota’s oil producers was just $38 per barrel on Jan. 12, making production in all peripheral areas of the Bakken play uneconomic and only marginally profitable in three core counties (Dunn, McKenzie and Williams).
For the first time, wellhead prices were no longer high enough to support new drilling in Mountrail, one of the four counties at the heart of the Bakken play.
Breakeven prices are also relatively high in the Permian Basin in Texas as well as in more peripheral shale plays with difficult geology like the Anadarko Basin.
New drilling in many parts of the Bakken, Permian, Eagle Ford and Anadarko plays will therefore stop unless wellhead prices recover.
This is a very good article that managed to negotiate the subject with no hint of positive or negative bias.
YO RON:
Output from existing fields around the world would decline around 9 percent per year in the absence of new drilling or other capital expenditure to increase recovery, according to the International Energy Agency’s World Energy Outlook 2013.
The IEA’s average 9 percent decline rate was calculated by analysing output from more than 1,600 conventional oilfields around the globe. Shale wells, however, exhibit much faster decline rates.
North Dakota’s Department of Mineral Resources estimates output from a typical Bakken well falls 65 percent by the end of the first year, another 35 percent by the end of the second, 15 percent more by the end of the third, and 10 percent per year thereafter.
In a world where the marginal barrel of oil is supplied by shale, rather than conventional fields, breakeven rates are critical to sustaining output levels even in the short term because the industry must keep drilling new wells simply to reduce the rapidly falling output from existing holes.
The remaining text says THIS REPORTER KNOWS HIS STUFF. This article is scrupulously neutral, mostly because he didn’t go making phone calls for quotes from hypesters.
We need to keep an eye on this Kemp guy.
His other recent article
COLUMN-Bakken oil wells and the Red Queen’s revenge: Kemp
http://www.reuters.com/article/2015/01/12/shale-output-northdakota-kemp-idUSL6N0UR2XA20150112
U.S. oil production will be falling by end of 2015: Kemp
http://www.reuters.com/article/2015/01/07/us-shale-drilling-prices-kemp-idUSKBN0KG1Y120150107
It is a very fine article. Well done Mr Kemp.
Output from existing fields around the world would decline around 9 percent per year in the absence of new drilling or other capital expenditure to increase recovery, according to the International Energy Agency’s World Energy Outlook 2013.
In the absence of infill drilling the decline rate would be 9 percent per year. I really don’t think many folks really understand what is going on here. Companies have become more efficient at pulling the oil out a lot faster.
Catton, in “Overshoot” put it something like this, from memory as I don’t have the book with me: It is basically the same thing as if you became more efficient at filling out withdrawal slips at the bank. You can now pull your money out a lot faster. But no new money has been added to your account.
No more oil has been added to the reservoir, they have just became more efficient at getting it out a lot faster. That is one of the reasons that I am absolutely convinced the we are well past 50% of URR and the downside of the curve will be a lot steeper than upside.
I think a plausible estimate for the gross decline rate from existing US oil production may be on the order of 15% to 20% per year.
At 15%/year, in order to maintain current production, we have to replace 100% of current production in about seven years–the productive equivalent of every US oil well from the Gulf of Mexico, to the Eagle Ford, to the Permian Basin to the Bakken to Alaska.
At 20%/year, in order to maintain current production, we have to replace 100% of current production in five years.
Ya, good call Jeff, and we can blame Shale for elevating so far above 9%. Those 65% year 1 smashes moved the total decline rate of the country higher and higher.
Hi Watcher,
For the Bakken as a whole the annual decline rate if all drilling stopped would be about 42% the first year. If we assume this matches the rate for all LTO output in the US and also assume LTO output is 3 of 8 mb/d, and further assume the other 5 mb/d declines at 9%, then US decline with no drilling would be 21% and Jeff Brown’s estimate was on the conservative side (if I understand gross decline correctly).
But it doesn’t make sense to accelerate rates when prices are climbing.
Hi Ron,
Jean Laherrere estimates World C+C URR at 2700 Gb, I believe that estimate is a little low (by at least 300 Gb), but if he is correct the 50% point would be 1350 Gb.
Currently cumulative C+C is about 1250 Gb or 46% of 2700 Gb, it will be 3 to 4 years before we reach 50% (assuming output stays around 76 mb/d for 3 or 4 years). I think you may ignore oil sands production and believe there is only 2200 Gb of conventional C+C (or possibly less), in that case you are correct that we are past 50% of conventional C+C at 57%.
An HL of the World conventional C+C points to 2500 Gb which would put us at 50% at the end of 2014. The hubbert linearization (HL) method of estimating URR has a tendency to underestimate the URR.
It takes more time to increase output from oil sands so I model this separately and use CAPP forecasts as a guide for Canadian oil sands and use Canada as an analog for Venezuela with an assumed 10 year delay relative to Canadian oil sands. Ignoring oil sands altogether (which is not what Jean Laherrere does), would tend to overestimate the rate of decline after the peak.
“I think you may ignore oil sands production and believe there is only 2200 Gb of conventional C+C (or possibly less), in that case you are correct that we are past 50% of conventional C+C at 57%.”
This is poorly worded. I meant that I think you believe that the URR of conventional C+C is 2200 Gb. Conventional means all C+C except oil sands from Canada and Venezuela (which Jean Laherrere calls extra heavy oil.)
According to this chart, unconventional resources are much larger than conventional resources.
http://en.wikipedia.org/wiki/Oil_reserves#mediaviewer/File:Total_World_Oil_Reserves.PNG
Your thoughts?
John B,
One possibility is that the diagram includes the oil shales in the Green River Formation, Utah/Wyoming. There’s no oil there, only kerogen, but they get talked about without that being understood.
Thanks. But I don’t think the Green River kerogen is being included. “Oil Sands” likely refers to Canada. And “Extra Heavy Oil” likely refers to Venezuela.
I guess the real question I have for Dennis, is why his URR numbers for unconventional oil are so low.
Hi JohnB,
Note that the chart you linked to divides oil into 4 categories. The way I define conventional C+C would include the conventional and heavy oil categories from that chart which would total 45%, of remaining URR, the other two categories taken together is what I call unconventional oil and is 55% of the remaining URR (RURR). My estimate is 1250 Gb RURR for conventional and about 500 Gb for unconventional (which is based on Jean Laherrere’s estimate). Jean Laherrere’s estimate of RURR for conventional C+C is 950 Gb. As I mentioned before there are many estimates of oil resources, most of them have conventional resources somewhat higher than unconventional.
Hi JohnB,
There are many different estimates, some of them include the Green River Kerogen deposit which is large but is unlikely to ever produce any oil, unless oil prices get to about $500/b. The processing is very water intensive and there tends to be water shortages in the area. Two doctoral theses one by Steve Mohr and the other by Cristophe McBride give a wide range of estimates for extra heavy oil from oil sands with a low of 660 Gb and a high of 2120 Gb, conventional C+C URR ranges from 2150 Gb to 3950 Gb. If we deduct the cumulative production of 1250 Gb, then the remaining URR is 900 Gb to 2700 Gb for conventional.
Note that the chart shows reserves, so depending on if you use remaining reserves and choose a low estimate for conventional and a high estimate for unconventional would make a difference. The remaining resources of conventional and unconventional are roughly equal, but I think there is a little more conventional that will ultimately be extracted, probably 1450 Gb of conventional and 900 Gb of unconventional would be my guess.
My thoughts are that the whole thing is bogus. They are counting all those OPEC Middle East reserves as real. Once you do that then the whole study goes down the toilet. Because once you start counting phoney reserves then who knows what else you are counting? It means you are just taking someone’s word for it.
I prefer the term “extra heavy oil” for both the Canada “Oil Sands” and Venezuela “Orinoco Oil Belt” hydrocarbon accumulations.
As it turns out the oil properties are similar. The difference lies in the viscosity and gas content at reservoir conditions, and the presence of a large outcrop area in Canada, which is missing in Venezuela (in Venezuela the oil bearing formation subcrops, and forms a wedge between the overlying seal and the underlying basement, although we do have oil on water in the down dip (north) sector).
I think it’s reasonable to state Venezuela’s extra heavy oil resources are overstated. And as far as SEC bookable reserves…they are a lot lower.
If you have any questions feel free to ask.
Hi Fernando,
You have said in the past that the Venezuelan Resources are estimated incorrectly, supposedly proved reserves are on the order of 250 Gb and the USGS estimates technically recoverable resources at 500 Gb in both Venezuela and Canada for a combined extra heavy (XH) oil TRR of 1000 Gb, the USGS also estimates conventional C+C (all but XH oil) URR at about 3000 Gb with remaining URR of 1750 Gb. If we assume that this is inflated due to phantom reserves in the middle east of 300 Gb (estimated by Jean Laherrere), that would still leave 1450 Gb of remaining URR for conventional C+C.
What would your estimate be for Venezuelan XH oil URR be if a government and laws similar to that of Canada was in power in Venezuela?
Dennis, it depends on the timing for the Canadian regime to be implemented. You see, at the current time PDVSA and its foreign partners are using practices which limit ultimate recovery to around 5 to 8 % of original oil in place. The problem (which many engineers have failed to understand) is water influx into the areas being produced . Once water gets to the producing sector the use of thermal methods is practically impossible.
This is something PdVsa either doesn’t understand or doesn’t care to learn. But Rafael wasn’t that familiar with reservoir engineering.
If the new areas are exploited in a similar fashion tgey will ruin the who,e thing. So what’s the timing? Communist dictatorships usually last for a while. In 25 years they’ll have gutted the high graded areas.
Did you mean to say “Canadian regime”, or “Venezuelan regime”?
Dennis had mentioned the varying estimates of URR. I guess I’m looking for an explanation for those large variances.
E.g. we know that the USGS has estimated proven reserves for Venezuela @ 513 billion barrels. And we know that proven reserves are generally much less than URR. Then we have this estimate from the head of Shell Canada for 2 trillion barrels URR from the tar sands.
http://www.cbsnews.com/news/the-oil-sands-of-alberta/
That’s over 5 times larger than the Laherrere estimate!
These heavy oil supplies do not need exploration. Everybody knows where they are. It should be a simple matter of taking measurements.
Why the big discrepancy?
Hi JohnB,
You are incorrect on the USGS estimate for Venezeulan extra heavy oil , it is an estimate of Technically recoverable resources (TRR), which is very different from proven reserves. Proven reserves are about 250 Gb and these may be overstated based on information from Fernando Leanme.
The USGS technically recoverable resource estimate for Canadian oil sands is also about 500 Gb. The mainstream media often gets this stuff wrong. Two trillion Barrels is the original oil in place (OOIP) in the Canadian oil sands, about 25% is thought to be technically recoverable by the USGS.
A detailed decline rate analysis can be found in IEA’s World Economic Outlook 2008.
The IEA found that:
1) Estimated production-weighted average annual observed post-peak decline rates for all fields worldwide: 6.7%
2) The production-weighted average annual natural decline rate for the world as a whole is estimated at 9.0%
“Observed decline rates are an important indicator of the performance of oilfields across regions and over time, but, by themselves, they do not reveal underlying trends in field production behaviour. This is because observed rates are heavily influenced by on-going and periodic investment in fields already in production, aimed at maintaining well pressure and flow rates, and improving recovery of oil reserves. In reality, few oilfields are left to produce without further field-development work involving significant amounts of capital expenditure once the initial set of wells has been drilled. This further investment can take the form of infill drilling (to target pockets of oil that prove to be inaccessible from existing wells), well work-overs (major maintenance or remedial treatments, often involving the removal and replacement of the well casing), secondary recovery programmes such as water flooding (the injection of water to push the oil towards producing wells) and gas injection and enhanced oil recovery techniques, such as CO2 injection. Such activities can arrest the natural decline in pressure and production from a field and may even boost output to a significant degree. It is necessary to estimate the underlying, or natural decline rate — the rate at which production at a field would decline in the absence of any investment — in order to ascertain how much capital needs to be deployed to sustain production or limit observed decline to a particular rate.
The production-weighted average annual natural decline rate for the world as a whole is estimated at 9.0% — some 2.3 percentage points higher than the observed decline rate for post-peak fields. In other words, the decline in production from existing fields would have been around one-third faster had there been no capital spending on those fields.”
That’s not surprising. I assume you guys realize those decline rates are engineered and economically jiggered to yield that value? We get more or less the design decline rate we wish to have. If you throw OPEC into the mix this brings the figure lower because OPEC nations like for oil to last and some want overcapacity.
Ah yes, a global choke.
Are you serious? Decline rates are engineered?
We get more or less the design decline rate we wish to have.
And just who the hell are “we”?
I have heard a lot of strange opinions on this blog but I do believe that one tops them all.
If I were doing the engineering I would engineer a decline rate of zero. Yeah, that’s the ticket. A decline rate of zero. That way the oil will last forever.
It’s not an opinion, just an observation. Petroleum engineers who are trained in the USA environment are less familiar with this issue, because they follow a rather old “spacing units” set of state rules. They get around the problem by drilling “infill wells”.
In many other nations, and in offshore fields, we draw up the development plan to achieve an optimum balance of rate, reserves, costs, operating costs, taxes, and risk.
The funny thing is that quite a few managers aren’t even aware of this process. But we do it, and if we get it wrong, what do we do? We “drill infills”.
As it turns out when we optimize developments in a “normal cost” environment we seem to gravitate towards 15 % decline factor. But we try to err on the conservative side, and later we can do additional work, and this drops the decline to the 10 % ballpark.
This of course is a global generalization. If you doubt it, let me ask you: what stops us from drilling wells spaced 50 meters apart? Or conversely, why not drill them 1500 meters apart? See? We drill wells at distances between those values. And eventually this leads to the optimum R/P ratio, which in turn dictates the decline factor. Easy.
Petroleum engineers who are trained in the USA environment are less familiar with this issue, because they follow a rather old “spacing units” set of state rules. They get around the problem by drilling “infill wells”.
The IEA report had nothing to do with USA trained petroleum engineers. I imagine most of the engineers were European. Fatih Birol the chief economist at the IEA, is Turkish by birth.
They are talking about the decline rate if no infill drilling takes place. That is the “natural decline rate” of existing fields. That cannot be engineered.
Alex Burgansky: Russian Oil and Gas Industry Surprises Analysts
There are plenty of projects in Russia, both, new projects and existing brownfield projects. Russia is a very mature producer. If you exclude all the drilling activity taking place every year, then Russian organic decline in production is close to 19%. To compensate for that organic decline, Russia drills somewhere between 5,000 and 6,000 wells every year.
That is what they, that bunch of Europeans at the IEA, are talking about, the organic decline rate absent any infill drilling.
Ron, the IEA staff doesn’t develop oil fields. They only analyse the results.
I’m referring to what goes on before a field is developed. A lot of what we have producing now was DESIGNED to behave the way it does.
In other words, in quite a few cases the number of wells, their design rates, and the facilities’ size is the result of the work we do during front end engineering.
Let’s take a case like say Kashagan. The field development planning work sets the well layout, and it also sets the facilities design basis.
Or we can move over to the Thunder Horse project. That project had wells designed to perform in a certain fashion. They may have missed their reservoir description and simulation, but it wasn’t drilled on 80 acre spacing. That would be unthinkable in today’s technical and economic environment.
I’m referring to what goes on before a field is developed. A lot of what we have producing now was DESIGNED to behave the way it does.
Really now? The IEA crew was talking about the decline rate of existing wells. Ghaway went on line 64 years ago. Most of Russia’s old fields went on line over 50 years ago. The decline rate was not designed into those fields.
Even Thunder Horse, though it very recently went on line, the decline rate was a whole lot steeper than they expected. The decline of Cantarell was much steeper than expected.
What they try to do is get all the oil out as quick as they possibly can. That is what EOR is all about.
No, you are simply mistaken. The decline rate of these fields was not designed into them before they went on line.
Ron, A decline rate was designed into those fields. As time goes by the rate is altered. But what I find is that it seems to drift back to around 10 % as a general rule. It has to do with sweep efficiency, project cost issues and economics. I worked in Russia and they did study these subjects in their somewhat primitive fashion.
And no, we don’t really try to get the oil as fast as we can. Its a lot more complicated than that. Fields which decline faster than expected have over estimated reserves. Like I mentioned, we also have to factor risk.
I guess the best way to put it is that we try to maximize present value. At this point we would need to get into what’s the best way to optimize a field development, including the appropriate discount rates. That’s a very controversial subject.
Getting the oil out as fast as they can was a figure of speech. But in the end that is exactly what they are doing. That is they try to get the decline rate down to zero. The Saudis got theirs down to between 2 and 3 percent. In Mexico they injected nitrogen and got Cantarell’s production to about double. What, I ask you, were they trying to do?
They want to get the oil out as fast as is economically possible. That is they don’t want to damage their fields but they want to do everything short of that to get the oil out as fast as they can. Of course they call it “increasing production”, they never frame it in terms of “increasing depletion”.
i think you focus too much on decline rate. A secondary recovery project is intended to increase reserves x amount, and of course it will alter the production curve. In some cases decline will reverse, production starts climbing, reaches a new peak, and then declines. I never heard of a project being designed to achieve “zero decline”. And eventually it will decline even if it has to hold plateau (say because of pipeline capacity limits). This eventual decline is designed, in the sense that it’s the result of the optimization runs. There is no such thing as “natural decline”. Mother Nature and us seem to combine to reach a figure. This figure seems to be a lot higher in some cases.
Let me ask you, what do you think happens to well rate abd decline factors if a set of 8000 ft wells are drilled 200 ft apart and each is given 100 frac jobs? do you think the decline rate will be similar to that of existing wells?
Ron, reference the zero decline rate, that’s not optimum. The idea is to get the oil and gas out.
Hi Fernando,
I appreciate the information.
I always wonder how this natural decline rate is determined, in many cases we don’t have access to individual well data and without this the job seems impossible. We have a lot of it in the US, Norway, and the UK. But I doubt there is good access to this data in Russia and certainly not in OPEC nations.
Do we know of many giant oil fields where all development has stopped? In those few cases we have, in the US, Norway, UK, and perhaps Russia most of those fields are very old. In general we find the “natural” or “organic” decline in old offshore fields is higher because they are abandoned earlier due to higher OPEX.
I don’t really think this can be estimated very well.
Better to look at regions that have started to decline and just look at the annual decline in output and maybe compare that with CAPEX in the region per barrel of output. In the real world there are not many examples of no CAPEX spending in a region that has been a major oil producer, though I imagine total CAPEX per year in a declining region decreases, I would think CAPEX per barrel produced probably increases as a country (or region) tries to stem the decline in output.
Dennis, we usually have huge data bases with each well’s production records. The data mining can be automated to get production versus cumulative, water cut, gas oil ratio, etc.
The well spacing is also dictated by R reservoir characteristics, continuity, thickness, things like that. It’s a bit of an art form, but some companies have very automated systems to allow full optimization.
To be fair he was quoting the IEA, so they were talking about “engineering the decline rate”. They perhaps should have added the words “to best balance the maximum recoverable reserves with commercial considerations”, ie a decline rate of 0 is impossible and even close to 0 is commercially not possible either (ie one bucket of oil per a year!)
The same words in English often mean something far different to people from different places in everyday life.
In professional life it is often noted that the same word is defined just differently enough by different people to create endless arguments involving data that both parties in the end agree mean the same thing or very close to the same thing.
No, you are confusing decline rates with depletion rates.
The IEA was talking about current decline rates under current conditions, with the current well structure. Of course you can decrease the current decline rate with infill drilling.
Of course everyone, the Saudis, the Russians and everyone else, wants their decline rates as low as possible. And they do that with infill drilling.
Saudi fields have a natural decline rate of about 8% but they managed to dramatically reduce that decline rate with infill drilling. The IEA was talking about that natural decline rate.
From 2006 Saudi Arabia’s Strategic Energy Initiative
• Without “maintain potential” drilling to make up for production, Saudi oil fields would have a natural decline rate of a hypothetical 8%. As Saudi Aramco has an extensive drilling program with a budget running in the billions of dollars, this decline is mitigated to a number close to 2%.
The IEA, in this case would have called the Saudi decline rate 8%. It was engineered to between 2 and 3%. The IEA was not talking about the engineered decline rate, they were referring to the natural decline rate.
I guess we do come from different backgrounds. I look at a field’s performance with a critical eye, as if I were judging a painting. If a field has no decline (meaning it holds plateau for an extremely long time) then I consider it a flawed product. However, that’s only applicable to a single individual field. In a case such as say Azerbaijan, the Williston Basin, the North Slope and other areas with a huge impact on the local population, then my sense of ethics tells me I should strive for a very long plateau rate. It depends on the circumstances.
Ron, there really is no “natural decline rate”. The decline rate is a result of the way the wells are drilled and produced. Consider what would have happened if we had developed Ghawar on 20 acre spacing with a five spot water flood. The “natural decline” would be quite different.
Okay, call it anything you like. The Russians called it:
If you exclude all the drilling activity taking place every year, then Russian organic decline in production is close to 19%.
On the other hand the Saudis called it:
Saudi oil fields would have a natural decline rate of a hypothetical 8%.
Call it whatever you like but they are talking about the decline rate their fields would have without an infill drilling program.
I guess LTO, bio fuels, tar sands, NGL and enough cash or credit to do enhanced recovery is all that’s between “enough” or a bit “to much” and 9% less C+C next year? A frightening thought! If Joe in the street could do basic math or use the calculator function on his zombie phone for something more than calculating the current size of K. Kardashian’s derriere he too, would be perhaps a bit …concerned.
Hi Philip,
Remember that the natural decline rate is the rate if all new drilling and investment in oil fields was stopped? Does that seem likely? At $30/b I suppose it could happen, but how long do you think that prices would remain at $30/b if output declined by 9% or more? My guess would be about 10 seconds or less.
Thank you Dennis and yes I did understand that. I was however previously under the impression that the depletion rate was in the area of three to five per cent and perhaps that is where it ends up at after new drilling and enhancement of old fields each year. Is this a correct or semi correct assumption on my part? Also, thank you for your work and the very educational and informative posts.
Philip, that figure is quite variable, and it seems to change. When prices are high we justify doing extra work to squeeze a little extra. When they go down then we do less.
What’s extra? Anything from drilling a well to pick up a little bit of extra oil from an area where oil isn’t being swept….to buying a bigger pump to get more fluids out in an old well making 96 % water. I can probably think of 100 things we do. Some are rate acceleration, some are honest increases in recovery factor.
Yes, it would fast fall even below 30 usd/b.
Hi Kam,
Yes decline would be very rapid, especially at $0/b, though I am thinking there would be oil shortages because output would also be zero. If we assume collapse, the decline rate will be infinite, as a vertical line has an infinite slope. Such scenarios are not very useful, except perhaps in a novel.
Hi Dennis
Not to nitpick but this is what we call a teachable moment for those who confuse paper futures markets with REAL day to day markets.
”but how long do you think that prices would remain at $30/b if output declined by 9% or more? My guess would be about 10 seconds or less.”
I am sure you meant the price in terms of the paper market rather than the real market when you said ten seconds.
No doubt the price would start up for future sales in your ” ten second” time span.
But the actual day to day price of oil sold on the open market TODAY would not budge at all TODAY. It would start moving up in a few days or weeks as the supply glut already in processors and distributors and retailers tanks gets sold down.
End users -actual customers – don’t give a damn TODAY about what oil is going to cost two years from now, or ten years from now.They buy as much as they want and can use today with maybe just a few people like me putting a few gallons into storage.Hardly any end users have any significant has any storage. The people who use a LOT such as airlines can hedge to lock in a price.
This comes back to the old supply and demand thing versus the market manipulators and speculators thing.
Ron is dead right when he says that demand from end users determines how much is sold and that producers supply that amount in the short term with storage smoothing the process a little.
I am absolutely convinced the ONLY way there is to control the price of oil is to control the SUPPLY of oil. This applies especially in the short term. I have not been able to discover a single case of a successful market manipulation of a commodity- one that stands my personal smell test- that did not involve the manipulator finding a way to control supply.
There are a few cases such as the famous Hunt brothers attempt to corner silver where the attempt to control supply by buying everything available up that generally failed- although prices can be driven up or down this way temporarily.
There is a diamond cartel that works- the cartel has diamonds in vaults out the ying yang.If those diamonds ever hit the retail market they won’t be worth peanuts given the supply versus the artificial demand whipped up by constant advertising by jewelers.
But oil and apples can’t be easily stored.
If the consumer won’t buy oversupplied oil or apples the price crashes until the consumer changes his mind and his behavior.When apples get cheap enough there is a market for them for horse treats and deer bait.
Thanks OFM.
That was a metaphorical 10 seconds. Note that I do not think, I said what the price would move to in those 10 seconds. Do prices remain fixed on spot markets? I believe that it may be somewhat like a stock market where there are bids and asks.
Let’s think for a moment about the price of Brent crude, which has become the world benchmark, my understanding is that real oil gets traded on spot markets, when the price gets to some low level there will be buyers that step in and buy the oil, this tends to drive the price up. So in my example, I expect that $30/b for Brent crude on the spot market would be such a point where the price would remain at this level for a very short time.
My price might be too high. If Brent oil were priced at $20/b, how long do you think it would remain at that level, I doubt it would be days or weeks.
I agree that the price will be determined by supply and demand, I doubt that the price of Brent crude will reach $30/b unless there is a severe financial crisis, World War 3, or Great depression 2.
Of course I understood you meant ten seconds metaphorically.
If I had read your comment more carefully I would have said the spot price might start moving up within minutes – if there was any way to convince oil buyers on such short notice that production really did go down that much that fast.
So I am somewhat red faced at the moment. Sorry I failed to pay closer attention.!
The phone ringing or something is enough to trip me up these days when it comes to passing the time posting comments. Between comments I am working on something else.
Maybe I tend to want to over simplify these things given that I used to explain things for a living to kids.There might be a few kids reading this blog. I am sure a substantial number of people read it but never comment. My comments may help them towards a better understanding of markets.
Insofar as supply and demand and price are concerned there sure as hell are millions of well educated adults ( NOT YOU !) out there who understand these things about as well as I understand Chinese script – which is to say not at all.
These pedagogical rants are directed at any body interested who has not actually studied the dismal science in a classroom run by an actual economist. I suffered thru that back in the dark ages.My course work required some classes out side my core area and econ fit the bill. A glance at the chapters on supply and demand in a current textbook indicates they are still teaching the same basic theory the same way.
It the price declines to thirty bucks it will stay at thirty bucks on the instant cash market until somebody figures out how to take delivery of MORE actual barrels being produced and put them SOMEWHERE off the premises of the well site where they originate. OR until producers quit offering it for sale at thirty bucks. That would necessarily mean somebody ( lots of somebodies ) has cut back production enough that buyers can no longer find oil enough to meet their needs at thirty bucks.
The spot price won’t go back up until MORE oil is being actually sold in the very short term or until the producers cut back on the amount they are TRYING to sell very short term.
This is snapshot or freeze frame out of a movie type description of a market. Some things are always changing at least a little and the price can move some with these other changes. Just not very fast.
If the well operator cannot get rid of his oil PHYSICALLY he HAS to stop pumping when his pipeline backs up or his on site tanks are full and his trucks are all loaded sitting someplace waiting to be unloaded..
He can’t just pump it and let it run off across the ground or float away on the water.
I have been in possession many times of excellent quality produce that market owners or wholesalers would gladly buy if only they had cold storage space available to hold it until the price went up.
But they wouldn’t buy at ANY price unless they had space for it. To put it bluntly they would rather it rot in my possession and keep their money.
No buyer is going to buy physical oil that is stuck someplace in the distribution system hoping the price of it is going to go up at even a nickel more than the current spot price – when he can get it AT the current spot price.
UNLESS the potential buyer has a place to put the oil or another buyer lined up at a profit without even taking delivery he remains a potential rather than an actual buyer.
There is a possibility I am making a fool of myself but these remarks are consistent with textbook supply and demand theory.
They are also consistent with the vast bulk of real world experience.
Now if the Saudis were to come out and announce tomorrow at noon gmt that they are cutting shipments three million barrels a day as of one pm tomorrow GMT – that would be enough to move the spot price starting in mere minutes. People all along the supply chain would by dint of great effort find a place to put a FEW more barrels in storage in anticipation of the price going up.
Major end users such as retail chain convenience stores would burn up the phone lines trying to get a few more truckloads into their store tanks. The local wholesale distributor who supplies the retail chain would likewise be on the phone asking for more product knowing he is going to have room for it by the time it can be delivered.
The phones will be ringing all the way back to refineries and pipelines and people will be asking for more product as soon as they get the news. Only a little more at first.
There will always be SOME time lag in price reactions to changes in supply and demand. It might be as short as minutes or as long as days or weeks in a commodity market.
End users such as yours truly would find a few more drums to fill up with diesel and a few homeowners would call their heating oil man and order a delivery immediately to avoid the extra dime or twenty cents in price next week or the week after.
And for what it is worth- my guess is that if the Saudis really did cut sales by three million barrels a day starting tomorrow- the price would go up ten bucks within a day and back to ninety or hundred bucks as soon as the glut cleared.
These remarks are not consistent with the thinking of people who believe the world is run by unidentified people who somehow manage to mysteriously control the biggest industries in the world in ways contrary to the interests of the OWNERS of these industries.
People will continue to believe what they wish to believe no matter how unlikely .
I have met plenty of people with advanced degrees ( from institutions with better reps than the land grant university ” cow college” I went to ) who believe things that are known to any physical scientist to be physically impossible.
Hi OFM,
Thanks for the lesson. I am thinking the spot market for Brent crude might work more like trading a share of stock, where the price can change quickly as millions of buyers and sellers trade.
However I have never traded in commodities. So I may we wrong and it might take days for the price to change.
http://www.eia.gov/dnav/pet/pet_pri_spt_s1_d.htm
Based on data from the EIA ( see link above) it looks like spot prices change at least daily.
Watcher,
Kemp publishes frequently at Rigzone.
Good article. There may be some objection to calling artificial lift a secondary recovery technique. Other than that it’s a very condensed lesson.
Anyone care to take a stab at explaining this graph for me:
http://research.stlouisfed.org/fred2/graph/?g=Xc8
I wish the data went back further, but has oil volatility like this ever not been associated with high stock market volatility?
Hi Sam,
As a wag, this chart seems to suggest that crude oil volatility has less influence on stock market volatility today than over the 2008 to 2012 period. It is not clear to me why this would have changed, except that in the past OPEC has tried to act to stabilize prices, by decreasing output when prices fell.
The last time Saudi Arabia chose to to cut output in response to falling prices was in 1986 when they got tired of other OPEC members cheating on quotas and wanted to increase their market share.
The last time Saudi Arabia chose to to cut output
Sorry that should have been
The last time Saudi Arabia chose not to cut output
To clarify slightly, from 1985 to 1986 the Saudis increased their production, from 3.8 mbpd in 1985 to 5.3 mbpd in 1986 (total petroleum liquids + other liquids), after having previously cut production, relative to prior years.
After accounting for consumption, they put another 1.4 mbpd of net exports into the export market in 1986, versus 1985, an increase in Saudi net exports of almost 50%, year over year.
Thanks Jeff,
It was not that the Saudis did not cut, they flooded the market to drive prices down. This is very different from today. I do not believe Saudi Arabia has the capacity to increase production significantly (or maybe not at all) today.
I appreciate the correction.
http://en.wikipedia.org/wiki/Iran%E2%80%93Iraq_War
Read between the lines. 1986 was the year it became clear the US was going to actively support Iraq. Also in 86/87 (the decision coming in 86) the US agreed to reflag tankers to the US flag and have more flow come out of the Gulf because their flag on tankers precluded the tankers being hit.
Also, there were military tactics changes in this time frame as counter force doctrines were forced on Saddam by his generals, lessening concentration on oil flow from both countries.
And also, the Iranians were losing fervor. War weariness setting in. The first talk of ceasefire started in 1986. It was actually put into effect in 88, but the markets were watching potential and day to day flow. This entire oil event was war driven.
“BP sees $50 oil for three years……….So plans that it had already initiated to reduce costs have taken on a new element, namely postponement of investments in new capacity that have not been started, and shelving of plans to extend the life of older fields where residual oil is more expensive to extract.”
http://www.bbc.com/news/business-30827910
Lesson:
You can go from normalcy to Apocalypse in a shockingly short period of time.
Personnel layoff tactical commentary.
Saudi output increased from a low of 2.3 mb/d in August 1985 (monthly average) to 6.2 mb/d in August 1986, almost 4 mb/d in a year! This had little to do with the war between Iran and Iraq, Saudi Arabia wanted market share and increased production to drive the high cost producers out of the market, it has the possibly unintended consequence of hurting the Soviet Union and along with other factors led to its break up.
Dennis,
I was thinking along the same lines, I was wondering why they;ve decoupled. I figure that if it really is oversupply at the moment, then that makes sense, as the last two spikes of volatility in that chart are related to the financial crisis and arab spring. Perhaps this time there’s nothing to spook the markets, since they currently see low oil prices as generally good for business.
I wish the time series went back to the 80s so I could compare with other positive supply shocks.
Hi all,
I got updated data from Enno Peters. Thank you Enno.
There were 109 wells which started producing in the Bakken/Three Forks formation in Nov 2014, there were also 68 confidential wells which started producing. If we assume 95% of the confidential wells were Bakken/Three Forks wells, then we need to add 65 wells to the 109 wells we know for sure are B/TF wells.
I would estimate 174 new wells started producing in the Bakken/TF in Nov.
For all months in 2014 the new wells added each month are below, July to Nov are estimates.
Jan-14__111
Feb-14__146
Mar-14__151
Apr-14__182
May-14__208
Jun-14__182
Jul-14__193
Aug-14__211
Sep-14__196
Oct-14__191
Nov-14__174
Dennis, with that many new wells in October and November, how do you account for the almost no increase in production over those two months?
Hi Ron,
There is variability from month to month in the average output per well, it might be that those months saw relatively poor wells, or it could be that the average new well output is starting to decrease (estimated ultimate recovery is decreasing). It is too early to tell which it is in my opinion. If new wells added decreases by about 10 each month until 130 new wells per month are reached in April 2015 and then the wells added remain at that level until 2034 and prices start at $50/b in Aug 2015 and then increase 6.2% annually, we get the scenario below.
The model is a little on the low side for the past few months, indicating that well productivity may have increased relative to the average 2010 to 2014 Bakken/Three Forks well, for November this might be the increased well productivity that Rune Likvern and Ron had expected. I will leave my average well profile unchanged to see if the actual data falls back towards the model over the next couple of months. For November the model is about 50 kb too low (4.4%).
Correction, model is 64 kb/d low in Nov 2014, which is 5.4% too low.
What’s the water disposal cost range? Maybe the price induces some shut in? Sheer speculation on my part.
Hi Fernando,
The model is not that sophisticated that it can guess when wells will be shut in for water disposal costs. Wells get shut in at 5 b/d, just an arbitrary figure and water cut does not get included in the model (I only got access to water cut data recently). The model is predicting lower output than the actual output data, so I don’t think wells being shut in would cause the overall output to increase and this seems an unlikely explanation. Perhaps there have been a few months of very productive wells or some technological improvement I am unaware of.
If data shows 5 b/d shut in, that’s $100/b levels.
Increase by factor of 3. 15b/d.
Hi Watcher,
The data shows wells producing all the way to 1 or 2 b/d, the newer wells may behave differently, and the model is affected very little over the near term by this change from 5 b/d to say 8 b/d.
Perhaps Fernando would have a feel for this, or ManBearPig might know. At $33/b at the wellhead at what point would a well be abandoned, 7 b/d, 10 b/d?
BTW I tried the model with wells shut in at 8 b/d, it really doesn’t change things much. Also the model assumes that prices rise. The average well does not reach 8 b/d for 23 years, for a 2008 well that would be 2031 when prices will be $125/b, so the 5 b/d is pretty conservative as that will be in 2038 when oil prices are $191/b in 2015$.
When the well is shut in in dependent on total oil production as well as total fluid production. At 7-10 bopd what type of water production is expected?
Hi ManBearPig,
Probably about 7-10 bwpd at 7-10 bop.
7-10 bopd, forgot the d.
Unfamiliarity with site and was posted on older thread, but would like to see if there is any input:
Forgive me if this has been discussed; Who are the backers of the hedge positions ? Are they strong enough to survive several months of being on the wrong side of a huge move? I remember just a few years ago that some companies hedged in gas positions were left naked due to insolvency of companies guaranteeing the hedge.
These positions must be billions in the red.
Consensus is most claimed hedges are hype and not real. In general, in this situation, you don’t need to look for additional sources of company losses. They are losing money hand over fist without taking any steps at all to accelerate it.
The hedges are real. Oil company, producer of oil, sells 100,000/bbl day of future production at $90/bbl. Market makers find users oil that want to lock in a price. And, yes, some might be speculating. But, nobody takes on billions of $’s of naked risk. If you hedge using NYMEX contracts, the exchange marks-to-market your position every day, and issues margin calls to ensure equity in the contracts, and the brokers use your financial credit to limit the number of contracts you can trade. And, over-the-counter traders are, if anything, more strict. Miss ONE margin call (must be wired in 24 hours) and your positions are immediately liquidated.
Not real in the context that they are lying. They didn’t actually hedge.
“Consensus is most claimed hedges are hype and not real.”
Gosh aren’t hedges the guarantees that help those guys use to get credit lines. Could hedges be the “Credit Default Swaps” of this Crash.
I speculated on there simply being outright oil price covenants in the lines of credit. MUCH easier than having a lender demand that a borrower do hedging.
My understanding is that a large portion of hedges are bank required. I see no other way that drilling could go on and credit extended without those guarantees.
Okay wait a second guys.
If these alleged hedges were all in place, you do realize it’s zero sum? If they hedged themselves to kingdom come, it means they weren’t making any money selling oil at $100/b. A hedge that guesses wrong loses money. They were wrong for 2 years.
Even airlines don’t do all that much of this stuff anymore.
Watcher, I really don’t think you understand hedging. Hedging is a way a producer can get a guaranteed selling price or a consumer can get a guaranteed buying price. It can be done with either futures or puts and calls on futures. They must pay a fee for this guarantee of course but that is all figured into their budget. It is just a way to guarantee they will not go bankrupt in the event the market suddenly turns against them.
A hedger, when the market does not move against him, or guesses wrong in your terms, loses the extra profit he would have made but he does not lose money. A hedger that hedges with puts or calls, and does not have the market move against him simply loses the price he paid for the puts or calls.
Hedging is stepping down a rung or two on the risk-reward ratio. It is avoiding taking a gamble in the market, making sure you make a smaller profit but relinquishing the chance of making a huge profit in the market.
It works.
Watcher – BINGO!!!!! Hedging is a zero sum game. It takes 2 parties. Essentially one party is betting that the price increases and so buys to lock in a price. A seller thinks it is a good price right now, and sells at that price.
It is exactly the same thing as betting on a football game. You bet on Seattle, and the other person bets on Green Bay. Winner gets $10, loser loses $10. Does your bet affect the outcome of the game. No. Another zero sum outcome.
That is why speculators/investors maintain that hedging, or even just any trading on the NYMEX, has no effect on prices. You and I could do a hedge, if we agreed to. Say I think oil is going up and you think it is going down. We will agree on a starting price – say $47. We make the bet on one million barrels [since we both a very rich]. Does that bet affect what buyers and sellers pay each other for crude? No. But, if our bet is disclosed publically and you are a genius that everybody respects [like Buffett] and I am a total idiot [like Joe B], then you might influence people to put off purchases and wait for lower prices (which might lower prices). The NYMEX publishes info on broad groups that shows which groups are either net short or net long. But, in total, for every long there is a short. If not, there is no “trading.”
haha conflicting replies!!
Nah, I ain’t gonna do a Black Scholes lecture here with premium loss to zero.
Bottom line: the hedge talk as salvation of oil companies in January is probably bogus.
Watcher, I know what hedging is. I was once a commodities broker. You can hedge with futures or you can hedge with options. Hedging is not a gamble, it is the exact opposite of a gamble. It is the producer choosing not to gamble on whether the price of his product will rise or fall.
Hedgers do not lose money. Their hedge is what prevents them from losing money. They may not make as much money as they would had they not hedged. But on the other hand they cannot lose their shirts either. In fact, if they are hedged they cannot lose at all. That is why they hedge!
As far as it being a zero sum game, all futures are a zero sum game. That is for every dollar lost another dollar is gained. But that is all beside the point.
There is no reason to believe that producers are lying about hedging. Why would they do that. Everything must be reported in their quarterly report. If they lie there they go to jail.
Hedging started with the futures market. Farmers simply sold their crops in the future, guaranteeing them a fair price for their crops. That’s how the futures market got started. There were hedgers and there were speculators. The speculators bought the farmers crops well before the crop was harvested. The farmers were guaranteed a fair price for their crop but gave up the opportunity of windfall profits is the price of their crops went through the roof. The speculators got that chance to make a huge profit if that happened. Or they took the chance of losing their shirts if the price went down. That is hedging.
But hedging can also be done with options. Mexico hedged their entire production with options. I could explain that to you but it would take a while. But hedging with options is different. But there is absolutely nothing difficult about it. It is just so damned simple. I am at a loss as to why you cannot understand it.
Hedgers never lose money. That is why they hedge.
There is nothing wrong, or underhanded, or dishonest about hedging.
One more point. You cannot hedge after the fact. Once the bottom has fallen out of the oil market, as it recently has, you are stuck with that price. Companies may have hedged when prices were high but now that they are low, they are stuck with low oil prices. They will have to succeed or fail with low oil prices.
I don’t know how this became a focus.
If a producer expects to make $XXX dollars running his business, and buys futures OR options to an amount that the sum total of his premiums (paid above strike) plus commissions EQUALS the $XXX dollars he expected to make, then if the option expires worthless he made $0.
If he buys an amount of “insurance” such that the out of money premium plus commissions EXCEEDED the $XXX he expected to make, then clearly he loses money if the options expire worthless.
It would be stupid to insure the total $XXX he expected to make? Who knows? There isn’t anything magical about portfolio insurance. If the price goes in his favor, he scores big on the option and doesn’t make $XXX on the product — in fact he may produce at a loss. If the price goes against him, then maybe the XXX overwhelms the sum of his premiums and commissions.
But one can certainly lose money if nothing moves or doesn’t move enough. Then, as just noted, the sum of premiums and commissions expire worthless and offset the $XXX he expected to earn, and maybe exceed it.
You know what, I think you understand this. I don’t know why this is an argument. The executives can say “we’re hedged, we’re not getting hurt that badly” and do not specify a number. They can’t be sued if they were hedged $1000 in total and are looking at $200 million per quarter loss. A lender might want to see the numbers, but the lenders are the HY paper public. The underwriter himself may not want to see that number. They know they are going to pass that paper on to the greater fool.
Ron. A producer can lose money on a SWAP or a cost less collar if the price goes up and the producer does not produce the number of hedged barrels. I think it would be tough to hedge shale production due to its high decline. What if these guys have to stop drilling now. Oil spikes to $150 in the summer and they are short barrels because production has fallen off a cliff? The irony of that huh? Don’t think it could happen? Wait until rig count has dropped and everyone has been sent home. Then OPEC announces a mammoth cut just as North American production is dropping like a rock. KSA gets their $100 per bbl average for the year and still hammers the shale and tar sanders. May not happen but who saw $40 oil in June, 2014? Shale guys really have to stay on their toes re their hedges. It is not a simple thing to do.
Didn’t mean for last post to be anonymous.
The opposite side of the hedge is usually taken by speculators, there are thousands of them. And Cludless is correct. The broker that handles the hedge makes sure that the money is there. There is no danger of those holding the losing side of the hedge not paying off. Usually the hedge is rolled over all the way down. That is if a speculator lost a bundle his position is closed out but someone else picks up the contract, or “a contract” on the way down. If his position gets closed out then it happens all over again.
I doubt there has ever been a case of a hedger not being paid the full amount of his contract.
“I doubt there has ever been a case of a hedger not being paid the full amount of his contract.”
I have heard anecdotal stories from fellow operators but have none publicly ducumented. I do believe there may be farmers still trying to retrieve monies from hedging with a New Jersey politicians firm.
I have never heard of hedging through a politicians firm. You hedge through a reputable broker, Merrill Lynch, Charles Schwab, etc. A brokerage firm must be registered with the Securities and Exchange Commission. And I am sure there are other big firms that handle hedgers. If there is a case of non payment to a client they lose their license and the case is settled in court. Their assets would be liquidated to pay their debts.
Google Jon Corzine Ron. Think blow up of his firm is what is being referred to. Think was considered reputable prior thereto.
Now that’s a good call. That was probably the politician in question.
Very interesting commentary in the Summary of Weekly Petroleum Data for the Week Ending January 9, 2015
http://ir.eia.gov/wpsr/wpsrsummary.pdf
U.S. commercial crude oil inventories (excluding those in the Strategic Petroleum
Reserve) increased by 5.4 million barrels from the previous week. At 387.8 million
barrels, U.S. crude oil inventories are at the highest level for this time of year in at least
the last 80 years.
It is starting to feel very “toppy” out there. Could this be the crescendo, the last hurrah before we role off Hubbert’s Peak? Could very well be.
The juxtaposition between the production/export data as I believe it to be, versus the rhetoric from producers, global oil supplies and price has my head spinning.
If I had to guess, I think we are seeing the intersection of peak production, with an economic slow down in Europe and Asia, combined with the retirement of the baby boomers in the west, combined with fuel efficient technologies that have been introduced into the market over the past decade–listed in no particular order. It is very interesting out there!
Best,
Tom
I also suspect that condensate, as a percentage of Crude + Condensate (C+C) inventories, is at an all time high, but we don’t have any Condensate to C+C Ratio data.
To get some idea of what is happening to the US inventory, one should check Line #5 in the report, “Imports”. Last week imports were up 633 kb/d over the previous week. In other words companies imported an extra 4.43 M bbls of crude into the US last week. That alone accounts for 80% of the 5.4 M bbls increase.
Is this increase in imports due to companies taking advantage of buying cheap crude? Also could it be SA stuffing their storage in the US with extra crude to make it look like the US is over producing.
I don’t fully understand the press’s fascination with inventory increase since it is just the difference between what goes in and what comes out and easily manipulated, i.e. put more in or take more out to affect the price. The press seems to interpret inventory change as a measure of demand. On occasion they mention product supplied as an indicator of demand.
http://www.bnsf.com/about-bnsf/financial-information/weekly-carload-reports/pdf/20150110.pdf
BNSF shipped 995 more carloads of petroleum in first week of January 2015 than the first week of January 2014, ending day 10. Must be because of more demand, has to be.
Clouds cover most of northern Europe and Great Britain. Cloud cover all north of the Black and Caspian seas. Spain’s east coast was clear and the Mediterranean was mostly clear today. There must have been nice weather in Italy and Greece today, wine, cheese, and sardines all day long. The Pyrenees, Alps, Caucasus are all snow covered at the peaks. All of north Africa was clear, few clouds, good view via satellite, the Nile is visible all the way from the Blue and White down to the delta. The sun’s rays were reflecting off the south Atlantic in full force at noon utc, right in line with the Tropic of Capricorn. A great sight to see. Sunshine night and day down there in Antarctica, one degree Celsius 24/7 along the coast.
From a distance, all is well.
Mistake in the subtraction.
Correct amount is 555 more carloads of petroleum.
My recall is that data only goes back a month or two. Did you keep last year’s numbers?
And there was also an issue of carloads being variable. Not all cars carry the same amount of oil or gasoline.
Here are updated charts of weekly BNSF petroleum and sand/gravel carload counts, going back to 2010, pulled from the weekly reports the railway publishes. Petroleum has clearly started to trend downward, essentially confirming reports I have personally heard from BNSF employees in the Upper Midwest about crude-by-rail terminals in the Bakken loading and sending out trains at a substantially slower pace than in the past.
BNSF also services, or takes oil from, a number of crude-by-rail terminals in the Niobrara and Powder River region of Wyoming and Colorado, but I have no information about what kind of activity those loading sites are experiencing these days.
Sand/gravel carloads have trended downward significantly in the most recent data, but there is typically a sharp, albeit temporary, downward swing in those commodities around the first of the year. We will need to wait a little longer to see what happens to these counts.
Finally, there is a picture I took on Sunday of a unit frac sand train heading west through central Minnesota on its way to the Bakken. These trains can carry roughly 20 million pounds of sand, give or take a few million. That much sand is perhaps good for no more than 6-8 Bakken wells, although if the sand is to be used in one of the slickwater fracs several of the Bakken operators prefer in order to obtain higher production, the train may only be able to supply two wells, if that. EOG made news last year by drilling a well that required one entire unit train, plus a portion of a second, to be completed.
Good man, Wes.
Wes, I was wondering where you found this link?
https://docs.google.com/spreadsheets/d/10hcJcjLZqo7FQFUVO3mIQ-BW_RIsYv6_N-P1tp_jabc/edit#gid=2089753361
Will it work same time next month after the December data comes in?
That’s my own work. I’m sharing it with Peak Oil Barrel. 🙂
December will be there. I am usually able to update everything on the day that new data come out.
Thanks!
The PDF shows four columns. Column one shows the goods hauled, coal, oil, motor vehicles, etc.
There are three columns of numbers. The first column is for the year 2015, the second column is for the year 2014.
Number of cars of petroleum is 10,550 week ending January 10, 2015.
Number of cars of petroleum is 9955 for week ending January 11, 2014.
10 550
– 9 955
= 595 more cars in week 54 ending January 10, 2015
Made a subtraction mistake twice now, wrote down one wrong number on the piece of paper. Used a calculator the third time and now the number is correct.
Happens all the time, don’t sweat it.
Well, when I was in the alps the other week the skiing was terrible, so it’s not all roses.
I’ve seen various places quoting US gasoline demand as being up about 7% yoy in December. Pretty big leap.
http://www.howardweil.com/docs/Reports/WEEKLY%20REPORTS/REFININGReport.pdf
OT… Does anybody have an experience with heat pumps, especially in the Pacific NW?
TIA
Rat
I don’t know where Wimbi lives, but I would bet he knows a thing or two about heat pumps.
I for one would be interested in the subject, but am not sure if Ron wants technical discussions on heat pumps here.
I live 40 north in the hills near the Ohio valley I have a Mitsubishi mini-split heat pump I put in myself in one morning. I use it to keep our well insulated essential two rooms cosy. It works just great, any time. Even when it was quite cold outside- about -15 C- a few days ago, it put out a nice quiet warm breeze during the night when I preferred to stay under my down comforter instead of sticking a couple more sticks into the wood stove.
but I have to say that this heat pump thinks it is in Portland OR, the ideal heat pump heaven, since I put it on top of a big cistern and it pulls air up a chute from a more or less constant +12/15 C big hole winter and summer.
Heat pumps have come a very long way very recently and I highly recommend this one or similar. I drive it with my PV, along with all other house stuff and the car.
As I have said, I went all solar a while back and am not feeling any sort of pain about it at all. In fact, we feel FAR BETTER off in any way to measure it.
Except the pain I feel when I hear factfree chatter here and elsewhere on what a grievous pain it would be to get off ff’s and on to solar. What a pain.
My wife really loves that induction cookstove. So do I. When she is not looking, I can sneak an egg, bring a little water to a boil and get a really good softboiled snack in no time, perfect!
BTW- I got the hint for the mini-split from Here- in-Halifax, the professional HVAC guy who used to give helpful posts on good ol’ TOD. He said his heat pump worked in Halifax, a way harder place than here. And I don’t think his was sitting on a nice warm hole in the ground.
My year’s electric bill was -$250 from that coal-fired power company. I think they are doomed, and I’m doing my best to help.
Hi Wimbi,
Thanks. Are you still in touch with Here-in Halifax? I loved his comments at TOD, it would be great to hear from him here.
Lost track of HIH along with a bunch of other good people. Thanks to Ron for giving some of them a place to get back together somewhat.
On that point, can anyone suggest a place for me to go to talk with other JustDoIt types? I mean the ones who need no convincing that they just have to do their damndest right here and right now, and no fussing around with nonsense talk about energy return in the form of the very same crap that we are using the crappy energy we have to get off of to get off of?
Wimbi
Not really an answer to your question, but I just ran across these folks and I thought you might find it interesting.
http://www.rootssolutions.org/
They’ve got a nice wood to juice machine made from a junked Prius. We have a lot more wood than sun in this part of the country!
Walter
Wow! This is EXACTLY the kind of people I am looking for. They have already gone down the road I am walking, and the parallels are astonishing- same philosophy, same motivations, even same hardware.
But, real big but- their team is a light year ahead of my bunch of local junk bangers in formal education. My guys are smart, energetic and highly skilled at what they do, but seemed to have missed entirely any taint of math or science.
Amazing to me that somebody with a good head can get so far thru life and not really understand anything about a chemical reaction.
I love your attitude wimbi! I am currently renting (recently made a move across state lines). But once we settle in, I am following your lead!!
Best,
Tom
WR,
I know a thing or two about heat pumps and my region is far northern CA/ southern OR, , so it’s a kinda Pacific NW-ish experience. What’s your question?
I can vouch for Wimbi that inverter-driven air-source heat pumps are the way to go anywhere that outside air temperatures don’t drop below zero F, though some have operated as low as -10 deg. F. Mitsubishi, Fujitsu, Daikin, LG, all have good equipment. Most are ductless, but I’m experimenting with a relatively new concept – mini-ducted – at my house – it gives ductless quiet efficiency with the advantage of having the fan equipment above the ceiling and uses conventional supply and return grilles, which makes it look more conventional.
It’s becoming harder to justify ground source (AKA geothermal) heat pumps, as the drilling cost can double the installed cost vs inverter-driven air source mini-splits and the performance advantage becomes less and less in moderate climates (winter 24-average air temp about 40 deg. F or so).
Inverter heat pumps don’t need electric resistance backup heat. They just work harder to make heat as it gets colder. Std. heat pumps do need back up heat.
Another option pioneered in OR and WA is “dual fuel” that use a heat pump/gas furnace combo where the gas furnace is only used for those really cold days when conventional heat pumps just can’t keep up (below 35 degrees F). These have an outside air temperature sensor that switches the system to heat pump once the OAT warms up a bit. I know Carrier and Trane have this option. We’ve set up several schools in the Siskiyou mountains of CA near the OR border with dual fuel systems. More “conventional” than the inverter mini-split systems coming from Japan and Korea, so the maintenance staff understands them better.
Is the lifespan of these roughly 10-15 years like an HVAC unit, or oars they in some way more durable?
Possibly longer if the Capacitors don’t dry out. They do not cycle ON_OFF . Spend extra on a quality unit. Mount the compressor unit high on an outside wall, wall up north, North wall down south. Buy an optional Wall kit, it has noise isolators. The condenser fins are fragile and easily damaged. Clean them annually.
I’d stay away from the Multi-Head units. Single failure point and lower efficiency. The Fujtsu 12RLS-S2 is king of the hill right now, 27+ SEER. This unit has relay input for OFF-Grid use Load management is critical to keep in the top 20% of Batteries and primary Run 90% or more on low cost PV Power. Battery power is costly. It would be great if someone would make a unit that would also run 300-500Vdc direct from a PV Array. Oversize the PV Array to run on cloudy days and forget Batteries. Power input varies from ~280 – 1500 watts.
Use one of these Protectors on the 230/250V Input.
http://www.midnitesolar.com/productPhoto.php?product_ID=601&productCatName=SPD&productCat_ID=23&sortOrder=1&act=p
Hey there HVAC man,
Can you explain to us what is meant in by inverter driven in terms of a heat pump ?
Thanks!!
OFM,
This may help
http://en.wikipedia.org/wiki/Air_conditioner_inverter
and this is the heart of the matter
http://en.wikipedia.org/wiki/Variable-frequency_drive
Well, it’s not for me, so I’ll post my Seattle friend’s concern…”The issue I am having is that heat pumps typically are used in warmer climates. However, they have come up with new pumps that do better in more moderate and even colder climates. Seattle has a moderate climate………SF even more moderate. I am just curious as to how effective they are in those climates. One type of heat pump actually shuts down when it gets too cold………they require a back up system to keep the home heated. However, newer models are reported to keep working even in temps as low as -15º F. I am trying to find someone who has actual experience with those models.”
If Portland is heat pump heaven, as Wibi says, he should be OK.
Thanks
Mike
Mike,
The DOE tested the Fujitsu 12RLS and it “worked” down to -5 deg. F as specified by Fujitsu and put out 12,000 BTU/hr of heat. At 50 deg. F OAT, it could put out 20,000 BTU/hr. The COP was about 2.0 at -5 deg. F. Depending on heating load, it rose to between 3 and 5 at 35 deg. F. The new high-efficiency 12RLS2 probably has even a higher COP.
Compressor warranty is 7 years. I don’t have enough long-term experience with them to say what the actual life may be on those, but my general experience with compressors have been that frequent start-stops and running at high speed and load is what really wears them out. These mini-split variable-speed compressors don’t start/stop much, they just mosey along at low speed except during peak heating/cooling load times and defrost cycles. they sure look to me that they’ll last a long time.
That does get to the issue of equipment sizing. The rule of thumb lately with conventional single-stage AC and heat pump equipment has typically been to “right size” and not “oversize”, which helps reduce the start/stop issue. But with inverter-driven equipment, a little oversizing just gives you even more efficiency, as the unit self-tunes and operates a little slower.
Hope this helps,
Keith
That’s all interesting, some things to look into
Thanks!
I am the person for whom wharf was asking about heat pumps. Thanks for your post. I will check the one you mentioned. Again thanks.
Okay, I need some good advice from an HVAC man!
Our heat pump (a Coleman, 30+ years old) is about ready for replacement. A HVAC guy said it would cost some $20K to buy enough mini-splits for our house (1500 square feet under A/C in Austin, TX) versus some $7K for the most efficient Carrier conventional air-source heat pump. Is that right, or is he over-estimating the cost with mini-splits?
a bit off topic, but did anyone else see this?
3-D printing of car bodies
http://blog.caranddriver.com/made-in-detroit-local-motors-printed-a-car-at-the-auto-show/
I think for Bakken, what is really interesting now is how much the companies can increase production per well by only drilling in the best locations. So I put together a graph showing the distrubution for 5,5 moths cumulative production. Yes I used sales here also which I wrote should not be used for calculating cumulative production. But I checked and for the first 5,5 months of production it is only about 1% bellow the value when not using sales. So it should be ok.
The average first 5,5 month production is about 51.000 barrels. That should correspond to an EUR of 320.000 barrels. It should be ruffly proportional to EUR. So 100.000 barrels gives an EUR of about 640.000 barrels. As you can se, only 16,8% is above 75.000 barrels and for 100.000 and above only 5,6%. So more than 640.000 barrels per well seems very difficult.
I think other people here knows more about the economic how much oil a well must produce for the companies not to loose money on the well.
Here I have instead listed all areas within the counties. I think you will need to open the picture in another window to be able to see anything. Here again, the best areas reach around 100.000 barrels. Only 14 of 322 areas are above 75.000 barrels. They of course also include wells in three forks which have lower production and there could be better areas within those areas. On the other hand, the best locations should have more wells. So the would then need to use downspacing for future wells which should give lower production.
Also interesting to note is that McKensey is a big county. I has some of the best areas, but also some of the worst.
I guess there are many companies that do not have acreage in sweet spots, and only a few companies have access to the “core of the core”. Hence it is very unlikely that rigs will be moved from the periphery to the best areas. Rather, drilling in less productive areas will likely decline faster than in in sweet spots, so the average well productivity may indeed slightly improve
Yes I agree with you to a degree. But some companies have options. And as you said, drilling in less productive areas will likely decline faster than in in sweet spots, which per well is similar to drilling more in better areas.
Freddy,
Very nice work, thanks!
Are you calling the first month of production 0.5 months so that this is cumulative output for the first 6 months of well output? I am a little confused by 5.5 months. Also what is the median cumulative well output at 5.5 months.
I haven’t worked the January date yet, but for the December data I get an average well of 60kb at 6 months (5.5?) and an EUR of 366 kb using 2010 to 2014 wells through October 2014 (I use the confidential wells from the big 5 counties and assume they are Bakken/Three Forks wells substituting runs for production). This is the hyperbolic fit to the NDIC data, with a switch to 10% exponential annual decline when the annual decline rate gets to 10%. Note that an interesting exercise would be to group wells into 10 roughly equal size bins and find the average well profile for each bin, then fit a hyperbolic to each bin to see if they are in fact proportional. My guess is that they are not, but I use this assumption in my models all the time, I should check it out some time.
Yes it´s 6 month of data. But in the first month they only produce for 0,5 month on average. So thats why the 0,5.
I have not calculated median production. Average production is 51.000 barrels as I wrote.
Ok maybe the EUR is higher. 320 is what I got a while ago when using 4 years cumulative production and drilling deeper for calculating future production. Using EIA´s formula that almost 50% is produced during the first 3 years gave similar numbers.
I think I also used 2009 data back then, so that´s maybe why it lower.
Regarding if they are proportional. I have compared a few production profiles between different counties. They are not perfectly proportional but it´s definetly so that if initial production is higher, then production later is also higher. For example I checked now the 2010 Williams and Mountrail. Williams is 78% of Mountrail production the first 6 month or so. Then it declines a bit faster and is 64% of Mountrail production after about 4 years. So not perfectly proportional, but good enough for a rough estimate in this case I think.
You have all been waiting for the results of the Season Effect Model, so here it is. After one year, I have never changed the parameters of the model (magnitude of the season effect, shape of the underlying Hubbert Curve). So now, since every season has come along, I thought it time for an evaluation.
The first months the model gave too high values. But,you know… it was easy to predict a winter, it was impossible to predict Polar Vortex conditions. The last months the model underestimated oil output. That is significant. This can mean the underlying Hubbert Curve is not optimistic enough. But when I look at the overall result (total oil output for the entire year) the model is very good. And when I look at recent price shock, I believe the underlying Hubbert Curve might shrink. So still: I do not change the parameters, and I will come back to you in 3 months.
Here are the numbers:
The fracking oil debt has become enough of an example that now it is being mentioned in a bitcoin article.
Bitcoin prices are so low, you see, that miners are spending more money running their supercomputers than they’re making from new coins. So why are they still going? Well, they have dollar debts that they need to pay back, and where else are they going to get the money? They’re stuck, in other words, in a catch-22: they can’t afford to keep mining, but they can’t afford to stop mining, either. (This, coincidentally, is the same dilemma that oil drillers who borrowed a lot during the boom face now during the bust).
http://www.washingtonpost.com/blogs/wonkblog/wp/2015/01/14/bitcoin-is-revealed-a-ponzi-scheme-for-redistributing-wealth-from-one-libertarian-to-another/
Cool.
But bitcoin is not supposed to be an investment. It’s primarily a mechanism for avoiding capital controls that restrict border exits. They won’t xray at the airports of a country one is trying to flee, as gold or silver or inspectable cash might.
This is their value and it’s very important value. There is no other way to get assets out. Learn the lesson of Cyprus.
The talk of “price” doesn’t really need to mean anything. Going up or down is not much of a focus, until that up or down gets big and that should not happen too often.
The talk of “price” doesn’t really need to mean anything. Going up or down is not much of a focus, until that up or down gets big and that should not happen too often.
Did you read the article? The bitcoin price ups and downs have been big. Perhaps it never should have attracted speculators, but it did.
OT: Things are getting interesting:
CRITICAL NOTICE 15 Jan 2015
The dramatic move on the Swiss franc fueled by the Swiss National Bank’s unexpected policy reversal of capping the Swiss franc against the euro has resulted in rare volatility and illiquidity. Both our primary and backup liquidity providers became unresponsive or illiquid for hours after the event. The majority of clients in a franc position were on the losing side and sustained losses amounting to far greater than their account equity. When a client cannot cover their losses it is passed onto us.
ALL OPEN POSITIONS MUST BE CLOSED BY 5PM NEW YORK TIME OR THEY WILL BE AUTOMATICALLY CLOSED AT THAT TIME. NEW POSITIONS CANNOT BE OPENED AS OF THIS TIME.
ALL CLIENT FUNDS ARE IN SEGREGATED ACCOUNTS AND NEVER USED FOR LP MARGINS. OUR PRIMARY CONCERN HAS ALWAYS BEEN PROTECTING CLIENT FUNDS AND 100% OF POSITIVE CLIENT EQUITY OR BALANCE IS SAFE AND WITHDRAWABLE IMMEDIATELY.
Global Brokers NZ Ltd. STP’s 100% of order flow and has sustained a total loss of operating capital.
Online ECN Forex Broker | Lowest Spreads | Excel Markets
dave ranning,
I think you hit the NEWS OF THE DAY nail on the head there. Funny, the SNB – Swiss National Bank said back during the Gold backed Franc referendum that if it was voted YES, than it would cause this kind of a heart attack in the Forex Markets…LOL. Looks like the SNB spoke from both sides of their mouth as they realized they might as well take a BEATING TODAY, rather than getting destroyed when the ECB prints money that would make Ben Bernanke jealous.
This is just the beginning ACT of a totally unraveling of the Central Bank Fiat Propped Up Ponzi System. Now that the SNB decided to CUT & RUN first, it will be interesting to see what other Central Banks follow suit.
95% of Investors still have no CLUE just how much of an impact this SNB market move was today. All I can say… I AM GLAD AS HELL I HAVE NO ASSETS IN PAPER….LOL.
steve
It was kind of a weird decision on the part of the Swiss to attempt to track the euro in the first place. They aren’t really cooperating with the ECB, and maintaining the artificially low exchange rate was costing the SNB (the Swiss central bank) a fortune.
The Swiss want to have their cake and eat it too. If they wanted parity they should have joined the euro, but that would mean joining the EU, and they’re too proud to do that. Now that they are outside the franc is going up, which will be painful to the Swiss economy. That will increase pressure to join the EU of course, but don’t hold your breathe.
Greeks doing balancing act:
http://www.telegraph.co.uk/finance/newsbysector/banksandfinance/11350042/Greek-deposit-flight-forces-banks-to-apply-for-emergency-support.html
Nobody ever seems to remember that inflating a currency( Swiss Franc) in relation to other currencies destroys the value of savings in the Swiss Franc.
People all over tend to forget this. Devaluing a currency is in the end a race to the bottom game. It maintains exports at the price of destroying import purchasing power.
I understand why countries do this of course. It’s good short term medicine for unemployment pain. Another shot or two of whiskey is a good short term remedy for a hangover too.
People all over the place that got mortgages denominated in Swiss money just had their house payments go up twenty percent today. The flip side of having a strong currency is that it makes imports dirt cheap.
Only a fool holds cash unless he has no choice in a country that is constantly inflating its currency- which is an alternate way of saying it is deliberately depreciating it agains other currencies.
more bad news for folks in the oil patch
http://www.businessinsider.com/schlumberger-cuts-9000-jobs-2015-1
Apache laid off 5% of its work force yesterday too.
Interesting,
We are hearing about all the larger companies cutting back. The ones most likely to be able to whether the storm. Not hearing too much about the smaller shale players cutting back.
Are the shales that profitable, or the shale players just delaying their quarterly reporting to the latest date?
I believe we are about to hear some horror stories before the end on the month.
Are the smaller players too small to be noticed by the press?
Possible, but i think there are many eyes looking out for any such news, that I believe someone here would pick up on it.
We will know by the end of the month, that is one thing for sure.
Keep in mind that only next week the first truly “short check” will be received. Horrific 1st quarter will not be reported for these companies until April. Also, hedging will help some.
Shallow,
As you say the oil companies will receive their first “short” check next week, and the real story will not be told until the April, for the 1st quarters reports, but the falling price during December should start to flavour the reports and certainly show the direction things are going. April seems so far away at the moment, when you look at he changes that have taken place in the last 30 days alone.
As Watcher says below some companies maybe under the radar, due to not being listed, but the service and drilling rig companies should catch the pulse of the industry, and give us some guidance on where the action, or lack of action is headed.
Imagine the writedowns coming, in the values for undeveloped (and very expensive) leases and in proven undeveloped acreage.
I have often wondered how much money was spent on lease bonuses in the US in the past 10 years, from the US/Mexican border to the US/Canadian border.
I suspect some are not even publicly traded and have no obligation to report.
If they have any public debt – i.e., junk bonds, they have to report even if they are not publicly traded. So the remaining would be very minor mom & pop drillers. Not significant enough to affect the large picture.
Schlumberger are probably affected more by cut backs on new projects rather than existing production.
NAOM
I have gathered data on 23 publicly traded U.S. E&P companies that have already announced guidance for 2015. Their combined capex should be 27% below last year’s levels. Some smaller players are planning capex cuts of 45-75%, and one company said they will not be drilling new wells this years. I believe there will be more cuts, as some of the earlier announcements were made in November when oil was around $70-75.
Alex. What do you make of the company’s guiding higher production despite the CAPEX cuts?
shallow sand,
Most companies are indeed guiding for higher 2015 production, despite lower capex. My explanation:
1/ Companies and experts expect significant reduction in cost.
Wood Mackenzie (the consultancy):
“As companies have decreased capital budgets, we are seeing a slowdown in drilling activity. This reversal is already having an impact on the demand for rigs, pressure pumping fleets, and other key equipment and services. If the oil price were to average around $50/bbl in 2015, Wood Mackenzie anticipates a 40% decline in the horizontal rig count compared to 2014. Rig day rates could fall by 30% or more. While other equipment and services will see smaller cost reductions in percentage terms, Wood Mackenzie expects the overall impact on drilling and completion costs to be at least a 15% decline compared to 2014, with some companies achieving as much as 33%-40% in cost reductions.”
“Wood Mackenzie’ s North American Supply Chain Analysis Tool predicts that costs in the Eagle Ford will come down an average of 20% for drilling, and 10% for completions.”
http://www.worldoil.com/Operators-could-see-up-to-40-in-cost-reductions-Wood-Mackenzie-says.html
2/ Drilling in more productive areas will fall less than in the periphery
3/ Companies will not buy new acreage, which accounted for significant part of total spending in the past years.
4/ There will be much less drilling of exploratory and testing wells
5/ There will be less spending on non-productive assets (midstream, etc.)
6/ Production growth guidance refer to year-average numbers. If we compare output for 4Q14 and 4Q15, it will show much slower growth, or no growth for some companies.
Refering to the spot on comment above by the esteemed Mr Brown;
@ a 15% decline rate, we have to replace 100% of ALL existing wells in 7 years.
@20%,100% in 5 years.
EVERY YEAR !!!!!!
Just where in thee frack are WE going to replace all the wells EVERY YEAR
to keep production flat ??? It is NOT POSSIBLE, that’s where.
The recent uptic in production was a dead cat bounce, brought on by higher oil
prices and DEBT. The US National DEBT per barrel of oil burned is over $200
per barrel !!! $100 per barrel oil +$200 debt= $300 a barrel oil(with somebody
ELSE paying the debt later). Who will pay that debt ? It is not possible,that’s who.
The current 1/2 off oil price will cut supply and production. And then…
And thennn ?? No mas BAU. No mas. That’s all she wrote. The party’s over.
Suppose you expunge some debt. By declaration. Anyone who is hurt by this gets a bullet, and maybe you selected the amount to address that.
Shrug. See? It doesn’t really matter. File in court? Defund that court. Not allowed to rule. File internationally? Ignore them.
In the end, when things get ugly, do not think money is going to decide anything. It only does while the wheels are turning. When they stop, it’s just numbers on a screen.
To estimate production after 7 years, you should use ((100-15)/100)^7
This is for “15 % decline rate”.
It’s not the exact equation, but it’s a close approximation.
As we have previously discussed, the scenario I was outlining was the volume of new oil per year needed to maintain stable production, at a given production decline rate from existing production, and not the volumetric decline from existing production, over a multi-year period.
Correct, 7 years at 15% leaves you with about a third left.
True, but as noted several times, utterly irrelevant to the point I was making.
To clarify somewhat, what I was attempting to quantify was the volume of new oil needed per year, in order to maintain current production, at a given decline rate from existing production.
Let’s assume that we have one mbpd of annual average production in 2015, at an underlying 20%/year decline rate. And for the sake of argument and simplicity, let’s assume that the production decline rate does not vary with time (in reality with a hyperbolic decline, the decline rate would tend to decline with time). In any case at a 20%/year decline rate, the 2015 production would be down to 0.37 mbpd by the end of 2020 (annual average).
However, if we wanted to maintain 1.0 mbpd of production for five years, with a 20%/year decline rate from existing production, we need to add 0.2 mbpd in 2016, 0.20 mbpd in 2017, 0.2 mbpd in 2018, 0.20 mbpd in 2019 and 0.20 in 2020, for a total of 1.0 mbpd of new production over a five year period, in order to maintain production of 1.0 mbpd for five years, with an underlying decline rate of 20%/year from existing production–since we are always declining, under this scenario, from a production base of 1.0 mbpd.
Note that a key assumption is that a high percentage of current production comes every year comes from newly completed wells, with high decline rates, so the assumption of a steady 20%/year decline rate is reasonable, assuming a stipulated steady state production scenario for five years.
However, it is when, not if, that the contribution from new wells can no longer offset the declines from existing wells, i.e., Peaks Happen. And in fact, the higher the production level, the higher the annual volumetric decline from existing wells, and thus the closer we are to the point in time that new wells can no longer offset the legacy declines.
The prevailing conventional wisdom view that the Peak Oil “Theory” is wrong therefore assumes that a finite sum of oil fields–the finite sum of discrete sources of oil that peak and decline–will virtually never peak and decline.
To maintain current production they need to drill about 150 wells per month. At 10 million per well that is 1.5 billion per month or about 50 million dollars per day. Let’s say the producer gets $25 per barrel. Overall, producers will get about $25 million dollars per day. So even the base cost is falling way short overall.
Another way to look at is a producer can expect about 360,000 barrels per well for his initial investment of 10,000,000 dollars per well. 360,000 X $25 = $9,000,000.
This does not cover initial costs let alone debt service, lease costs, etc.
So it is not even worth thinking about putting in a well at these prices. Especially since you make most of your money in the first year.
The key question here is it worth finishing a well that is already drilled?
In making a completion decision, all previous costs are sunk costs, so, as you noted, the key question is the estimated Net Present Value (NPV) of future production, versus estimated completion and operating costs.
In any case, it seems to me that the global oil industry is between a rock and a hard place. Excluding the US and Canada, global crude + condensate (C+C) production fell from 2005 to 2013, as annual Brent crude oil prices averaged $110 for 2011 to 2013 inclusive.
If the global industry was only able to show an aggregate increase in production because of tight/shale plays and tar sands plays in the US and Canada, and if those plays now have severe viability issues at current oil prices, and since non-US and non-Canadian production fell even as oil prices doubled from $55 in 2005 to the $110 range for 2011 to 2013, how is the industry going to be able to even maintain current global production?
I think the US is betting on a combination of EOR of old wells, tar sands, more fracking, coal and natural gas conversions and maybe even some oil shales to produce liquid fuels for critical, strategic and military purposes. The government can operate or fund these plays at a monetary loss.
The rest of us had better be changing our lifestyles and going heavy on conservation, efficiency and alternative transport within the next decade. Sure oil will still flow but it will get more expensive or not available in places as efficiency and conservation (even government mandated) falls behind production decreases. Right now we have 0.6 gallons of liquids per day for every person on the planet. What if more people want it or the level falls to 0.4 gallons of liquids per capita or less? It’s a race to see who gets what and how much for a while, not happy times when a good chunk of the world is trying to raise it’s standard of living and the rest are trying to maintain their standards of living.
If tar sands and fracking looks desperate now, wait until they are not enough.
” It’s a race to see who gets what and how much for a while, not happy times when a good chunk of the world is trying to raise it’s standard of living and the rest are trying to maintain their standards of living.”
This isn’t really all that different a description of more or less every year of every century of mankind’s existence in some aspect or another.
The right solution is not to find ways to degrade your lifestyle. It’s to find ways to degrade the other guy’s lifestyle, or eliminate his altogether.
Yes, you are so right. Used to involve “discovery” of “new” lands then taking over and/or killing off the indigenous population so resources could be brought home. Now we invade our own lands, ignore the rights of the indigenous citizens and give them what they want and think they need.
Every introduction of new technology seems to lead to many other technologies or innovations. Petroleum is a poster child for that one.
Just read a very interesting book by Steven Johnson, ” How We Got to Now – Six Innovations That Made the Modern World”. A well written account linking new technologies or innovations that spawned amazing changes and innovations in other areas, sometimes seemingly unrelated. The topics are Glass, Sound, Clean, Cold, Light and Time.
One thing leads to another or many others. Access to fossil energies have made much of these modern innovations possible (I didn’t say that was good).
Oil started only to produce a better form of lighting (kerosene). Coal started out as a fuel to run mine pumps.
Look what has happened since.
Now we (or those who follow us) will see what happens when the major energy sources that allowed the modern world slowly cease to be available. Will that spur further key innovations or will it lead to general collapse?
Right. It is just like Texas Hold’em Poker. You have a lot of money in the pot, sunk costs, and the wrong card comes up. Based upon a reduced probability of winning, it is usually better to lose just the sunk costs than any additional amount. Especially, if you are borrowing the money to play.
I think that you can model the Bakken in a fairly simple, way, by making a few assumptions. Let’s say all wells in a year are completed and start production on January 1 of each year. Use an 8 year strip – it will be close. Then assume (or calculate) an average production for each well by year in the 8 year strip. For example: Yr 1 production is 5oo/bbl day. Yr 2 – 250, Yr 3 – 125 and yrs 4-8 – 100. So you have an 8 year strip. [but, put in the strip what history shows is the average for each yr, depending on age of well]. Now put in the number of wells completed for each year – use actual number (I do not have it). For example 2000 yr 1; 1800 yr 2; 1700 in yr 3; etc, down to 1000 (or whatever) in yr 8 based upon yearly completion records. [we are going back in time, yr 8 is the # drilled 8 years ago. Yr 1 is last year.
So you have the production profile. Your model should come close to daily production for 2014 – or adjust average production/decline rates accordingly to get there.
Now add another year, and drop off the previous yr 8 well. So, well #1, eg, becomes well #2 with average production of 250. Then compute how many year 1 wells are needed at 500 per day to get the same average daily production as 2014.
Got it. I never saw it expressed that way. We usually referred to it as developing reserves to replace those being produced. What makes it really grim is the ever increasing demand. The reserves replacement ratio is really onerous when demand increases.
I have just posted this, up top, as an addendum to the post:
The reason “Wells Awaiting Completion” jumped by 125 in November:
Helms: Oil production could decline by third quarter
Lawmakers and oil officials alike are expecting the smaller trigger to take effect Feb. 1 through June. For that to happen, the WTI price must average less than $55 a barrel for a single calendar month.
That will reduce the oil extraction tax from 6.5 percent to 2 percent for a set amount of production, and applies only to wells completed after the trigger is pulled.
That possibility, which is expected my most officials, is leading to an increasing number of wells awaiting completion, as companies wait for the incentives to take effect. Helms said he was “stunned” to hear 775 wells were awaiting completion as of the end of November.
This means there may be a mad rush to complete wells after the the lower tax kicks in on February first.
This makes the February ND report very interesting. If Helms is right completions will show a big jump with the lower tax rate. If Helms is wrong, completions will stay low.
In other words, we may be seeing a big jump in Bakken production in Feb/March…?
For a lousy 4.5% advantage? Sounds shaky.
Agreed. The banks had better start renegotiating those loans soon or they will end up owning a lot of wells and possibly losing a lot of money.
Allan H Wrote:
“Agreed. The banks had better start renegotiating those loans soon or they will end up owning a lot of wells and possibly losing a lot of money.”
Banks do what banks do best. Stick the taxpayer with the losses. Wasn’t the Cromnibus passed to protect the bankers from commodity and derivative losses? I think you should have stated “The banks better start renegotiating those loans or the taxpayers ill end up losing a lot of money.”
http://www.nakedcapitalism.com/2014/12/elizabeth-warren-remarks-citigroup-bailout-provision-cromnibus-bill.html
Just looked at this for a 450 bpd avg flow for first month of flow. That’s 450 X 30 = 13500 barrels at $30 is $405,000 pre royalties, opex and taxes. 4.5% of this number is $18225.
A $1 change in price on the 13500 barrels is 13,500. So a choice not to complete to try to chase that 4.5% can get eaten up by a mere $1.50 price change downward. If it changes upwards, you don’t get the tax break.
This ain’t the explanation for the awaiting for completion count.
Insignificant.
This is the hammer and the nail situation. To a hammer, every problem looks like a nail and there is one solution available.
To government, filled with people who don’t want to think of themselves as useless and helpless, well, they persuade themselves that tax policy can define the universe and affect outcomes.
“Lloyd of the Flies”
A plane full of Unabankers plunges in the ocean not too far away from a deserted island, and most survive the crash thanks to government intervention. They get into an argument over who gets to be named Piggy, and seeing as it’s an apt name for all of them, they decide to all take that moniker. Jamie is in charge of cocoanut derivatives, and all goes well until they die of hunger, because there actually weren’t any cocoanut trees on the island.
Stolen from JackD
http://www.theguardian.com/environment/2015/jan/16/2014-hottest-year-on-record-scientists-noaa-nasa
The last record cold year was 1911.
The main thing that bothers me about this is not any of the supposed evidence, but rather the number of people who believe skepticism or attempt at independent thought constitutes being a “science denier.” If you don’t believe whatever the “experts” say, they try to frame you as an idiot.
I happen to be quite interested in science and facts. I just also think that it’s unwise to cripple our economy and prosperity over a theory that hasn’t even been proven. Of regard to this latest news, we need to be mindful of how there appears to be a very significant data point, suggesting that the last 15 years of global temperatures represent not just a plateau, but actually a significant pause in any kind of warming trend.
Global warming, can’t live without it, can’t live with too much of it.
It’s all pretty simple, without CO2 in the atmosphere the earth would be at an average of minus 18 Celsius ( zero deg. F). That would make the earth one giant snowball.
So by adding 270 ppm of CO2 we get almost 60 degrees warmer. With the current surge of CO2 to near 400 ppm (about a fifty percent gain) figure where the temperature of the earth is headed.
You bring up a very good point. One correction though, it’s been actually 17 years since the last time there wasa measurable change in the planet’s temperature.
So with that being the case a great deal of our space systems scientists believe it is far, far, far more likely that any warming that may occur from here on out will be because of cycles of activity on the sun. We already know in the past there have been eras when the CO2 level was many times what it is now yet the temperature was sometimes far
colder than what we see now. On the other hand there have been times were the polar ice caps were completly gone. You would think this might be devastating to the planet, but obviously we know the earth survived, and we have since discovered that so did all the creatures and flora on it at the time. Knowing this, many of the scientists who are committed to investigating the truth rather than what the ideologues who hand out huge grants want them to say have come to the understanding that the main thing which drives our climate is the sun, followed by volcanoes, and then the movements of the other planets and stars. What any of them do is basically impossible for humans to forecast, so it seems we are just going to learn to adapt to whatever comes our way due to their actions.
We already know in the past there have been eras when the CO2 level was many times what it is now yet the temperature was sometimes far colder than what we see now.
Maybe you would like to discuss this further. Here’s an excerpt from this article:
http://www.climatecentral.org/news/the-last-time-co2-was-this-high-humans-didnt-exist-15938
For a 2009 study, published in the journal Science, scientists analyzed shells in deep sea sediments to estimate past CO2 levels, and found that CO2 levels have not been as high as they are now for at least the past 10 to 15 million years, during the Miocene epoch.
Apparently there are a few people that disagree with you.
http://thinkprogress.org/climate/2015/01/16/3612351/noaa-nasa-2014-hottest-year-on-record/
http://climate.nasa.gov/climate_resources/9/
But you do weave a consoling story.
I continue to be surprised that anyone wanting to dispute GW would want to do it in this forum. People here constantly seek out info and numbers. So if one wanted to make a claim that temperatures haven’t been rising, or that CO2 levels aren’t at historical highs, then people here are going to do their own research to verify or disprove that.
This isn’t a forum where you can make a claim and then not expect it to be investigated.
How to reduce carbon emissions by a target of 25% ASAP ?
http://www.livescience.com/48738-climate-change-accord-us-china.html
http://www.nytimes.com/2014/10/24/world/europe/european-leaders-agree-on-targets-to-fight-climate-change-.html?_r=1
Drop oil prices by 1/2 cutting supply,production thus availability. And then,,, don’t allow increased production to fill supply gap,decreasing consumption,carbon emissions. Voila, crisis overted.,wasn’t that easy ?
The folks who dispute global warming on a statistical basis have evidently never studied statistics AT ALL.
IF they knew just a little more about statistics and probability they would understand that their argument involving no warming trend for the last decade or a little longer holds water about like a sifter bottom.
If there was no OVERALL warming trend there would be at least three or four COOL years since 98. They are not to be found in the record.
The accumulating heat is going into the oceans and the soil for the moment. It isn’t going to stay there.
If anybody wants to place a bet with me I am ready to bet that the next five years contain at least one record new high average and no record low average and that four out of the five are above the twentieth century average.
If any body believes THERE IS NO WARMING TREND wants to do the same I am ready to put hard assets where MY mouth is.
So NOT taking you on.
NAOM
Really?
What color is the sky on the planet you liv on:
10 warmest years on record (°C anomaly from 1901–2000 mean)
Year Global[66] Land[66] Ocean[66]
2010 0.66 1.06 0.50
2005 0.65 1.05 0.50
1998 0.64 0.94 0.52
2013 0.62 0.99 0.48
2003 0.62 0.88 0.52
2002 0.61 0.93 0.49
2006 0.60 0.90 0.48
2009 0.59 0.85 0.50
2007 0.59 1.09 0.41
2004 0.58 0.81 0.49
Of course, 2014 just became the warmest year, so 2004 gets bumped off.
I happen to be quite interested in science and facts. I just also think that it’s unwise to cripple our economy and prosperity over a theory that hasn’t even been proven.
But adding more alternative technology would likely boost the economy, not cripple it. The fossil fuel economy is mature and the industries linked to it aren’t adding jobs.
But converting lots of places from fossil fuels to alternative technology would create jobs. The only people truly threatened by phasing out fossil fuels are the corporations currently tied into fossil fuels.
I suspect that as Silicon Valley money gets more influential, the politics in this country will likely benefit them more than the industries that had their heyday in the 20th centurey.
If you say it is a “theory that hasn’t even been proven” you betray the fact that you have no idea how science works. Gravity is a theory. Newtonian Mechanics work under most circumstances. Not all circumstances. Its a model. But its pretty damn good. There is no reason in the world why “our prosperity” need be dependent upon dumping ever increasing amounts of carbon into the atmosphere. There is little doubt that doing so will change the climate.
The main thing that bothers me about this is not any of the supposed evidence, but rather the number of people who believe skepticism or attempt at independent thought constitutes being a “science denier.” If you don’t believe whatever the “experts” say, they try to frame you as an idiot.
That would be because there is a huge difference between true scientific skepticism and science denial.
Scientific skepticism (also spelled scepticism) is the practice of questioning whether claims are supported by empirical research and have reproducibility, as part of a methodological norm pursuing “the extension of certified knowledge”.
Only an expert can argue with another expert. If you were diagnosed with heart disease and had three second opinions from three topnotch cardiologists that gave you the same diagnosis and you went to your plumber for another opinion and he told you not to worry and you took his word for it, I would certainly feel justified in thinking you an idiot.
That is why most climate change deniers are not skeptics, they lack the necessary expertise to even understand how little science they really know.
We should be really glad that much of the heat is going into the ocean (or should we?). We also should be quite happy that there still is snow and ice left to reflect a lot of energy away from the earth.
Pollution is shading large portions of the surface also. A lot to be thankful for.
I wonder what is going on with Canada, the rig count a week ago was near 47% of a year go.
Mac, a few days ago you said “Nick…will NEVER in my opinion admit that his rosy scenarios might not come to pass -except maybe in convoluted terms”. I thought you might like a reply:
I do say that sometimes, and in pretty simple language. I often say things like “collapse isn’t likely”. That’s simple: it means it’s possible, but not likely. Which is what I think: the idea of a thorough collapse due to LTG means assuming that humanity just panics, becomes paralyzed by fear and stays that way – that seems pretty unlikely to me.
Really, the only collapse scenario that’s at all plausible is nuclear or biological war (or, in the longer-term, the very worst climate change scenarios). I get frustrated that people forget how many nuclear weapons we still have, and the potential for more because of nuclear proliferation. If every country in the M.E. has nukes, what are our chances?
But economic collapse due strictly to physical limits on commodities like oil is highly unrealistic. Again, we have better and cheaper alternatives to 90% of oil/FF: EVs, heat pumps, rail, etc., etc., with affordable substitutes for the other 10%, 50-100 years from now.
On the other hand, I think we should eliminate oil and other FFs right away: they’re dirty, risky and expensive. I’m not worried about collapse, I’m worried about trade deficits; oil wars; pollution; and climate change.
And, in the end, I care more about: “What should be done”, rather than ruminating about the possibilities. I care about what’s possible, but more because of how it informs what we should be **doing**. I’ve eliminated pretty much all oil and most other fossil fuels in my life, and I work to make it happen elsewhere, including educating and advocating here.
Make sense?
Sure does to me. I made a remark a while ago that we have lots of examples of big groups of people going thru really awful situations and coming out of it, I cited the siege of Leningrad as one example, and was told we aren’t near as tough as the Russians. True, but some of us get pretty close.
I grew up in the middle of the depression. Nobody had much money, if any, we bartered, collaborated, traded chores– I remember my mother and a big bunch of other women canning the stuff they had just got from the farmer. I was annoyed by their loud singing, and smoking, and drinking coffee, all of which I had somehow come to think of as low behavior. They seemed to be having fun- yet more low behavior!
I think it was from my father, who had a pretty good income for the time from his civil engineering for the WPA, a construct of his hated FDR. He seemed not to notice any contradiction between his own words and actions–just others’.
Otherwise, I had a fun time with my own buddies, dogs and siblings. If you had told me I was poor, I would have dismissed you as just nuts, like most adults.
Really, the only collapse scenario that’s at all plausible is nuclear or biological war (or, in the longer-term, the very worst climate change scenarios).
I doubt if there will be much “climate change” past 2050, as solar replaces gas and coal, and electric cars replace oil. 35 years @ 2 ppm is 70 ppm. The temp difference might not even be measureable.
HI NICK
I still contend that you are never going to admit that your rosy scenarios might not come to pass for the most part. Admitting that they might not materialize due to nuclear or biological war is a substantial step in that direction of course.
I believe there is a very substantial possibility that the general world economy will suffer a very hard crash from which it might not ever recover – at least not within any time frame meaningful to us personally anyway. As a matter of fact I think such a collapse is actually very likely indeed.
There are numerous highly competent biologists who believe the same thing- whose work I have taken to heart in forming my own beliefs. While I am not fully trained in the field myself I do have quite well over half the courses needed for a bachelors and a whole bunch more that are basically the same stuff with different course numbers and descriptions which I took as an ag major.
As it happens I also took the basic economic courses taught to sophomore econ majors at that time at my university. I am a BIG believer in the Market and the Hand – which I often refer to here as the Mighty Mighty Market and the Invincible Invisible Hand in an attempt at composing some mild satire or mild sarcasm.
I have little doubt that if Old Man Business As Usual were to remain hale and hearty and highly productive for another half century or so that we could solve most or all of our pressing problems.
The problem is that – contrary to your stated beliefs- there is every reason to believe things can and will eugo to hell in bucket.
Consider if you will – assuming you have ever driven a small under powered car with a stick shift transmission or a big truck- this analogy that my friend Howard came up with. He is a brilliant self taught engineer and all around mechanic with hardly any formal education but he has seen a whole lot of the world and the way it works in his eight decades.
Suppose you are driving up a long steady grade in fifth gear holding a high steady speed. So long as nothing goes wrong- so long as you do not have to stop or slow down a great deal- you can continue on up the hill indefinitely until you crest the top.
But if you stop – and you find out your first second third fourth gears are gone bad- well you will never get started up the hill again.Your only choice will be to roll back to the bottom or just park on the shoulder maybe. Even on level ground at the foot of the slope you will never get a loaded truck started again in high gear.
If any unhappy event or series of events results in a very hard crash of the world economy involving resources of critical resources such as oil and phosphates the economy might die of it’s injuries.
You the individual can be taken by ambulance to a hospital after a bad accident and may recover to as good as new. But there is no ambulance for the whole world.
If you let a bunch of rats into a silo filled with corn they reproduce at will until the last generation of rats finds itself without food in a very sudden and dramatic Seneca Cliff fashion.
Humans as a whole are not very good at managing our collective affairs ON AVERAGE. If we were better at it we would not have fought WWI or WWII or be looking at the possibility of nuclear and biological WWIII or an overheated planet or some new virus capable of wiping out a staple crop being spread all over the globe on the feet and or in the guts of thoughtless pleasure travelers or pythons big enough to eat US living in the Everglades etc.
The number of things that can potentially go wrong is enormous and the number of opportunities for them to go wrong is equally long. I would not describe this as being so much a problem with humans panicking as being lethargic and failing to do what is necessary to head off looming disasters ranging from a runaway climate to overpopulation in general and especially in certain localities.
I can assure you as a professionally trained farmer that there is a small but very real possibility that there will be a truly substantial short fall in food production any given year.
We may well use oil and gas like spendthrift heirs and heiresses until we suddenly find ourselves so short of these commodities than we no longer have a window of opportunity to change our ways – a window of opportunity to adopt and SCALE UP the many solutions to our problems that you have so often mentioned .
It is us versus disaster. Think of us and disaster as being two reasonably well matched athletic teams on the competitive field. A puff of wind , a bad bounce of the ball, a bad call by a referee, the sun emerging from behind a cloud at just the right or wrong moment can change the course of the game and reverse the roles of winner and loser..
Even when one team is noticeably better than the other it is to be expected that once in a while luck favors the weaker team with a win. All it takes is for the stronger team to have a bad day and a few lucky breaks to go to the weaker team.
Now I am not a psychologist nor a sociologist nor a historian nor a demographer but I have some knowledge of all these fields and I spend all my evenings reading good books rather than watching tv or drinking in a bar.
My own estimate of the likeliest general course of future events is that most of the world WILL suffer a general economic collapse due to problems involving shortages of natural resources, overpopulation , ecological decline and plain old self centered short sighted mismanagement.
However I have not uncovered any convincing evidence that this collapse will be universal in time and place and consider it far more likely that it will be piecemeal in both time and place.
This leaves open a distinct possibility that some societies may weather this collapse or resource and environmental bottleneck more or less whole in many respects. I believe that a few societies WILL come thru more or less intact- with the big butts and bellies resulting from too much easy living burned away by hard times.
Opinions make horse races.
The players on your home team are very good ones. But for your team to win out in the end it must win continuously on the grand scale.
One really big loss anywhere at any time can turn out like the old ladies cow kicking over the lantern and burning down the city. The problem is that nowadays the world is so interconnected and so dependent on trade than entire regions and countries will perish horribly unless the trade continues. This sort of trouble once well under way has a way of morphing into hot war between major powers and any country in a bad enough bind invading a neighboring country in search of resources if conditions are such that such an invasion might succeed.
But with geography in our favor and yankee land being big enough , rich enough , and strong enough to get along without trading much if at all with the rest of the world we might pull thru ok. We have resources enough to get by and military power enough to TRULY export a little democracy down Venezuela way and make it stick if our national survival depend on our doing so.
The Leviathan we know as UNCLE SAM is not going to go quietly into the night. But the people living in a whole lot of countries unfortunately have almost no chance of surviving the coming bottleneck.
Having said all this – I am with you all the way in moral and sentimental terms.
If we were to get our collective butts in gear right away we might conceivably avoid the worst consequences of over shoot.
But if we wait on the Market and the Hand to solve our problems we are literally damned. The Market and the Hand have the potential but not the time needed to accomplish the job on their own.
So far as I can see you seem to have great faith that the Market and the Hand are up to the job barring WWIII wiping us out.
It’s a race between economic and technological progress and resource depletion made worse by growing population and environmental degradation.
My money is on the bad guys. They have too big a head start. It is already late in the third quarter and the bad guys are up by fifteen or twenty points in a game where fifty is a very high score.
It is NOT impossible for the good guys to turn it around and win it. But I am not betting on them even though I am very fond of them..
Mac,
Yes, I do think we disagree on the likelihood of a “very hard crash from which it might not ever recover”. But, maybe that’s not the most important thing. It might be fun to explore that, but first, I think it’s more important to clarify that we agree on the important things:
1) alternatives to oil & fossil fuels can be made to work just fine, and
2) we should transition to them ASAP. The longer we take, the greater the risks and costs, and the sooner we transition, the better off we’ll be.
Do we agree on that?
Some more articles about this news, courtesy of Drudge,
Scientists balk at ‘hottest year’ claims…
’14 was only 34th warmest for USA?
Great Lakes ice makes leap after cold snap…
Human activity has pushed Earth beyond ‘planetary boundaries’…
The actual title for the link you have listed as: ’14 was only 34th warmest for USA?
is this: 2014 Breaks Heat Record, Challenging Global Warming Skeptics
Well that’s the title Drudge gave it. http://www.drudgereport.com/ Those are still on the front page go there now and see for yourself before he puts new articles up.
No need to go to Drudge. I can check the original articles or do a Google news search on the topic.
I just wanted to point out that although Drudge cited a small piece of the article (that US temperatures weren’t the warmest on record), global temperatures were.
Those who want to counter all the GW articles will have their hands full moving forward since the “globe is warming” articles greatly outnumber the “no it isn’t” articles.
Given that this is a peak oil forum, people here are mostly focused on the oil becoming increasingly scarce. The economics of oil will be a reality even for those who don’t want to factor in CO2 issues. Whether one wants to plan a world with less oil because of scarcity, or whether one wants to plan a world with less oil because of CO2 concerns, we’re probably looking at some of the same discussions. It’s the “less oil” forum more than the GW forum.
And then there’s those who plan for less oil because it’s getting to be a lousy place to put their money.
More and more people are starting to notice the obvious- while ff’s go this way and that way too fast to see any reason for, but trending relentlessly toward bad, Solar keeps going nice and steady along it’s same trajectory- getting to a better bet- and then, better, and then, better yet.
And no end in sight at all. Any tech guy with any brains can see that.
The Baker Hughes Rig Count is Out. Texas Took a Big hit, both Eagle Ford and Permian.
Baker Hughes Rig Count
I see the US count down even more this week than last. 74 compared to 61 last week
The Eagle Ford and Permian, seems to be taking a bigger hit than the Bakken. I find this interesting as the the two Texan fields have good pipeline connections to close markets are are getting much higher wellhead prices than the Bakken.
I believe the Eagle Ford has higher decline rates than the Bakken, so with them dropping drilling rigs at a rapid rate, how long will they be able to hold up their production?
Gas has had a decline this week, down 21, but not from the main gas plays. Marcellus, Utica, Haynesville, Barret are about line ball.
The Granite Wash has taken a big hit, losing 7 rigs down to 43, which is a 14% drop.
California continues its fall with another 4 rigs gone, leaving 18 drilling.
I saw some stories of drilling contractors having their contracts being paid out and terminated. Think this was in California, and would explain the sudden fall that has taken place. I suspect the California heavy oil extraction is no longer economical.
As for Canada, I will not comment, as there must be some seasonal things going on that I do not really understand, other than they are down 125 from last year.
For the last three weeks we have seen increasing numbers drop in drilling rigs. The question is will this trend continue and for how long? The Rig count will continue to fall, but with the rate of the fall continue to increase?
The Bad Bets are being covered:
http://www.bloomberg.com/news/2015-01-16/fxcm-gets-300-million-bailout-from-leucadia-after-swiss-shock.html
2014 Was the Hottest Year on Record
By Tom Randall and Blacki Migliozzi. Bloomberg | January 16, 2015
Deny this. This animation shows the Earth’s warming climate, recorded in monthly measurements from land and sea over 135 years. Temperatures are displayed in degrees above or below the 20th-century average. Thirteen of the 14 hottest years are in the 21st century.
It’s a tragic irony that the one populated place that had normal to below normal temperatures was the eastern U.S. and the most populous part of Canada.
2014: Hottest Year in Recorded Human History
By: Jeff Masters, Wunderground.com 5:05 PM GMT on January 16, 2015
The “ace in the hole” for the temp-adjusters is the arctic and antarctic. Look at all the gray around that region in that map. Essentially no data and lots of surface area, so a little creative “homogenizing” and “extrapolating” from urban heat island locales like Point Barrow, and the entire Arctic and Antarctic begins to look like a HOT BLOB on the top and bottom of the Earth (in terms of anomalies only — in real degrees, it’s still FRIKKEN COLD there).
The GHCN/NCDC/NOAA/NASA gang has had decades to perfect the “adjustment 3-card Monte” game.
As Stephen McIntyre has said on many occasions, you have to pay special attention to the pea being placed under the shell. Eventually I figure all these climateers will have so many spinning plates up in the air that breaking the lot of them is inevitable. That’s the problem with serial liars…maintaining the lies becomes exponentially difficult.
So yes, of course they will claim last year was hot, but scientists who know how these temperatures are really measured have already seriously busted the GHCN/NCDC/NOAA/NASA punks on all their infilling of data in Antarctica & Arctic, all infilling hot temperatures where there simply were none, no data or Adjusted data…
I’ll tell you this, the stuff these crackpot organizations is selling is…well you better not call it science.
Your comments don’t have anything to do with Peak Oil. You’ll find a more receptive audience elsewhere.
”scientists who know how these temperatures are really measured have already seriously busted the GHCN/NCDC/NOAA/NASA punks on all their infilling of data”
YOU are either a troll or very poorly educated or perhaps merely a fool. Maybe all three.
Suppose you supply us with a LIST of the scientists who have seriously ”busted the punks. ”
I am not holding my breath waiting but on the other hand I am stuck in the house and this forum is my home away from home for now. If you post your list I will post their credentials and their professional associations and what I can find out about their paychecks.When I do you are going to look pretty bad. Not that you don’t look bad already.
“McIntyre worked for 30 years in the mineral business,[2] the last part of these in the hard-rock mineral exploration as an officer or director of several public mineral exploration companies.[3] He was a policy analyst for several years for the governments of Ontario and of Canada.[4] He was the president and founder of Northwest Exploration Company Limited and a director of its parent company, Northwest Explorations Inc. When Northwest Explorations Inc. was taken over in 1998 by CGX Resources Inc. to form the oil and gas exploration company CGX Energy Inc., McIntyre ceased being a director. McIntyre was a strategic advisor for CGX in 2000 through 2003.[5] McIntyre says that during his career his skills in statistical analysis enabled him to analyse mineral prospecting data and out-bet his rivals.[6]
Prior to 2003 he was an officer or director of several small public mineral exploration companies. He retired from full-time work, but still sometimes engaged in mining consultancy.[7] He is an active squash player and once won a gold medal in the World Masters Games in squash doubles.[2]
In April 2011, Trelawney Mining and Exploration Inc. of Toronto, Ontario announced the appointment of McIntyre to their board of directors and then later to chairman in June 2011.[8][9] In September 2011, McIntyre was appointed to the board of directors of Augen Gold Corp. which was shortly acquired by Trelawney Mining and Exploration Inc. in November 2011.[10][11] In October 2011, McIntyre was appointed to the board of directors of Southeast Asia Mining Corp. and later resigned in May 2012.[12][13] Trelawney Mining and Exploration Inc. was acquired by Iamgold Corporation in June 2012.[14]”
I would just as soon have a carpenter do brain surgery on Grandma because my carpenter has been using power tools for a really long time and he is quite clever about how he makes those cuts. Of course he doesn’t know a god damn thing about how the brain works but I wouldn’t hold that against him. The guy is aces with a Black and Decker.
McIntyre the mining executive and Canadian oil mining (i.e. tar sands are essentially mined) interests.
Why else would McIntyre be engaged in disputing mainstream climate science?
American Geophysical Union Fall Meeting 2014, Press Conference with Presentations
The waters they are arising: What does the historical past warn of in the near term future?
Thursday, 18 December 2:30 p.m.
Why does it have to be so sensitive!
http://youtu.be/7CwOlis6GPQ
A couple of swan dives, obviously black swans.
https://www.dmr.nd.gov/oilgas/stats/DailyProdPrice.pdf
To digress, regarding the topic of money, whatever that is:
Gold is priced at 1280, oil at 50 when all is considered.
1280/50=25.6 barrels of oil for a troy ounce of gold.
35 dollars for a troy ounce of gold after gold was increased in price from the double eagle days of twenty dollars for an ounce.
One dollar sixty cents for a barrel of oil in 1940 something-ish.
35/1.60=21.875 barrels of oil for an ounce of gold in 1940, oil costs less today than it did when it was a buck sixty and gold was valued at 35.67 per troy ounce; that filthy, dirty thick liquid phenomena that is making the world a bigger mess every day, but it is not the same, all different, different day, same oil, costs less but is more expensive by thirty times than in the decades past. Something could be very wrong, but it is hard to say.
One way to reduce consumption is to stop manufacturing plastic trash receptacles that end up in pieces and thrown into the trash. Don’t use them, you won’t have to haul them back and forth from the curb for trash collection, or however it is done. Stop manufacturing them altogether. Either use the old metal trash can that will last longer or burn your trash in a 55 gallon barrel and let the ashes blow to the wind. Anyhow, trash cans made from refined oil should be banned. One way to reduce consumption. A good start to a better world. Just some meandering musings.
May be of further interest:
http://resourceinsights.blogspot.com/2012/09/global-oil-exports-in-decline-since.html