North Dakota has just come out with their oil production numbers for July 2016. Bakken production was up by 3,046 barrels per day while all North Dakota production was up 2,376 barrels per day.
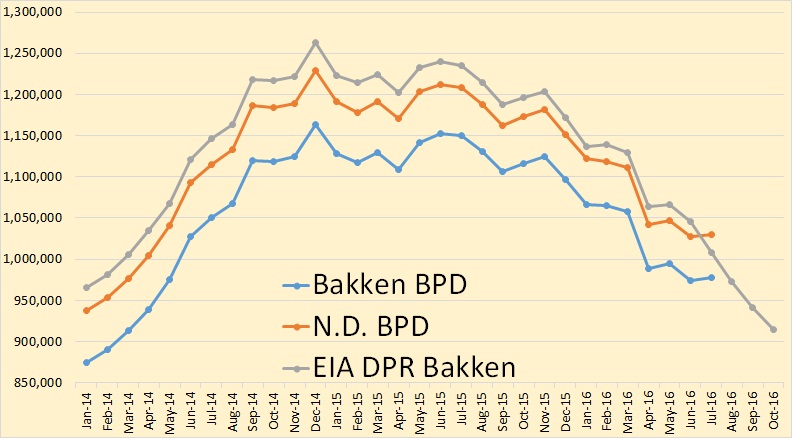
The EIA’s Drilling Productivity Report missed it for July. They will make the correction next month.
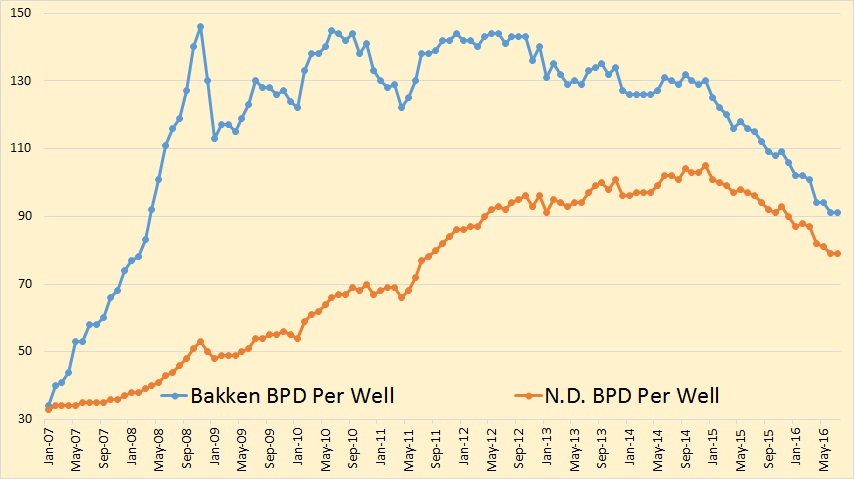
Barrels per day per well held steady in July, 91 for the Bakken and 79 for all North Dakota.
The trend is down in spite of the slight increase in July.
From the Director’s Cut
Oil Production
June 30,813,924 barrels = 1,027,131 barrels/day
July 31,914,711 barrels = 1,029,507 barrels/day (preliminary)(all time high was Dec 2014 at 1,227,483 barrels/day)
977,342 barrels per day or 95% from Bakken and Three Forks
52,165 barrels per day or 5% from legacy conventional pools
Producing Wells
June 13,248
July 13,255 (preliminary)(all time high) 11,168 wells or 84% are now unconventional Bakken Three forks wells 2,087 wells or 16% produce from legacy conventional pools
Permitting
June 65 drilling and 0 seismic
July 86 drilling and 0 seismic
August 99 drilling and 1 seismic (all time high was 370 in 10/2012)
ND Sweet Crude Price
June $38.75/barrel
July $35.57/barrel
August $33.73/barrel
Today $32.00/barrel (all time high was $136.29 7/3/2008)
Rig Count
June 28
July 31
August 32
Today’s rig count is 33 (all time high was 218 on 5/29/2012)
Comments:
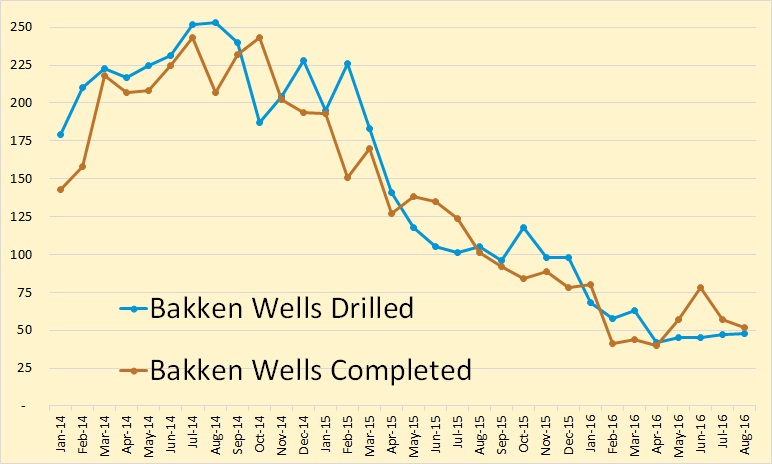
The drilling rig count increased three from June to July, then increased one from July to August, and increased one more from August to today. Operators remain committed to running the minimum number of rigs while oil prices remain below $60/barrel WTI. The number of well completions dropped from 45(final) in June to 41(preliminary) in July. Oil price weakness is the primary reason for the slow down and is now anticipated to last into at least the fourth quarter of this year and perhaps into the second quarter of 2017. There was one significant precipitation event, 12 days with wind speeds in excess of 35 mph (too high for completion work), and no days with temperatures below 10F.
Over 98% of drilling now targets the Bakken and Three Forks formations.
Estimated wells waiting on completion is 912, up 25 from the end of June to the end of July.
Estimated inactive well count is 1,472, down 14 from the end of June to the end of July.
Crude oil take away capacity remains dependent on rail deliveries to coastal refineries to remain adequate.
Low oil price associated with lifting of sanctions on Iran, a weak economy in China, and the Brexit are expected to lead to continued low drilling rig count. Utilization rate for rigs capable of 20,000+ feet is 25-30% and for shallow well rigs (7,000 feet or less) 15-20%.
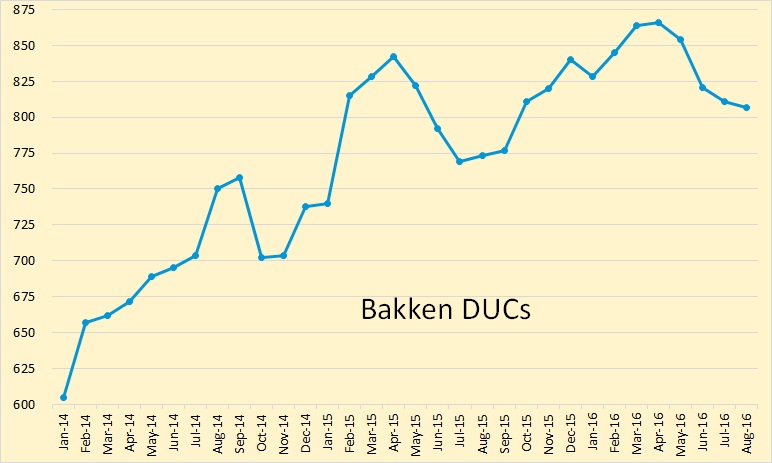
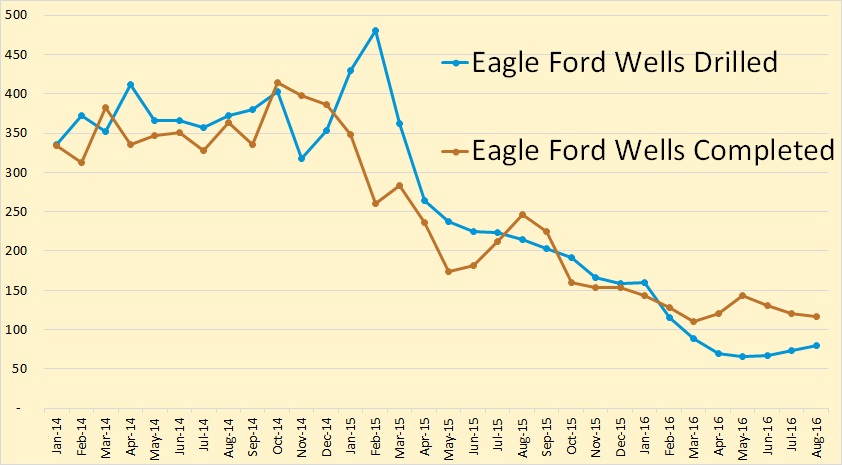
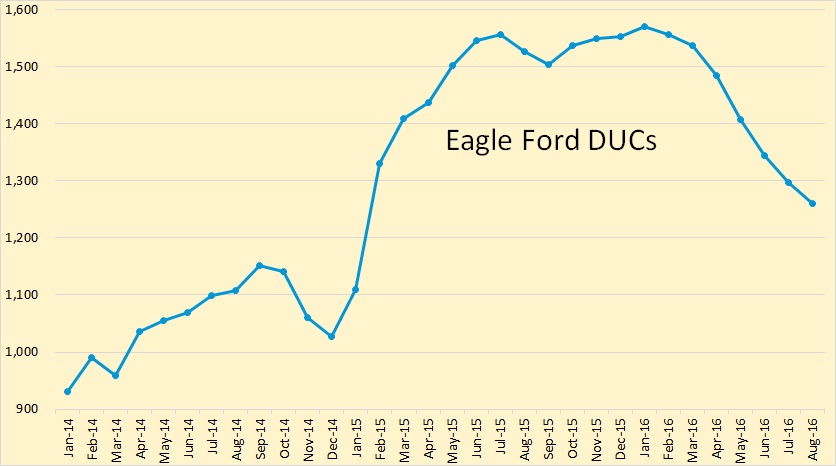
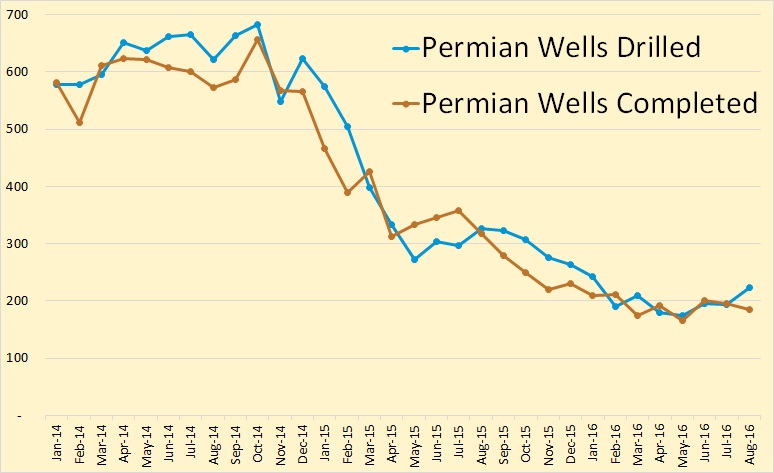
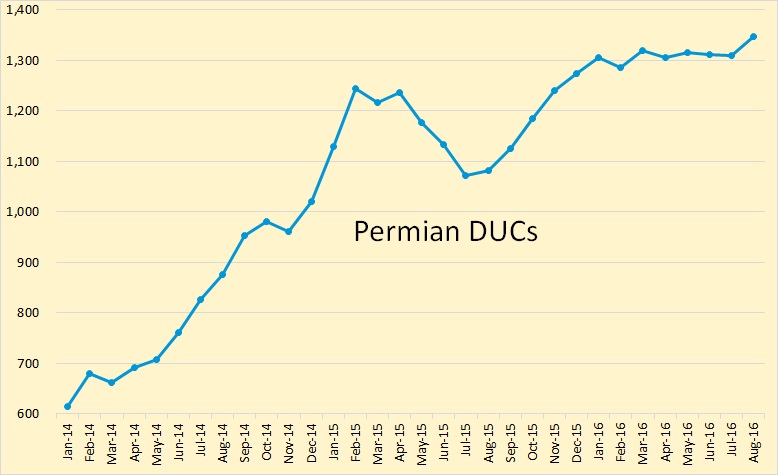
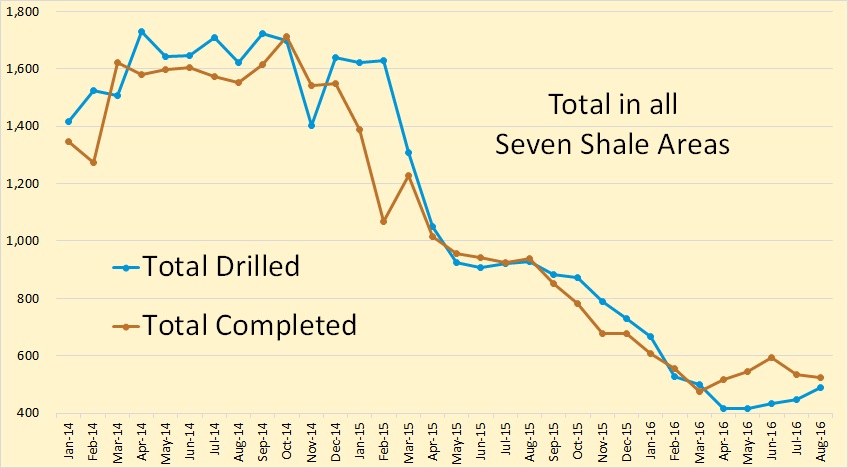
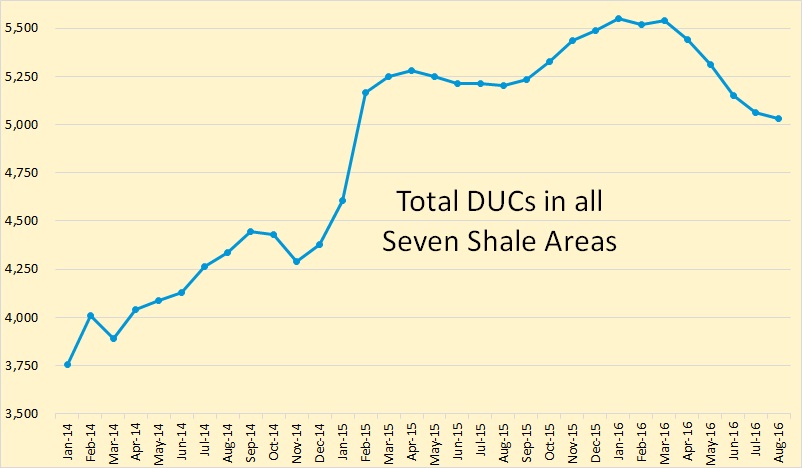
The eight charts below were created with data from the EIA’s latest Drilling Productivity Report. A DUC is “Drilled but Uncompleted”. That is, the well has not yet been fracked.
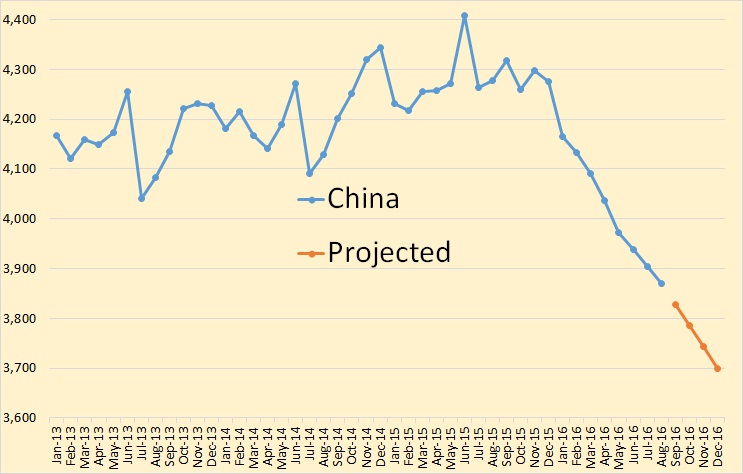
And I just had to add this one even though it has nothing to do with the Bakken or shale. It comes to us via Seeking Alpha:
China’s Crude Oil Production Drops To A 6-Year Low – Oil Markets Daily
China’s crude oil production fell ~10% in August to 3.87 million b/d, or the lowest since December 2009. This doesn’t come as a surprise to us as China’s oil producers signaled an output drop earlier this year when it gave capex guidance. Low oil prices are creating the inevitable effect it has on producers, and capex drop is leading to lower production.
Sinopec is one of China’s major state-owned petroleum and chemicals companies. Guidance figures out of Sinopec and PetroChina signal the overall direction of where China’s crude output is headed. For the second half of this year, Sinopec forecasts that its crude output will drop by 16% from the same period last year. We expect to see a material year-over-year decrease as we approach 2016 year-end. China’s crude output should end the year around 3.7 million b/d.
The chart below is in thousand barrels per day. The data through May 2016 is from the EIA. The rest was gleaned from the Seeking Alpha article.
144 responses to “Bakken July Production Data”
So in the ND, companies are focussing on sweet spot and the production per well still decreases. Is there much more wells per rig?
Production per well decreases because fewer new wells are coming on line therefore a higher percentage of production is coming from older wells, wells who’s production has declined considerably. That is not necessarily a sign that new wells are producing less.
I have looked at some of the wells completed this month and last month in Texas. EIA numbers on productivity reports appear to include total completions. There is a vast number in the Eagle Ford that includes re-completions and wells drilled to hold leases. In a lot of cases, they should have just let the lease go. Many would never pay for the cost of the well if oil was at $100. Noted some new players within that poor quality. I don’t place much stock in the drilling productivity reports, nor much into EIA and IEA’s analysis. Except for IEA’s guess that low capital input will eventually spike prices. Last two months indicate that total wells are decreasing, which is going to happen more with the low completion statistics. Texas production will continue to decline at the current level of activity. Permits to date suggest that level will continue to occur. Much ado about Apache and EOGs find in the Alpine, but neither expect to drill much in 2016 and 17 within it, or the fields around it. I expect it to look similar in the Bakken. That heavy dose of drilling from 2012 to mid 2015 will eventually decline, and that is a fact.
You know, at first glance nationalizing oil makes cost issues either disappear or get submerged, but clearly that’s politically difficult.
Might be less politically difficult to nationalize evil fracking type oil.
Sweet spot meme has been around a long time up there.
Really? I did not know that. I thought sweet spots were real, not a meme.
The supposed concentration of drilling only in sweet spots, as if it was ever wise to drill in non sweet spots.
If you finance an infrastructure by drilling sweet spots that reduces the output costs in a certain region, then drilling non-sweet spots in that region starts looking more attractive, and can even compete financially with sweet spots in regions lacking that infrastructure.
Yep. But the Permian basin is full of infrastructure. And North Dakota is full of Indians.
Sweet spots are real. In some cases the sweet spot can be associated with a single high quality layer that snakes around a field, a natural fracture zone created by a fold, or a fault. There are also dead spots, where the rock is too soft to fracture properly, there’s a water sand nearby, or whatever.
Unfortunately the sweet spots aren’t that easy to figure out before drilling. I’ve also seen sweet spots ruined by operators developing the area with the wrong well design. For example, some companies are organized to keep drilling separate from completions and operations. This leads to poor results when drilling gets done to get that well down cheap, completions worries about a high initial rate, and operations have to live down the road with a well that’s impossible to pump because the well plan has tight turns or snakes around too much.
What I’m trying to get at is that sweet spots can be fake (high initial rate but they blow down too fast, etc), they can have sharp boundaries, they can be hard to figure out, or they are messed up by incompetent operators. And sometimes we don’t even figure out there’s one and it sits there for 10 years as we drill our wells a mile away.
This whole sweet spot situation may be effectively grasped by a simple glance at the updated (4/16) graphic from ND’s DMR site … DMR – Information Center – Recent Presentations – Cookfest 7/16.
Page 27 shows the 60 day IPs of all 11,000+ Bakken/TF wells with colored hash marks.
To the discerning eye, there is a large story unfolding as the fringier areas become more viable with increased recoveries and lowered operational costs.
Page 16 of this presentation shows a current typical Bakken decline curve.
The 94 bbls per day at the 5 year mark may be a lot higher than some folks are projecting.
Looks like diffusive decline to me. You have to understand the mathematics of random walk to not be surprised by this.
Mr. Web
The mathmatics of things are way over my head when the numbers get past my fingers and toes resources.
If you are confident that the physics and math are possible to show and explain, I am NOT being the least bit facetious when I say your input may be desired by people trying to figure what exactly is going on.
As I mention down below to Mr. Kaplan, the pressure component is crucial in all aspects of this to both understand and effectively operate in this unconventional field.
Hi Webhubbletelescope,
The hyperbolic with exponential decline at 8 to 10% per year for the tail gives a pretty good approximation. The OU Diffusive model is nice for the tail, but does not fit the data very closely for the first 3 years or so as far as I can tell.
I’ve got to say the PeakOilBarrel is a much better blog than The Oil Drum. Going back over some archives, I dug up this comment that I tried to write on TOD which got deleted quite capriciously.
http://theoilconundrum.blogspot.com/2013/01/deleted-comment.html
Remember when if you would would ask why a comment got deleted on TOD then they would temporarily ban you? … good times
Some of those guys on TOD such as Stuart Saniford could never grasp the Bakken dynamics.
Hi Coffeeguyz,
The NDIC is very optimistic. At 5 years the more likely projection based on past data is about 55 kb/d for the average 2015 ND Bakken/Three Forks well. People get a little too hyped up about high IPs with super fracked wells, they decline very quickly over the first 24 months and then follow the trajectory of the older wells (possibly output will be less over months 25 to 240).
Don’t believe the hype!
Yup, looking at this chart from early 2013 I made, it looks like it is about 60 at 5 years.
http://img4.imageshack.us/img4/9282/bakkenmasondiffusionalm.gif
Bloomberg – Crude Glut Belies Risk From OPEC’s Dwindling Output Cushion – September 16, 2016
Members of the Organization of Petroleum Exporting Countries had about 1.1 million barrels a day of spare production capacity last month, the U.S. Energy Department estimates, compared with more than 4 million in late 2010.
In 2011, after unrest in Libya cut output in that nation by about 1.5 million barrels a day, OPEC members
tapped into spare capacity as oil prices shot up above $120 a barrel. Angola pumped more that summer,
while Saudi Arabia increased its own production by 1.35 million barrels a day.
http://www.bloomberg.com/news/articles/2016-09-15/global-oil-glut-belies-risk-from-opec-s-dwindling-output-cushion
OPEC, Russia and USA compared, Reuters chart: https://s22.postimg.org/i29x50j81/2016_September_OPEC_vs_non_OPEC_oil_production_Re.png
Good article. Point is, if we hadn’t increased imports as much as we have this year, then the US would be below supply levels that were normal, considering US production drop. Why the excess amount of imports? Yes, US refiners need heavier oil, but not that much, surely. The answer may be that refinery leaders are not stupid. OPEC can’t be relied on for excess production, capital expenditure losses spell a future of loss of supply, it is cheaper now than later, and the excess supply helps keep the price down, because traders are not the sharpest tool in the shed. So, the new “normal” supply is closer to what they have on hand, now. Over a thirty day supply, rather than a “normal” 25 day supply.
Let me see if I can help out these challenged traders who are trying to stroke hard to keep afloat with the massive oil supply in the US.
Going back through the EIA reports which show the month to date increases in imports from the prior year, I came up with an estimate of over 150 million more to 8/31/2016 than last year. Corresponds a lot with the decline in US production. So US supply has remained pretty much the same as the first of the year. If imports had not increased to a very high level, the US supply data would put us at an extremely low level in relation to production. Obviously, the refineries feel they need this high level of supply. The same is true in China, where they are trying to amass a much higher level of inventory.
It is what they want. It is not excess.
OPEC is no longer a swing producer, and can’t be relied on to ramp up much more oil than 1.5 million a day. In the meantime, with these low prices, non-OPEC production is tubing. No one is sure how much, so the excess supply is part security. They are also hedging against future prices. Additionally, it seems to create havoc among the traders, who keep the prices down.
Hi,
Great to see posts from you again Ron. Here are some updates from me.
First average well production grouped by year. The production in general is declining slowly or even increasing a bit since last month.
Here is the corresponding Gas to Oil Ratio graph. We can see that GOR continue to increase rapidly except for 2008 which has been in decline for several months. Water cut for 2008 has on the other hand increased from 30% to 33%. So an explanation that production is increasing at the same time as GOR is decreasing for 2008 could be that wells with higher water content but lower gas content has been put back into production. But I have not looked into it if that is the case.
Maybe wells with high GOR are being cut back.
Note: it looks like these wells can be said to shift to an exponential decline after five years, the decline rate for a large well group will be about 8-9 %, the decline rate for individual wells can be set at 7.5 % as a ballpark approximation. This allows taking the existing data to estimate recovery to different well economic limits (say 10, 15, 20, 25 BOPD). This is being done on an individual well basis but the results are sold, they don’t get released (I don’t know anybody who gives way such detailed work for free).
But if they are cut back then why is oil production flat during the last few months? I would have expected a decline in that case.
I didn´t follow your discussion about decline rates. Current yearly decline rate from the first graph is around 20% for 2008 and 2009, 10% for 2010 and 17%for 2011. So from where did you get 8-9%?
Wells with high GOR don’t produce as much oil. The high GOR signals depletion. Thus it’s possible to cut back high GOR producers and focus on the lower GOR ones. Hell, it’s too complicated to figure it out without a very detailed system description.
Regarding the eventual decline rates, focus only on the wells with long lives. If you take individual wells and express their rates as a fraction of the rate during the 60th month, plot that, and do the exponential decline curve fit you’ll get 7 to 8 % (I think). The total well population will decline at a faster pace because better wells decline a bit faster and because wells go off when they reach the economic limit.
Ok so wells with hight GOR and low oil production are choked while wells with high water cut and better oil production are put back on production. Yes that could also be an explanation.
Yes wells with lower oil production appears to decline slower. So that would give a lower number. Few wells have been abandoned between month 60 and 72 though, so that should not affect it that much.
It could be. There are several papers floating around on how to allocate production when there’s a system bottleneck (such as a gas compressor or a water disposal well). But we are just speculating.
It was a long time ago I posted the water cut graph. So here it is. It´s based on the production profile so all the wells in each data point are of the same age, which is not the case for the two graphs above. Each year starts of higher than previous year except for 2012 and 2013 which are identical and 2014 and 2015 which also look identical so far. I have no idea why it looks like that.
Yo what’s the 2008 uptick? Was that re-completions mid 2014? And why none for other years?
You mean the first graph? We have discussed that before. It´s because of re-completion and/or the “halo” effect where old wells get higher production after a new wells get completed close to the old ones. This happened mainly for EOG wells in the Parshal area, but also in some other places.
Ya, recall recompletions, odd only that year.
Note that there were fewer wells drilled in 2008 than 2010 and later. So when EOG does work that affect many of its wells completed in 2008 at the same time, then it is very noticeable in the graph. 2007 has even fewer wells and in my data I can see examples of wells with increased production which looks similar to the wells in 2008. They however seems more spread out over time in 2007 which gives the average production more of a flattish look. So don´t expect the wells to have those low decline rates after 9 years without any sort of work done to them. In fact looking at individual wells I see many cases with very high decline rates.
The Baker Hughes Rig Count is out.
Thanks for the post Ron.
I also have an update on the latest release by the NDIC, here.
Re Bloomberg graph on OPEC production. It gives a wrong impression. Has this to do with Indonesia rejoining OPEC in 2015?
http://www.eia.gov/todayinenergy/detail.cfm?id=23352
My latest post contains a graph on OPEC (including Indonesia and Ecuador) showing that crude oil production reached 34 mb/d already in 2008 and again exceeding in 2012.
11/9/2016
Incremental crude production update August 2016
http://crudeoilpeak.info/incremental-crude-production-update-august-2016
Matt:
I looked at EIA data on World oil production, and then subtracted US and Canada from the World total.
This is what I came up with, hopefully no math errors:
2005 66.313 million bopd
2006 65.865
2007 65.471
2008 66.469
2009 64.937 (OPEC cut 3/2009)
2010 66.404
2011 66.177
2012 66.496
2013 65.455
2014 65.672
2015 66.941
2016 66.934
Are these numbers accurate in your view?
Remarkable how flat the world, outside of the US and Canada, are per EIA data.
I assume that in addition to US and Canadian unconventional, biofuels are increasing annually. This is something that is not often discussed here, likely should be more often.
What we see now in ND Bakken is a plateau in oil production, due to the local summer conditions. This is part of the decline side of the production curve. Hold your breath for the next winter. It might bring severe decline in oil production in ND Bakken.
This is probably very significant, but it loses me entirely. What’s the theory?
The theory is the Hubbert Curve (AD 1956). What I did while building this model almost 3 years ago, is choosing the right parameters to fit Hubbert’s model to ND Bakken’s data. All real data have noise, but I recognised a seasonal pattern in that noise. So I modified Hubberts Curve and as a result I ‘predicted’ ND Bakken’s oil production within a very narrow error margin until now.
The data (red spots in the graph) do indeed follow the green line (= the model). The other lines are the first derivative of the model and the moving average of the data.
The aim of the model was not only to fit the data but also to fit the first derivative.
Until now that approach was very succesfull. When cumulative oil production since the model was built is considered, the model underestimated reality only 0.9%.
One needs to notice this model was built before the oil price collapse.
Price is not a parameter in the model.
Heavy discussions have occured here about whether the collapse of the oil price has determined the decline in oil production or not. If it dit, I was “lucky” to see my model coincide with the price collapse. If it didn’t, I have a geology based model (like Hubbbert meant it to be). You understand I cling to the latter option. 🙂
Thank you for the explanation.
Do I begin to understand this? A query or two follows below in my paraphrase.
(My paraphrase is offered for correction): Hubbert mysteriously as ever (?) captures oil extraction activity – firstly everybody ‘piling in’ and then a peak followed by decline – apparently independently of ‘price’, even when ‘extraction’ means essentially modular mining of an extensive source rock and/or adjacent tight rocks?
Neither the type of ‘reservoir’ or ‘field’ geology nor adaptive extraction technology seems to alter the shape of the outcome, though these might determine the actual units / numbers of x and y coordinates of an individual Hubbert curve?
Phil, The extraction (or mining) of a finite substance is by nature a finite activity. Typically such an activity starts slowly. Then one starts to make money, for everyone to see, so others come in. Things accelerate. Whatever happens next depends on a lot of things. (Geology, economy, war/peace, technological breakthroughs, catastrophies (like Piper Alpha), sudden additional discoveries…)
Hubbert’s model is a sort of idealised curve, just saying “what goes up, must come down”. It does not take any of the events mentioned above into account. So the method got a lot of criticism in the past. Indeed, you will have a hard time searching for fields with an oil production history that fits Hubbert’s curve exactly. There are always reasons why the data do not follow the curve. Still it’s an interesting curve, because it says: “What goes up must come down, and somewhere down the road you will have a peak.
And the funny thing is: ND Bakken production is a Hubbert Poster Child. It has been for years now and apparently it still is. But from tomorrow onwards things may change and the dataset may leave the curve.
Verwimp
Many thanks for that.
What strikes me as a ‘funny thing’ is the symmetry. (OK if the US 48 as previously measured by Hubbert discovers ‘Alaska’ or later makes a fist of previously off-limits tight oil, we get a shoulder. It seems a pity in this more recent case it has not made a big difference to a lack-lustre US economy.)
I for one will be interested to see your chart next spring!
The symmetry is artificial, just like any mathematical attempt to describe reality. Nevertheless, a lot of fields have indeed experienced a more or less symmetrical curve.
Me too: interested in the chart next spring.
Phil,
Hubble was working in the continental US, in an era when prices were pretty controlled. So, he never took price into account.
The Bakken did a nice Hubble peak some years ago, and declined as expected. Then…prices rose, and so did production. Now prices have fallen again, and…production stopped growing. So, if you want to validate your chart, you really have to include a longer period, which includes both peaks.
Prices matter.
Hi guys,
Hubble was an astronomer, I believe you mean Hubbert.
Right on. That is the problem with commenting on a Friday or Saturday night after a couple of post prandial libations. Or as I can’t remember when I posted it maybe it’s the problem without such.
What, it’s not the Hubbert telescope??
Prices matter… I’m not sure. Actually I really doubt it. What does matter, in my opinion, is people’s expectation of earning money. Sure todays price is an element in that consideration, but that’s it! A couple of months ago someone posted a nice graph of oil production rise and decline in the 30 or so biggest oil producing countries in the 2010-2015 time frame. 15 countries had their production rising; 15 had their production declining. Price mattered everywhere, didn’t it?
Hi Verwimp,
Nobody said it is only prices that matter. A region will produce the oil that is profitable to produce given the geology and development of their fields, at least in the long run. In the short run all sorts of strange things happen with some nations producing more even though they know that producing less might improve their profits. Eventually the high cost producers stop producing or at least slow their rate of well completion and prices eventually rise.
By 2020 we will know if your model is correct even if oil prices remain low.
Clearly World output has not followed a Hubbert curve and there are many factors which could explain this, price is likely to be a minor factor, mostly it has been a combination of politics, economics, geology, and technology.
Dennis, US Shale gives a very diffuse image too: Look at Enno’s overview: https://shaleprofile.com/index.php/2016/09/05/us-update-until-2016-05/
Permian (TX) seems to peak only now, where ND Bakken has peaked 1 1/2 year ago. Same technology, same price history, different outcome. So geology is the main factor?
You are really stringent in only willing to validate my model by 2020. It is nearly 3 years old now, it has predicted the peak-plateau, the bumpyness of the plateau, the timing and the elevation of the plateau, the timing and decline rate of the downslope so far and the post-peak plateau (timing and elevation) we are on now. All of this within a really narrow error margin. So it has proven to be correct so far. My model may start to fail as soon as tomorrow. Still it will be (as far as I know) the only model built in december 2013 or earlier that lasted until now.
Hi Verwimp,
Yes it was an excellent guess for that period and happened to coincide with the crash in oil prices. The URR will be wrong by more than a factor of 2. I agree with Freddy W, it was essentially a lucky guess and by Dec 2018, even if oil prices remain below $50/b until that point (which is unlikely in my view), it will be clear that your model is incorrect, my “low” model (47 new wells added per month) is also likely to be incorrect (it will be too low), output at that point is likely to be 900 kb/d+/-50 kb/d (ND Bakken/TF C+C output as reported by the NDIC for Dec 2018).
Dennis, and Freddy W, If anyone of you can point out a correlation between price and production, please let me know.
@Dennis: You did not answer my suggestion why Bakken declined 1 1/2 year ago and Permian (TX) only recently in the same price environment.
I am starting to think your focus on price is an irrational hope for better days; better as in ‘production will increase again if prices rise again’. That might happen, but that won’t be better days. So there is no reason to hope for it, nor to cling to it.
It is better to check reality with an open mind. Unless you like surprises, that’s for sure.
Hi Verwimp,
Price will affect profits. The Permian basin was developed later than the Bakken and Eagle Ford in terms of horizontal multi-fracked wells. It has lower transport costs than the Bakken and better opportunities for new development than the Eagle Ford and the Texas LTO focus has moved from the Eagle Ford to the Permian.
Each play is unique and there will be many factors that will determine the speed with which wells are completed. The price of oil is just one of those factors.
So in short, it is not only the oil price that matters, I have never said that and I never will, but ceteris paribus a higher oil price will tend to lead to higher output in any given play that produces oil.
If one uses a different scale on that chart there are some periods where oil price and output are correlated, but generally you are correct at the World level the correlation is quite low.
An oil producer will tell you that the price of oil and especially the expected future oil price will affect their decision to drill a well.
It also takes some time for the market to respond to higher or lower oil prices so there is a lag of a year or more in most cases.
What is the URR for the Hubble curve, about 2.8 Gb, and what is the current cumulative? And do you think there might be a transition to a fatter tail next year sometime given the shape of the production curves with longer, thick tails compared to the other LTO areas.
The model runs on an URR of 2.77 Gb.
The current cumulative is 1.81 Gb (since jan 2006).
Fatter tail: Possible. However I can imagine it’s possible parts of the infrastructure of nearly dried out wells may be cannibalised for the new wells. That might cut off the tail.
Hi George and Verwimp,
Have you guys read “Drilling Deeper” by David Hughes?
The “realistic case” on page 60 of the report suggests a URR of 6.8 Gb.
http://www.postcarbon.org/publications/drillingdeeper/
J. David Hughes is an earth scientist who has studied the energy resources of Canada for nearly four decades, including 32 years with the Geological Survey of Canada as a scientist and research manager.
He needs to go back and revise it using the last 2 to 3 years’ data, that he didn’t have at the time. His predicted curves look nothing like what actually happened.
Hi George,
Yes, that is correct. Do you think the fall in the price of oil by a factor of 2 or three might have had an effect? Have you read the report (at least the Bakken section)? If one assumes that oil prices will not remain under $80/b long term, it is likely that Hughes estimate of 25,000 to 31,000 total Bakken wells drilled will be correct.
Does a URR of 2.8 Gb seem reasonable to you for Bakken/Three Forks North Dakota output?
Note that I expect 3.7 Gb of output by 2040 if no more wells start producing in the ND Bakken/Three Forks after July 2016, a highly unrealistic scenario imo.
If we assume only 43 new wells per month are drilled on average between Aug 2016 and Dec 2040 we get the scenario below, which is also unrealistic, but still results in 6.4 Gb of ND Bakken/TF C+C cumulative output through Dec 2040. This is about as low as ND bakken/TF output is likely to go between now and 2030.
The aim of Drilling Deeper is mainly to refute the out to lunch reserve claims from EIA. As such it would be reasonable to assume he has used rather optimistic assumptions of his own as he can do this and still be far below the EIA figures without leaving himself open to accusations of low balling everything.
I think price impacts speed of development more than ultimate recovery. I think quality drops off fast outside the core so there isn’t much that is OK at $100 but not at $50. Even so, as no-one except the company boards and Wall Street gurus has made any money it’s hard for me to see it having any real impact – what did the planning meeting sound like – “We are going to have to cut back on completions so that we lose a bit less than we otherwise would”? I doubt it. The production flattened in August and September 2014, so probably based on decisions in June and July – June was the highest oil price month for ND sweet for 2014 from what I can see. I think the flattening was actually initially because of flare restrictions and may have continued due to price, but maybe someone finally realized that outside the core was crap.
The URR comes from three numbers – the area of the play, the well spacing and the EUR of the well. The number you quote is based on an assumption of 80% drilling in over 12700 square miles, with 3 wells per square mile (or about 200 acres per well. For EUR an important statement he makes is as follows (note the “for comparative purposes only”):
“To be clear, no one knows what the lifespan of a Bakken well is, given that few of them are more than seven years old. Operators fit hyperbolic and/or exponential curves to data such as presented in Figure 2-21, assuming well life spans of 30-50 years (as is typical for conventional oil wells), but so far this is speculation given the nature of the extremely low permeability reservoirs and the completion technologies used in the Bakken. Nonetheless, for comparative well quality purposes only …”
The reality is that the core productive area is only 100km circle, which is about 3100 square miles, and the density in that is about 200 acres per well. The chart below I generated by finding the weighted average productivity centre for last month (i.e. location weighted by flow) and then working out in concentric circles to look at number of wells and production. These drop very quickly outside the core. So no, there was never a chance of going to 33,000 producing wells. The second chart shows the location of the centre and core (it’s an ellipse as the longitude is stretched out a bit.
The production curves he developed have a convex bulge on the decline side and only go into a decay shape once drilling stops. I used to develop such curves for conventional plays (there may be some differences therefore). When you get a shape like his it is because you combine wells with similar profiles and similar timing. The reality is that the best wells (or fields) are developed first – with higher, longer plateaus and slower decay. As poorer wells are added they tend to be more spaced out, no matter what the price regime. If you do that you get something more like a logistic decay, or sometimes it’s closer to a linear decline until near the end (see UK Sea or sections of the USA production curve). However for what he was trying to show this doesn’t really matter.
The likely number of wells can therefore be reasonably estimated now (more work that I am prepared to do and requiring more data than I have) but the big unknown is still the well EUR. Until some wells have run to exhaustion (for the oil or finances) it will still be an unknown. One way of estimating it in the absence of anything else might be to look at the logistic fits to production and see what that implies for each well EUR. Note also that David Hughes shows markedly different EURs for different areas even on the limited data he had.
Hi George,
Even Hughes “low estimate” with a density of 2 wells per square mile results in a URR of 5.4 Gb.
What is your guess for Bakken/Three Forks URR?
Note that the USGS F95 estimate is over 7 Gb for the ND Bakken/Three Forks, so Hughes’ estimate is quite conservative.
The core area shown.
David Hughes’ estimates for EUR – note the strong caveat below the graph.
George
Back in the day on The Oil Drum when drummers first noticed the significance of the Bakken rush, I asked, given the historic importance of stripper wells to then current US 48 total oil production, if 40,000 extra stripper wells from drilling in the Bakken et al in a few decades might leave a tidy continuing contribution to US production. Would this be your ‘fat tail’?
I get the impression that ‘stripper wells’ in the Bakken are going to be something different, even in the core area?
Incidentally, do we have numbers for the wells across US 48 back in Hubbert’s day and subsequently when the symmetry of his curve was realistic up to the time of the Alaskan shoulder? I wonder if the actual number is very different than the number of drillings we see in the tightly spaced Bakken core? Symmetrical curves (‘idealised’ as Verwimp puts it) seem to indicate high ‘statistical’ number covering most of the possible geographical / geological variation. FWIW my ‘money’ is on Verwimp’s observation and model for the Bakken.
Phil – the Hubble curve is a logistic. It is derived from population growth studies, so that the rate of growth is proportional to the current population and the amount of unexploited resource on which the population relies – the population is like the oil produced so flow is the rate. They are symmetric if nothing else starts to affect the population (like birth control or, for oil, changes in price, I’d suggest).
EIA used to publish US well production data but stopped in 2010. I am unable to find the link today – but I posted it a couple of weeks back (don’t know how you find that either though). Note Hubbert quite specifically excluded tight oil, tar sands and oil shale from his estimates. Also his assumption was that nuclear power would take over and drive oil out of business, not that it would become increasingly expensive.
As far as a fat tail and stripper wells I am as in the dark as you and everyone else. The tail production is not known. The E&Ps are highly bullish about it because it is a large part of their assets and sales pitch to investors – I doubt very much we will see anything like they predict.
Note Hubbert quite specifically excluded tight oil, tar sands and oil shale from his estimates
I’ve never heard that before. Do you happen to have a source for that?
Worth listening to Chris Nelder’s podcast on his Energy Transition Show with Mason Inman on Inman’s biography of Hubbert.
The Oracle of Oil
Mr. Kaplan
I thank you for the posts you make on this site and appreciate the long term industry perspective you consistently offer.
Regarding strippers and fat tails with unconventionals … successfully extracting liquid hydrocarbons from 2 mile long tubing not much bigger than a man’s fist for several decades is a daunting challenge.
A few months back, there was an excellent article on just this topic on the site aogr.com.
There is one aspect of this unconventional field that seems not to loom large when conventional folks weigh in with their much valued perspective, namely ‘field’ pressure management.
I purposely hyphenated the term field as each individual lateral can be considered, in large measure, it’s own unique reservoir.
The work being done just across the border by Crescent Point in the Viewfield Bakken with their ongoing, successful waterflood program, is highly instructive (projected recovery of OOIP now 40%).
Granite Oil and EOG are repressurizing/maintaining field pressure using gas re-injection and demonstrating successful results.
All this comes into sharper focus as the repeated, demonstrated increase in output from older wells following nearby fracturing is a longstanding, recognized occurrence.
CG – yes that would be a game changer if it could be made to work. I think gas flood is more likely and some company in Eagle Ford I think has got some wells like that. Note I don’t know anything first hand about tight oil, so treat accordingly, but I hope I can kind of tell propaganda from science and engineering in some of the reports. If I present data I try to show all the assumptions like Dennis, but it can get a bit tedious for just a blog comment so they might get a bit “summarized”.
Nick G – Google Hubbert (except amazingly Hubble does work as well), 1956, Peak, Nuclear and Fossil. The pdf is a scan and you have to read through it to find all the arguments (download on the first site is not working for me at the moment). Hubbert was an extreme technocrat, cornucopian and I don’t think he was that keen on democracy – non elected engineers in positions of power never ends very well from my reading of history.
George,
I found the paper: “NUCLEAR ENERGY AND THE FOSSIL FUELS” from 1956. He discusses Colorado “shale oil” (aka kerogen) in the US, and Canadian and Venezuelan tar sands. I don’t see any sign of a discussion of LTO.
Oddly enough, he discusses “shale oil” in the US and assumes something like 800 billion barrels of oil could be extracted…but then, with no further discussion, doesn’t seem to include them in his projections.
I’m puzzled.
I agree with Dennis on this one. They would not have reduced drilling if the oil price would not have gone down. An ultimate recovery of around 350.000 barrels per well for the 10.000 wells drilled so far is reasonable which gives us around 3,5 billion barrels.
Sorry Verwimp, but I think you have just been lucky with the price drop timing.
Hi FreddyW,
George Kaplan is correct that we do not know the average well’s EUR, we can only guess. I use the data we have to fit a hyperbolic and assume 8% exponential decline after the hyperbolic reaches that level of decline, note that a hyperbolic starts with a high decline rate and over time the decline rate gradually falls (in absolute value).
My well profile assumes about 336 kb over 25 years and the EUR starts to decrease at a 3.5% annual rate after June 2018.
Hughes has a reasonable estimate in my view.
Yes absolutely. Hughes has a similar but higher value than you. 350 kb is just rounded to the closest 50 kb.
I think you should read what I said again – Hughes isn’t telling you what he thinks is in Bakken, he is saying that the EIA is talking out of their collective behinds (it’s a comparative paper only). If you are going to quote him as a source I think it would be reasonable to always state the caveat he gives.
Hi George,
Yes he thinks the EIA estimates are too high and I agree. I read the paper as him showing what he believes are reasonable estimates.
When he says “realistic case”, I believe he means that is his best guess based on the information he has.
Hughes has an update from Fall 2015 where he says his “most likely scenario still looks on track.
http://www.postcarbon.org/wp-content/uploads/2015/10/Hughes-Bakken-Reality-Check-Fall-2015.pdf
Hi George,
His caveat is understood by most, we never know how much oil a well will produce until it is plugged and abandoned, this is very clear. Future output can only be estimated.
Do you believe his “lower” estimate with low well density and 25,000 total wells drilled and a URR of 5.4 Gb is also too optimistic?
What is you expectation for the total number of wells drilled in the ND Bakken/Three Forks?
“His caveat is understood by most” – I think that is about as wrong a statement as I have read here. What evidence do you have for that?
Hi George,
Do you believe that most of the readers of this blog, do not understand that the future EUR of LTO wells is unknown? I am fairly confident that most of the regular readers and commenters at Peak Oil Barrel are aware of this fact.
By “most”, I mean most people here,
I often state the obvious, but in this case I did not.
I will assert without proof that the estimates for the EUR of ND Bakken/Three Forks wells by a geologist with over 30 years of experience (David Hughes) will be better than my estimates.
Hi FreddyW,
I did not mean to imply that my estimate is better, only that it is conservative. I had a mistake in my spreadsheet, the latest model uses a well profile with an EUR of 321 kb over 25 years, after which it is assumed the well is shut in at less than 7 b/d.
The average well has recovered around 200.000 barrels after 5 years. An average decline rate of about 20% from that point is needed to get only about 2,8 Gb for the first 10.000 wells. I don´t rule that out considering how fast the GOR is increasing. But it would also require that no new wells are completed which I think would require a rather fast collapse of modern civilization and I don´t think it will be that fast. I should also say that I´m not an expert or anything. It´s just my personal opinion.
Hi FreddyW,
Also my Bakken model is conservative (possibly due to a conservative well profile), it underestimates July 2016 ND Bakken/TF output by 76 kb/d.
This “low” Bakken model with 47 new wells per month completed is similar to Verwimp’s model through Jan 2018 at about 760 kb/d (Verwimp’s model is about 675 kb/d in Jan 2018). By Jan 2019 the difference becomes more noticeable with my model at 700 kb/d and Verwimp’s at about 450 kb/d. My guess is that both of these models will be too low as oil prices will rise to over $90/b by that time and the completion rate in the ND Bakken/TF will rise to over 100 new wells per month. In that case Jan 2019 output may be close to 900 kb/d.
Hi George,
I think that you suggested that lower output wells might decline faster, this seemed counterintuitive to me.
Using Bakken data provided by Enno Peters I sorted the data so only active wells from the Bakken and Three Forks are included, this was about 10,000 wells with starting dates for first production between Jan 2005 and Aug 2015 because I only wanted to use wells with at least 12 months of output. Then I found the 12 month cumulative output of each of the 10,000 wells and sorted the wells by the first 12 months of cumulative output and divided into 4 quartiles with 1Q having the highest output and 4Q having the lowest 12 month average output.
Then I found the average well profile for each of these 4 groups and plotted the natural log of monthly output vs year from start of production. There was only enough data at the tails to look at 3.5 to 5.5 years from first output (minimum of 324 wells at 5.5 years in the 2Q group, but over 400 wells in the other three).
I put a trend line through the data to find the average annual decline rate and found the 1Q group declined at 15%/year, 2Q was 11%/year, 3Q was 6.6%/year, and 4Q was 4.1%/year.
Based on this it seems as output falls decline rates also fall, so the assumption of an exponential decline rate at 8% may be too conservative.
“I think that you suggested that lower output wells might decline faster, this seemed counterintuitive to me.” – nope, I never said that. If you are referring to the comment where I tried to provide food for though about way the production profiles for Bakken (and I also had in mind Eagle Ford) don’t look like David Hughes predicted but do look like a lot of conventional plays then I clearly said it was for conventional and might not apply to non conventional and the list of things that make for a good well was “and/or” not “and”.
Like everyone else I do not know what non conventional wells look like over 30 or more years, we have no data and I haven’t seen any models – but I’d guess given how variable they are initially they are as much so later on, so any one model might not be much use.
I think simplified well curves are mostly just an interesting discussion point, there is some science for a pressure support,dry gas blow down, but otherwise the water cut, GOR, composition changes, etc. make for too many variables. Extrapoliting forward when there is nothing to even begin to compare against has no merit to me at all.
Above I suggested 7.5 % per year. I did a back of the envelope figurin’, but I usually have pretty decent Kentucky windage.
Maybe we need to revisit the per well OPEX? Did it drop as we guessed a couple of years ago? I mention it because 7 BOPD looks skinny.
Hi Fernando,
Not sure what you mean. Are you suggesting the wells will be shut in sooner at maybe 10 b/d? I got the 7 b/d guess based on conversations with Mike Shellman and shallow sand. I am using 8% per year after the hyperbolic gets to that level. I base the hyperbolic on a least squares fit to month 3 to month 36 to 60 depending upon how much data I have, the well profiles have been shifting higher from 2013 to 2016 so it is a bit of a moving target, the well profile had been relatively stable from 2008 to 2013.
I just re-evaluated the hyperbolic using the latest data from Enno Peters.
I get q=12,935, b=1.274, and D=0.1907. The EUR is 350 kb, well shut in at 25 years at 7 b/d, exponential decline of 8.97%/year after month 98. There are 6480 wells in the average.
Data for Jan 2008 to Dec 2013 average well is below, monthly output in barrels per month:
8125
11275
8903
7968
7260
6648
6174
5698
5370
5077
4760
4533
4368
4136
3991
3809
3685
3529
3382
3271
3136
3067
2986
2897
2830
2726
2659
2633
2546
2498
2402
2337
2279
2229
2188
2168
2142
2121
2066
2017
1992
1947
1941
1907
1896
1883
1871
1844
Dennis, I don’t remember at what oil price I suggested the economic limit of a typical shale oil well would be reached but at <$40.00 I believe that limit is now more like 12-13 BOPD (discounting gas in the revenue stream completely). It could be more than that depending on produced water costs. Interest expense per barrel of oil is now a big deal in shale oil economics.
Three years ago, here on POB, I suggested that decline curve analysis in unconventional shale resources, and the role long tails would play in UR, was suspect to me. Dense shale is not rock we are accustomed to producing; I suspect as pressure depletion occurs there will be proppant embedment and fracture closure that begins to affect fluid conductivity to the well bore. Also, a number of costly mechanical difficulties occur in rod lifting low fluid entry HZ wells that will end up causing premature death. I can go on about why, but I don't expect to see a lot of 18 year old shale stripper wells. We are plugging a lot Eagle Ford wells already in S. Texas.
Pressure maintenance (gas re-injection) is a costly pipe dream by shale oil cheerleaders; it has NOT worked in the Eagle Ford. I know that for a fact. Nor will water flooding. Source beds are not “closed containers” and that is precisely why the hydrocarbons made in these source beds migrated up into overlying sediments in producing basins. Induced gas will do the same thing. Re-frac'ing in S. Texas (and in the Bakken, from what I can tell) is an economic disaster thus far. Both Rune and Enno seem to think, for instance, the ultimate UR from an average Bakken well is around 300K and I think that is a good number. In the Eagle Ford it is less and in the Permian I believe it will be even less, per formation; the only thing the Permian has going for it is multiple stacked horizons to plug back to.
I like David Hughes' work. I believe that for all the horse dookey about unconventional shale resources in N. America, at the moment we have only bought ourselves something like 4 years of total daily oil consumption in the US, at the most, from shale oil. And that has come at enormous costs that now cannot, and will never, be paid back.
Mike Shellman
Hi Mike,
What output level were those Eagle Ford wells when they were PA’d?
Thanks for the info. Note that I do not expect oil will remain at $40/b long term.
What would be the shut-in level with a guess of average water cut of 40% and oil prices at $85/b? I think over the long term that is a more reasonable guess at the average oil price (though $100/b is not out of the question).
I will defer to your experience, if we assume the average well is shut in at 15 b/d (and this will vary from well to well of course), the average well gets shut in at 17 years and average EUR (2008-2013 ND Bakken well) is 320 kb rather than 350 kb. In the Eagle Ford the average well has an EUR in the 200 to 250 kb range (with 200 more likely if wells get shut in sooner at 15 b/d). The Permian Basin average well is lower still, though I have not tried to fit a hyperbolic to the data at Enno Peter’s site for the Permian.
Dennis, <20 BOPD and there are a slew of Eagle Ford wells producing at, or near those levels.
I agree with your UR's, basically, and definitely agree that the Permian will likely be the worse shale play in the country, economically.
I don't agree with your oil price predictions. The world cannot cope with 80 dollar anymore. I adhere to Art Berman's 45-58 dollar range, which I believe will last another 3 years or more, with brief exceptions, and that is how I make my economic decisions going forward. By then most of the US shale oil industry will be road kill, short of a massive government bailout. As I said above, I thought, we don't really know yet if shale oil wells will produce anything economical after year 15, regardless of price. So, sorry, I can't help you with what if's, either by way of oil prices or the number of shale wells that might get drilled going forward.
It is, in my opinion, a mistake to make predictions about the role shale oil will have in our energy future without taking into consideration what it costs, its unprofitability, and its accrued debt. Everyone does ignore all that, however; except real oil men that use their own real money; Shallow, for instance.
Wall Street essentially re-married the Permian Basin before it's divorce papers were filed on the Bakken and Eagle Ford. The new marriage won't last long either, watch. When the money is gone shale oil will play only a cursory role in our energy future. Its too expensive and declines too rapidly. It requires too much outside money. It also has it's geologically limitations, another aspect of the picture non-oily folks don't seem to fully grasp.
Saludos, Dennis.
Mike
Thanks Mike,
Interesting oil price prediction, let’s call it $52/b (near the middle of Berman’s range).
Not sure how that happens if the IEA’s demand scenario (1.2%/year increase in oil consumption) and Ron Patterson’s slightly declining (let’s say 1%/year, though Ron only said slightly so possibly less) oil supply are both correct. Is Berman’s expectation that the World economy is about to crash and that oil consumption will not grow?
What makes you think the World cannot afford $80/b oil? The World economy was growing at a real rate of about 2.5%/year from 2010 to 2014, when oil was mostly over $100/b.
You are smart to plan for low oil prices, but I think Berman’s price predictions are far from the mark. You do realize that based on the IEA data from 2Q2016 that World Supply was only 300 kb/d higher than World Oil consumption or 0.3% too high.
Do you expect a big increase in World oil output at $52/b?
Oh and if we assume ND Bakken/TF wells are shut in at 20 b/d, the well only lasts for 14 years and EUR is 300 kb and for the average Eagle Ford well it is about 207 kb and only an 8 year life if the well is shut in at 20 b/d, at 13 b/d the EF average EUR would be 232 kb and the well would last for 12.4 years.
Dennis, Berman provide a price range that I embrace, the number of years that might last is my prediction, not his.
You quoted me, I then responded by saying the current economic limit for most shale wells appears to be more like 12-13 dollars a barrel, not seven. I otherwise have no earthly idea what you are trying to say in your last paragraph. Come to Texas someday and I’ll give you a course on real life oil extraction, A to Z. I promise after that you will focus less on price and more on costs and profitability. Managing debt, however, won’t be included in the course, sorry.
Respectfully, I would get out of blogging business ASAP and get into the oil business even faster. If, sorry, when prices go up to the levels you predict, you will become very wealthy. You can buy shares of stock (go to Seeking Alpha, there are some oil “geniuses” over there), or oil ETF’s stuff like that, but whatever you do, don’t buy working interest in shale oil wells; you won’t like it any, trust me.
Hi Mike,
I believe you said the economic limit was at 12-13 BOPD, then later you told me the EF wells are being shut in at 19 BOPD.
In the last paragraph I am just stating how the average Bakken and Eagle Ford wells that I have modelled using the data provided by Enno Peters (hyperbolic with exponential decline at tail end) will change depending on if the well is shut in at 13 BOPD or at 20 BOPD and the life of the average well at those shut in points.
Maybe you think an economic crash is around the corner, or perhaps there’s a lot more oil in the World than I believe or both, but that’s the only way oil prices remain under $58/b for 2 years or more.
On a re-read of Drilling Deeper, I remember that Hughes mistakenly assumes that the 2013 USGS Bakken assessment was for 7.4 Gb of resources. That assessment was 7.4 Gb of undiscovered resources (only 5.8 Gb expected to be in ND), when the 3.9 Gb of ND proved reserves plus cumulative production at the end of 2012 are added to the April 2013 assessment, the mean resource is 9.7 Gb for the ND Bakken/Three Forks, and for the US Bakken/Three Forks (adding production from Montana) it is over 11.3 Gb.
I made this mistake myself, but realized my mistake after reading a piece by Robert Rapier (link below, see blue box especially).
http://www.energytrendsinsider.com/2013/05/07/estimate-for-williston-basin-oil-resources-is-doubled/
Dennis, It’s a long report. I’ve read large chuncks of it. I really appreciate the report. What it actually says is “EIA’s prognosis is too optimistic, so let’s take that down a little.” I have the impression the author is driving with the hand break on: it feels like he would have taken that prognosis down some more, if not he might have had the feeling to jeopardise his credibility …
I’d like to see a revision of this report – knowing data 2 years further down the road.
Hi all,
An alternative Bakken Scenario.
Only one rig left in the Barnett. In it’s peak year of 2012 a study in OGJ, from University of Texas and Rice, predicted 45 Tcf EUR, in fact it looks more likely to be around 26 Tcf. Bakken and Eagle Ford look to be similarly under performing compared to initial predictions. The methods for evaluating shale oil and gas reserves need to be revised and more realistic numbers published.
http://www.ogj.com/articles/print/volume-111/issue-9/drilling-production/barnett-study-determines-full-field-reserves.html
keep in mind George, without agreeing or disagreeing with your conclusion, price would/will be a determining factor. Since 2012 we have had only one year where prices have been sufficiently high to even think about drilling gas wells, particularly in the higher cost plays like the Barnett and Haynesville. What would the graph above look like if gas had been $6 during that time period.
TT
“What would the graph above look like if gas had been $6 during that time period.”
I think an earlier and higher peak and a steeper decline, but about the same area (maybe 10% bigger). I just noticed that the remaining rig is for oil, there have been no gas rigs since the second week in April, so at the field is just blowing down now, looks like about 15 to 17% decline rate. B-H rig count for basins only goes back to February 2011 but the count was already declining then. Henry Hub rose to $4.50 for a few months in in early 2014 after averaging around $3.60 in 2013 but the gas rigs declined by 1 or 2 in that period.
Bakken completion data, EIA vs Director’s Cut
Does anyone know why the EIA would have different numbers?
North Dakota Director’s Cut – Sept 16th
Jan 2016 71
Feb 2016 64
Mar 2016 66
Apr 2016 41
May 2016 45
Jun 2016 45
Preliminary 41
EIA’s Drilling Productivity Report – Sept 12th
Jan-16 80
Feb-16 41
Mar-16 44
Mar-16 44
Apr-16 40
May-16 57
Jun-16 78 – like this one?
Jul-16 57
Aug-16 52
Enno Peters – Sept 16th
Jan 2016 70
Feb 2016 66
Mar 2016 63
Apr 2016 45
May 2016 45
Jun 2016 45
Jul 2016 47
(I’m just curious, as I guess that 78 is too big to be due to Montana or something?)
The EIA gets it’s data from FracFocus.org…
Definitions and methodology for EIA DUCs estimates
Monthly completion activity is assessed by accessing the FracFocus.org database for all wells that were completed after December 2013. To eliminate recompletions from our count, wells fracked multiple times are only counted once. Because the hydraulic fracturing data is reported to FracFocus.org with a lag, estimates of well completions for recent months are based on weekly FracFocus.org filings and may be updated over the course of several months.
http://www.eia.gov/petroleum/drilling/pdf/duc_supplement.pdf
I think it will be interesting to follow what happens to Chinese oil production. Other countries are also not finding much oil but try to get out as much as possible from their oil fields using infill drilling and other techniques. I´m thinking mainly of the middle east countries and Russia. Of course it depends on how high the oil price will be. But right now the world economy seems rather shaky and we appear to get more negative news when the oil price reaches around 50 $/barrel.
China is the big kahuna. 5% consumption increase last year to 12 mbpd and no reason for that to stop. When they can’t get enough, they have to grab the tankers headed for Japan.
Then it gets interesting.
Sort of amazing how India stays under the radar with 8% consumption growth last year and are now the #3 oil consumer of the world at 4.159 mbpd.
But China is where the war party starts. If their production is going to fall, they have to get more elsewhere. They do have some shale sources. Nationalizing production of that (meaning costs don’t matter) would be politically easier for them.
Maybe the Chinese will sacrifice their own personal comfort to make the world a better place………LOL……Get YA popcorn ready!
What has happened with Chinas oil consumption? According to http://www.mining.com/web/why-china-is-really-dictating-the-oil-supply-glut/ it was down 2.5% in March (Y-0-Y). Bad data, recession or something else?
The relevant para:
The Chinese demand doesn’t show a huge uptick corresponding to the rise in imports. JP Morgan estimates that in March, the total demand for oil in China was 10.3 million b/d, down 2.5 percent over the previous year and down 2.3 percent month on month, whereas the chart shows that imports are higher compared to the same period last year.
JP Morgan is a link to the ZH article that lays out . . . speculation.
The quoted 5% Chinese consumption increase is from the BP bible that mazamascience uses. Good thing to download and keep. Here:
http://www.bp.com/en/global/corporate/energy-economics/statistical-review-of-world-energy/downloads.html
Get the .xlsx spreadsheet. I added a column to it on the consumption tab for per capita using wiki population.
Regardless, 5%. This spreadsheet is about the most comprehensive all-in-one-place oil data I’ve seen. BP spends money on this.
Drilling productivity report, to me, is a meaningless attempt at some kind of averaging. Different number of wells drilled in each formation per month. Like EOG has Eagle Ford drilling down to less than a week. If several, or more, wells are drilled on a single pad, then the potential is for a rig to drill three to four wells in a month. Probably, that happens rarely. Those wells may sit for six months, or longer, before they are fracked and completed. From what I can tell, the rig count has probably increased to drill wells to hold leases. Which doesn’t equate to more drilling in the prime locations. Mixing apples and oranges to get to averages doesn’t begin to tell me how many bananas there are in the bushel.
[…] Bakken July Production Data […]
http://www.zerohedge.com/news/2016-09-17/death-bakken-field-has-begun-big-trouble-us?page=1
The Bakken is in a death spiral, according to the gospel of the analyst SRSrocco.
Oh well.
Scottish North Sea, Profit = revenue: £13.4bn -(operating expenditure: £6.8bn) -(capital expenditure: £10.2bn) = -£3.6bn
BBC News – The value of oil and gas produced in Scotland fell to its lowest level since 1999, despite an increase in production.
The sales value of oil and gas dropped by £4.1bn on the previous year, to £13.4bn.
Operating expenditure (excluding decommissioning) on oil and gas production estimated at £6.8bn – 6.7% lower than the previous year.
Capital expenditure estimated to be £10.2bn, down 17.6% on 2014-15.
http://www.bbc.co.uk/news/uk-scotland-scotland-business-37361670
The North Sea saw record investment when oil was over $100
Bloomberg – Against All Odds, North Sea Proves Resilient to Oil-Price Slump – September 16, 2016
Oil producers in the North Sea were supposed to be among the first victims of OPEC’s battle for market share. Instead their high-cost, decades-old facilities are proving surprisingly resilient to the price slump.
Crude oil and condensate output is likely to continue rising in the U.K. North Sea until 2018 as projects that were sanctioned before crude’s plunge four years ago start up, according to estimates by industry consultant Wood Mackenzie Ltd. Even though production dips after that, output by the end of the decade will still be roughly equal to the 2015 level.
“Production has stayed resilient,” said Ian Thom, an Edinburgh-based senior research manager for U.K. upstream at Wood Mackenzie. “We saw a record number of dollars invested in the high-oil price environment,” and that is still delivering new production.
http://www.bloomberg.com/news/articles/2016-09-16/against-all-odds-north-sea-proves-resilient-to-oil-price-slump
Chart to October 2015 (meter cube): https://s4.postimg.org/8zivtoynx/UK_Oil_Production_Dept_Energy_and_Climate_Chan.gif
Suckers. Oil companies will sell the CEOs daughter in Mauretania before they abandon a North Sea platform when it costs several hundred million thanks to the uk green mob.
Bloomberg – The European Union’s biggest natural gas producer is running out of reserves – September 16, 2016
The Netherlands, also the region’s largest trading hub for the fuel, has used up almost 80 percent of its natural gas reserves, Dutch statistics office CBS said on Friday. Production fell 38 percent over the previous two years and is set to fall further as the government limits extraction because of earthquakes in Groningen, the province that houses the EU’s largest gas deposit, it said.
http://www.bloomberg.com/news/articles/2016-09-16/europe-s-biggest-natural-gas-producer-is-running-out-of-fuel
Libya – new fighting erupted early Sunday between forces loyal to Libya’s UN-backed unity government and those of a rival administration for control of key eastern oil ports…
(just now)
Libya: LNA says it has retaken control of Es Sidr & Ras Lanuf oil ports from PFG.
(earlier)
Libya: PFG retakes Es Sidr & Ras Lanuf oil ports from LNA. oil tank struck during clashes, now on fire.
Not too long ago we had some interesting close air support missions of Qatar vs UAE flown nowhere near either’s borders — in Libya. Way too much analysis neglects oil as the driving force behind motivation, but this one is context:
http://nationalinterest.org/feature/how-the-gulf-arab-rivalry-tore-libya-apart-14580?page=show
The total number of North American oil and gas producers to file for bankruptcy since the beginning of 2015 is now at 102. The total secured and unsecured debt for those filings is approximately $67.8 billion.
http://oilprice.com/Energy/Energy-General/North-American-Oil-Gas-Bankruptcies-Climb-Beyond-100.html
Hi Chartmonkey,
According to the Bank for International Settlements (BIS) there are about $37,397 billion in outstanding debt securities in the US so $67.8 billion is about 0.18% of the total.
http://stats.bis.org/statx/srs/table/c1
State Governments to the Rescue: One of several states to declare State Of Emergency.
SEPTEMBER 15, 2016 PROCLAMATIONS
WHEREAS, on September 9, 2016, a leak was discovered in Shelby County, Alabama of a Colonial pipeline primarily used for gasoline, causing the pipeline to be shut down;
WHEREAS, the repair of the leak is incomplete, and the timeframe for completion is unknown at this time;
WHEREAS, this shutdown has caused a disruption of gasoline to be distributed for the use of citizens throughout the State of Alabama;
WHEREAS, this shortage could impact the safety of the residents of the State of Alabama;
http://governor.alabama.gov/newsroom/2016/09/governor-bentley-declares-state-emergency-facilitate-granting-usdot-waiver/
If you live on the US East Coast – fill up – and drain local inventory.
“Even before the spill, Colonial has been criticized by oil industry stakeholders for refusing to expand its pipeline space, resulting in higher prices. ”
? Unlimited Refined products for US East Coasters ?
http://cleantechnica.com/2016/09/18/6-states-declare-emergency-after-koch-owned-pipeline-spill/
So within essentially 2 days of no gasoline, it’s a state of emergency.
This is a lesson for the we-don’t-need-oil wackos.
100 years ago, if all the horses had disappeared, it would have been a true disaster.
Now…not so much.
1916, we had a lot of motorcycles, tractors, cars, trucks and trains. Electric trolleys and electric trains were also well along in use. Would have been a problem in rural areas but mostly an inconvenience in more populated areas until more automobiles and trucks were built. The carriage industry had been overtaken by the automotive industry by 1915.
Amusing factoid:
In a New York City traffic study undertaken in 1907, horse-drawn vehicles moved at an average speed of 11.5 m.p.h. A similar study conducted almost 60 years later found that automobiles moved through the city’s business district at an average speed of only 8.5 m.p.h.
An interesting account of the horse pollution and congestion problem of the late 1800’s.
http://www.uctc.net/access/30/Access%2030%20-%2002%20-%20Horse%20Power.pdf
So now we have distributed the pollution problems worldwide, into the water and atmosphere as well as the land. How democratic.
Tractors really only just started being used in farms in the 1910’s. If all horses had disappeared in 1916, it would have been a catastrophe for food production.
By the 1930’s, not so much. Of course, all of those displaced farmers had a lot to do with causing the Great Depression. Farming was a very, very hard life, but the very fast change caused by tractors was very painful.
Change is generally a good thing. Very fast change, without careful planning, not so good.
Nick,
Horses do not just disappear(unless you believe in magic or aliens) , it might take a few years even if a worldwide unstoppable plague decimated them. I doubt that would happen since we already had vaccine technology.
The loss of horses over time would have just pushed the powered tractor timeline ahead. But it was already being produced by 62 manufacturers.
The first steam plowing traction engine was exhibited in 1854.
Ever heard of steam tractors, oxen? Gasoline powered tractors were in mass production by 1917 without any horseless incentives. The development of the powered tractor has started in the 1800’s and many were under production by 1910.
1915/1916 62 manufacturers listed models of tractors produced
By 1916-17 they had power take-offs, battery start and electric headlights.
https://www.asabe.org/media/129814/timelinespart1.pdf
I do agree that a loss/reduction of horses would have been a problem, but groups of farmers sharing a gasoline tractor could have worked until more became available and the governments would have stepped in to hasten the process and make things available. People would have really gotten into home and community gardening too.
Horses do not just disappear(unless you believe in magic or aliens)
Well, sure. In a sense, this whole argument is silly. But…it’s a reply to those people who say that if oil disappeared overnight, we’d be in deep trouble.
And…it’s true. If aliens stole all our oil overnight, from our tanks and oil fields, then…we’d be in deep trouble.
And, if all the horses disappeared overnight, say, in 1916 (or 1880, if you suspect we could have adapted with the small fleet of tractors that had been sold by 1916), we’d have been in deep trouble.
It’s just an analogy.
The population explosion of horses in the late 1800’s to early 1900’s was very problematic. An increasingly rich and growing society kept funding the growth of the horse population for transport and agriculture. Without the invention of the automobile and tractor, we would have needed a lot more farmland. As well as being neck deep in horse droppings.
From what I have read each horse took 5 acres for food, while that five acres could feed 8 people.
Industrialization/the green revolution/cars just created new and worse sets of problems over time.
Horse droppings are excellent for farmland; industrial agro, not so much.
Technology to make money is the wrong intent for it and renders it fundamentally untechnological.
Same thing with art. Art with the profit intent isn’t pure art. It’s ‘commercial art’.
Real technology is to improve lives over the long term, not to make money.
The fundamental intent, like the initial conditions/’seed’ (butterfly effect) can largely determine what we get on the other side over time. That’s why we need to think harder and talk better about initial conditions… Like transitions to so-called renewables, say.
As well as being neck deep in horse droppings.
There’s a reason urban homes of this period were built 6 feet above the street level!
“Horses do not just disappear…”
No, but an epizootic can render essentially all of them incapable of doing work for a few weeks, and kill up to 10 percent of them.
https://en.wikipedia.org/wiki/Equine_influenza#1872_North_American_outbreak
http://www.heritagebarns.com/the-great-epizootic-of-1872
US Production vs Imports
EIA – Weekly Supply Estimates – Domestic Crude Production, Net Crude Imports (excluding SPR) and Crude Oil Ending Socks (excluding SPR) to September 9th 2016
The difference between the orange line and the dark blue line is = Line 13 in the U.S. Petroleum Balance Sheet = (Crude Net Refiner Input) -(Production + Imports – Stock Change)
(million barrels)
Hi Chart Monkey,
If you want to tell a story with a chart, fewer lines (maybe no more than three) would make it clearer. Though my charts often make the same mistake and are probably only clear to me.
The main story I get from your chart is that stocks have gone up because we are refining more crude.
I am willing to try to explain things more but also I don’t really have time to write an essay. And so I guess that a chart like this will probably only appeal to people who already have an interest.
I happen to know from social media and places like SeekingAlpha that this is a hot topic at the moment: “Domestic Production vs Crude Imports”
And all of those lines are relevant. I guess that I could have left out the orange line but line 13 is +513 kbpd at the moment, that’s 3.591 million barrels per week. And so people who already follow Wednesdays EIA Petroleum Status Report are likely to be interested.
There are a lot of people on here who have an engineering background and I’m guessing that they can understand more than 3 lines at a time.
Hi Chart monkey,
Is your legend correct?
Should it be Production + Imports – Stock Change?
The WTI line needs some work, better to leave it off unless there is a factor that it should be divided by, and you might mention what it is.
The chart shows the increase year over year per imports, but unless you add up daily amounts, it doesn’t clearly reflect totals of imports. As I posted above, it is around 150 million, year over year from the previous. According to monthly averages per day per EIA. The past year, that is where the increase in the stock level comes from. Refiners want that level, or they wouldn’t pay for extra oil.
I simply took the ending months difference between last year and this and multiplied it by the days in the month to come up with 150 million more. Not mathematically correct, but a good estimate.
Dennis has chart envy ?
I have emoji envy. ‘u^
I like it – was perplexed until my poor eyesight determined that $WTI was not SWTl. The most recent black and blue declines are of interest. https://www.amazon.com/Visual-Display-Quantitative-Information/dp/1930824130
[…] Bakken July Production Data » Peak Oil Barrel. […]
Had it not been for 41 new wells to become active, the production from the Bakken/Three Forks would have been even less than the 977,000 bpd.
http://www.cnbc.com/2016/09/19/oil-explorers-have-a-new-philosophy-less-is-more.html
Less is more until nothing is everything?!
the quote on the video is “last year was the lowest volume of oil discoveries for 70 years”
Oh, it has all been so predictable….
Which way is wealth being Transferred? Oil be a wealth Multiplier as it moves downstream? Destroying wealth down-hole allows money to be made up downstream ?
“In short, the key question is whether the effects of higher investment in the industry will outweigh the negative effects on the economy under an environment of higher prices. ”
http://oilprice.com/Energy/Energy-General/How-Low-Oil-Prices-Failed-To-Stimulate-The-Economy.html
A gem from that link:
“The paper further mentions that in the current environment, persistently higher forecasted oil prices are not required in order for new investments in shale oil to be made, specifically citing the speediness with which unconventional shale oil producers are able to respond to price changes when compared with conventional oil production. More and more companies are attaining 18-month payoff periods and able to hedge significant parts of their production due to steeper decline curves.”
Yo, SS. You see any shale 18 month payoff periods?
Just in general, people, when things don’t seem to make sense, try to wrap your minds around the reality that QE and Central Bank intervention in more or less everything has destroyed the meaning of money. With the meaning destroyed, this shale 18 month payoff for wells that IP at 900 bpd and are at 500 end of year 1 (or worse) . . . it just doesn’t really have to make sense.
I’ve never liked money’s meaning anyway.
Due to its symbolic nature, money’s always been a distortion. Now, it’s even more of one.
Given that, I fear even more its impacts on reality.
Watcher:
Just to play devil’s advocate, you say: “this shale 18 month payoff for wells that IP at 900 bpd and are at 500 end of year 1 (or worse)”
So:
Month 1 -> 900 (bpd) * 30 (days) * $40 = $1,080,000 revenue
Month 2 -> 850 (bpd)
Month 3 -> 800
Month 4 -> 750
Month 5 -> 700
Month 6 -> 650
Month 7 -> 600
Month 8 -> 550
Month 9 -> 500
Month 10 -> 100
Mth 11 thru 18 -> 100 per month
run the maths and you get a total dollar revenue of exactly $9,000,000 at $40 oil and some pretty steep second year decline, dropping from 500 bpd to 100 from month 9 to 10..
Can’t they drill, complete and start sucking out oil for $9m or less per well? If they can, then it sounds like a reasonable quote ‘to get pay back in 18 months’. At least, not a million miles from the ball park.
I compared last months well types with this as below, based on the info in the GIS map on the ND DMR web site – I don’t know exactly when these are down loaded but I think it is more up to date than the monthly report numbers. The interesting thing to me was that the drilling and completions are entirely separate. Drilled wells become NC, and NC wells become A (active) or for a few TA (temporary abandoned) or NCW (Non completed waiver if they have gone over the two year limit I think this means). This makes sense so the drilling and completions crew can optimise their own work without interfering with each other. But also it means there has to be a large inventory of DUCs – each company needs at least a months worth of inventory, and maybe as much as 6 months, just to be able to plan ahead. So talk of a sudden draw down on DUCs to provide a big production boost is probably not correct.
The numbers won’t exactly match the ND DMRs as I convert Confidential wells to NC, A, LOC based on spud date and latest production data (not exact but close I think, the GIS data is more current than production data.