The NDIC has published their monthly update for Bakken Oil Productin and all North Dakota Oil Production.
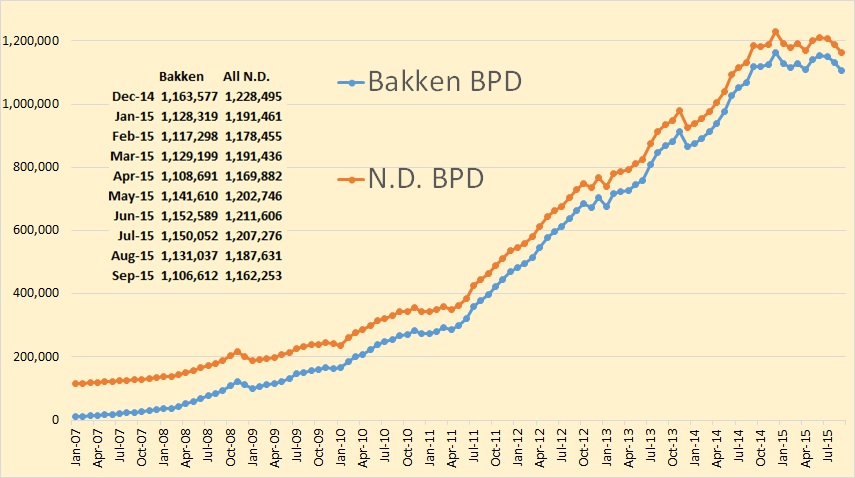
Bakken production was down 24,424 barrels per day while all North Dakota was down 25,378 bpd.

Here is an amplified version of the last 15 months of North Dakota production. September 2015 production is now below September 2014 production so the 12 month average has now turned negative.
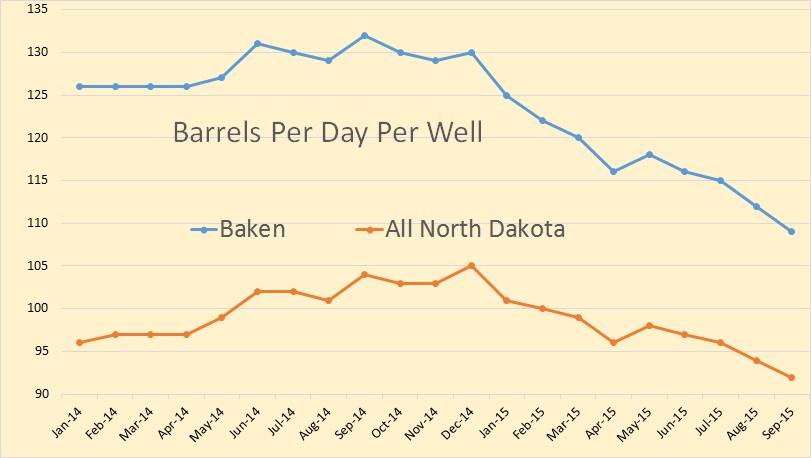
Even though producing rigs in North Dakota declined in September, barrels per day per well declined also from 94 to 92. Bakken bpd per well declined from 112 to 109.
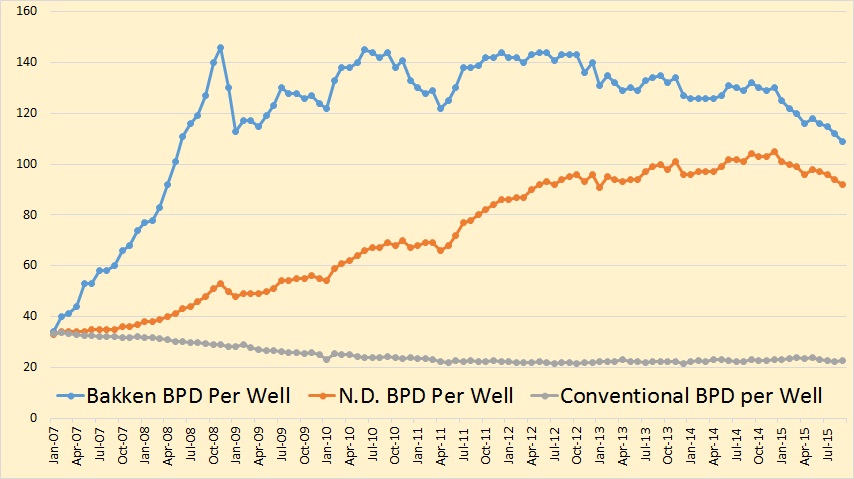
This is a long term view of Bakken and North Dakota barrels per well.
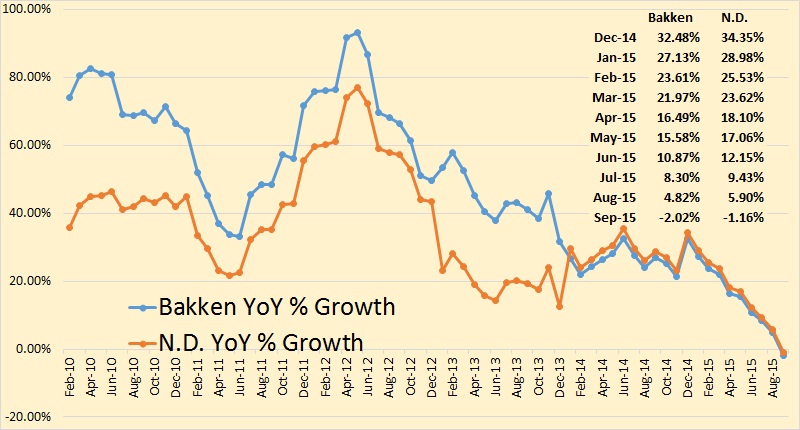
Bakken year over year percent growth has finally gone negative.
From the Director’s Cut, bold mine.
August Producing Wells = 13,031
September Producing Wells = 13,025
10,228 wells or 78% are now unconventional Bakken – Three forks wells
2,797 wells or 22% produce from legacy conventional pools
August Sweet Crude Price1 = $29.52/barrel
September Sweet Crude Price = $31.17/barrel
October Sweet Crude Price = $34.37/barrel
Today’s Sweet Crude Price = $31.25/barrel
August rig count 74
September rig count 71
October rig count 68
Today’s rig count is 64
Comments:
The drilling rig count decreased 3 from August to September, decreased 3 from September to October, and dropped 4 more so far this month. Operators are now committed to running fewer rigs, but drill times and efficiencies continue to improve while oil prices continue to fall. This has resulted in a current active drilling rig count of 12 to 15 rigs below what operators indicated would be their 2015 average if oil price remained below $65/barrel. The number of well completions rose slightly from 115(final) in August to 123(preliminary) in September. Oil price weakness is now anticipated to last through next year and is the main reason for the continued slow-down. There was one significant precipitation event in the Williston area and one in the Minot area, 5 days with wind speeds in excess of 35 mph (too high for completion work), and no days with temperatures below -10F.
Over 98% of drilling now targets the Bakken and Three Forks formations.
At the end of September there were an estimated 1,091 wells waiting on completion services, 98 more than at the end of August.
Helms’ comments about the number of wells producing is interesting. He has North Dakota producing wells declining by 6, from 13,035 to 13,031. However the stats, from my links up top, has Bakken producing wells increasing by 46, from 10,114 to 10,160. But of course Helms is talking about total all North Dakota wells. The North Dakota stats said producing wells numbered 12,630 in September, down from 12,651 in August, a decline f 21 producing wells. This means that at least 67 non-Bakken wells had to be shut down during the month.
But it had to be a lot more than that. If 123 wells were completed, 98% of them in the Bakken, but Bakken producing wells increased by only 46, then a lot of Bakken wells had to be shut down as well. In fact if 123 wells were completed yet the number of producing wells fell, either by 6 as Helms said or by 21 as the NDIC stats indicate, then somewhere between 129 and 144 producing wells had to be shut in.
But more importantly some of Helms’ numbers just don’t make any sense. Wells awaiting completion increased by 98. That means 98 more wells were drilled than were completed and 123 wells were completed. So for those numbers to be correct then 221 wells had to be drilled. Average rig count during September was 68. So each rig had to drill 3.25 wells during the month or one well every 9.23 days. I just don’t believe it.
Based on the latest data from the NDIC, I updated several charts. As always, I am grateful to the data quality and availability that the NDIC provides.
The following chart shows the amount of oil produced by wells starting in different years. Wells in ND that started before 2015 are together producing 800 kbo/d in September.
The following chart shows the amount of oil, gas and water produced each month. It also shows the Gas/Oil ratio (GOR), and Water/Oil ratio (WOR). The latter ratios seem to have somewhat stabilized recently.
The following chart shows the average cumulative production from all wells in ND, by starting year and by months since the peak month. Wells starting in 2015 are tracking those starting a year earlier remarkably well. This is in contrast with a remark by Helms that wells in May are 25% better than a year earlier. Over time, it looks to me that the % difference in cumulative production from recent wells with wells from 2010/2011 will be very small.
The following chart shows the same data, but now in daily production, and not cumulatively. Unlike in the above chart, I didn’t cut any data at the end of the tails, despite them having fewer data points. So expect those tails to wiggle as more wells continue through their life cycle. Especially the drop at the end of the 2008/2009 tails may not reflect the average of those years. It does show to me however that an endless (40-50 year) continuous tail may be overly optimistic.
In the following graph we can see the average daily production for new wells, for the full calendar month (as no accurate information is available regarding the number of producing days). The blue line shows the average production during the 1st month of production, while the green line shows the average production during the first 3 months of production. This graph shows more clearly that 2014 wells produce initially a bit more than 2013 wells, but from 2014 onwards there has been no significant improvement any further. I still can’t detect any effect of high grading in 2015. I think the likely explanation for that is that operators have always focussed on their best area’s, not just recently.
The following chart shows the new number of well spuds (red), and wells starting production (green), per month. The yellow line tracks the wells that are spudded, but not yet producing. The strange thing is that this number is lower than the estimated number of wells waiting for completion by Lynn Helms.
This can never be the case, as the drilling itself also takes time. I expect that Helms’ estimation is quite wrong, as my calculation is based on the status of all individual wells, while his is some kind of estimation based on a 5 year average.
In blue I show the fraclog/DUCs according to my definition: the wells spud and not yet producing for 5 months. The reason is that it is quite typical for wells to wait 3-5 months before they are completed, so it would be wrong in my opinion to put a well directly after drilling in the DUC category. This blue line represents my best guess of the excess wells that are not being completed, above a standard level of working inventory. The reasons why they are not being completed can vary. I suspect many of them may just not be economical to be completed at the moment, but at least some of them are held off from completion as the operators have enough cash flow, and expect better oil prices in the future.
Most production in ND comes from the Middle Bakken and Three Forks formations. Middle Bakken wells produce on average about 15% more than Three Forks wells (which makes them in my opinion economically much more attractive). However, production from the Middle Bakken is declining now faster on a % basis. The reason for this is that ever fewer Middle Bakken wells are being drilled. I suspect that this is because the sweet spots for Middle Bakken wells is running out, and I think that this is the biggest story of the dynamics of oil production in ND. The following 2 charts demonstrate this.
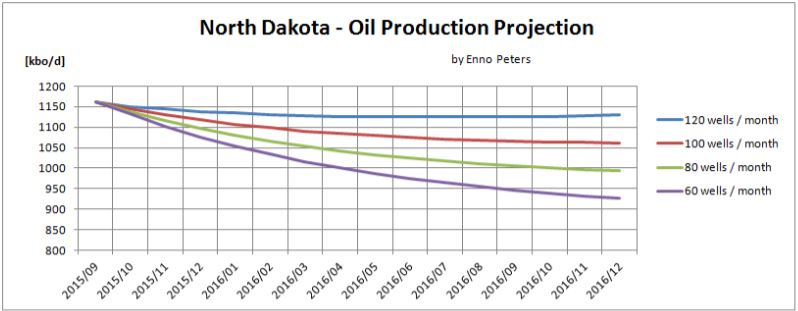
Three months ago, I showed a projection of ND production, and I said: “Therefore, I think the most likely projection is between the green and blue line, at least for the coming 6 months, which means that by year end ND should produce between 1.1 and 1.2 mb/d”.
So far I have the impression that this will turn out to be the case. In March 2016, I forecast that the whole of ND produces between 1.0 and 1.15 mb/d. This is lower than Helms himself predicted (1.2 mb/d until the end of 2016), but somewhat higher than other forecasts I have seen. The oil price, operator’s access to cash, and the quality of the fraclog are the big unknowns.
The following chart shows a projection of oil production in ND based on different numbers of wells being brought online per month, assuming that legacy decline and well quality doesn’t change much (as it hasn’t in the past).
139 responses to “Bakken Big Decline in September”
From up top,
“The number of well completions rose slightly from 115(final) in August to 123(preliminary) in September. ”
I believe from previous discussions, the 123 completions for the month was suppose to hold product steady, yet we have a 20,000 bopd decline. So,
1/ Were the 123 wells brought online were that much poorer than the last months, 115 wells?
2/The decline rates in older wells has increased?
Are the oil producers starting to pay for over producing their wells earlier in the year? I will be interested to see how the GORs are getting on.
Helms has really lost the plot with his DUCs. As Ron points out, for his numbers to be correct, there had to be 221 wells drilled in Sept, with 68 rigs. Folks that didn’t happen. Enno is quoted in the last thread as saying they drilled 97 wells. This is a reasonable number. It also means the DUCs will have dropped 26, but from what number I have no idea.
As Burno Verwimp, pointed out, Aug / Sept were suppose to be the growth months. What is going to happen in the colder months? I think we know the direction. We just don’t know how much.
Hi Toolpush,
Lynn Helms does a poor job of estimating the wells completed. In the Bakken/Three Forks there were 97 wells completed in Sept if we assume all confidential wells were Bakken/Three Forks wells. Scenario below with 135 new wells per month from Oct 2016 to Dec 2017. Output increases by 28 kb/d from Sept 2016 to Dec 2017 (roughly flat over 15 months).
Alternative scenario with 125 wells rather than 135 wells (almost flat output from Sept 2016 to Dec 2017). Output falls from 1107 kb/d in Sept 2016 to 1099 kb/d in Dec 2017.
Legacy decline in barrels per day does not remain fixed it falls as shown in the chart below with 125 wells per month from Oct 2015 to Dec 2020.
Mistake on chart title that is kb/month not kb/d
Actually the title on the chart above is correct. The legacy decline is in kb/d for each month.
Toolpush,
I have 95 wells having first production in September, compared with 93 in August. The well quality didn’t change much, so the drop in production was rather similar as in the August.
Enno,
Thanks for the clarification. It is amazing that Helms can’t get it straight, especially, when you consider the resources he would have at hand.
Hi Enno,
Interesting, I may well have miscounted (though I just double checked). I get 97 wells with first production in Sept 2015 (33 of these wells are confidential wells). I also get 93 new wells for August (same as you).
Hi Dennis,
I filtered out 2 wells that didn’t have a date record for the spud date.
HI Enno
Is there a question about when those wells started producing?
No, you probably won’t make a mistake by including these, it’s up to you. I am a bit more cautious here, and exclude the well from my analysis until it gets a spud date.
Thanks. The difference of two wells is probably not significant, maybe I will use 96 wells instead of 97 (split the difference between your estimate and mine.)
If nothing else is obvious, it is clear that numbers reported by government agencies are seldom going to be very reliable at the cutting edge. LOL . There are too many different people using slightly to noticeably different data and collection and analysis procedures.
I am not a numbers cruncher but occasionally read statistics gathered by agricultural agencies, and no two agencies numbers ever match much better, in terms of the very recent past, than the oil numbers presented here. Like the oil numbers, they tend to come together as the months go by.
Here is a link to somebody familiar to old TOD hands, who is still doing great work on oil.
http://www.energytrendsinsider.com/columns/rsquared/
Hi Ron, Bruno and Enno,
Nice job thanks.
I believe that some of Enno’s charts focus on all North Dakota wells. The chart that follows is for Bakken/Three Forks wells plus confidential wells (I have assumed that all confidential wells are Bakken or Three Forks or Sanish wells, which may be slightly off (roughly 2% of the confidential wells may be in other formations).
The chart shows how 3 month, 6 month and 9 month cumulative output has changed from March 2014 to the present. In each case the data stops at the newest 3 month, 6 month and 9 month wells.
Similar to Enno’s chart for three month cumulative, there has been very little change in average well productivity (output per well per unit time) since March 2014. As Enno Peters has shown in the past there was an increase in well productivity in 2013 and 2014, since that time well productivity has been flat.
The Red Queen effect happens even with no decrease in well productivity, it is due to more new wells being needed to offset the decline of a continually increasing number of producing wells. The current downturn is simply a matter of low prices resulting in lower well completion rates. The well completion rate (number of new wells per month) has fallen from about 160 wells per month in 2014 to roughly 97 wells in the most recent month. As Enno Peters chart shows, 120 well per month would have kept output relatively flat, 140 new wells per month would result in an increase in output (though not very much, roughly flat output would be between 130 and 140 new wells per month).
Nice chart Dennis, thanks. It indeed confirms nicely that well productivity hasn’t improved recently.
For over a year now it’s been pretty clear that quite a lot of these numbers from NoDak are wrong. As far back as 2 yrs ago we could not make sense of wells completed vs output. A theory would be crafted and a month would arrive with data that blew it apart.
There are huge numbers being quoted for Bakken NGL output. Price seems to be nationally about $22.60 / barrel. At the well head . . . shrug.
The wagons were circled aggressively about a year or so ago to aggressively deny that NGLs were getting into oil railcars, despite the infrastructure for processing / separation being less common in NoDak vs Texas. But. . . . certainly would variably corrupt numbers and we do have to face the facts that the numbers don’t seem solid.
This quote is a year old:
“NGLs are routinely stripped from crude in other oil production areas, such as the Eagle Ford in Texas, but in those cases the infrastructure of stabilizers has been in place to do the job where the production sits relatively close to the robust NGL market on the Gulf Coast. North Dakota has no in-state petrochemical market (see Shale Daily, May 27) and is 1,500 miles away from the Gulf.”
Watcher,
NDIC at least provides reliable production numbers. I wish we had similar statistics for Texas and other regions in the U.S. and worldwide.
They also provide raw data on wells, which smart guys like Enno, Dennis and Bruno are processing and presenting to us in this blog.
We already know that Lynn Helms’ interpretation of their own statistics often is wrong, so don’t take it too seriously and let’s be grateful for what we have from the NDIC
Isn’t that data mining?
NGLs in crude oil trains would explain this:
https://twitter.com/KCRG/status/573632057722568704/photo/1?ref_src=twsrc^tfw
Hi. Just two quick graphs I wanted to show. Here is the first.
Thanks Freddy. I wonder if the increased water is due to more frack stages and proppant being used now compared to 2008. The increased gas may simply be due to less flaring due to changes in regulations, but some of the increased gas might also be due to changes in well design (more frack stages and higher amounts of proppant.
Hi Dennis,
No I don´t think so. You can´t see it directly in these graphs, but water cut is not only higher the first months of production. It first drops a bit but then start to increase again. It continues to be much higher than the years before.
For gas production I used the column called “Gas”, not “Gas sold”. I don´t know, but I would guess that they have to include all produced gas there.
Hi Freddy,
I am not suggesting it is frack water. The higher number of frack stages and higher amounts of proppant per well may increase the water produced over the life of the well. I may be wrong, but it is something that has changed over time and may be a part of the explanation.
It would be interesting to get Fernando or shallow sand to comment cause they know much more about real world oil production than I ever will.
To my understanding, more frack stages creates more cracks which casues more more oil (and water) to be able to move. I can´t see the logic why that should cause more water production. The ratio should be the same.
FreddyW,
You got it right, it is about oil/water saturation in the rocks.
Rune,
Any idea why water saturation is rising?
AlexS, short answer, wells in poorer parts of the formations.
A good presentation on oil/water saturation in Bakken (ND) is in the link below (slides 9 and 10 (if I got it right) and look at the heat maps and compare/overlay that with the most productive pools/fields).
http://images.sdsmt.edu/learn/speakerpresentations/Schmidt.pdf
Rune,
I was thinking about that, but this year, by contrast, drilling is more concentrated in sweet spots (high-grading of the asset portfolio, as they call it).
Could higher water content be a result of further donwspacing?
I have a theory why water cut is much higher in new wells! It´s because of more proppant per well as Dennis suggested or actually higher pressure when doing fracking. Higher pressure should mean that the cracks reach further out from the well. There is only a relatively thin cap between middle bakken and three forks. So it shouldn´t be any problem for the cracks to go through the cap. I remember that I have read that there is communication between middle bakken and three forks wells. There is some permeability even if it´s extremely low. So it should be possible for the oil and water to arrange themselves so that there is more oil on the top and more water in the bottom. There are some examples as I remember where wells drilled in the lower part of three forks have produced almost only water. If the pressure when doing fracking for the average well increases then the cracks should reach further down into the lower parts of three forks which would result in more water being produced.
This also explains why the water cut stays lower in older wells. The cracks radiate out in all directions from the wells. So even if there is communication between the old and the new well, for the water to reach the old well it must go first to the new well and then from there to the old well. It should be much easier for it to just flow into the new well instead.
The reason why water cut is increasing slowly over time in all wells is probably because there is some permeability even if it´s extremly low. The oil is being very slowly replaced by water as the wells get depleted from oil.
Hi FreddyW,
This sounds reasonable to me. I have no practical experience in the oil industry as everyone knows, so it will leave it to the experts to evaluate your theory.
Eventually water does migrate through fractured rocks. Also, as the reservoir depletes water expands and mobilizes. To understand what’s really going on you would have to map water cut for each formation using a bubble map and other visual aids.
And here is the second one. They show production data 6 and 12 months after first production.
The 6 months oil production has increased slightly over time. From around 200 bopd to around 250 bopd late 2014, beginning of 2015. Gas and water production has increased a lot more as you can see in the graph. There is a huge drop in the last datapoint, but it is just noise.
In the 12 months after production start graph oil production has stayed flat close to 150 bopd. This means that the decline rate for oil production between 6 and 12 months after first production has increased. Gas and water production has again increased a lot since 2008.
If one had a budget crunch, would not one cut data collection first. And compliance. And ask for forgiveness later if you happen to survive.
Watcher,
If an oil company had cash flow problems, wouldn’t they crank the valves open some what, and worry about what longer term effect on the well later, if they survive?
Probably. My point was directed at the unreliability of the data. Not what it says.
Hi Watcher,
Only the data in the director’s cut is unreliable. The NDIC data that Enno Peters collects is rock solid, better than any other data freely available.
And I use the same data…
Hi Toolpush,
The water cut has been rising from the start of 2008, the recent rise in Gas cut may be due to reduced flaring. I assume flared gas is not measured precisely, and I would think it is not counted as “produced” gas.
If I am correct, the new regulations which cuts back on flaring would increase the amount of produced gas.
The Gas flaring reductions began in July 2014.
http://www.platts.com/latest-news/natural-gas/houston/north-dakota-regulators-adopt-tough-gas-flaring-21841899
In FreddyW’s chart it looks like gas output was relatively flat from 2011 to mid 2013. The start of the rise in gas output doesn’t match when the new gas rules were put into effect, but it also started before the drop in oil prices in the fall of 2014.
Dennis,
What is the definition of gas cut?
Dennis wrote:
”I assume flared gas is not measured precisely, and I would think it is not counted as “produced” gas.”
From NDIC
38-08-04. JURISDICTION OF COMMISSION. (EFFECTIVE FOR TAXABLE EVENTS OCCURRING THROUGH DECEMBER 31, 2015)
e. That the production from wells be separated into gaseous and liquid hydrocarbons, and that each be accurately measured by such means and upon such standards as may be prescribed by the commission.
https://www.dmr.nd.gov/oilgas/rules/rulebook.pdf
So who are we to believe, Dennis Coyne or NDIC?
Hi Rune,
I was not aware of those rules. I see now, there is gas produced and gas sold. I assume Enno and Freddy W are showing the “Gas” column in their charts.
Thanks for the correction.
The Gas regulations would have no effect on this.
Dennis,
Indeed I normally use the “gas produced” column, which does include gas that is flared.
Thanks Enno.
After reading Mr.Likvern’s comment I realized my mistake.
Hi Freddy,
The spike up in gas production seems to coincide with flaring regulations going into effect in July 2014.
Oil prices didn’t fall below $80/b until Nov 2014, so the wide open choke theory doesn’t really line up with the data.
Dennis,
The heading in FreddyWs chart says:
“Bakken ND – Average oil, water and gas production 12 month after first production”
And it has a cut of at 9/2014 (September 2014).
Hi Rune,
FreddyW posted two charts, I was looking at the 6 month cumulative chart.
You are absolutely correct (as always) that the change in Gas Regulations should have zero effect on gas produced (which includes both gas sold and gas flared).
Thank you for correcting my mistake.
It could be a bit hard to see in the graph, but the big spike in the 6 months graph is 11/2014. But I would actually have expected it to start 6 months earlier as the curve shows the production 6 months later. It must mean that they didn´t bother to open up the choke for wells that started to produce earlier in 2014. I think I need to look into it more.
Freddy,
The concept of opening the choke to increase oil production, with a resulting increase GOR, only hold true until the well is taken off natural flow and a pump is installed.
The reason for installation of a pump, instead of natural drive, is because the well has dropped below bubble point and the oil has lost its gas drive.
I am not sure of the time frame, that these wells are put on pump, but it is quite early. I am guessing somewhere in the first 12 months. Shallow or Coffee, may have a much better idea of the time frame than me.
The problem is,if these wells have been over produced early in there life, the formation will have been damaged. This will raise its ugly head further down the track. The fat tails that are suppose to produce nearly half of the URR, is not going to be there.
Tool (and FWIIW), data from 3 very good wells (Oasis, Alkali Creek) which were reported started as of Jan 2015.
HELLING TRUST FEDERAL 5494 43-22 10T (117 kb during first 6 months)
HELLING TRUST FEDERAL 5494 44-22 6B (182 kb during first 6 months)
HELLING TRUST FEDERAL 5494 44-22 7B (142 kb during first 6 months)
These 3 wells started out with a GOR around 1.0 and 4-5 months later had a GOR of around 1.5. And (appear) temporarily shut down since Jul 15. This could suggest they are being put pumps.
Rune,
Are you saying these wells have been shut in for 2.5 months? That is not a pump change. I have no direct experience beam pumps, but I can’t see how it could take more than a week to install a beam pump.
Kill well
pull tubing
run new completion
install pump
hook up flow lines
If these 3 wells have been shut in from 15 Jul to the end of Sept, then there has to be something else going on.
Edit,
Rune,
A sI suspected there is something else going on. Last month Oasis had a blowout on a non producing well.
http://themilliondollarway.blogspot.com.au/2015/10/tuesday-october-20-2015.html
The well: known as Helling Trust 11-15H, permit #17636.
This well runs diagonally across the lease that your 3 stated wells are drilled, in a North/south direction.
The blow out was caused while fraccing another well, which communicated with it. Makes you question the quality of the old well equipment.
So, I think Oasis had dung themselves a bit of a hole, they are trying to find there way out of, in this area.
Tool,
The first has no production reported since Jul-15.
The second has 300 b production reported since Jul-15.
The third one 136 b production reported since Aug-15.
This goes also for a well in the same pool started in Feb-15.
HELLING TRUST FEDERAL 5494 43-22 16T3
(No reported production for Aug and Sep , 112 kb for the first 6 months of reported flow)
So what could this “something else going on” be?
Rune,
See my edit above
Looking around at the ARC IMS Viewer, there seems to be a few areas where these crisscross wells take place. If Oasis is having trouble with vertical communication then maybe several operator may have the same issues.
As Fernando kept talking about, these wells and development plans should have been worked out at an early stage, to avoid any future problems, and to maximize the resource base available.
Tool and FWIIW,
Looking at NDIC data of the wells there is a 50 % improvement in well productivities (first 12 months totals) in Alkali Creek for the 2015 vintage relative to the 2014 vintage.
2013 and 2014 vintage are pretty close.
There is nothing that stands out in the GOR numbers.
It may be worth the time to look closer at well spacing and headings for the pool and nearby pools. (Takes some time…which I now do not have.)
Dennis, some companies show a significant increase in their GOR as from vintage 2015.
Perhaps you would be kind enough to share from your vast petroleum experience possible reasons for this (GOR increase)?
Hi Rune,
I have never claimed to have any experience in the oil and gas industry. I leave that to you.
Bakken, with 1,600+ additional wells producing, is down September 2015 v September 2014. Why in the world would production be flat going forward? A lot more wells to be drilled?
Bakken was up 35% YOY December 2014 v December 2013.
Barrels per day per well going down over time. Why make analysis more difficult than it has to be?
Hi Ken,
The barrels per day per well will go down as more wells are brought online. That is what the Red Queen effect is all about. Over time more wells have to be brought online to keep output flat.
Also note that the number of wells needed to keep output at 1107 kb/d is smaller than the number needed to keep output at 1150 kb/d.
If we add 140 new wells per month output rises to 1150 kb/month by Dec 2017 and to 1168 kb/d by Dec 2019. (140 wells per month added from Oct 2016 to Dec 2019).
Right now the number of wells needed is 125 new wells per month to keep output flat, for the last two months only 93 new wells and 97 new wells were completed (August and September), that is why output from the Bakken /Three Forks decreased in August and September.
Ken,
It is quite simple. Ron has presented above the barrels par day and well. This is the well productivity. The striking thing is that well productivity has sharply declined (down 11% year over year) over the latest few months. It declined for the first time during the summer and accelerated sharply until September (see below chart where barrel per day and well are shown against the yearly change %).
Heinrich,
There is nothing striking going on. The reason that you see a slowdown in yoy growth in oil per well, is that there are fewer new (high-producing) wells coming online, that are lifting the average up.
Several times I have said that following the average production over all wells is meaningless, and even worse, I see it often leading to wrong conclusions.
The metrics to follow are:
– the production profile of individual wells, and changes over time
– the number of new wells coming online
From these, the average production over all wells follows, but you can’t determine what is going on from that metric alone.
Hi Enno and Heinrich,
I now understand that Enno and I use the term “well productivity” differently from Heinrich.
For me well productivity is the output of an average well over its producing life.
Since 2008 this has increased a little during 2013 and 2014 and was stable in 2015, over the period from 2008 to 2012 the average well productivity was remarkably stable (though there was some variation up and down from month to month), FreddyW’s charts show this quite clearly, as does Enno Peters 3 month cumulative chart.
Clearly as a well ages it will decline in output so the average output of all producing wells (in barrels per day per well) will eventually decrease as more producing wells are added to the field. In order to simulate field output we take the well profile of the average well, assume all wells are average and multiply by the number of new wells added each month.
Rune Likvern’s original Red Queen Model (which is what I use for the Bakken and Eagle Ford, with slight modifications in the well profile based on data collected by Enno Peters for the Bakken and data I collected from the RRC) simply takes the well profile and multiplies by the number of wells added each month and adds up all the output (or that is what I do). I go back to 2004 for numbers of wells added each month and I guess at the well profile from 2004 to 2007 (I only have data from 2008 and later). I have also done rough simulations all the way back to 1960 to get a feel for the output from the 200 Bakken wells online in Dec 2004 (though these wells produce very little oil today, so that is not very important).
Enno is absolutely correct that the well profile and the number of wells added each month are the key metrics.
A potential problem, that Mr. Likvern pointed out when the model was initially presented is that we do not know what the future output will be from wells drilled today, we can assume they will follow a hyperbolic well profile based on the wells drilled 12 or 24 months ago, but that assumption may not be correct.
The original Oil Drum post at link below (with related posts at the bottom of the post).
http://www.theoildrum.com/node/9506
The “models” that I present on the Bakken (and the Eagle Ford) are essentially Mr. Likvern’s original idea using data provided by Enno Peters to develop a well profile for wells drilled from 2008 to 2015. A hyperbolic well profile is estimated using the average well data from the NDIC. Any errors in the analysis are mine, I simply apply what I have learned from reading Mr. Likvern’s previous work at The Oil Drum and
his blog (link below.)
http://fractionalflow.com/
On May 11, 2012, I posted an equivalent “Red Queen” model for Bakken on my old TheOilConunDrum blog.
http://theoilconundrum.blogspot.com/2012/05/bakken-growth.html
I wasn’t clever enough to call it the “Red Queen” effect, but have all the math to show how the production would not be able to keep up with declining wells unless new wells would continue to be drilled.
I called it a form of Gold Rush dynamics, which wasn’t that far from the truth, and posted a comment to TOD on September 9, 2012, a couple of weeks before Rune’s post:
http://www.theoildrum.com/node/9474#comment-917306
The Internet is fun cuz it has a memory of both successes and failures.
The higher production numbers for 2015 are primarily a result of the immediate installation of a ESP ( Electric Submersible Pump) at the time of completion. This moves production to the left side of the curve and will result in higher decline rates in subsequent years. It will also lead to lower EUR’s as the frac sand will lose its integrity(porosity & permeability) sooner than previous flow back production methods.
It makes it appear the EUR’s will be greater than previous wells, but the exact opposite will occur in my opinion. The shale producers innovation is the elusion of better frac technology that will turn out to be the same mirage as 30% IRR plus on shale wells.
G’day Carl,
You obviously are connected closely to the business. As I understood things, beam pumps were the preferred weapon of choice, as ESPs had high electrical cost. I had wondered how the beam pumps were going to work on new pad drilling with 3D directional holes.
Any idea what % of completions are being done with ESPs?
Is this just a Bakken development, or are the other shale plays playing the same game?
Thanks for your input.
The ESP’s were not deployed initially due to high capital cost and short run times. The short run times have been improved due to increased efficiency in the down hole separation of gas and improved filtration of frac sand entering the pump stages which caused quick decreases in pump efficiencies. The cost is still high. However the installation of a Variable Speed Drive enables producers to increase or decrease their production rates at surface by speeding up or slowing down the pump. This could enable a company to expedite their recovery of the oil to pay interest expenses or flatten the curve out to look like frac technology has improved dramatically. If the curves flatten it may enable a company to convince a bank or investor that a new type curves exist that will enable company’s to recover EUR of 900k. This recovery of course will not occur except in a few select wells. This might enable the Bakken Ponzi scheme to continue when oil prices recover. The continued drilling and completion of uneconomic wells continues to surprise me but the end of the poor allocation of capital is near. The drilling and completion of new wells just continues to add downward pressure on prices and deteriorates creditors and shareholders the ability to recover any of the previous capital deployed in a high oil price environment. If the economics didn’t work at $100 per barrel and 90% of the production is gone in 3 years, there will be nothing left when oil prices improve except broken promises and dreams. Reality will prove expensive to all who believed and invested in an energy independent Shale USA.
The financially strained company’s are the primary users of ESP’s in the Bakken. I do not have exact numbers but many of the operators are employing ESP’s on every well they drill and complete. It would not surprise me if 30% or more of the new Bakken wells are installing ESP’s.
I do not have direct knowledge of their use in the Eagle Ford but would think the technology is being used. The beam pumps do work in pads and are located close to other Pumping Units. The Beam pumps also have a salvage value and can be used for decades. The ESP’s have little or no salvage value and can not be used easily or cheaply in other wells.
Carl,
Yes, ESPs have the wonderful ability to tune in production numbers you like, until of course natural barriers are hit. But where ever they are installed, there is always the natural tendency to just pump a little more than is prudent, let alone in these times of sheer desperation. Of course you don’t need to adjust the choke to increase flow, just turn up the RPM!
I had always thought they were the better pump for the lease boundary wells, once the pad drilling became the norm due to the ability to pump in angled wells, where as the beam pumps, I have been lead to believe are restricted to less than 10 deg from vertical.
It is amazing that ESPs have had very little mention in the cheer leading oilfield press. I wonder when they will catch up?
If you don’t mind, what is your profession? You sound like a petroleum or reservoir engineer. I think you can work out what my line of work is, but I am offshore international, so I have a bit of learning to catch up on US land.
” It is amazing that ESPs have had very little mention in the cheer leading oilfield press. I wonder when they will catch up?”
ohh no Tool, they will never catch up. We can get explanations from cheerleaders like toilet water is used for fracking like Pioneer does in EF in terms of savings , drill efficiency of number of days required , getting free use of drills from Halliburton in exchange for future production and similar imbecile explanations. But significant use of ESPs? No. That will show there is no efficiency. It only shows that there is illusion of efficiency as Carl pointed out. You can’t show the public the tank is empty. You can’t show that investors have been lied to. Again. You can’t show that there is no significant technological breakthrough. All you will get is lot’s of disinformation, flag waving and etc. But they are going down.
Thanks Carl,
Any idea how much URR might be reduced by this strategy? The typical average Bakken /Three Forks well might have a URR of 330 kb of oil (I am ignoring the Gas). What % reduction in URR might we see from the early installation of ESPs.
Dennis,
Unfortunately there is not enough data yet to estimate its effect on URR. The increased with draw rates so early in the life of the well increases the over burden closing effect on the frac interval. This will cause the frac porosity to close before adequate drainage paths are formed in the shales. I do believe the effect will be measureable in the next year or so. This will cause the economics (Losses) to go from awful to really awful. You would have to get adequate pressure data from the current operators who are now claiming 900 URR type curves that will never be achieved by more than a handful of wells in the Bakken.
Interesting column by financial columnist Scott Burns on “Survivor bias.”
http://www.dallasnews.com/business/columnists/scott-burns/20151113-the-missing-bullet-holes-problem.ece
Carl
Your mention of getting pressure data, and related EUR numbers, may be affected by EOG’s proposed water flooding pilot in the Parshall (Docket application and description can be seen on DMR’s November 29, 2015 docket application. Viewable on the DMR website.
This whole water flooding approach was deemed unviable by many sources that I have encountered over the years, yet Crescent Point Energy’s brief 3rd Quarter conference call described their successful efforts for a few years now in water flooding the View field Bakken and Torquay fields (the latter being the term for the northern Three Forks).
Company claims a flattening decline curve an tripling of EURs.
They are active in North Dakota and are preparing at some point to implement these procedures in Divide county
I am in no way a rock doc, but the ‘halo effect’ has been observed for several years and seems to provide a significant uplift in production from existing, offset wells when a new well is frac’d.
Perhaps EOG’s efforts will provide more clarity.
It would be a miracle if the Parshall field could be water flooded. The reservoir does not have good connectivity and limited primary porosity.
The porosity created with fracs would lead to tremendous channeling of the injected water in the natural fractures and decrease sweep efficiency. The pressure required to injected water would be excessive and the cost to injected and lift the fluids high. Miracles do happen and Parshall is certainly one of only a few Bakken areas that was an economic success. It was blessed with higher over pressurized Baaken intervals that contributed to it’s success in primary production.
The
Indeed, for cumulative production the wells are actually better for the first year. The problem is that they rapidly return to 2010 levels after the first year. I continually have trouble posting images on here (it gives me a “file not found” error), but this is how ultimate recovery is going year by year in North Dakota, compared to 2010:
https://pbs.twimg.com/media/CTDoGFLXIAAcO_P.jpg
Left axis is multiple of 2010 production levels (so e.g. 1.2 = 20% higher). These are based on last month’s figures, I’ll get this month’s ASAP.
http://seekingalpha.com/news/2930386-north-dakota-oil-well-backlog-surpasses-1000-for-the-first-time
“As a result, more than 8% of oil wells in North Dakota now are sitting idle, harming the industry’s ability to grow production; daily output in the state fell 2% in September to ~1.16M bbl/day.”
Ron, Enno, Bruno, Dennis, FreddyW,
Thanks for the graphs and comments.
It it interesting that your charts show very similar average Bakken well performance this year and in 2014.
Meanwhile, we are told by the companies and “experts” that well productivity has considerably improved.
Hi AlexS,
As FreddyW has stated, he, Enno, and Rune Likvern are all using the NDIC data which is available to everyone. Enno Peters also very graciously shares the data he pulls from the NDIC PDFs and puts in a spreadsheet that is much easier to use, so I also have access to the data which was very difficult to pull together in the past (before Enno started doing this).
Not sure why the experts think well productivity gas been increasing, there was a small increase in 2013 and 2014(for the 6 month and 12 month cumulative), but whether this amounts to an increase in URR over the long term is an open question.
Dennis,
I know this, and I tend to trust Enno, Rune and FreddyW, rather than the companies, investmnent bank analysts or experts who may have vested interest in inflating the numbers
Alex,
Thanks, and you’re more than welcome.
What is striking to me is that very often the claim that wells have improved isn’t backed up by any data, while at least for ND, the data is readily available for anybody to verify those claims. I sent out the same data to those who are interested in a somewhat better readable format, and anybody can verify that data with the original sources.
Part of the confusion may also arise from the EIA’s use of “New-well oil production per rig” in its Drilling Productivity report. This metric has continued to rise, but actually combines several underlying concepts. Better IP in the first few months, and increased average rig efficiency does have a positive impact on this metric, while it hides that the underlying actual well performance didn’t change at all, at least in the Bakken.
Year annual production
2010 113,267,706 Barrels
2011 152,957,522. Barrels
2012 293,172,049 Barrels
2013 313,801,706 Barrels
2014 396,845,811 Barrels
More than a 300 percent increase in production in five years. It is all oil!
There will have to be a 2/3 decrease or more in production to fall back to 2010 levels of 312,000 barrels per day.
That decrease would amount to 800,000 barrels per day, something like that.
From 1.2 million down to something like 400,000 bpd would take 25 months.
0.025 times 25 equals 0.625, somewhere between 25 and 30 months for the decline to reach 2010 levels of production.
By that time, the price will rebound.
Looks like 400,000 bpd production from the Bakken will result in a 77 dollar barrel price.
2011 production levels will bring a return of 2011 prices of approximately 90 dollars per barrel.
Based on the statistical data, whether or not they may apply, the price within a two year time span will rise, be greater than it is now.
Of course, nothing is for certain.
Just a perspective.
Way past beer time.
re beer time: saw this on a t-shirt yesterday:
WTF? (Wine time finally)
🙂
The latest post (November 13, 2015) from http://bentekenergy.com/ indicates the lowest natgas production since March 2015:
……….The second week of November still did not bring forth the highly anticipated incremental production from the Northeast as the new expansion projects are yet to ramp up their production levels. Hindered partially by maintenance events, US dry gas production briefly sank this week below 71 Bcf/d, marking the lowest volume since March of this year. …
It will be interesting over the next weeks if production really starts to take off, despite a threefold decrease of drilling over the summer. It is quite ironic that for years Northeast production could not be transported out due to pipeline constraints. Just in the moment pipelines are ready, they cannot be filled as production drops.
I tried to determine the quality of the Fraclog in ND.
There are at the moment 592 wells with status NC, or TATD, both of which seem to indicate a long-term delay to completion. For each of those wells, I determined the closest (in distance) producing well (producing since 2010, and at least 6 month production history), and I determined the 6 month cumulative production for those wells. I hereby assume that the quality of the nearest producing well is a good proxy for the quality of the non-producing well itself.
The result is as follows:
The average fraclog well has a nearby well that on averages produces 63.6 kbo in the first 6 months, while the average well since 2010 has produced 52kbo per well. This result seems to indicate to me that the quality of the average fraclog well may be about 20% higher than the typical well. EOGs wells do have a large impact on this high average (without EOG the average drops to 61.2 kbo).
This result is surprising to me, as I expected that the typical fraclog well would be of lower quality. Of course not all wells are the same, and there does seem to be a fraction of wells that seem uneconomical to complete now.
Hi Enno,
Nice analysis, thanks.
I noticed in the Daily activity reports in Sept and October that EOG has temporarily abandoned a number of wells (I didn’t count them though), perhaps they are waiting for higher oil prices.
Enno,
The following excerpt from the Director’s Cut may explain the difference between yours and theirs numbers of the DUCs:
“Disclaimer: The number of wells waiting on completions is an estimate on the part of the director based on idle well count and a typical five year average. ”
Apparently Lynn Helms includes wells that were completed and producing, but are currently idle.
Maybe one of the reasons the water to oil ratio has been changing in the Bakken oil play is because industry is reverting back to slickwater fracking which relies on high volumes of water and minimal chemical additives (and less expensive?). Slickwater fracks were used before gels and higher viscosity fluids became the norm for unconventional fracking designs, but it’s said that the simple design of a slickwater frack has proven to produce a more complex fracture network in middle Bakken formation rock. Of course I’m just guessing here having never has any LTO experience.
NEW DATA REVEALS WHICH U.S. FRACKING WELLS NEEDED THE MOST WATER TO DRILL
Yes, this has been around for awhile but it contains some easily grasped information that may be of interest to a few readers here.
http://fuelfix.com/blog/2015/06/30/new-data-reveals-which-u-s-fracking-wells-needed-the-most-water-to-drill/#34022101=0
10,000 Bakken wells, 7 billion barrels recoverable, 2.60 billion harvested, 4.4 billion yet to reach the surface, the time frame can be roughly calculated.
4 400 000 000/10 000 average well count, 440 000 barrels for each well, as wells are shut and added, it might be a fairly good guess.
That will take eleven years of so, have to keep drilling. There are some 20,000 plus wells drilled since the beginning of oil in the Williston Basin, 7,000 abandoned and plugged. Another 15,000 yet to be drilled over an eleven year drilling period, another ten thousand to give out, 18,000 wells needed to produce what 13,000 now do. Hamsters are running full speed.
Eleven more years of production at 396 000 000 barrels of annual production, then maybe it will be the end of the Bakken oil play. At 50 USD per barrel average price projections for those eleven years, that’s 217 800 000 000 dollars in those eleven years.
18,000 more wells at nine million each is only 162,000,000,000 dollars over eleven years.
There is an extra 55,800,000,000 dollars left over for somebody.
Lotsta money. Go for it!
As for the collateral of biosphere collapse, small change in comparison.
Hi Ronald,
The will need at least another 20,000 wells to get a 7 Gb URR from the Bakken/Three Forks, so far about 1.5 Gb have been produced and if no more wells are added and the average well profile estimates are correct, there will be 3.3 Gb of total output from the 10,500 wells that have been drilled. If we assume no decrease in new well EUR in the future (unlikely), currently the new well EUR is about 330 kb so for 3.7 Gb (7-3.3) we would need about 11,200 new wells drilled. I think 20,000 new wells will be needed because the new well EUR will decrease as the sweet spots get drilled up, though maybe 15,000 wells will do it, we don’t know when the EUR decrease will begin or what the rate of decrease will be.
Re: Terrorist Attacks in Paris
Lots of cross currents.
Reportedly, the terrorists were a mix of home grown terrorists and ISIS terrorists who entered the EU disguised as Syrian refugees.
I wonder if the ISIS threat will basically result in a coalition that will largely consists of the Second World War allies, i.e. at that time of the Second World War Great Britain and Commonwealth partners, the Soviet Union, the US and and Free French forces. Of the course, the operative phrase here is the enemy of my enemy is my friend.
In any case, I suspect that the US, Russia, Great Britain and France will be coalescing around the the idea that the ISIS threat has to be crushed.
Meanwhile, Merkel, in Germany, continues to issue happy talk statements about welcoming migrants. I’m reminded of a (IMO, self-righteous) recent comment on POB by an Austrian citizen, who noted that they were welcoming the Middle East and African (and largely Muslim) migrants with open arms. In response, I noted that the Austrians also welcomed Hitler with open arms. And it took millions of Allied casualties (primarily suffered by the Soviets) to eliminate the Nazi threat. So, I am less than impressed by sanctimonious comments from Austrians.
I wonder what Austrians are thinking now about welcoming Muslim migrants with opens arms?
In any case, it seems to me that it is when, not if, that Europe has to reevaluate the migrant crisis as less of a refugee crisis and more like an invasion. I’m also reminded of one definition of a conservative, i.e., a liberal who was mugged the night before.
Also, it seems to me that this will only serve to benefit the Donald Trump campaign in the US. Like almost everyone else, I thought that Trump would have faded by now, but given recent events, he’s probably the most likely GOP nominee at this point.
Of course, a key question is to what extent that Bush 43’s invasion of Iraq triggered this whole mess.
As a “What if,” it’s interesting how one man can change world events, e.g., Gavrilo Princip, who assassinated Archduke Ferdinand, triggering the First World War, and indirectly the Second World War. If it weren’t for Ralph Nader, in my opinion it’s a virtual certainty that Gore would have won Florida in 2000*, and thus the presidency. And I can’t imagine that Al Gore would have launched an invasion of Iraq.
*About 100,000 people in Florida voted for Nader and Bush won Florida by about 500 votes
Terrorist is the new Communist.
http://themindrenewed.com/topics/false-flag-events/617-int-70
*About 100,000 people in Florida voted for Nader and Bush won Florida by about 500 votes
Oh yeah, I can still vividly remember standing in the voting line in front of my Courthouse in Hollywood Florida… Little did we know then, that so many of those pregnant chads, would end up as miscarriages up in West Palm Beach during the recounts. Fun times, those were! Time sure does fly though, back then I wasn’t even aware of Peak Oil and Al wasn’t yet famous for his inconvenient truths. My, my, my!
Here in the UK people are getting nervous. There has been a lot of anti-Muslim chatter on the web, but relatively little open hostility on the streets.
A lot of people in the UK are extremely cautious of getting more involved in the fight against ISIS. We were comprehensively lied to about the invasion of Iraq and a lot of people see ISIS and a lot of Islamic terrorism as a direct result of “the war on terror”. More informed comment points out that the fanatics of ISIS are being trained and funded to a very large extent by OPEC, and in particular, Saudi Arabian money, but in the UK it is a brave publication that openly condemns Saudi Arabia or other economically powerful nations with extreme human rights abuses. The UK is now owned largely by foreign money, and our politicians with few noble exceptions even bother to hide the fact now.
The root causes of ISIS go back at least 50 years, and finger pointing won’t get us far. Nor will bombing them from a great height. The more we target ISIS fighters in Syria, the more they will resort to asymmetric warfare, AKA terrorism, to retaliate. With so many fanatical and suicidal and brainwashed converts, only one in a hundred needs to slip through the net to cause another mass murder on our streets. ISIS is a product of Wahabiism and it’s message is rejected by at least 90% of Muslims worldwide as a downright evil and perverted offshoot of their beliefs, be they Sunni, Shia, or some other variant. ISIS will only be stopped in the long run by cutting off their source of money, and by shutting down the religious schools where it is taught. On the ground, only a large, Muslim army who can take and hold ground with the blessing of the remaining locals who have not already fled for their lives will be able to retake Syria. ISIS is gaining strength because a lot of disaffected Muslim youth see that they are winning, and want a piece of the action. Nothing stops new recruits faster than defeat on the groud. Even that will not stop the terrorism.
I am atheist, but morality is neither the reserve of any religion, nor absent from it.
http://www.theguardian.com/commentisfree/2015/nov/15/terrorists-isis
I don’t have a clear picture of who is on whose side in Sand Country these days. There are so many factions and parties and countries involved, for so many reasons, gaining a good understanding would require a substantial investment of time and money.
But one thing I am fairly sure of is that the current conflicts have the potential to escalate sharply, perhaps even to the point of a major war involving heavy involvement of conventional troops from NATO countries as well as Russia.
If peace breaks out, which seems much less likely than prolonged fighting, one likely result would be that even more oil would find its way to market.
A truly hot war could result in the price of oil shooting right back up to a hundred bucks or more.
I don’t know any more about the security of oil tankers than the next person who has read a little about asymmetric warfare and terrorism, but it is obvious that virtually all of them are sailing solo on the high seas, and that even in restricted waters near ports, warships are not all that common.
Some old soldiers of my acquaintance tell me sinking a tanker would be a piece of cake if the bad guys have access to almost any sort of modern rockets and an aircraft capable of delivering them. There are not enough men and enough fire fighting equipment to deal with multiple fires on a tanker, as opposed to a warship, and tankers aren’t armored. A rocket intended to take out a tank, or an artillery round intended to take out a tank, would go thru the sides of a tanker like the proverbial baseball thru a window pane.
Now as to whether an anti tank gun could be slipped onto a large fishing boat, or even a rich man’s pleasure boat, I don’t see that as being a very big problem, other than getting caught in possession of it.
Some smugglers managed to load upwards of a thousand refugees on a cruise ship a few days back.
Putting a crated gun in a crate no bigger than a pickup truck on a good sized vessel wouldn’t be that big a deal, smugglers haul cars, appliances, lumber etc on a regular basis.
Things could get very interesting very quickly, if some of the bad guys decide to start attacking ships. The question would appear to be more whether they would want to than whether they could pull off a successful attack.
And not to forget the grid and pipelines right here in my back yard. Nothing more than an AK can get it done.
And, oh yea, those pools of whatchacallit around the reactors. A mortar round thinks nothing of a tin roof.
Fun, fun.
But, hey, forgot those F 35’s, they can stop anything. We are safe.
US and coalition forces are deliberately targeting ISIS controlled oil production facilities in Syria, so I wouldn’t be surprised if ISIS retaliates.
Exactly,
That’s what I defended in this post about ISIS finances
http://peakoilbarrel.com/opec-crude-production-down-in-october/comment-page-1/#comment-546455
ISIS Achilles’ heel is its need to sell upwards of a million dollars in oil daily outside its borders. European cities were a secondary target before the coalition started attacking its oil infrastructure. You know when you are damaging your enemy by his reaction.
ISIS advances had been stopped and it is losing ground in certain parts of Syria and Kurdistan where ground troops are capable of fighting them. We can expect they will try more attacks like the one in Paris.
And in addition to more attacks by terrorist sleeper cells, I wouldn’t be surprised to see ISIS directed and inspired attacks on critical oil infrastructure worldwide.
Now, don’t get too sentimental over Al gore. He is probably thankful he lost the presidential election anyway since in the meantime he has singlehandedly ridden that big bad golden “global warming” horse to a personal wealth estimated to now reach a billion dollars. Plus he got that other windfall in selling his TV network to Al Jazeera.
Of course, my point was that just as Princip’s assassination of Archduke Ferdinand directly triggered the First World War and indirectly led to the Second World war, Nader’s political assassination of Al Gore in the year 2000 allowed a person, Bush 43, to be elected president–when a majority of voters in Florida and nationwide voted against Bush.
And 9/11 gave Bush/Cheney/Rumsfeld and the Neocon crowd the excuse for invading Iraq–which arguably may have led to what may be decades of unrest, instability, terrorism and war, plus hundreds of thousands to perhaps millions of casualties.
Morning Joe this morning on MSNBC played an amazing clip from the 2015 season premiere of the “Homeland” series. Following is a link to the video clip (which appears to be some kind of right wing website, but it’s the only place I could find the video clip).
“What strategy?”
http://savingtherepublic.com/blog/2015/10/showtimes-homeland-takes-direct-shot-at-obama-admins-failed-strategy-to-fight-isis/
Excerpt from my comment:
After Paris Attacks, the West Needs to Join with Russia, Iran and Syria to Fight This Evil
Jacques Attali
Former top aide to French President Francois Mitterrand; Founding president of the European Bank for Reconstruction and Development; President of PlaNet Finance
http://www.huffingtonpost.com/jacques-attali/paris-attacks-russia-iran-syria_b_8569374.html
How it All Went Down Before the Massacre
Leader: “My brothers! Tonight we dine in hell and make the self-hating French infidels pay for their insolence!”
Goat Fuckers in Unison: “Allahu Akbar! Allahu Akbar!!”
(Supplies Call)
Leader: “Masks for hiding your questionable identities?”
Nike Fanatics: “Check!”
Leader: “Assault weapons for taking them out before they start shooting ba-… Oh wait, never mind.”
Toyota Loyalists: “Check!!!!”
Leader: “Grenades for blowing them to smithereens?”
Jihadi John’s Ghost: “Check!”
Leader: “C-4 vests for the one-way ticket to Allah?”
John McCain: “Check!”
Leader: “My brothers, we are ready! Now go forth in the name of-“
(Random turrist’ interrupts)
Random Jihadi: “But my dear leader Leader! Have we not forgotten the holy Passport booklets that quell fire and shrug off bullets?”
Leader: “My dear Goat Lover, if you had not reminded us to bring these critical items along, the Jihad might have not succeeded. You will surely have 72 nubile virgins waiting for you in the afterlife now”.
Goat Fuckers in Unison: “ALLAHU AKBAR! ALLAHU AKBAR!!!!”
You are just making stuff up, Joe.
For gawd sakes, get ahold of yourself.
“The tragedy should never become an excuse for Fortress Europe to close its borders and impose even more ruthless restrictions against refugees fleeing the Mideast conflicts. Lest they forget, thousands of those who are murdering innocent women and children in Iraq and Syria are EU nationals. Those who carried out Friday’s attacks in Paris are also EU nationals.”
http://english.farsnews.com/newstext.aspx?nn=13940824000007
Those who carried out Friday’s attacks in Paris are also EU nationals.”
They were Islamic terrorists. That’t all we need to know. Where their nationality rests is not part of the equation.
http://edition.cnn.com/2015/11/15/europe/paris-attacks-passports/index.html
http://www.zerohedge.com/sites/default/files/images/user5/imageroot/2015/11/IMG_5125.JPG
…there might be another “unthinkable possibility” for what happened Friday in the city of lights…..:
…the “force(s)” and “reason(s)” behind it may be very different from what is presented on:
AbcNbcFoxBbcHuffingtonWsjWaPoNyT……(feel free to expand with a name here…)
Just a thought…just a thought….
Be well,
Petro
P.S.: pardon the off-topic comment, Ron.
Let’s see what has happened over the last 150 or so years and how it is affecting places like Syria. Global overpopulation, ecological overshoot, peak natural resources, Export Land Model, climate change, drought, famines, lack of jobs and hope for large populations of angry young men, brainwashing and manipulation by religious fanatics, etc… It isn’t very surprising that conditions such as these are extremely fertile breeding grounds for radical terrorist organizations, is it? However I think it is extremely important to separate Islamic fanaticism from the refugee crisis in Europe, they are not one and the same. Even if a few terrorists did manage to sneak into Europe with the recent wave of refugees.
Perhaps puting a face on who those refugees really are why they are fleeing their homelands and what they have to subject themselves and their families to might be in order. Those of us living our non negotiable lifestyles in comfort in the west should take a long hard look in the mirror and understand that how we choose to live and what we do has major impacts on the lives of human beings all over the world. So before you continue to spew your stupid hate filled ignorant fascist diatribe at least watch these two videos about the realities on the ground for some of the human beings involved. And think deeply about how you might react in their situation.
Anders Fjellberg:
Two nameless bodies washed up on the beach. Here are their stories
https://goo.gl/LC3DaL
Melissa Fleming:
A boat carrying 500 refugees sunk at sea. The story of two survivors
https://goo.gl/m9hT6i
Houston, we have a global probelm!
To paraphrase Stalin somewhat, one unfortunate drowning of a refugee is a tragedy–while millions of migrants is more like an invasion.
In any case, I wouldn’t be surprised to see more Europeans taking a second look at Australia’s policy of mandatory detention, which the US and European countries have previously harshly criticized. As noted above, one definition of a conservative is a liberal who was mugged the night before.
http://www.bbc.com/news/world-australia-34773260
November 10, 2015
To paraphrase Stalin somewhat, one unfortunate drowning of a refugee is a tragedy–while millions of migrants is more like an invasion.
Jeff, just curious, what would you call the deliberate ramming and sinking of a ship at sea carrying 5oo hapless refugees many of whom happened to be women and small children, and consequently 492 of them end up drowning? Is the deliberate murder of 492 members of an ethnic group sufficient to fall under the category of genocide? That was one ship we know about for sure, how many more do we not even know about because there were no surviving witnesses?!
What do you supposed will happen in the ME when the full consequences of the ELM hits? My guess is there will be a lot more refugees, and then what? On the six O’clock Friday evening news in London, Paris, Rome and Berlin. Seas in the Mediterranean were quite rough this week, no refugee ships had to be deliberately sunk,TGIF! …
I’ve thought for a while that we were in the early stages of the Age of Migration, i.e., attempted migration away from war, civil war, civil unrest poverty and hunger.
But as I noted, individual tragedies look far different when one considers the fact that millions of people have migrated or want to migrate. You might ask your neighbors in Florida what they think about allowing unlimited numbers of migrants/refugees from the Middle East and Africa to resettle in Florida.
The migrant/refugee crisis may be the premiere example of a problem versus a predicament (problems have solutions, one must try to cope with a predicament). My prediction is that more and more countries will begin to implement some form of the mandatory detention that Australia uses (two choices: a detention camp, or you can go home).
Edit: Chuck Todd, on MSNBC, just noted that if there is increasing resistance to accepting refugees/migrants in Western countries, various countries will have to start looking at some “Safe zone” in the region to hold the people. (So far, apparently the governors of four states in the US have said that they will refuse to accept any Syrian refugees.) And a Yahoo headline:
France’s Le Pen urges ‘immediate halt’ to migrant intake
http://news.yahoo.com/french-far-leader-le-pen-urges-halt-migrant-135132370.html
You might ask your neighbors in Florida what they think about allowing unlimited numbers of migrants/refugees from the Middle East and Africa to resettle in Florida.
Yes, I know what they would answer to a question framed in that manner, it would be an unequivocal, “Hell No!”. Yet if you think about it In South Florida we are already inundated with both legal and illegal immigrants from Central and South America. Some of the hardest working people I know personally are illegal Mexicans working in South Florida. My neighbors if asked the same question about them would also say “Build a wall!”. But guess who trims their bushes in the garden, halls their trash or who cleans up after senile grandma, or does any number of chores for very little money?
To be honest I highly doubt Syrian immigrants would be much better or worse than the Mexicans.
BTW down here in Sao Paulo I’m working with a number of business people of Syrian and Lebanese origins who emigrated to Brazil a long time ago and they are perfectly integrated into Brazilian society. They are native Brazilians and think of themselves as such.
Having said all that the current global refugee crisis is a slightly different beast. As you said this isn’t a problem with solutions…
Charles ‘The Hammer’ Martel sent the Saracens packing at the Battle of Tours in 732 CE, so it is an ongoing repeat of history. A decisive battle that determined to be the factor that kept Europe Christian.
Humans have trouble seeing eye-to-eye.
Hells Bells, disgruntled Americans do mass killings at times. Deranged workers go on a killing spree at work places.
Crazy people in the US go into grade schools and kill students one after another.
They are humans first, brainwashing them, brainwashing themselves, to believe they are justified in killing others is the problem.
To an Islamic terrorist, it is ethical, moral, legal, and justified. Though it is not, it is what they believe.
Time to give Charles Martel a call.
Problem is, hammer does no good against a swarm of skeeters. Need something else. Maybe a whole bunch of sterile skeeters? Or a modified gene that turns blood-thirsty skeeter to vegetarian?
Or, somebody else they like better?
And we like worse?
Now, who might that be?
Wimbi, Fred, and Ronald are all on the money today.
Fred overlooked one really important point, which does not change the accuracy of his analysis, but needs to be included. Communications, travel, and weapons technology have advanced to levels unimaginable a couple of centuries ago.
Now every kid in the world, whether he resides in the most remote village in a desert, or in the heart of a major city, knows at least the bare outlines of the story, if he lives in one of the countries involved. He can hitch a ride, or buy a bus ticket,or a plane ticket, and get there in a week or two rather than a year on the hoof.He can easily obtain a weapon good enough to kill real soldiers a dozen at a time, if he catches them unaware.
Ronald says,
“To an Islamic terrorist, it is ethical, moral, legal, and justified. Though it is not, it is what they believe.”
If I were a young man brought up in the same culture, having imbibed of the same every day of my young life, and knowing nothing else, I am dead certain I would believe the same.
And given that life IS darwinian, absolutely, at the ultimate level, and that there is no objective standard for right and wrong, their case is airtight, when it comes to ethics, morality,legality, and justification.Winners write the history books.
Anybody who goes around laughing at Sky Daddy ought to get it if he is capable of actually THINKING about what I just said.The fact that many different priesthoods have invented many different Sky Daddies and Sky Mommies too for that matter does not change the validity of the argument, it actually PROVES it. People invent or evolve variable social arrangements as circumstances dictate, with chance playing a huge role. Every elite group tries to present its own set of rules as absolutes. Even the worst of the pc crowd believes in absolutes. They absolutely will not tolerate somebody like me coming into their midst and goring their sacred oxen.
I have little use for the word sheeple but when you get right down to the nitty gritty, most people, world wide, are being lead around by intellectual nose rings that they mistake for freely chosen personal values.
As one of the family in The Brothers Karamazov put it, after years of painstaking thought, paraphrased:
If there is no God, anything goes. What goes is merely a matter of who is powerful enough to control events.
As Humpty Dumpty finished up the argument, the real question is not about rules and morality etc, again paraphrased but rather:
Who shall be master?
Wimbi is right, a sledge hammer is no good for fighting skeeters. An entirely different approach might work better, if one can be devised.
I am not ashamed to admit I have no idea what might work, short term, other than killing enough skeeters to cripple movements such as ISIS. It’s a nasty business, but between the major western countries and Russia, I have little doubt we can and WILL kill enough to maintain the status quo for the easily foreseeable future.But a hundred innocents will die for every trouble maker. AND for every innocent that dies, another peaceful individual, or two such individuals, may decide to take up arms.
Long term is another ball game.
There is not much in Sand Country worth the trouble of our being entangled in the affairs of the people who live there, except oil.
As I see things, our leaders in the past have been more or less TRAPPED by the realities of politics into going there and fighting to make sure the oil has continued to flow our way. It’s easy to say otherwise, no doubt, but no politician in this country would ever willingly risk the ire of the public being focused on him or her and the party in the event of an oil crisis. War has been the politically safer alternative.
But we sure as hell ought to be doing everything we possibly can to get away from our dependence on not only oil but also all depleting one time thru resources, whether domestic or imported.
Peace and good will are admirable goals, but we are evolved creatures, and the whole entire course of evolution has been based on competition for resources. When a species becomes dominant enough that it ceases to compete with other species for ecological living space, it begins competing one band against another.
There may not BE any way we can permanently solve this problem. War may be with us for as long as we survive as a species.
I have circled back around and find myself contemplating overshoot.
Fred overlooked one really important point, which does not change the accuracy of his analysis, but needs to be included. Communications, travel, and weapons technology have advanced to levels unimaginable a couple of centuries ago.
True enough!
There is Hot War and terrorism.
There is cold war
and then there is Cyber War.
The group know as Anonymous has released an official declaration of cyber war against ISIS. If nothing else Anonymous certainly knows how to gather data and they know how, when, where and to whom to release it to in order to inflict maximum damage.
http://news.yahoo.com/anonymous-threatens-isis-with-major-cyber-095356441.html
In an online statement, Anonymous said:
“The purpose of this Op is to identify and report supporters of the atrocious November 13th 2015 Paris attacks in an effort to assist finding those responsible, demonstrating that we do not tolerate such atrocities and gather information that could help prevent further attacks in the future”.
This is not the first time that the group has targeted ISIS. Confirming this in a tweet, Anonymous said:
“Just to be clear: #Anonymous hasn’t just declared war on #IslamicState, we’ve been at war for quite some time already”.
“We are upping our game, you will now be hit by major cyber attacks,” the hackers told ISIS in the new warning.
I’m betting on Anonymous’ skills, as they said, they have much better hackers. They certainly have the technological edge over the Islamic luddites.
Ron.
Thank you for the update!
And thanks to Enno and Bruno, as well: good stuff!
Be well,
Petro
Hi Ron
the Texas data are out: do I wait a bit, or do I start doing the computations to get the corrected data for September 2015?
Thanks, Dean
I will have a post out later today, likely six or seven hours from now. So just post it out to me when you have it.
I had not expected this. But we will see how it goes.
Thanks Dean,
Below I show how the percentage of condensate to C+C output in Texas has changed from Jan 2004 to Sept 2015. The % rose from 11% in 2005 to about 16% in 2011 and has since fallen to 12.6% in the most recent month. So currently it is about 14% higher (12.6/11 minus 1) than 2005.
BREAKING: Pennsylvania #naturalgas data out:
Aug 12.63 bcf/d(+0.17),
Sep 11.24 .
All others unchanged #Marcellus #Utica
key point will be the revision of Sep15 data next month. On average 0.2 bcfd, but up to 1.5 bcfd possible
Wow! Are there any known big shut-downs?
Thanks, Dean,
Am I right that these are preliminary numbers, likely to be revised up?
yes, but only the last month will be revised (average revision: +0.2 bcfd; max revision: +1.6 bcfd). All other months remain unchanged. For example, in December 2015, the data for September 2015 will be revised, while all previous months are fixed.
Well folks, good news to go with your coffee this morning.
OIL PRODUCERS HUNGRY FOR DEALS DROOL OVER PERMIAN BASIN
“Somebody described it to me once as a tiramisu, it’s just lots of layers of beauty over there,” Gilmer said. “Everyone recognizes that the Permian basin is by far the richest land on earth. The only thing holding it back from more and more is the engineering, and I think this is an industry that’s really proven that the engineering gets better every year.”
http://www.worldoil.com/news/2015/11/16/oil-producers-hungry-for-deals-drool-over-permian-basin
Meanwhile things are humming right along in Alaska.
RESOURCE HEAVYWEIGHTS GATHER AT MOMENTOUS TIME FOR ALASKA
“It’s November, and time for the big Resource Development Council annual conference. This year, more than any other, huge issues loom for Alaskans including the proposed $50-billion plus North Slope gas pipeline and liquefied gas project and the state’s fiscal troubles….. with $3 billion-plus annual deficits.
http://www.alaskajournal.com/2015-11-11/resource-heavyweights-gather-momentous-time-alaska
It’s little bit strange that they did not like that Tiramisu at $100 but somehow it looks yummy at $40 🙂
Probably, assets in the Permian are now 2 times cheaper than when oil was at $100.
And they hope that oil and oil producing asset prices will eventually rise
When someone buys asset (let’s say real estate) that asset has to pass price/income analysis at the moment of the purchase. Not at some future and unknown date. If the asset is bought based on hope that oil producing asset will rise (like what we are witnessing everyday with real estate just for capital gains) than that is form of ponzi scheme and it only works until you run out of greater fools.
Ves,
Oil companies have short- and medium-term internal oil price projections.
On this base, they estimate the value of the assets and potential returns from future projects.
Let’s look at actually what really happened. If Shell ‘ internal short and medium term projection on price was any good than they would not wasted billions on Arctic in the last 10 years. Market is very unpredictable and no amount of projection will help you determine future.
I agree that companies’ oil price assumptions may be wrong, but they still cannot evaluate their projects and financial plans without oil price assumptions.
Besides, medium-term projections are based on “normalized” mid-cycle prices.
I am sure that, when oil prices were around $100 most companies were using “normalized” mid-cycle price assumptions not exceeding $80.
And now, when Brent is close to $45, they use something around $60-65, or even $70 for longer-term projects.
This does not apply to small companies which have much shorter investment cycles.
Change of subject but relevant.
About TESLA electric motors and drive trains:
” I mean, internally, our goal — we changed the goal of the drive unit endurance from being approximately 200,000 miles to being a million miles. Just basically, we want drive units that just never wear out. That’s our goal. And I think we’ve made really good progress in that direction.”
I wish to make two points. One is that given Tesla has gone to the extent of building a basically corrosion proof car, meaning the REST of the car can potentially last more or less forever with some routine maintenance and minor repairs, barring accidents, it was an idiotic decision to design the drive train with a life expectancy of only two hundred thousand miles.
The drive train of an ordinary conventional car is generally good for a couple of hundred thousand miles these days, if you select a model noted for reliability.
Second, although I am not an engineer, I know enough to know that a well designed single speed gearbox and electric motor OUGHT to last indefinitely. There are hundreds of millions of electric motors and gear reduction assemblies around that have served without failure in constant service for decades. Doing away with up and down in favor of strictly round and round, with combustion fires and cooling waters thrown out along with such things as piston rings and valves means there is nothing left to WEAR OUT except a few bearings and the teeth on a few gears. There are plenty of trucks on the road with the original gears and bearings in the differential assembly still good at a million miles, with most of those miles coming PREVIOUS to the wide spread adoption to superior synthetic gear oils.
Nobody is going to want an older TESLA if they are going to have to pay TESLA rates for fixing any problems, and it does not seem likely that aftermarket parts or service manuals are going to be readily available, given the low sales volume.
This might change later, but for now anybody who buys one is going to be looking at some ball busting repair bills if he has a problem out of warranty.
Hi Old Farmer Mac,
The Tesla warranty is 8 years with infinite miles, so after 8 years you are out of luck, most people that buy $80,000 cars don’t drive them for more than 8 years, for the rest of us that buy used cars, we will have to take our chances. As you said and electric motor is unlikely to break down.
http://www.teslamotors.com/blog/infinite-mile-warranty
Oldfarmermac.
I hope you did read my answer to you even if you did not agree with it.
http://peakoilbarrel.com/opec-crude-production-down-in-october/comment-page-1/#comment-546440
Best wishes,
This is based on a first run at the data, so may need revising, but it seems like the confidential wells this month have produced much more than usual. Last month, 140 confidential wells produced around 66,000 b/d. This month, 123 wells produced 77,000 b/d. I have never seen confidential wells produce more than 70kbpd.
I expected 1.153 million bpd this month, and final figure was 1.162 million bpd. The entirety of the difference in my estimate is made up by higher confidential production.
Maybe Dennis and Enno can double check this figure? And any comments as to why confidentials might be so productive welcome, of course.
The confidential well list is at the NDIC website. I stopped at 500.
I know they have a list, but many of those are not producing, and anything above 90k is a disposal well. I am working from the Monthly Production Report, and flagging producing confidential wells.
Update on this:
The number of runs for confidential wells has stayed broadly stable month over month. What has changed is the multiple applied to the runs to get barrels of oil produced.
Confidential production = total production from monthly report – total of the “oil produced” column from monthly report
Multiple of production = confidential production / total of confidential runs from monthly report.
Usually the production multiple is between 1 and 1.01. In September it was 1.2 (!). Going back through the historical reports, the only other outlier is April 2015 at 1.1. Anyone else think it might be connected to credit line redetermination – crank out more for the bank?
We’re in ecological overshoot. ISIS is a result of ecological overshoot. The coming wars and collapse will be a consequence of ecological overshoot. 7.3 Bn Homo sapiens on a planet that can only sustain 1.5 Bn to 2 Bn. It’s going to be a long and painful descent to balance.