A post by Ovi at peakoilbarrel.
Below are a number of oil (C + C ) production charts for Non-OPEC countries created from data provided by the EIAʼs International Energy Statistics and updated to August 2020. Information from other sources such as OPEC, the STEO and country specific sites such as Russia and Norway is used to provide a short term outlook for future output and direction for a few countries. Typically I collect updated country info after the 20th of the month for September and October. Since this is an early post, those have not changed from last month.
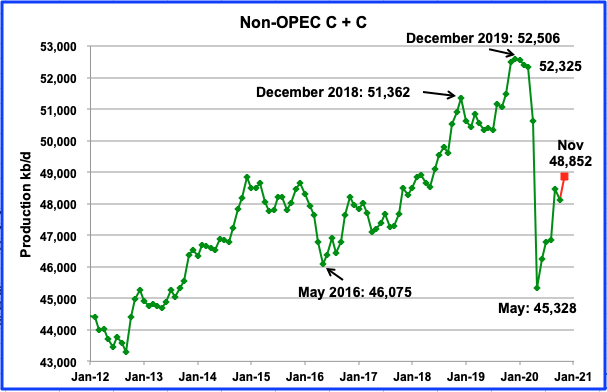
Non-OPEC production reached its current lowest production rate of 45,328 kb/d in May. According to the EIA, August output added 48 kb/d to 46,845 kb/d to July’s output of 46,797 kb/d.
Using data from the December STEO, a projection for Non OPEC output was made to November. November output is expected to rise to 48,852 kb/d, with the biggest increment occurring in September, 1,663 kb/d.
Ranking Production from NON-OPEC Countries
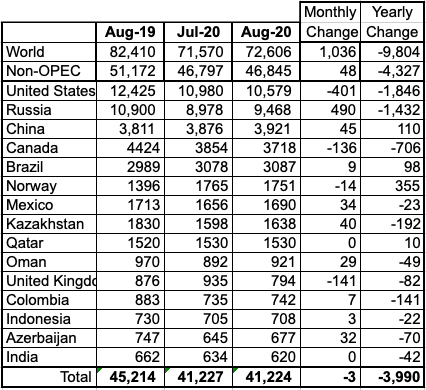
Above are listed the worldʼs 15th largest Non-OPEC producers. They produced 88% of the Non-OPEC output in August. On a YoY basis, Non-OPEC production decreased by 4,327 kb/d while on a MoM basis, production was up by 48 kb/d to46,845.
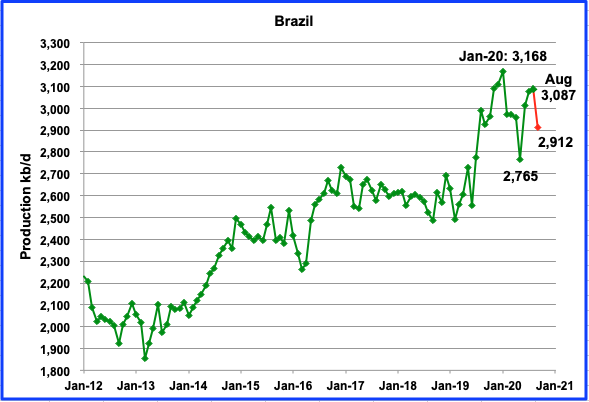
The EIA reported Brazilʼs August production was 3,087 kb/d an increase of 9 kb/d over July. According to this source, September dropped by 180 kb/d to 2,912 kb/d. (Red dots), possibly due to maintenance.
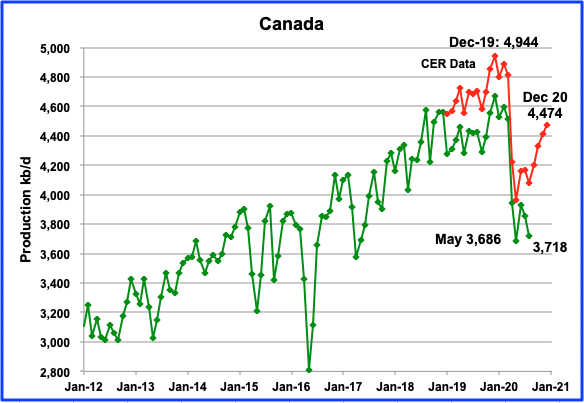
The EIA shows Canadian production was down in August by 136 kb/d to 3,854 kb/d. The Canada Energy Regulator (CER) data indicates a small production drop from August. The CER data is higher because it includes NGPLs in their estimates and is close to 6% of total output.
Exports by rail to the US in September were 94.4 kb/d, up from 51 kb/d in August and a low of 38.9 kb/d in July.
The cap on production in Alberta, currently at 3,810 kb/d, will no longer be in effect in December. The Enbridge Line 3 that has been stalled for the past 10 years received final approval for construction to start in Minnesota on November 30, 2020. Other segments on other states have been completed.
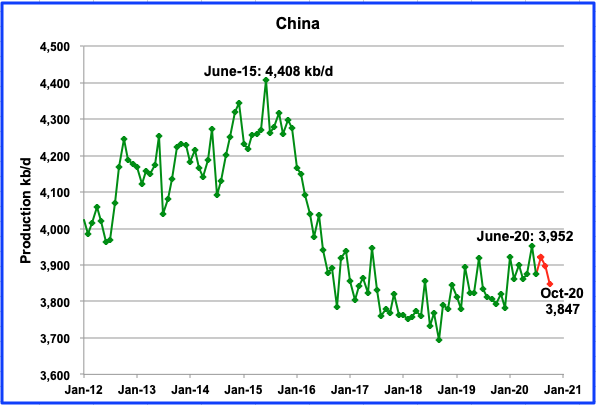
The EIA reports that Chinaʼs August output increased by 45 kb/d to 3,941kb/d from July. This source reported crude output for September and October 2020 relative to last year (red markers) has dropped.
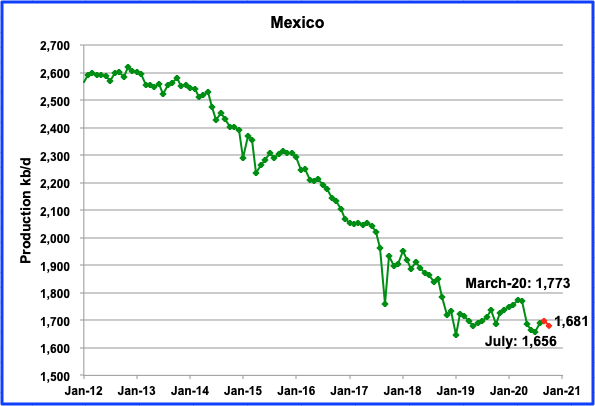
Mexicoʼs production increased in August by 34 kb/d to 1,690 kb/d, according to the EIA. Data from Pemex shows that production increased to 1,698 kb/d in September and down to 1681 kb/d in October (red markers).
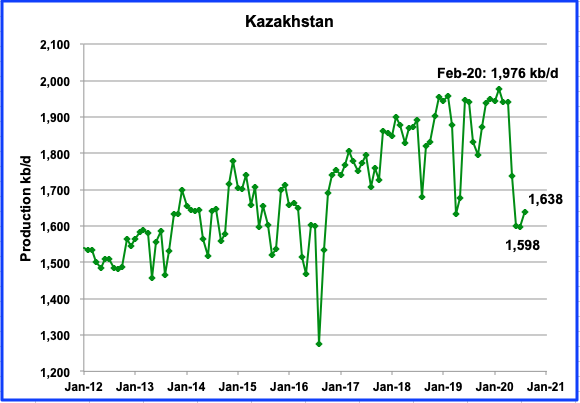
Kazakhstan’s August output increased by 40 kb/d to 1,638 kb/d. The big drops in June and July are associated with their commitment to reduce output to the OPEC + pact.
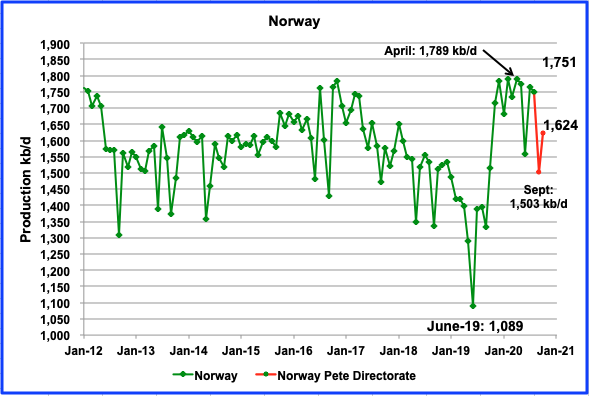
The EIA reported that Norwayʼs August production was 1,751 kb/d, a drop of 14 kb/d from July.
According to the Norwegian Petroleum Directorate (NPD), oil output in September dropped to 1,503 kb/d and then increased by 121 kb/d to 1,624 kb/d in October. The NPD also reports that the production figures for oil in October include Norwayʼs promised production cut of 134 kb/d in the second half of 2020.”
According to OPEC, the main reason production dropped in September was due to maintenance work and technical problems in some fields.
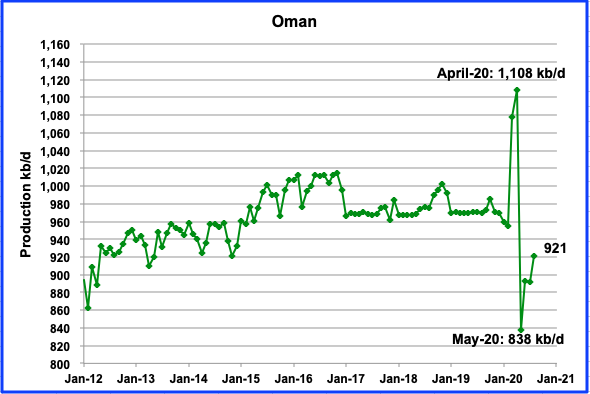
Oman’s August production was up by 29 kb/d to 921 kb/d.
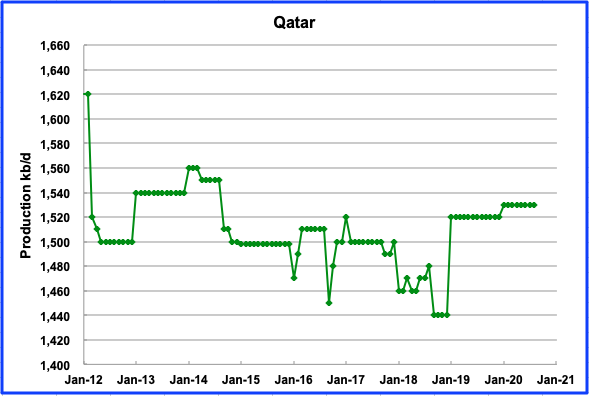
Qatar’s production has been stable at 1,530 kb/d since the beginning of the year, according to the EIA.
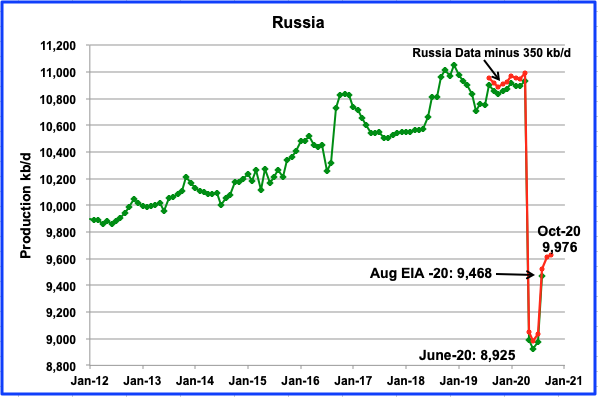
According to the Russian Ministry of energy, Russian production increased by 10 kb/d in October to 9,976 kb/d from 9,966 kb/d in September. Russia revised up its previous September production estimate from 9,932 kb/d to 9,966 kb/d. The EIA reports that Russia’s August production was 9,468 kb/d.
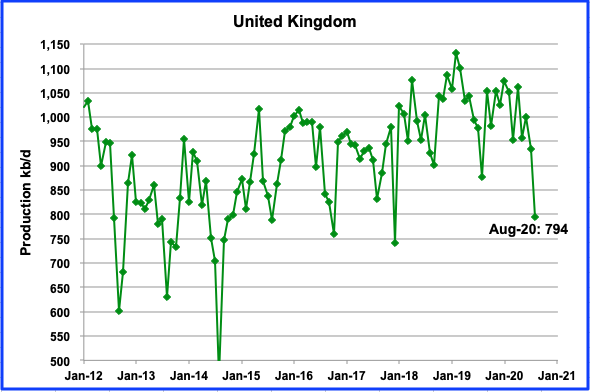
UKʼs production plunged by 141 kb/d in August to 794 kb/d due to summer maintenance. According to OPEC, UK production is expected to stay essentially flat for 2020 and 2021.
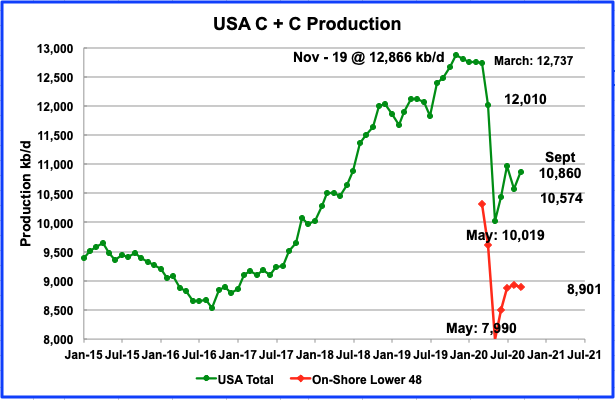
Septemberʼs US production increased by 286 kb/d to 10,860 kb/d from Augustʼs output of 10,574 kb/d. Septemberʼs increase was largely the result of the GOM coming back on line after being shut due to hurricanes. This can be seen in the September On-Shore L48 production graph which was essentially flat at 8,901 kb/d, actually down by 22 kb/d.
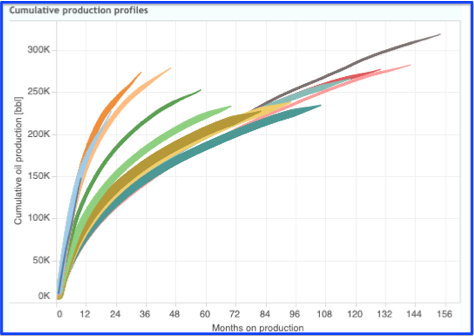
The question that will become of interest going forward is whether the US is close to peak production. The latest data from ShaleProfile indicates that the newly drilled 2020 Permian and Eagle Ford wells may be at or past their peak production.
Also the ND Bakken wells (above chart) are showing the same trend. The dark thin blue line on the left is not showing any increase over the light blue (2019) and the darker orange (2018). Peak well production in 2019 was 723 b/d vs 622 b/d in 2020, a drop of 14%.
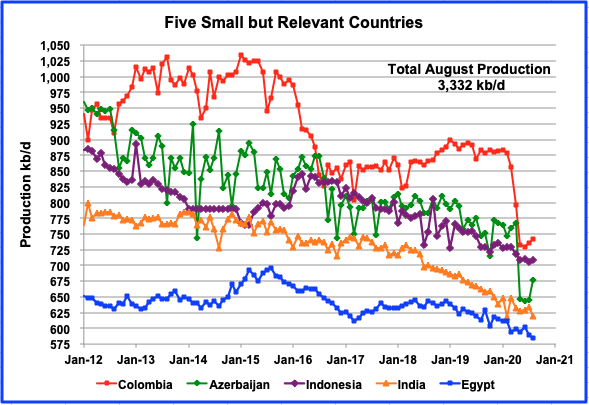
These five countries complete the list of Non-OPEC countries with annual production between 500 kb/d and 1,000 kb/d. All five are in overall decline. Their combined August production was 3,332 kb/d up 14 kb/d from Julyʼs output of 3,318 kb/d.
Non-OPEC Oil Production W/O US
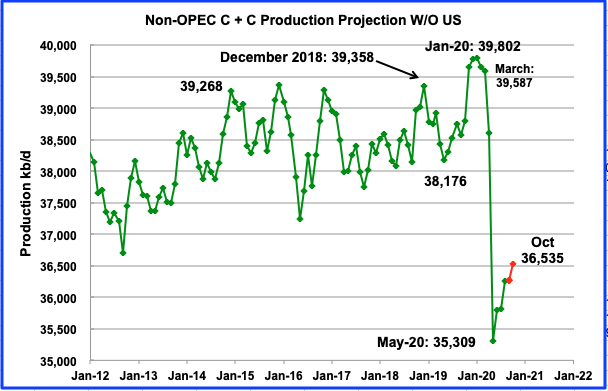
Non-OPEC output W/O US reached a recent new high of 39,802 kb/d in January 2020 an increase of 444 kb/d over the previous high of 39,358 in December 2018. This was due to coincident increases in Brazil and Norway. For comparison, output from Non-OPEC countries W/O the US only increased by 290 kb/d over the four years from December 2014 to December 2018. It is an indication that these countries as a whole are approaching an output plateau. Mayʼs oil output hit a low point of 35,309 kb/d.
Using information from the December STEO, output from the Non OPEC countries W/O the US are expected to rebound to 36,535 kb/d in October (red markers), an increase of 268 kb/d over September.
World Oil Production
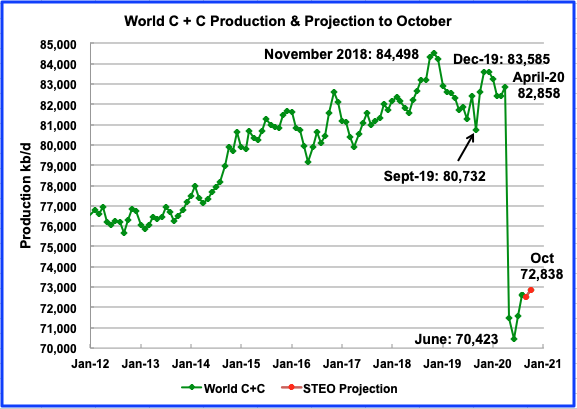
World oil production in August increased by 1,036 kb/d to 72,606 kb/d.
This chart also projects world production out to October 2020. It uses the December STEO along with the International Energy Statistics to make the projection. It projects that world crude production growth will slow after August and will recover by close to 2,400 kb/d to 72,838 kb/d in October 2020 from Juneʼs low of 70,423 kb/d.
54 responses to “August Non-OPEC Production Rises”
Much more oil will come online at these prices, there is so much capped production. How many more 15M+ inventory builds until the price collapse happens? Russia appears to be opening the taps…any economic recovery is still at least six months out.
https://oilprice.com/Energy/Crude-Oil/Oil-Crashes-After-EIA-Reports-Largest-Crude-Build-Ever.html
USD/JPY failed to break lower and confirm lower yields on 10 and 30 year bonds. It has been in a consolidation pattern for exactly one month to the day. It is really starting to look bullish. Perhaps the shorts push bond yields higher from here. Recovery narrative in action. But higher yields is dollar bullish.
Only question is can oil and the dollar rally at the same time. I think they can. As long as the dollar trades like a risk on asset.
Thanks Ovi,
I imagine as vaccinations are rolled out for OECD this may be largely complete by end of summer, for entire World perhaps by fall or winter 2021. Demand for oil will increase as economies recover, the STEO price projection of $48/bo for Brent (2019 $) at the end of 2021 is likely conservative, this suggests perhaps $45/bo(2019$0 for WTI and maybe $43/bo (2019$) at Permian basin wellhead.
How much of U.S. production is shale?
How much new oil is needed to cover well declines in these numbers?
Hume
US C+C total production in September was 10,860 kb/d. The November LTO report states that September LTO production was 7,214 kb/d. That leaves 3,646 as conventional production. Of the 3,646, 1,510 was from the GOM and 444 from Alaska. That leaves close to1,692 kb/d of conventional from onshore L48 states.
Ovi,
Thank you for your reply.
The second question I posted is probably unknown. But I would like to get a sense of when does the 12 billion barrels of stranded oil come into play? If the 72 million barrels you forecast to be produced next year isn’t achievable, what amount of production forces the industry to produce the stranded oil?
Your best educated guess is better than nothing.
Hume,
At the World level there is a lot of production being held back due to lack of demand, OPEC+ could easily produce another 7 Mb/d, if oil supply becomes short as the World economy recovers in 2021 or 2022 (I doubt oil consumption recovers to 80 Mb/d until 2023) then oil prices rise and more oil field development ensues, the final peak my not arrive until 2030, but this depend in part on the speed of the transition to electric transport, we might reach the point of peak demand before reaching peak supply. We will be able to tell by the price of oil, high oil prices (over $85/bo in 2019$) at the peak in World output, suggests peak supply with oil prices continuing to rise after the peak, low oil prices (under $70/bo in 2019$) at the peak suggests peak demand and falling oil prices in the future .
The oil output does not depend only on oil price. It depends also of the current avaibility of oil. The bulk of the reserves which are consummed currently is on mechanical decline. Since the beginning of the 90s or the 2000s, what the oil companies are discovering yearly represents only half of what is consummed yearly in the world, which means we are facing growing oil shortages. Moreover, oil companies fund the commissioning of new reserves with what they are earning by selling oil products. As they did face and they are still facing a drop in oil consumption due to the covid crisis, they did lessen their investments in exploration and commissioning, thus delaying new oil supplies. As a matter of fact, with the drop in investments, they are hastening the arrival of oil shortages. Actually, we are currently in chronic oil shortages since a few months and oil prices didn’t rise to astronomical levels.
Jean-Francois,
There are a lot of petroleum products and crude in storage, at historically high levels, when those stocks fall to near the 5 year average level we may see oil prices rise.
An easy measure of this is to look at OECD petroleum stocks in terms of days of forward supply. In 2018 the level was 92 days, in 2019 it was 94 days, for 2019Q3 it was 94 days and for 2020Q3 it was 109 days, when the stock level returns to 94 days or less, we may see oil prices rise.
Also note that ending stock levels for OECD plus oil on water (in ships) for end of 2019Q3 was 5499 million barrels and for the end of 2020Q3 the level was 6072 million barrels and the pandemic has also reduced demand significantly in the past 15 months, it will take time to reduce the glut of oil that built up since 2019Q4.
See https://www.opec.org/opec_web/en/publications/338.htm
So…which was higher, 2018 or 2019?
A Rystad report concludes $3trn is needed in exploration and development in order to meet demand through to 2050.
https://www.ogj.com/general-interest/article/14188745/rystad-exploration-must-be-accelerated-to-meet-world-oil-demand
I read the article – I don’t see a simple summary of the level of demand for oil that they expect. They acknowledge that there is a transition to alternatives, but don’t describe it.
Seems likely that the marginal ROI of alternatives to oil will be higher than new oil E&D.
Hume,
Thanks. An excellent piece.
Lets assume the Rystad projections on demand and exploration are correct- the need for $3Trillion in new crude oil exploration.
It will take much higher prices to stimulate a new wave of frenzied exploration to help close the discovery shortfall.
The last time the prices were high enough to spur brisk global exploration activity, the results were not promising- new discoveries poor since 2004.
Lets say we find ourselves in this higher price scenario, say in the second half of this decade.
There will a choice for those companies/countries wanting to develop new energy for transportation- do you spend trillions on exploration for new oil resource, or do you spend the money on a much cheaper and predictable forms of energy that you can bring to market in just a few years- solar and wind for electric vehicles?
I believe the vast majority of that new capital deployment will go to the wind and solar deployment and battery production, rather than oil exploration.
[note-71% of crude oil goes to transportation use]
Hicks , agree with you 100% . All land is mapped . What is left is offshore . Why spend billions to explore and produce oil at $ 80 and sell at $50 ? A no brainer . The $ 3 trillion is not there anyway . Rystad is just pissing in the wind .:-)
Hickory,
You may be right, but it may depend on the price level. My guess is that demand will be lower than Rystad predicts from 2035 to 2050 as the transition to EVs proceeds, so Brent oil prices may not rise to more than $100/bo in 2020$. Part of this story is the idea that OPEC may see that demand projections are too high and may fear that a lot of their oil will become a stranded asset beyond 2035. That scenario envisions the cartel falling apart and an all out war amongst the lowest cost oil producers for market share and a rapid development of their resources to pump as much of their resources as quickly as possible. This scenario would result in a glut of oil on the market around 2035 as demand continues to fall despite falling oil prices (at this point new ICEVs will only be competitive with new EVs if Brent oil prices fall to under $30/bo in 2020 US$). More expensive resources such as newly developed oil sands projects, new ultra deep water offshore projects, new arctic oil projects, and new tight oil well completions will no longer be economically viable once Brent oil price falls to under $40/bo in 2020$ and even most new developments of cheaper Russian and middle eastern oil may no longer be economically viable under such a low oil price scenario. Clearly the exact path of how this plays out is difficult to guess
Dennis, if oil exporting nations wait until too long (2035) to fight for market share in the fear of having residual unsold assets, they will have waited too long. [EV]
Rather, it looks like this game has already been underway on a small scale ever since the USA tight oil production became big enough to been to erode exporters profits (2013-2014).
I don’t see this scenario.
It’s better for them to sell part of their oil for high prices, and let strand the rest.
The alternative? Make a firesale of all oil, sell it for or under production costs, and invest billions to get all these recovery installations and infill drillings to recover it. Even with low margin oil you have to invest billions.
Selling 5 mbd at 50-60$ is much more lucrative than selling 7 mbd at 20$ or below.
There is no incentive to sell all oil – it’s like Apple. They could double their IPhone production and slash the prices by half or more – but they won’t earn anything for doing this, and their stock would crash.
There are other examples:
US coal. They didn’t go for market share in an all out price war – they simply started closing mines and letting the coal become stranded assest. I think this is the scenario – first reduce exploration (wasted money in this scenario), then stop tapping new fields where you need new base installations. And finally reduce infill drilling / installing new injectors and simply pump what you get at low cost.
And trying to keep the price high enough to earn some money without starting new booms. A few short phases with very low oil prices are needed to scare new developments like tar oil, deep sea oil out of the market.
Eulenspiegel,
Perhaps there will not be a price war, but my thinking is that OPEC nations and Russia may believe they can slow the transition to electric transport with relatively low oil prices. Let’s assume for a moment that OPEC actually has all of the conventional reserves that they claim (953 Gb excluding Orinoco oil). Let’s say they produce all of this at an oil price of $50/bo in 2019$, so that’s $47.65 trillion (2019$) of gross revenue. Alternatively let’s say they aim for $100/bo as a target oil price and achieve $90/bo (again in 2019 US$), a long as they sell 529 Gb at that price their gross revenue would be the same. We would need to estimate costs to get a better picture. Say for the 953 Gb case average cost is $25/bo and for the higher oil price case average costs are lower (say $20/bo because the cheapest to produce oil will be the first produced to maximize profits). So net revenue for the 953 Gb case would be $23.825 trillion (2019$) and the high price case with net revenue of $70/bo would only need to produce 340 Gb to come out even with the low price case. OPEC nations may have their economists trying to figure out the best strategy as they know the costs of production for their various fields. I can only speculate.
Part of my thinking is that costs to produce oil in the Middle East and Russia are much lower than elsewhere so they certainly are capable of taking market share from higher cost producers if they choose to keep oil prices low. I expect they may choose to do that by 2025 and perhaps we will never see high oil prices (above $75/bo) in the future if OPEC and Russia develop their resources more quickly than the past.
In any case any speculation about the future is nearly certain to be incorrect, of that only am I certain.
I joined this forum to better understand the oil and gas industry and inform investment strategy. To that end I saw this article and started visualising the near limitless upside to investing in 88 Energy Ltd.
https://www.energyvoice.com/promoted/284872/lon-88e-north-slope-articleisfree/
But I have the nagging doubt. Surely it can’t be that simple. Can it?
It’s not that simple. Every year 88e raises a shed load of cash from issuing shares and has another crack at drilling. This was the last attempt.
https://www.jwnenergy.com/article/2020/2/25/charlie-1-looms-potential-company-maker-88-energy/
Hume- “I joined this forum to better understand the oil and gas industry and inform investment strategy.”
While I don’t generally say much about investing, I have been watching and investing for quite a long time.
Here is an observation-
Since Dec of 2014 Exxon is down 51.4%, while Next Era Energy is up 182.8%
Who is Next era Energy (NEE)? Simply the largest electric utility in the country, more than twice as large as any other. In addition to oil,coal, gas and nuclear energy production, they have been early and aggressive on renewable energy deployment, and are now the largest individual producer of wind and solar energy in the world. And they are just getting started.
When you compare the performance of these two energy powerhouses over the last 6 years, you can clearly see the trend written in massive letters (or the relative stock performance) – we are in the first or second inning of a massive shift towards electric power and electric motors.
It might be fruitful to consider this in your investment thinking.
How much of the 182.8% increase is attributable to renewable energy? When factoring in Next Era is involved in oil, coal, nuclear and gas which produce far more gigawatts of energy than renewables does.
Electrification of the transportation system is a certainty. But renewables alone can’t achieve the output required to power the infrastructure.
World renowned and legendary investor Warren Buffet has recently purchased oil and gas pipelines from Dominion energy in a $10bn deal. Goldman Sachs head of commodities Jeff Curries sees Brent Crude at $65 a barrel in 2021. He cites under investment as a driver to higher prices.
Investing isn’t about putting money into sectors you’re ideologically wedded to. Inspecting the balance sheet of a company. What percentage of market share does the company possess. Does it have moat. EPS, dividend, free cash flow, price to earning ratio and much else besides.
Hickory, I hope you bear this in mind before going all in on renewables.
“NextEra Energy (NEE) and its affiliate NextEra Energy Partners (NEP) recently announced Q3 results and delivered guidance.
The common thread for both companies is they ignited robust underlying earnings growth by deploying new renewable energy generating capacity, despite pandemic-related pressures. It’s exactly what we saw in their results for the first half of 2020. And there’s every indication we’ll see the same strength in Q4 and beyond.”
https://www.forbes.com/sites/greatspeculations/2020/10/22/nextera-energy-renewables-powering-q3-growth/?sh=5e3364a91c4f
Hume- “Investing isn’t about putting money into sectors you’re ideologically wedded to.”
Exactly. Look at the performance.
In the energy space, electric generation and transport sectors have been on a long and strong run in the past 5+ years. Its a trend that is still young.
Ignore or embrace that sector at your own discretion.
Saw part of a stock investor program today where an investor asked an oil analyst about MEG Energy. MEG is an oil sands company. Apparently heavy oil from Venezuela and Mexico is getting more scarce and the analyst liked oil sands. The Interviewer thought that oil sands stocks were not a good investment. The analyst then gave his opinion that the Cdn oil sands were necessary to meet new upcoming demand for heavy oil and that shale could not. The interesting comments start around 1:00. It about 2 1/2 minutes long.
The other two stocks he mentioned are CNQ and SU, both listed on the NYSE and are up over 50% since the end of October. Both are world class companies that pay good dividends. But as the interviewer implied, many funds are now shying away from the Cdn oil sands stocks.
https://www.bnnbloomberg.ca/video/eric-nuttall-discusses-meg-energy~2099337
More of interest here, too, from the same man
https://www.bnnbloomberg.ca/video/eric-nuttall-s-market-outlook~2099254
Frac spread count continues to rise
https://www.aogr.com/web-exclusives/us-frac-spread-count/2020
Up 11 for week ending 12/11/2020, frac spread count was 80 for week ending Aug 21, 2020, nearly doubled in 3.5 months.
On frac spread count, if the trend from late may to late november continues we could see a 220 rise in frac spreads over the next 12 months, bring us to 379 by early December 2021. That would bring the frac spread count close to the year end 2019 level in about a year.
Much will depend on future oil prices, I expect the current STEO outlook will prove conservative, I think we will see Brent at $55/bo in 2020$ by the end of 2021 (monthly average price).
Dennis,
If you assume there is still a global economic shut down in December 2021 with frac count rising. It can only mean global demand is outstripping supply even with the restrictions in place. Forget what the frac count would be if the economy returned to normal.
The price of oil is immaterial, if the banks are willing to subsidise the various operators through endless loans and credit.
There is a bullish set up on USD/CHF. Bullish engulfing candlestick at the bottom of a long downtrend on daily chart. It shows up as a spinning top candlestick over in EUR/USD. Basically means dollar weakness is over. Now this could be due to a hard no deal Brexit coming. Which is a risk off event. So USD/JPY would likely sink along with treasury yields. This is how CHF/JPY would actually get a sustained move down. Which almost never happens. Bearish shooting star candlestick on Weekly chart CHF/JPY btw.
This setup is not bullish oil price. It’s a sell all assets kind of set up. Even gold will get sold. Bitcoin will likely selloff under this scenario as well.
This is potentially another Lehman event but it will just start in Europe instead of the US.
HHH , I agree a hard Brexit will be a FUBAR for both UK and Europe .
No payment. Can’t hurt.
Furthermore, everyone is stuck at home for the next three months and not using much oil:
https://japantoday.com/category/business/90-of-japanese-firms-forgo-year-end-new-year-parties-due-to-virus
https://news.rthk.hk/rthk/en/component/k2/1565085-20201213.htm
https://www.channelnewsasia.com/news/world/germany-covid-19-spread-shops-close-christmas-holidays-13762714
There will not be much flu this year. Likely a complete flame out.
India is not coming back . This is the month of November which is the festive season (akin to Christmas) .
https://energy.economictimes.indiatimes.com/news/oil-and-gas/indias-fuel-demand-fell-5-per-cent-in-november-oil-ministry-data/79702684
The iphone assembler makes no money ,so does not pay wages .
https://indianexpress.com/article/cities/bangalore/karnataka-iphone-plant-violence-160-arrested-wistron-pegs-loss-at-rs-438-crore-7104526/
Am I the only one who is getting the 404 message when I go to Mike Shellman’s blog ? Any info is appreciated . Hope all is fine with him .
hole in head,
It works for me.
Tks , works for me now . He has changed the layout and format . Formerly it was without log in .
LTO are not the crude barrels you are looking for.
https://www.zerohedge.com/technology/one-little-problem-all-electric-auto-fleet-what-do-we-do-all-waste-gasoline
Another follower of Nat Hagens and his silly “renewables are only replaceables” thing.
LongTimber , I am all for not only the reduction, but the end of FF usage . Simultaneously I cannot ignore facts . BoJo announced all electric by 2030 . Congrats . The difficult question is UK collects GBP 40 billion( $50billion) per year as fuel+car+road tax . How will you replace this ? India has for the Federal govt approx $ 52 billion , for the states about $ 25 billion . Total $ 75 billion rounded off . Fuel + car+ road taxes are the easiest to implement ,collect and trace . This story is all over the world . Paradox .
Hole in head,
Charge fees for road use based on weight of car and miles travelled at car registration.
Problem solved.
Agree. A quibble: “vehicle”, instead of “car”, as trucks do the great majority of damage to roads.
Nick,
I agree, vehicle is the word I should have used (and what I had in mind).
Yeah, I knew you knew that.
Another thing worth saying is that this is a long-term problem. It will be a while before there are enough EVs in the US, UK or or India that we have to worry about switching to a new revenue source.
The primary problem with fuel taxes at the moment is that they are far, far too low: in the US they haven’t been raised in decades and India is still in the middle of ending fuel price controls and subsidies, and as a result they only cover a fraction of road costs, let alone covering the external costs of fossil fuels: pollution, security, etc. In the US the right-wing has been reducing government revenues of all kinds, regardless of the state of the economy, the tax base, or the needs of taxpayers for services. That’s why roads aren’t being maintained.
Fuel taxes should be raised, and EVs left untaxed, to create an incentive to switch that’s proportional to those external costs.
In the meantime we should have weight based fees on trucks: they exist now for over-weight trucks and could be expanded pretty easily.
For the moment, it seems to me that proposals to create new taxes on EVs to replace fuel taxes are really just attempts to protect ICEs and FFs. We should push back on such attempts.
I was watching markets earlier today. USD/JPY looked like it was about to drop out below the consolidation pattern it had been in for a month. I was thinking risk off lower treasury yields. Then USD/JPY bounced and formed a pinbar candlestick on daily chart. Long wick points down so direction is up. Which means one of two things. Either higher yields on US treasuries are coming or Bank of Japan is about to let loose with some stimulus. Or both.
I’ve watched what the USD/JPY can do when it’s not range bound and it’s trending instead. If this pair starts trending up. You better not be short the dollar anywhere. Particularly you better not be long commodity currencies against the dollar. Which I am currently against the dollar since late March. It will sink your long AUD/USD and NZD/USD positions. And your short USD/CAD position.
If your long gold you better head for the exit if USD/JPY starts trending up.
This pair absolutely has the ability to drag down the price of oil if the move is strong enough and long enough.
HHH, I think the dollar has bottomed out . I have posted a link to what CHS has to say on this . His point is very simple ” Trash (low ) dollar means USA looses global hegemony , high dollar will squeeze Wall Street and cause pain to the financial markets ” . Choosing between the two , choosing the second option is a no brainer . Dollar value is a finance+ political issue . Finance cannot be taken in isolation . Though I believe that the inverse dollar/oil relationship does not hold ( my view is inverse dollar/S&P- DJI) but it would still mean lower oil prices as you have indicated .
At the moment, the dollar is on sale for $89.99. Haven’t seen this price in a while. Oil at $48.39 is going to start changing some calculations soon.
This article caught my attention.
https://www.bloomberg.com/news/articles/2020-11-24/oil-curve-flips-to-most-bullish-in-months-after-vaccine-rally
From the article
“The curve’s move into backwardation suggests traders will start to struggle to keep oil in storage. That, in turn, may mean that lots of barrels are going to be released into the market. At the same time, the curve is also signaling that the market currently needs those supplies.”
Sales increased in Oct /Nov because of festive season and are again faltering . 15 days of December data is in .
https://energy.economictimes.indiatimes.com/news/oil-and-gas/indias-dec-1-15-diesel-sales-down-5-2-per-cent-shows-data/79757066
https://www.bloomberg.com/news/articles/2020-12-15/christmas-driving-set-for-slump-with-most-americans-staying-home?srnd=markets-vp
Gasoline is not selling ,ATF is not selling . No wonder the refineries are in trouble .
Low demand + ESG investment only = No new oil production will come online . The oil now underground will remain underground . Discovered oil is important but more important is FID to bring this discovered oil online . No more . We have crossed peak whenever it was and whatever parameter we may choose .
https://oilprice.com/Energy/Energy-General/Big-Oil-Slammed-With-A-7-Trillion-Reality-Check.html
970B the talked about stimulus. For this calendar year that should put us somewhere around 4 trillion in deficit. People used to care about that.