By Ovi at peakoilbarrel.
Normally near the end of the month an update on world oil output is posted here. However this month the EIA’s world oil report will appear too close to the US monthly report. For this month, in its place, this space will be filled with the three oil growth projections that the EIA published in April along with other oil production related information. The world report will be posted after the US report, later in May.
Short Term energy Outlook (STEO)
The STEO provides projections for the next 13 – 24 months for US C + C and NGPLs production. The April 2021 report presents EIAʼs updated oil output and price projections to December 2022.
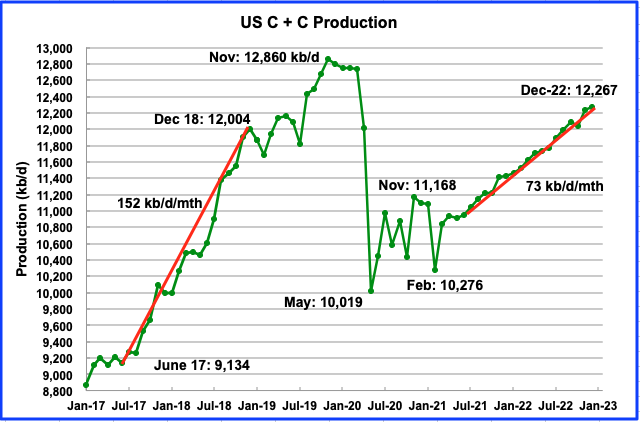
According to the STEO, US output is projected to increase in March 2021 after recovering from the February low of 10,276 kb/d.
The April STEO has revised down the December 2022 estimate by 228 kb/d from 12,495 kb/d to 12,267 kb/d. Also the February 2021 low has been revised down by 118 kb/d.
Starting in June 2021, these two reductions lowered the average projected monthly rate of increase to 73 kb/d/mth or 876 kb/yr. Compare this rate with the rate of increase from June 2017 to December 2018, 152 kb/d/mth. More about the significance of this difference later.
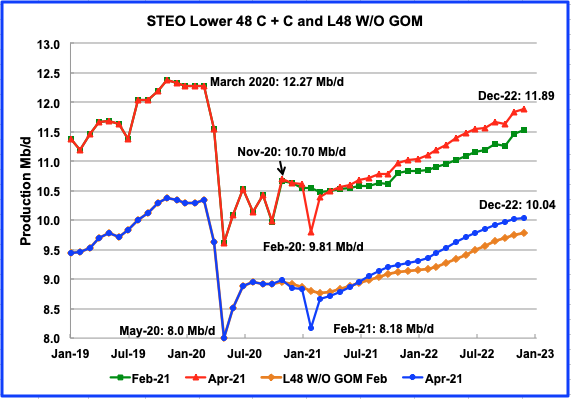
The April STEO output projection for the L48 states is lower than the one provided in the March report and moved back toward the February forecast. Surprisingly, it also reflects a contrarian slightly higher WTI price environment. The December 2022 output forecast was lowered from 12.12 Mb/d to 11.89 Mb/d, a drop of 0.23 Mb/d. This may indicate that the EIA is projecting a lower drilling rate even though their April WTI price projection has increased.
The EIA continues to project a significant increase in production in the L48 starting in March 2021. From March 2021 to December 2022, the US will add 1.5 Mb/d by going from a daily production rate of 10.39 Mb/d in June to 11.89 Mb/d in December 2022.
In the onshore L48, L48 W/O GOM, production starts to increase in March 2021 from 8.67 Mb/d to 10.04 Mb/d in December 2022, an increase of 1.37 Mb/d. The average monthly increase in production rate is 65.2 kb/d/mth.
Statements from some oil company executives indicate that their drilling plans may be less aggressive going forward and may be reflected in the EIA’s lowered projection.
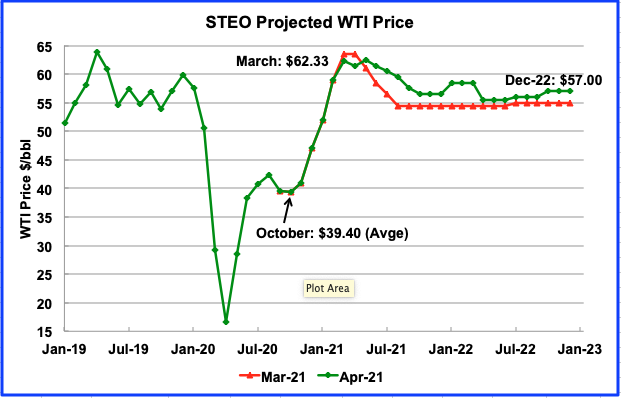
The April 2021 STEO is projecting a WTI price of $62.50/bbl in May 2021 before beginning to fall back to $56.50/b in October, a $2.00 increase over the previous March report. The April report projects slightly better prices going forward than the March report.
The June WTI contract settled at $62.14/bbl on April 23, slightly higher than the EIA projection of $61.50
DRILLING PRODUCTIVITY REPORT
The Drilling Productivity Report (DPR) uses recent data on the total number of drilling rigs in operation along with estimates of drilling productivity and estimated changes in production from existing oil wells to provide estimated changes in oil production for the principal tight oil regions. The following charts are updated to May 2021.
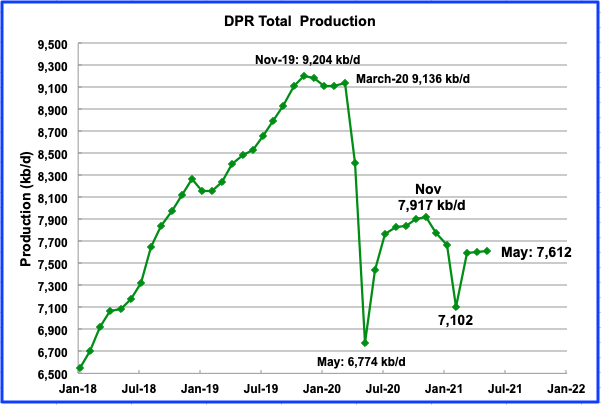
Above is the total oil production from the 7 DPR basins that the EIA tracks. Note that the DPR production includes both LTO oil and oil from conventional fields
The DPR is projecting output for May 2021 to increase slightly over April to 7,612 kb/d, up 408 kb/d from February’s snow storm induced drop. In the charts below, it is shown how the Permian’s outputs increase is being offset by declines in the Bakken, Eagle Ford and Niobrara basins.
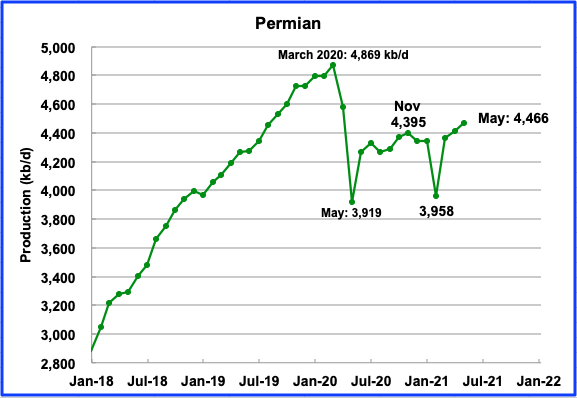
Permian output in May 2021 is projected to be 4,466 kb/d, up by 52 kb/d from April.
During March, 215 rigs were operating in the Permian, up from 100 in November. These 215 rigs appear to be sufficient to offset the decline from older wells and increase production.
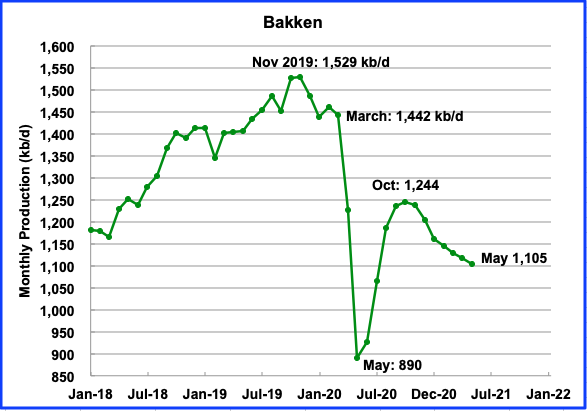
Bakken output in May is forecast to be 1,105 kb/d a decrease of 12 kb/d from April.
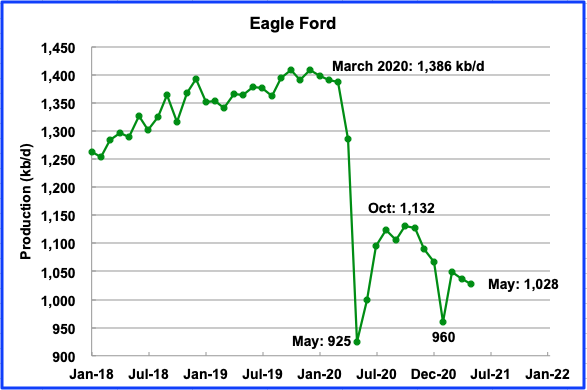
Eagle Fordʼs output reached a recent peak in October and then began to decline. In May, Eagle Ford’s output is expected to drop by 9 kb/d to 1,028 kb/d.
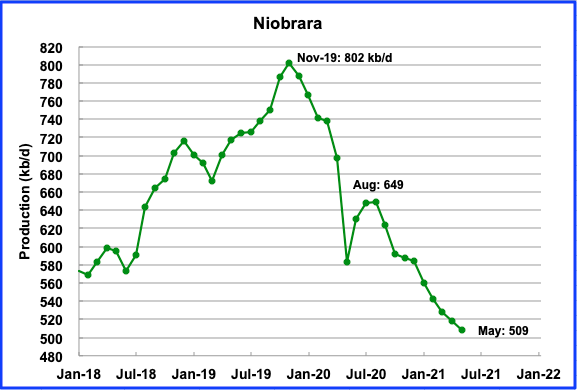
The Niobara has been in decline since August 2020. The recent decline rates are lower than those experienced in September and October of last year.
LIGHT TIGHT OIL (LTO) REPORT
The LTO database provides information on LTO production from seven tight oil basins and a few smaller ones. The April report projects the tight oil production to March 2021.
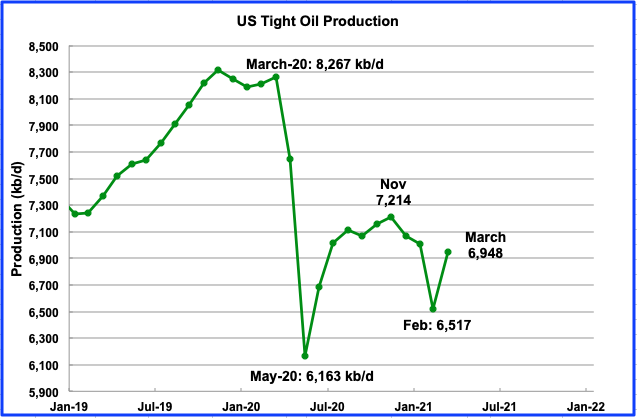
March’s LTO output is expected to increase by 431 kb/d to 6,948 kb/d. Wells that were shut in February were brought back online in March after the severe winter snow storm that hit Texas and New Mexico. Note that March’s output is still lower than January’s output by 57 kb/d.
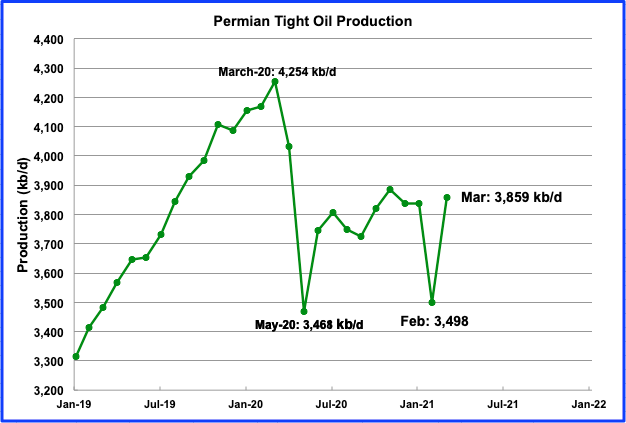
Permian LTO output in March is projected to increase to 3,859 kb/d, an increase of 361 kb/d due to putting shut wells back on line. March output is projected to be 23 kb/d higher than January.
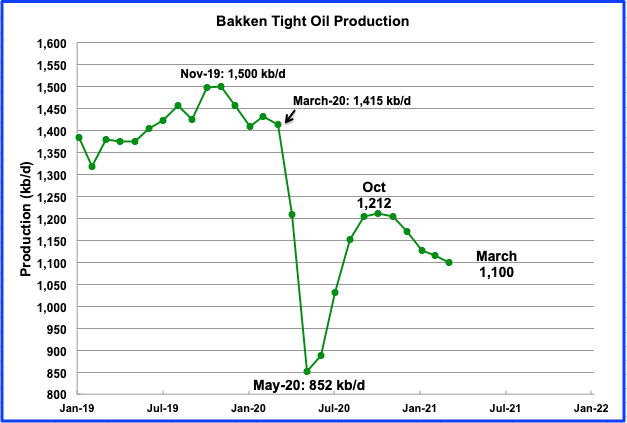
The Bakkenʼs March output is expected to continue to decline after the recent peak was reached in October. March production dropped by 16 kb/d to 1,100 kb/d. In December and January, close to 11 rigs were operational and they increased to an average of 13 in March.
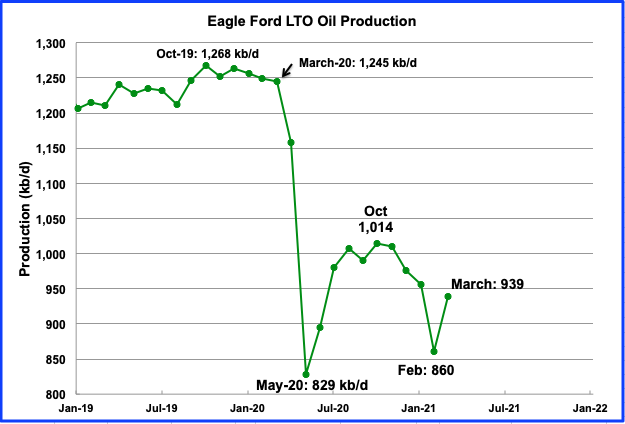
The Eagle Ford basin is expected to produce 939 kb/d in March, an increase of 79 kb/d from February. Note that this is still lower than January’s output by 17 kb/d.
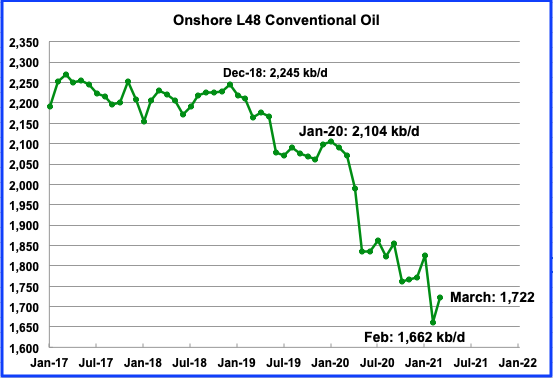
Conventional oil output in the On-shore L-48 is expected to increase by 60 kb/d to 1,722 kb/d in March 2021. This estimate is based on a combination of the March LTO output and the STEO April report that projects US on shore L48 to March. The average rate of decline from January 20 is close to 27 kb/d/mth. Will this decline rate continue or will it rebound/slow?
Fracs and Rigs
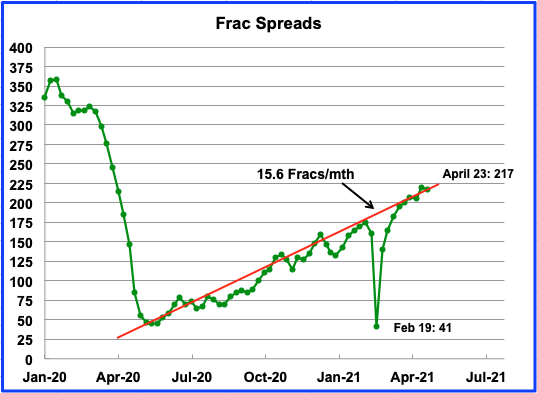
At the end of May 2020, 45 frac crews were active. In the week ending April 23, 217 were active. Over the next 11 months to April, 172 frac crews were added or 15.6 crews per month. This rate has been very steady over this time period and is showing no signs of rolling over.
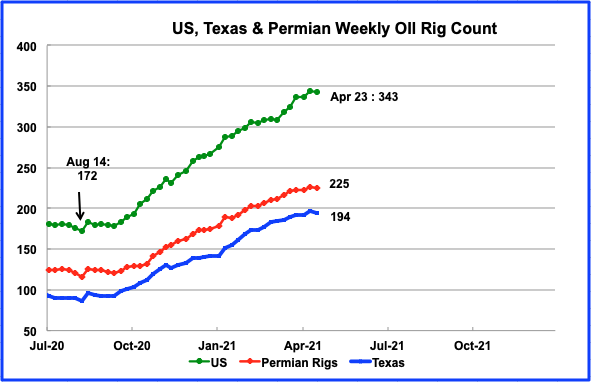
The US oil rig count has continued to increase steadily since October 2020. Are there hints of slowing in the latest April numbers?
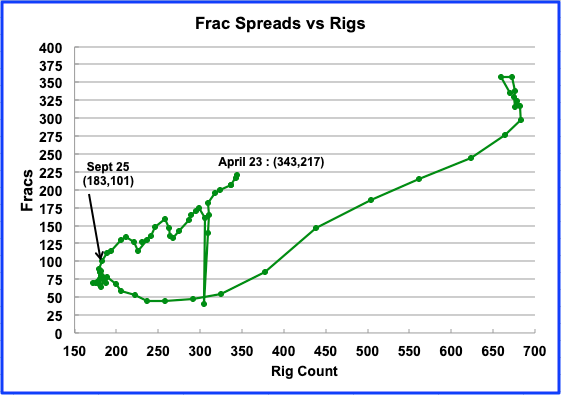
This chart relates the weekly oil rig count with frac spreads. From Sept 25 to April 23, roughly two frac spreads were added for every three additional rigs. More recent data indicates this ratio may be increasing.
A Question Regarding the Impact of Future US Production on Oil Price

There has been a lot of discussion/questions here at POB as to whether the US will get back to its peak production rate of 12,860 kb/d reached in November 2019 or exceed it. While this is an important question, what needs to be added to the question at the same time is “Over what time frame”. Time is critical.
The basic question that needs to be addressed, going forward, is how will monthly/yearly US production growth compare with world demand growth?
To put some perspective on the importance of time, compare how production increased over the time span starting June 2017 to December 2018 with the STEO projected output from June 2021 to December 2022.
The STEO projects an average monthly output increase of 73 kb/d/mth or 876 kb/yr over the time span June 2021 to December 2022.
Over the time period June 2017 to December 2018, the US increased production at the rate of 152 kb/d/mth or 1,824 kb/yr. At the time, according to OPEC, world demand for all liquids was growing at 1.5 Mb/d/yr or 1,275 kb/d/yr of C + C, assuming C + C comprises approximately 85% of all liquids. So the US was producing 550 kb/d/yr more oil than world demand in 2018.
Since the US was over producing, this forced OPEC to reduce production to compensate. Unfortunately OPEC’s reduction was insufficient and resulted in the collapse of World (WTI) oil prices starting in October 2018 from $76/b to $42/b at the end of 2018.
The takeaway here is that after OPEC + restores its cutbacks, as long as US production increases at a rate lower than world oil demand increases, OPEC + will regain control of the oil market and will be able to better control prices for the benefit of all producers.
Looking at the STEO projection out to 2022 and assuming that world demand growth slows to 1,000 kb/d of all liquids in 2022, (850 kb/d C + C) the US production rate of 876 kb/d (C + C) would just meet world demand growth and leave no room for OPEC + to grow. This situation could limit oil prices closer to $70/b over the longer term. It is not unreasonable to assume that over the near term, one to two years, oil prices will be very sensitive to US annual production growth.
Some additional reading on US production. There is a great discussion on this article at the end of the previous OPEC post.
Russia March Update
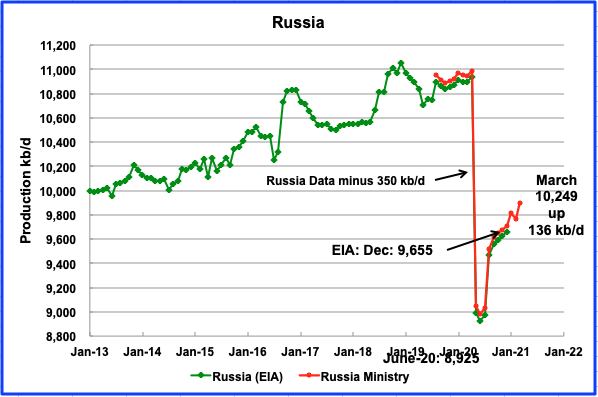
Russian production increased in March by 136 kb/d as part of an agreement with OPEC +.
Ovi,
Nice post. Keep in mind that oil demand is expected to rebound from 90 Mb/d in 2020 to 96 Mb/d in 2021 (average annual output estimated by OPEC for total liquids). If we assume 85% of this is crude, that would be about 5000 kb/d. My estimate for tight oil output over the 2020 to 2022 period is 7297 kb/d in 2020, 6540 kb/d in 2021, and 6650 kb/d in 2022 (annual average output of tight oil for each year). The EIA’s forecast for US output in the STEO may well be too optimistic, if we assume as I do that GOM and other US conventional output is relatively unchanged from the 2019 level over the 2021 and 2022 period. I generally assume that most of the increase (if any) in US output will be from increases in tight oil output.
If my guess for future US tight oil output through Dec 2022 is correct, the World may struggle to produce the 96 Mb/d that will be needed to meet World demand in 2021. By 2022 OPEC may indeed be producing at close to full capacity and US tight oil may just barely meet World demand, I expect the EIA’s price forecast will be too low and perhaps my guess of $75/b may also not be enough to satisfy World demand for oil. Much depends on vaccine distribution and the course of the pandemic.
The high water mark for 12 month centered average US tight oil output was Nov 2019 at 7996 kb/d. For my model that level is not reached until October 2024 from the minimum of 6530 kb/d in August 2021. So on average we have an average annual increase in US tight oil output of roughly 500 kb/d from 2021 to 2024. I would say there is little danger of low oil prices (less than $75/b in 2020 US$), if my scenario proves correct. The scenario is conservative and higher oil prices might lead to higher output.
Dennis
There is an is an interesting table in the latest free January IEA report. It shows that in February 2021, OPEC 10 had a spare/reserve capacity of 4.56 Mb/d. I think this is crude, not all liquids. It’s partners, lower half of chart, had a reserve capacity of 2.56 Mb/d for a total of 7.12 Mb/d.
As you have noted, OPEC is forecasting demand growth of 5 Mb/d for 2021. So based on the IEA data, I think the world will be fine for 2021. I think the problems begin in the later half of 2022 if the US cannot produce the EIA’s expected increase of 1 Mb/d. If your forecast is correct, the demand stress on OPEC could manifest itself by mid-2022.
Not quite sure how much India’s pandemic will affect/delay OPEC’s forecast demand growth. Their vaccination program has just begun and the pandemic appears to be in the exponential growth.
Ovi,
I agree the pandemic is a big wildcard, nice info thanks. If supply is short (pandemic subsides quickly) and oil prices rise more than the $75 for Brent I have guessed, then tight oil might expand at rates close to the 2018/2019 rate in 2022/2023. My scenario is fairly conservative with a slow ramp up in completions. Infinite possible paths, I have picked one, probability of correctness=zero.
“Much depends on vaccine distribution and the course of the pandemic.”
You can say again.
Just over 7% of the global population has received 1 shot.
Hickory,
Yes we have a long way to go.
https://www.nytimes.com/interactive/2021/world/covid-vaccinations-tracker.html
A bit more about Russia. Dennis first posted this link a couple of weeks ago. It has a wealth of information. It was published in September 2019. The Future of Russian Oil Production in the Short, Medium, and Long Term
They published another paper in 2017 predicting Russian production would hit 11,268,000 bpd in 2018. They did not quite make it but they did average 11,252,000 bpd in 2019. They predicted Russia to peak at 11.5 million bpd in 2020.
In our 2017 paper we identified that projects already in the pipeline, combined with efforts to slow the
natural decline of brownfields, could push oil production from an average of below 11 mb/d in 2016 to
around 11.5 mb/d by 2020 before going into gradual decline towards 2025.
Of course, the pandemic hit and kept that from happening. But from their 2019 paper, linked above, concerning brownfield management:
However, the success to date can be seen in the performance of six of the country’s largest production companies, all of which are subsidiaries of the Russian oil majors. (These majors) have demonstrated a combined average rate of decline of 2 percent per annum over the past decade, compared to a natural decline rate for fields in West Siberia of around 10-15 percent per annum.
Massive infill drilling has gotten their brownfield decline down from a natural decline rate of 10-15 percent to 2 percent. But they do not believe this decline rate can be held:
An additional concern is that our long-term forecast for brownfield decline, of 2-3 percent per annum,
may be too optimistic if the current performance cannot be maintained as fields move further into their
final years
And they say, concerning the below chart”, bold mine.
Figure 10 below. As can be seen, the overall output figure in 2030 of just over 8 mb/d is close to the “Brownfield+2 per cent” case in the corporate analysis above, implying that the regional analysis assumes a more normal decline curve for average oilfields in Russia. In other words, it confirms that the corporate analysis assumes continued technology progression, especially in slowing the brownfield decline, and therefore it is important to assess how this may be achieved. Indeed, an overall question is how can the Russian oil industry
achieve the target set for it by the Ministry of Energy of maintaining production at 550 mm tonnes per
annum (11.05 mb/d) until the end of the next decade? In other words, will the Russian oil sector be
able to fill a 2.5 mb/d gap by 2030, particularly when it seems that its major producing regions (West
Siberia and the Volga-Urals) will be in permanent decline by then?
What they are saying here is there may be serious problems with the Ministry of Energy’s production goals. They seem to doubt it. Their brownfield production, (West Siberia and the Volga-Urals) shown in blue in the chart below, was about 80 percent of total Russian production in 2018 and 2019. Hey, 80% of their production will be in serious decline for the rest of this decade. Does anyone really believe the small fields they are finding in the East Siberian Arctic will replace that?
Ron,
I take my cue from their conclusion:
Overall, then, it would seem that Russia does have the opportunity to meet the Russian Energy Minister’s target to keep oil output over 11 mb/d for the next decade. Indeed, if the country’s import substitution strategy is a success then it could even exceed the target, as there is little doubt that the resources are in place. A combination of performance enhancement at existing fields, exploitation of EOR techniques and hard-to-recover reserves, plus some efforts to maintain offshore oil output should be enough to meet the overall goal. Perhaps the more interesting question, though, is what could happen if sanctions are lifted. At that point, the potential of all these resources could be released rapidly, leading to a surge in output towards 12 mb/d or above.
This seems a bit optimistic based on all of the discussion earlier in the paper. In Figure 18 on page 22 at the end of the paper they show what they believe is possible.
Good gravy Dennis, that chart looks horrible. Notice the “conventional” has declined dramatically. The increase in “other” and “condensate” is minable. “Offshore” has declined. All significant gains comes from “EOR” and “Hard to recover”. They have been doing EOR for many years. That’s how they got the brownfield decline down from 15% to 2%. I have no idea what “Hard to recover” is. But that’s what they believe will be their savior.
I have my doubts.
Hard to recover is things like tight oil. As they explain in the paper EOR is defined differently in Russia and the Oxford paper uses the Western definition which is tertiary recovery, the Russians have done far less of that than Norway, UK and US. I am no expert on Russian oil production, but perhaps the authors of the paper have researched thoroughly and industry experts in Russia.
I agree Chart 18 seems too optimistic, chart 17 may be too conservative, maybe reality will fall between those estimates.
Russian oil firms have appalling management, no incentive to innovate, falling technical competence, and little inward investment after the corruption and tax takes . Therefore ‘hard to recover’ means irrecoverable without outside help, and between sanctions, western antipathy to Putin, and financial sectors fear of fossil fuel investment that has to come from China. The last time I had direct exposure, six or seven years ago, Chinese engineering in oil and gas was pretty bad, they could whack out FPSO’s and LNG carriers as long as someone told them exactly what to do with no margin for free thinking that would allow them to cut costs at the expense of quality. They seem to be able to catch up pretty fast in most things, although I have some doubts about quality standards. They are active locally and in Iraq and Africa but really don’t have much experience with harsh environments like the Arctic or complex drilling problems and it’s difficult to just buy or steal that sort of thing.
Thanks George. Doug Leighton, thought the engineers in Russia were pretty good, I think. I agree the sanctions will be a problem, maybe Russia will change behavior when prices rise and they need Western expertise and technology. I doubt it though.
Does figure 17 look reasonable to you, did you read the Oxford paper?Maybe it is not well done, it looked good to me, but I don’t know the industry as well as a professional.
Dennis —
“Doug Leighton, thought the engineers in Russia were pretty good, I think.”
To be clear, the few Russian Engineers I worked with were competent, all had excellent math skills but, mostly, they were inferior respecting computer proficiency (because in many cases they lacked access to comparable equipment). It’s very unlikely the computer comment applies now. For sure, their ability to consume alcohol greatly exceeded mine — without exception!
Note: I am in no way contradicting George, I wouldn’t dare. 😉
I don’t quite see how “falling technical competence” in one old and crumbling industry can be interpreted as saying Russian engineers are not competent, ones a relative term about something that encompasses a lot more than human ability in quite a narrow field (narrower than just the oil industry but specifically the supposed cutting edge bits), the other is a relative term for a specific aspect (engineers’ quality) of a general field (all of Russia).
Thanks for the corrections George and Doug, you both know far more than me.
Some in Russia apparently see a peak in oil demand in this decade-
“Russia: A revised oil strategy will focus on maximizing earnings from crude exports before hitting peak production in 2027-2029 and seeing world demand drop. The revised plan is in a draft document on energy sector development up to 2035 being reviewed by the State Duma. “The main Idea is the monetization of current oil and gas reserves and resources,” Pavel Zavalny, head of the Duma’s energy committee, said at the plan’s presentation. “Everything that can be produced should be produced while there is still demand to sell it,” he added.
https://energybulletin.org/the-energy-bulletin-weekly-19-april-2021/
Interesting to extrapolate this mentality of producing everything you can while it can still be monetized. If more producers start embracing this credo it could mean wild swings in oil prices as production remains high during low demand/recessions over this decade as everyone tries to cash in before the bottom falls out. OPEC essentially becomes defunct and the regulatory mechanism for oil prices is removed. I remember reading way back, it was either Matt Simmons or Deffeyes, who suggested that as oil peaks prices will grow increasingly volatile as positive feedback loops drive high prices higher (from political instability, rapid depletion of overtaxed fields, etc) and low prices lower (from recession-induced demand collapse).
A little late to comment maybe, but my experience with Russians is that their top scientists/performers can be at least on par with the “west”. And the bulk of Russians may be more satisfied with poor performance and just milking the system. If the Russians get their mind to it, it I think they can both increase the oil/gas recovery in “forgotten” fields and also be more focused on green energy and materials (hydro/wood being most important initially). It has to do with incentives; oil/gas prices high enough and authorities pushing green energy, and it will happen. Simple as that.
Terrific post. Thanks Ron. I like the candidness of the Russians on important issues. Far more realistic than EIA et al elevation of “wishful thinking” to the status of “data”.
I sort of wondered if it wasn’t Russia trying to talk up the price of oil with a pessimistic prediction.
Ovi,
Can you show the EIA GOM oil production projection out through the end of 2022.
thanks
Here it is in Million barrels per day. Notice it is not zero-based but starts at 1 million barrels per day.
SOUTHLAGEO
I would have done that with pleasure. Looks like Ron has filled in
SOUTHLAGEO
I just realized that I should be doing that when I publish the monthly US data. Look for it in the next post.
Thanks Ron,
I suspect the increase in late 2022 is due to Vito and Mad Dog 2 coming on line, both with new facilities. There probably will be some tiebacks coming on line as well, but those will just help keep production flat.
Energy Reserves-
Oil Reserves denote the amount of crude oil that can be technically recovered at a cost that is financially feasible at the present price of oil.
The present price of oil is in part determined by demand, and demand can thus clearly affect the Reserve level. With a falling price in the setting of lower demand lowering reserves, and vis-versa.
What could cut oil demand?-
1-a falling population (not happening-the world is adding a billion more people by 2035),
2-a decline in economic activity (depression),
3-or replacement by some other form of energy- And I will be addressing this here.
An energy source cheaper than oil is already here, in 2020, and replacement of fossil fuels is in the early stages and gathering momentum quickly. In large swaths of the world solar energy is cheaper than oil energy. This is a new phenomenon, and most people have not yet realized the magnitude and implications of this information.
Clearly solar does have a few challenges that will slow its adoption in transportation- that being intermittency, form, and global vehicle stock inertia. Intermittency is big problem that will prevent a 100% replacement of oil by solar, at least in the next couple decades. Form- Solar energy is electric, and that form requires electric motors and batteries for vehicle use. And inertia- it takes time to adopt a new technology once it has emerged as a better technique/equipment. To this point, I suspect that combustion-only vehicles will only make a small percent of new vehicles sales by 2030, but it will take a long time to retire the current fleet of combustion-only vehicles throughout the world. Discussions on each of three factors could fill volumes. I’ll not get into the details here.
Back to the idea of energy reserves- A report on solar energy indicates that global reserves were close to zero percent at year 2015, meaning that the percent of technically available solar energy that was also financially viable was close to 0%.
But year 2015 (roughly) was an inflection point. As a result of the inexorable and dramatic drop in Photovoltaic [PV] cost over the past decade, by 2020 it is now estimated that about 60% of the technically feasible global solar energy capacity is now also financially feasible!!! And what is now 60% feasibilty is projected to be 90% by 2025 (based on the gradual fall in PV cost). And if that does not shock you, you simply do not understand the truly vast size of the global PV reserve. This PV resource that is now ‘reserve’ status makes the oil reserves of all the middle eastern countries look small!
“The world’s largest oilfield, Ghawar in Saudi Arabia, which occupies 8,400 square kilometers, produces the equivalent of 0.9 PWh each year. Building solar panels over the same area would generate 1.6 PWh/yr.” And solar is not a depleting resource.
Globally, current energy consumption is 65 PWh/yr [Peta Watt hours]. As of 2020 the global solar energy reserve is estimated at about 3600 PWh/yr, and by 2030 the reserve growth indicates a global total of over 5500 PWh/yr.
The major point here is that there is a massive untapped energy resource that has now achieved reserve status- ready to be tapped. That is the key. How quickly will it be tapped? If PV is deployed rapidly, it has the capacity to significantly replace oil in transportation, as well as most other forms of energy use. This hinges on the manufacturing capacity of the world industrial base for components of EV vehicles (batteries and electric motors), and for PV panel production.
Will bottlenecks arise that limit the deployment of PV or electric vehicles, be they industrial, political or in the form of limited capital? I suspect so, but the impact on energy supply and on oil demand will be massive, nonetheless. This is on a scale that can serve to gradually reduce oil demand over the next 10-15 years, and much more so thereafter. This relation is demonstrated on Fig 7 of the report linked below.
Will this transition be quick enough offset fossil fuel depletion? I guess not, and if not the price of petrol will increase. This petrol price increase will only further underline the cost advantage of electric vehicle transportation/mile in the minds of drivers and business operators across the globe. Other scenarios are possible, but I consider this one most likely.
There are big ramifications of this huge solar energy (and secondarily wind energy) reserve, other than the effect on fossil fuel demand, and transportation. There will be a geopolitical shuffle based which countries will have the new ability for energy independence, and on the other hand those who will lose fossil fuel export income. And at a local level across much of the world families, communities and small businesses will have the ability to generate their own energy. The implications are bigger than most of us have yet to imagine.
Much of this information is derived from a report just out- “Solar and wind can meet world energy demand 100 times over 23 April 2021
Here is a summary link- https://carbontracker.org/solar-and-wind-can-meet-world-energy-demand-100-times-over-renewables/
I strongly recommending the download of the full report for those who would like to consider these ideas with more information under their belt.
btw- I had some uncertainty about which side to post this on, but the impact on oil demand is a big deal, especially in the next decade. So here it is.
Thanks Hickory,
Probably would have been better in non-petrol thread because the oil producers prefer to focus on supply rather than demand. A post on this might be good.
Your comment was a nice summary. Thanks.
HICKORY
I totally disagree with this statement, which is very commonly made by too many.
” I suspect that combustion-only vehicles will only make a small percent of new vehicles sales by 2030, but it will take a long time to retire the current fleet of combustion-only vehicles throughout the world. ”
Last week Honda said that by 2030. they were expecting their vehicles sales to be 40% EVs. While I certainly respect their decision, which is less ambitious and more conservative than other auto manufacturers, let’s just do a quick and simple calculation to see what this really means.
US EV sales, BEVs plus PHEVs, in 2020 were close to 2%. So how much of a yearly rate increase in sales do we need to get to 40% in 10 years. How about 2*(1.3493^10) = 40. So EV sales have to increase at the rate of a shade less than 35% each year to get to 40% by 2030. Recent trends have been closer to 10% and slowing.
I think 40% by 2040 is more realistic. That would only take a 16% annual increase to get to 40% and even that may be a stretch.
Ovi,
For Global plugin light vehicle statistics (plugin hybrids+ EVs) see
https://www.statista.com/statistics/665774/global-sales-of-plug-in-light-vehicles/
If we do a trendline on natural log of statistics from 2014 to 2020 (2014=321 million), we get 37%, in 2020 the increase was about 43%. My EV transition model has 37% of light vehicles sales (assumed at 75 million for total global light vehicle sales) in 2030. The entire light vehicle ICE fleet is replaced by 2056 and we reach 50% of all vehicles as plugins by 2042 (I assume most vehicles are off road after 15 years). Note that for vehicle miles travelled, newer vehicles tend to be driven more so the fleet in 2042 would have 46% of vehicles that are 8 years old or younger and these vehicles would probably drive 80% of total vehicle miles, of that 46%, 68% would be plugins and they would cover 54% of miles driven. The transition for heavy transport vehicles may be quicker as costs shift to make EVs cheaper.
Chart below has supply vs demand for my scenario, I assume non-land transport oil demand is constant in this model as a simplification.
Dennis-
assuming growth rate of plug-in vehicles over the next decades based on the trendline from the last 5 years will result in vast underestimation of the growth in this decade, I think.
The growth is just starting, the shift will be abrupt. The transport cost advantage to the customer will be clear.
Just look at all the N.American vehicle manufacturing lines. All the new action has batteries/electric motors as part of the powertrain.
It will be a quick change. Mid decade.
“Ford committed today that by mid-2026, 100 percent of Ford’s passenger vehicle range in Europe will be zero-emissions capable, all-electric or plug-in hybrid, and will be completely all-electric by 2030”
This is not just limited to Ford, or to Europe.
Consider these projections
-IHS Markit forecasts global EV sales to rise by 70% in 2021
-In 2025, global sales will top 12.2 million, indicating annual growth of nearly 52% (compounded), IHS Markit said in its December forecast.
https://ihsmarkit.com/research-analysis/ihs-markit-forecasts-global-ev-sales-to-rise-by-70-percent.html
Hickory,
My model is pretty close to that for 2025, I have 11.9 million and in 2030, 28.2 million, in 2035, 39.6 million, and in 2040, 55.5 million. My expectation is that the growth rate in sales will slow down to 7% in 2031 and remain at that growth rate. The scenario may be too conservative, it is what I call realistic. I doubt the 35% rate of growth can be sustained for very long as there will be bottlenecks in battery manufacture. Also the plugin hybrids may prove to be more expensive than BEV as the price of batteries falls. A more aggressive growth assumption could be made, but my guess is that will be too optimistic.
A quicker ramp in sales might see oil demand fall below supply in 2030.
Note that in my model I estimate non land transport fossil fuel use at about 31 Mb/d vs total C+C demand of 86 Mb/d. For simplicity I assume no change in demand for oil for non-land transport use (farms, air and water transport, etc) from 2025 to 2078 (end of model).
Dennis,
How do you model non-transport oil consumption?
Nick,
I don’t really. I estimate total fuel consumption for light and heavy vehicles (road only) worldwide in 2018, then I simply assume the non-land transport demand for C+C (for farm equipment, water transport, air transport, and everything else that isn’t for road vehicles (heavy trucks, buses, motorcycles, and light vehicles). I simply assume that quantity remains fixed (greater need for miles travelled by air and water matched by less fuel use due to efficiency improvements so the two factors exactly offset).
Essentially it is just a simplifying assumption.
Dennis,
So you’re assuming that global land transport oil consumption (excluding farm, rail, buses, heavy off-road trucks, motorcycles, chainsaws, etc) is 55 Mb/d, or 64% of all C&C? That seems a little high. How did you estimate that?
Nick,
I used US data for average fuel economy for heavy trucks and light vehicles, then I used a 1300 million global fleet size, assumed average miles driven was about 10k per year, did something similar for commercial (heavy truck) fleet globally. It is a rough estimate, BP has gasoline and diesel consumption for World at 52 Mb/d in 2019, I assume most of that is for light vehicles and heavy trucks, not sure how much is used in ships (I assumed they mostly use fuel oil/bunker/residual fuel).
Also see figure 2 on page 6 of EIA document below, 55 Mboe/d in 2020 looks about right, and they estimate about 57 Mboe/d in 2025, my estimate is about 56 Mboe/d, with decreases starting in 2028.
The model is no doubt imperfect and does not account for the drop in demand in 2020 due to pandemic (the model was done in 2019 before the pandemic).
https://www.eia.gov/analysis/studies/transportation/scenarios/pdf/globaltransportation.pdf
Thanks.
It’s interesting how quickly this 2017 study has become out of date:
“ The combined share of electric and plug-in hybrid electric vehicles in OECD countries increases from less than 1% in 2015 to 10% in 2040. In non-OECD countries, diesel, natural gas, and electric and plug-in hybrid electric vehicles experience a three-to-five percentage point increase in the total share of LDVs sold in non-OECD countries. In 2040, diesel and natural gas vehicles each represent approximately 11.5% of the total LDV new sales market in non-OECD countries, and electric and plug-in hybrid electric vehicles combined represent 4.5%.”
They thought EVs would be about 10% in 2040, while diesel and NG vehicles would each be about 11.5%. Based on how quickly car makers are abandoning diesel and NG and adopting EVs, I’d say EVs will take pretty much all of the 23% projected for diesel and NG and, of course, much more.
Dennis,
I know that you are EV enthusiast, and even own Tesla, but still we need to be realistic.
For heavy trucks transporting goods over long distances the switch to EV is very problematic and might never happen. The switch to natural gas is a possibility but this is an expensive solution. For local trucks the problem is the cost of the battery and it might happen but very slowly, as gradual displacement due to high gas prices. Even in this case natural gas will eat lithium.
Three large users of fuel that you did not account are military, airplanes and agricultural machinery. In the USA we also need to add trains as the level of electrification of railroads leaves much to be desired.
Those three categories of consumers of fuel are not switching to EV in foreseeable future. If you account for the growth of population the demand actually might increase until the price of fuel will come into play.
Globally Africa, China, India (and Asia in general), xUSSR space very rapidly add personal cars so those areas will experience growth of fuel demand. And cars in those regions often run for 15-20 years not 12 like in the USA. .
And that will affect African producers and, especially Russia. So when talking about Russia it is important to understand that the internal consumption will grow (Russia adds around 1.5 million cars a year) and that will cut exports https://knoema.com/atlas/Russian-Federation/Primary-energy-consumption although many Russian cars are running of natural gas as it is cheaper.
https://carsalesbase.com/russia-car-sales-data/
The number of cars per capita in Russia still is twice less than in the USA and this gap will gradually diminish. https://en.wikipedia.org/wiki/List_of_countries_by_vehicles_per_capita
The initial fascination with EV as passenger cars will soon pass as outside places like California with no winter they are very problematic during winter periods. I would say they are dangerous.
Currently they are kind of status symbol in certain circles and IMHO represent “conspicuous consumption.” Conspicuous consumption is a term coined by American economist and sociologist Thorstein Veblen.
I wonder whether Tesla stock will be able to sustain the current crazy valuation in three-five years period.
Likebez- “The initial fascination with EV as passenger cars will soon pass as outside places like California with no winter they are very problematic during winter periods. I would say they are dangerous. ”
People will look back at statements like this and wonder- was this said seriously or in jest? Speaking of winter, is any country more quickly adopting PHEV/EVs than Norway?
And data in Germany for march sales shows just over 20% were EV/PHEV’s.
Likbez,
The model is for land transport only, I think EVs will become viable for long haul transport, trains can be electrified, and certainly short haul trucking would work for EVs.
As to farm, military, air and water transport, I made the simple assumption that demand would be flat as higher demand is offset by better efficiency, the assumption may well be incorrect, it was just a simplifying assumption as the focus was EVs.
I live in a cold part of the US, far northern New England, if one wears a bikini in their Tesla in the winter, it could be dangerous. It would also be dangerous to go outside where I live in winter when not dressed properly. I dress warmly in winter as I have common sense (which seems to be uncommon).
I have heard that it is cold in Norway as well, though I have never visited, my understanding is that there are many EVs sold there.
Time will tell if EVs sell well, for the 2014 -2020 period the average rate of sales growth for new plugin vehicles (plugin hybrids and BEVs) was about 37%/ year globally.
Hickory,
Here is a transition scenario that assumes the 37% growth rate in plug in sales continues, personally I think this is too optimistic, sales for light vehicles is 100% plugin by 2031 and the ICE light vehicle fleet is replaced 100% by 2044 with plugin vehicles. Interesting that you believe this is pessimistic. Also interesting that Ovi believes my original EV scenario is too optimistic, I seem to be somewhere between your optimism and the pessimism of Ovi. It will be interesting to watch (and I hope you are right).
We shall see. It seems to me that at a certain point, there is going to be a very rapid realization that we are in new territory. Most of the manufacturers now get it, and are scrambling to react.
It will be very interesting to see if there is a component supply crunch ( I think likely) in the late decade.
A big piece of the unknown on this this is the general state of the world economy.
If there is stability and resumed growth after pandemic, the transition to plugin vehicles will be quicker.
If there is economic stagnation/contraction- it will be much slower as people hold on to what they’ve got.
And of course, the price oil will play a leading role in the incentive/disincentive equation.
I also think it is important to acknowledge that we are talking about percent of new sales, but not the absolute magnitude of sales. That may be more important. Vehicles last so much longer now, and if petrol is available at reasonable price, the best bet for most people financially will be to milk their current vehicle for as long as possible. But after that, the next one will probably have a plug.
At some point people will stop buying ICE vehicles even if no EV option is available. Operating a gas station, especially in an urban environment, is a low margin, high regulation enterprise. As gas stations in urban areas either go out of business or give up on selling gas, gas cars will lose most of their appeal for urban and suburban residents because of “range anxiety” – i.e. not enough places to fill up. I would guess that at about 20-30% EV saturation, selling gas will no longer become profitable in any given area. This will add to the spiral of concerns about resale value for ICE cars as the inevitability of the EV transition becomes ever more apparent.
This kind of action is hard to predict from past performance, but get used to these kind of news items-
Germany March 2021
“The number of new passenger plug-in car registrations increased to 65,681 (up 232% year-over-year), which is 22.5% of the total [new car]market. That’s more than one in five new cars!”
Dennis
To me the EV market is bifurcated. From what I can see there are four concentrated EV markets in the world.
– California due to its history with car pollution.
– Norway using its massive oil revenues to heavily subsidize EVs along wth other perks.
– China with their heavy EV sales mandate and getting away from its achilles heal, oil.
– Japan also wants to reduce dependence on oil.
Looking at what is happening in two US states provides some insight on how fast the EV take up will occur in the US. California with a population of 39.5 M sold 133,000 EVs in 2020 or put another way 3,360 EVs per million population. New York with a population of 19.45 M sold 21,000 EVs in 2020 or 1,080 EVs per million population. That is a ratio of three to one. it would be a lot higher in other states.
Total US 2020 sales were 296,000. California accounts for 45% of US sales.
My point is that these 4 concentrated regions are not representative of the rest of the world. The only region that will continue to grow at a significant pace will be China with its sales mandate and I think with an eye to becoming a world leader in EV design. EVs are coming, no doubt, but at a pace that is slower than most prognosticators are forecasting, primarily because of cost.
Ovi,
If you happen to have the time, it would be helpful to find the numbers for those 4 areas. Then you could chart those 4 as well as “rest of world”, and we’d see what you’re talking about…
Ovi,
Europe as a whole saw strong growth in 2020. Prices for EVs will fall and there will be many more choices in the future. There will no doubt be rises and falls in the rate of growth, but the global numbers are what matters in my view. The rate of growth in plugin sales has been 37% from 2014 to 2020 (average rate). I expect that rate of growth will gradually fall to 10 or 15%. This is a lower rate than some predict. It is possible the rate will stabilize at 20 or 25% growth rates, hard to say.
Hello Dennis,
here’s a useful link from carwow about electric cars , real life? close, but interesting on EV advances and what we have to date .
https://www.youtube.com/results?search_query=carwow+electric+car+range+test
forbin
Forbin,
Interesting thanks.
Ovi-
It’s hard to predict whether new products will be successful. On the one side, you have people who say “They didn’t sell in the past so they won’t sell in the future”, and on the other hand you have optimists who say the the superior technology will win out in the end.
There is a classic marketing book about this call “Crossing the Chasm”. Briefly, it says you should never expect a new product to be a mainstream hit, no matter how fast its uptake is growing. New products enter the market through niches called “early adopters”.
In my view the
Your niches are all geographical, but there are other ways of carving up the market:
Luxury cars: Tesla followed the playbook by targeting rich people with the Roadster, which is an impractical toy, instead of trying to create an EV for penny pinchers. Now nearly all luxury carmakers are switching to EV only.
Taxis: Taxis drove Prius sales, because they save fuel costs. They are also early adopters of EVs.
Delivery vans: Diesel is expensive and noisy, and with increased traffic in residential areas, EVs are in big demand. Here in Germany the mail has been by electric bike for years, and larger delivery vans are also getting more common.
Mining vehicles: This isn’t really new or big, but an interesting indicator of possible future trends.
Municipal vehicles: Garbage trucks, buses, etc. You see these more and more often here in Europe. This is especially true of the small vehicles that scoot around pedestrian zones. Last year I saw someone in Annecy, France delivering baguettes in the pedestrian zone on a two wheeled electric scooter with fat tires towing a trailer. You don’t want diesel in a crowded area.
Vehicles in airports and other large facilities like military bases.
City cars: Not a market in North America, due to poor city design, but a big market, especially in crowded Asian cities. The best selling EV worldwide is the Wuling Hongguang, a tiny EV from China.
Also it’s worth mentioning that China is the world’s largest car market so it is more than just a niche.
In addition, the baguette story points to another shift: away from Cars As We Know Them. In rich countries retirees are likely to move to retirement communities and drive around in golf carts. Household sizes continue to decline, making suburbs less practical. Cities like NYC are increasingly building electric bike infrastructure. And so on.
It’s not all linear Dennis.
https://www.businessinsider.com/electric-car-owners-switching-gas-charging-a-hassle-study-2021-4?amp&r=US&IR=T&__twitter_impression=true
Lightout , now that you mention linear I like to point out ” A linear decline in a critical input has unintended consequences in non-linear outputs ” .
The model is nonlinear with gradually slowing rates of growth in sales of plugin vehicles.
Dennis , my comment was not in relation to your post . This is a general observation that we seem to ignore . Why ? Covid in India is a disaster , but what is the non linear effect . First 20 million students have missed their high school and University exams for 2020 and 2021 . Second and more disturbing , the poor in India send their children to school not so much for education but for the free mid day meal scheme . It is now 2 years since schools are closed . This means that another 20 million children are going to be malnourished . I can take a bet that this crisis will continue thru 2022 . Now try to imagine what the scale of a linear to non linear is . Oil is a critical input and it is in decline ( past peak ) , look out for non linear impacts example unemployment just as a starter .
lightsout,
Without a level 2 charger at home, EVs don’t really work. I have one in my garage about 300 bucks to have the 240 V, 40 amp outlet installed by a professional, but probably could have done the job myself for $100 (assuming my time to do the job is paid at 0 per hour). For those renting an apartment or with street parking, EVs would be very inconvenient.
The Tesla superchargers typically only require 10 to 20 minutes, charging at the bottom half of the battery from 10% to 70% tends to be the quickest way to go as the top 30% of the battery capacity requires the supercharger to reduce power to protect the battery life, this is not a problem for level 2 chargers which use the same charging rate from 5% to 95% of battery capacity, my level 2 charges at 29 miles of range per hour, but a better home charging setup could increase ti rate to 36 miles per hour. typically I need no more than 240 miles overnight, so 29 miles per hour does the job. A 120 V, 15 amp circuit only produces 4 miles of range per hour, so 60 hours for 240 miles of range, not really practical.
Thats kind of true Dennis,
but from personal experience I can attest to the fact that a simple 120v outlet can fully charge the battery of a plugin hybrid vehicle within 8 hours (11p-7a), and give you 32 miles of electric range.
I did easily a hundred times in the past 3 years, and over 75% of our miles have been electric rather than petrol.
The vehicle has a 16 kWhr battery [and a a 287-hp 3.6-liter V-6 engine that serves as backup once the battery is discharged].
In reality, only 12 kWhr are used since the vehicle has battery software management preventing full charge/discharge to optimize battery life. All the good vehicles with batteries do this I believe [I know yours does].
Hickory,
That works for a plugin hybrid as you are not limited to 32 miles. For a BEV owner that needs to travel more than 48 miles per day a level 1 charge does not cut it.
Ovi-
We see it differently.
If Honda doesn’t ramp up its plug-in vehicle offering much more rapidly, they will be left with little market share.
They are getting started at this transition much too late.
They were hoping to wait for a big battery breakthrough (such as solid state) before committing their resources. I understand that gamble, but its teetering on being a losing bet.
They better get at it.
Honda doesn’t currently have a single battery-electric model in its North American lineup,…”
The demand for plug-in vehicles/batteries will be huge later in this decade. Questionable whether the manufacturers will be able to keep up. Its a race to develop the capacity.
Like you said above- timing is a big deal.
They were hoping to wait for a big battery breakthrough
People have been waiting for quite a while—
Lithium ion was first commercialized the the early 1990’s.
I will notice when someone achieves 10% market share.
But I will probably die first.
HICKORY
You may see it differently but the uptake of EVs will be slower than you think. See my answer to Dennis above. What is happening in California and Norway are unique situations. I still think that Honda knows what the US and world market needs, affordable cars. EVs are not there yet. They are coming. At what speed is the $64k question.
Honda and GM have a plan that will us GMs new Ultium battery, still Lithium, but has packaging advantages.
https://www.greencarreports.com/news/1132037_honda-us-ev-plans-solid-state-batteries-later-this-decade-all-evs-by-2040
Ovi,
Prices may come down faster than you believe, at least at Tesla, see
https://www.forbes.com/sites/jamesmorris/2020/09/22/tesla-reveals-plan-to-halve-ev-battery-costs-at-battery-day-2020/?sh=37bed1607f74
Basically Tesla plans to reduce battery costs by half in 3 years, in reality it may take 5 years, but that will lead to pretty cheap EVs by 2025.
At that point we may see adoption accelerate or at least maintain the 37% rate of sales growth we have seen to date.
Didn’t GM say they expected their new batteries to reduce costs pretty sharply?
Another interesting question is the political viability of oil consumption. I think it was that Shallow Sand who compared oil to tobacco.
Germany’s next Chancellor may well be a Green. The Greens are now the strongest political force in the country. Europe seems less and less inclined to import oil. The last time they were in government they tried and failed to raise fuel prices to €5 a liter, about $20 a gallon. The massive pressure on European cities to reduce air pollution has relaxed a little, thanks to Covid, but it should return soon.
China is now the world’s premier importer, mostly thanks to low domestic prices, but the country is not fond of foreign imports. Coal imports continue to increase however, despite squabbles with Australia, so maybe the government is resigned to importing consumables. It just doesn’t seem very “typically Chinese” to me.
And America may even get around to raising taxes on oil, which the government has been delaying for thirty years or so. 70 years of misguided land use policies won’t disappear overnight though.
So none of this is cut and dried, but who knows which way the political winds will blow in the coming decade. Considering the car industry’s huge current investments in EVs, I expect a lot of pressure to support EV sales. A lot depends on political leadership, which seems to be swinging from populism to technocracy just now.
This doesn’t tell us anything new. We already know solar can meet ALL energy demand easily if we just, well, plaster 200×200 km of PV cells in the Sahara, or something. The efficiency and cost of cells have improved too, although they are also privy to subsidies every bit as much as fossil fuels. And yet, all renewables amount to practically nothing in the grand scheme of things. And fossil fuels continue to grow, with coal usage growing in the US for the first time since 2013. Carbon emissions have rebounded so fast this year from the lull of 2020, that Fatih Birol is aghast. Talk is cheap, and no nation has any real roadmap to coming off fossil fuels entirely. Hell, none are even meeting the paltry targets the IPCC have set, relying instead on magic to meet those targets. I suppose one day we’ll just get to net zero by dint of a deity taking pity on our woeful attempt to wean off cheap fossil energy.
And then we move to solar utopia. But then you look at Germany and Spain or California, and remember that this is all the rather fanciful notions of lobbies in an industry priding itself on not directly emitting carbon (oh, but they do still emit it). And people go along with this, thinking it will save the world and keep happy motoring going. About that: https://www.nature.com/articles/s41560-021-00814-9
Personally, I hope the whole endeavour fails, given it is now grossly apparent that this is about saving the system that caused climate change to be a thing in the first place. Which, incidentally, is a byproduct, not the problem. CO2 affecting our atmosphere isn’t your enemy. Promoting ever growing industrial civilisation is. Strange how that’s never brought up in any of this. Hold that thought, the 2022 EV line up from Audi has just been announced and my wallet is ready.
But that doesn’t help stock values for green tech companies nor placate the middle-classes wanting to continue living as they are now.
The sheer amount of embodied carbon and energy just needed to build out all this renewable capacity is mind boggling. Yeah, the sun isn’t a depletable source of energy on any meaningful timescale. But guess what does fail after time? Can’t wait for millions of tonnes of PV cell waste to start entering our e-waste system.
Kleiber —
You wildly underestimate the size of the Sahara, and the power of the sun.
Maybe plastering one percentage of the Sahara would be enough.
As to the power of the sun, consider the following: The sky is insanely cold, about 2° Kelvin, a temperature almost impossible to attain in a lab. The sun is about 1/10000 of the area of the sky. And yet it can turn a cool dawn into a unbearable midday heat in just a few hours.
Imagine a man living in a one story building on a 100 acre farm. He air-conditions with fossil fuels. He can’t imagine that solar could replace fossil fuel, even though the sun heats his whole farm every morning. How many acres of floor space does his house have? How high are the ceilings? How much coal would it take to heat or cool a five acre house with 100 foot ceilings? Is his house smaller than that? What about his farm?
The idea that fossil fuel output can come anywhere close to competing with solar is dirt stupid. Even an oil field, with its massive output of fossil fuel, probably dumps more solar energy (mostly converted to heat) into space than it exports chemical energy in the form of oil.
Ovi. Thanks for the post.
Have you ever looked at a historical chart of corn prices and oil prices.
Corn and other grain prices continue to rise.
SS
No I haven’t. However I have heard on CNBC that commodities are on the rise, both metals and grains. The speaker thought that WTI had plateaued.
Is there a connection with WTI going up and corn. Is it world demand for corn that is driving it.
In modern agriculture the amount of corn produced strongly correlates with amount of fuel consumed. because all machinery involved consume fuel.
Some people think it is money creation. That would be the reason for the surge in the price of cryptocurrencies. See: https://wallstreetonparade.com/2021/03/senator-ossoff-drops-a-bombshell-the-12-or-13-largest-banks-got-the-trillions-from-the-feds-repo-loans-last-year/?link_id=17&can_id=4b031caa6645ded8bb36f9782aa2a5c4&source=email-newsletter-you-may-disagree-but&email_referrer=email_1139995&email_subject=newsletter-you-may-disagree-but
Tim Watkins wrote something very interesting about this topic here:
https://consciousnessofsheep.co.uk/2021/04/22/a-dangerous-misunderstanding/
Mr Shellman has it correct .
https://www.oilystuffblog.com/single-post/decline-baby-decline?postId=607d9b8fae97f80015baa566
Hole in head,
He is right that it doesn’t work at $55/b, at $61 (today’s price for WTI) it works in the Permian basin. Note that I also use the data from shaleprofile as the basis for my models. Though I clearly don’t know the oil business as well as an old pro like Mike, not even close.
The average price of oil in 2020 was about $36/b, in 2021 it will be about $60/b and in 2022 about $70/b (WTI prices). Decline will stop at $70/b for sure and probably at $60/b.
Note that in 2017 the average WTI price was about $52/b, and in 2018 it was $67/b, and in 2019 it was $60/b. 2018 saw a very large increase in tight oil output and the increase in 2019 was pretty big as well.
My Permian model assumes new wells are financed from cash flow rather than new debt, debt paid back in full by 2026.
Dennis,
Your observations are correct with the implicit assumption that extraction costs do not rise at the same rate as the price of oil. Shallow Sand has remarked that in the 1990s $20/barrel was considered a good price but today most wells, either onshore or off, are not profitable at $50/barrel. Shallow is our invaluable guide to the evolution of costs in the oil patch.
My prediction is that oil prices will stay in the current range ~$55-$65/ barrel until decreased investment (see http://peakoilbarrel.com/december-non-opec-oil-output-continues-rebound-from-may-low/#comment-715646 ) results in a shortage. I believe the shortage will cause oil prices to kick on the order of 50% in a year. The price kick will then provoke a financial crisis similar to that of 2008, but central banks will have far fewer options to alleviate the crisis.
Schinzy , I agree with you . Dennis is underestimating a few critical issues ;
1. End of OPM finance .
2. Underestimating the GOR and WOR rise .
3. Underestimating decline rates in shale .
4. Underestimating the rise in costs now ( steel above by 50% in 2021) which makes $ 75 non viable .
5 . His contention that the big corporations will buy out the bankrupt corporations . The flaw is that the big corporations themselves want to exit . Further as Mike S has pointed out ” who wants to buy wells which are at the tail end of their production and are going to have a shutdown expense of $ 100000 to bear ” .
All three agree that there is going to be shortage in 2022 sometime in the second or third half and your scenario that the resultant high price will provoke an even deeper financial crisis than that exists now will play out . Let me add that Covid damage cannot be assessed at this stage as the virus is mutating at a rapid pace . It has moved from India to Pakistan.
https://www.rt.com/news/522199-pakistan-military-coronavirus-khan/
P.S : He always give’s EOG as an example of a well run shale play but ” one swallow does not the summer make ” . For every one EOG there are 10/15 waiting in line for bankruptcy .
Hole in head,
If one company can be profitable, then others can as well. The companies that are not profitable will fail.
I have taken decline rates, lack of OPM into account. Prices averaged 110 per barr in 2020$ for several years from 2011 to 2014, with no financial crisis. If oil goes to $150 for 12 months maybe there will be a problem. I think that unlikely in next 10 years.
Dennis , ” If one company can be profitable, then others can as well. The companies that are not profitable will fail.” That is universal truth , so what is new ? It is so in life also .
2021 is not 2011-2014 . Absolutely invalid and invaluable inference . 10 years is a long time . All business , environmental ,political ,financial conditions have changed . Yes , I agree oil will never be $ 150 even in 10 years time , I will extend to 20 years . Schinzy said + 50 % that would put it around +/- $ 90 . Possible, but as he summarized this will lead to a financial crisis . I agree with his viewpoint .
If one company can be profitable, then others can as well.
While that is obviously true, it is also a non-sequitur. Obviously, you meant that to imply: “Because one company can be profitable, this means others can be profitable also”. And that statement Dennis is obviously not true. Because one company can make a profit, it does not follow that other companies can make a profit also.
Even if they are in the same business, like the shale oil business, one company can have very good acreage while others may have only very poor acreage. Therefore because the company with good acreage can make a profit has no bearing whatsoever on the fortunes of other companies with bad acreage. Of course, there are other reasons that one company may be profitable and another not profitable.
No two companies ever have the same circumstances as to profitability.
Ron,
Of course no two companies are the same, some tight oil companies are profitable, others are not and there are a multitude of reasons. The companies that are not profitable over the long term will fail, that will leave the profitable companies as survivors.
My guess would be the profitable companies would have the knowledge needed to forego areas with poor prospects and only lease tracts in areas where more productive wells have been drilled. That expertise and better operational expertise will gove the better companies an advantage and they will be more likely to continue to be profitable and to expand their operations on acres that have a higher likelihood of yielding higher output and profits per dollar invested.
Schinzy,
Capital costs per barrel produced have been decreasing in most tight oil plays from 2015 to 2019 (due to wells that are optimized as knowledge increases), I assume these costs increase starting in Jan 2020. Also note that shallow sand mostly thinks in nominal terms, I am using inflation adjusted dollars (so these are real costs, not nominal costs). The nominal cost of the wells will increase at 2.5% per year (if the annual inflation rate is 2.5%/year).
I don’t see how these wells can be profitably operated by a company with a lot of overhead, which I assume these publicly traded companies have.
Shallow sand,
See
https://finance.yahoo.com/quote/EOG/financials?p=EOG
From 2017 to 2019 EOG’s cumulative net income was $8.7 billion.
It can be done by a well run company.
Dennis.
I have discussed before the uselessness of GAAP accounting in US shale.
Raw Energy, who writes articles on Seeking Alpha, has addressed this much better than I can.
Over 3,000 of the approximately 19,000 oil wells in ND produced 0 barrels of oil in the last reported month, 2/21. Some of this could be weather related. I suspect more of the problem is economic, even at improved oil prices.
I suspect the numbers are similar in the other shale basins. Mike says there are many inactive shale wells in EFS, where he operates his conventional production.
Shallow sand,
What basis would you use to judge the viability of a tight oil producer?
I chose EOG because tight oil is their focus and they seem to have very good average well profiles (high EUR). It seems to me it would be difficult to accomplish accounting tricks over a 3 year period.
If oil supply is plentiful and oil prices are low (under $60/b) tight oil will not be viable, at higher prices (above 70/b) it is likely to be viable in the Permian basin.
My tight oil scenario for US tight with Permian and non-Permian tight shown, assumes oil prices rise to $75/b in 2020$, but no higher, and fall after 2040. And of course we don’t know future oil prices, but I think they will be higher than today’s price in the future.
Dennis.
EOG is at the top of the heap re shale producers.
For the years 2015-2020, EOG annual earnings per share average just $0.63 per share. Three of the six years were annual losses. They claim those have a lot of “one time charges.” Those are real losses, as we have discussed here before.
Further, I argue there are more write downs to be taken due to exaggerated EUR which has resulted in understatement of unit cost depletion.
GAAP gives an accurate picture if A) one adds several years of earnings together and B) unit cost depletion is not being understated.
These low volume shale wells will work at much higher oil prices. But at $55 wellhead prices, the oil revenue on a 25 BOPD well with a .75 NRI is $375K. LOE G & A severance will be from $100-$150k annually. Repair of a downhole failure can run anywhere from $25-over $100k. So, there is little money left to service debt principal, interest and pay dividends. At least IMO.
Shallow sand,
Earnings were positive over 6 years. Yes 2015, 2016, and 2020 were years with low oil prices and I agree nobody makes much money in that environment.
I also agree it does not work at 55/b, but it does at 60. You mentioned corn prices, if oil follows corn as it often does( I assume your observation is correct), what oil price is implied.
shallow sand,
When I do a breakeven analysis on the average 2018 Permian well (EUR=371 kbo at 177 months, output 10 bo/d at shutin) the well pays out at 55 months assuming 10.5 million well cost in 2019$ and a WTI oil price of $55/bo. If we assume nominal annual discount rate of 10%, the discounted net revenue is equal to well cost of 10.5 million at 90 months. I also assume NGL is extracted from the NG stream and sold at $15/b (I use Texas and New Mexico average rates of NGL per MCF NG to estimate NGL from produced NG. I do an average well profile for Permian basin using shale profile data and assume NG is sold at $1.25/MCF at well head. Average well produces 1695 MMCF cumulative over the 14.75 year life of the well, or 292 kboe (assuming 5.8 MCF/boe), cumulative barrels of NGL over the life of the well are 128.6 kb.
This is why I think it works. Note the low price I use for natural gas ($1.50/MCF), the minimum NYMEX 12 month average spot price since 1997 was $1.97/ MMBTU which is approximately $1.97/MCF (depends on wetness of the gas considered). Also the $15/b price for NGL I used is fairly conservative, typical prices are more like $25/b of NGL.
That’s a great post by Mike Shellman
Leonid Fedun predicted the onset of the oil supercycle
April 26 / 14:09
Moscow. Soon, the world will see a recovery supercycle (stable price growth for a long time) in the oil market. This forecast was announced by Leonid Fedun, vice president and co-owner of LUKOIL, deputy chairman of the climate committee of the Russian Union of Industrialists and Entrepreneurs.
“There is a point of view that the peak of production was in 2019. But our forecast is different, we believe that a so-called recovery supercycle may come. For example, now we see how the demand and prices for cement and metal are growing. the level of more than $ 60 per barrel, so recovery is taking place, “Fedun said in an interview with RBC TV channel.
At the same time, he noted that one should not forget about the restrictions of OPEC +. “Almost 6 million barrels have been taken out of circulation. And about the same amount is in other frozen projects that are frozen for political reasons. These are, for example, Iran, Venezuela, Libya, and, for example, those projects that have been stopped for economic reasons. – this is in Canada and the United States, “Fedun added.
O A ,Mr Fedun is talking his book . There is no super cycle . It is only supply chain problems and cheap money looking for return that is causing price rise across the board . Read here .
https://consciousnessofsheep.co.uk/2021/01/12/seeing-happy-faces-in-the-clouds/
https://www.zerohedge.com/commodities/metal-boom-copper-hits-10-year-high-amid-supply-constraints-and-infrastructure-plans
Thank you. Regarding oil prices, I suppose it is unpredictable as always.
In the world economy, there are incomprehensible processes. Against the background of the pandemic, I expected a drop in demand and prices for goods. But the opposite is happening: prices in the Russian Federation have gone up sharply, there is a shortage of goods. For example, rolled metal has risen in price by 80-100% in 6-8 months. Housing prices in large cities have increased by 40-80%. Food prices have risen by 20-50%. To buy, for example, a 60 hp boat motor (Suzuki, Yamaha), you have to wait 6 months. To understand what is happening, you have to wait. Situation not stable and will continue to change …
O A , inflation is not Russia specific . The reasons I have explained above .
Commodity prices over the last year…
Lumber: +265%
WTI Crude: +210%
Gasoline: +182%
Brent Crude +163%
Heating Oil: +107%
Corn: +84%
Copper: +83%
Soybeans: +72%
Silver: +65%
Sugar: +59%
Cotton: +54%
Platinum: +52%
Natural Gas: +43%
Palladium: +32%
HiH,
Inflation of 210% means that oil prices have more than tripled. Is that what you mean to say?
Nick G , I picked this from another site . I presume he is taking the (-) $37 event as the reference point . In that case it is correct . Very few have info on the spot prices or deals done on a one to one basis and futures pricing is the most used .
Daily Price Brent for April 2020
2020-04-30 18.11$
2020-04-29 17.86$
2020-04-28 15.60$
2020-04-27 15.17$
2020-04-24 15.87$
2020-04-23 15.06$
2020-04-22 13.77$
2020-04-21 9.12$
2020-04-20 17.36$
2020-04-17 19.75$
2020-04-16 18.69$
2020-04-15 19.80$
2020-04-14 21.74$
2020-04-13 20.23$
2020-04-09 20.23$
2020-04-08 25.22$
2020-04-07 22.10$
Average was $18.38 . So 210% is correct .
Well, that says that April of 2020 was unusually low, and isn’t a very useful reference point.
It also reminds us why the US Federal Reserve doesn’t include energy prices in the “core” inflation index it relies on most when it decides on monetary policy: oil prices are very volatile and they don’t tell us much about underlying, general rates of inflation.
In 2019 the World increase in consumer prices was 2.1% according to World Bank
https://data.worldbank.org/indicator/FP.CPI.TOTL.ZG
IMF has a different estimate at 3.5% in 2019 and 3.2% in 2020 for World change in annual average consumer prices. The average rate of inflation (annual increase in consumer prices) from 2009 to 2020 was 3.5%, using IMF data.
Nick , it is an yearly comparison , so the start has to be April 2020 and end has to be April 2021 . If it was $ 18.38 average in April 2020 and $ 62 in April 2021 then so be it . Cannot change . Definitely all the figures in the chart will change as we progress from month to month . It is just a bird’s eye view .
Using commodity prices in the worst month of COVID causes distortions.
Better to use pre-COVID.
Doing that, oil prices are similar to year end, 2019. Most other commodities, however, are much higher than year end, 2019.
HiH, Yes, I understand that this is happening everywhere. But this is a new situation and it is not clear how it will develop.
There is a disparity in prices prevailing earlier.
The world began to change, before the shortage of essential non-renewable goods and the depletion of areas for crops began …
Hole in head,
When an oil company executive says what you want to hear (oil has peaked), then they are experts. When they say something you don’t agree with (oil prices will rise), they are “talking their book.”
Which is it? It is not likely both. 🙂
Dennis , executives/politicians have forked tongues just like their is in Chinese cuisine “sweet and sour chicken ” . They use it their advantage . It is for the listeners/eaters to discern which is which . 🙂
Hole in head,
Maybe everyone is trying to talk up oil prices (or producers at least).
Prices do seem to be headed up. Can you remind us when the WTI is supposed to reach $25/bo (12 month average oil price)?
I have forgotten your prediction, maybe by end of 2021?
Dennis, end of 2025 .
Hole in head,
Thanks.
My best guess remains $75/b, but as a range I would say $65 to 85 per barrel for centered average 12 month price for 2025.
Sweet means containing sugar. Sour means low PH. The two are in no way mutually exclusive. Fruit is usually sweet and sour, although there are exceptions. like avocado.
Your comment prompted me to look it up: it’s a whole world of new stuff.
“Taste receptors in the mouth sense the five taste modalities: sweetness, sourness, saltiness, bitterness, and savoriness (also known as savory or umami).[1][2][6][7] Scientific experiments have demonstrated that these five tastes exist and are distinct from one another. Taste buds are able to distinguish between different tastes through detecting interaction with different molecules or ions.”
https://en.wikipedia.org/wiki/Taste
The EIA’s Monthly Energy Review is out with data through March 2021. Looks like US production is still falling. The March total was 200,000 barrels per day below November production. March total C+C production was 10,968,000 barrels per day.
Ron
I wonder if the MER March number is just confirming the forecasts from the STEO, DPR and LTO or is it an independent assessment.
No, I don’t think so. The numbers for the last several months, and especially the last month, are only an estimate and will definitely be revised as more data comes in. Sometimes the data is revised back several months. But the revisions are seldom very great. The EIA seems to be getting better with their estimates. That is their post-production estimates. Their future production estimates are another matter altogether. 😉
Ron and Ovi,
Here is EIA C+C data with STEO tacked on (Feb 2021-Dec 2022) and the 12 month centered average US C+C output shown.
As I said Dennis, the EIA’s estimate of future oil production is another matter altogether. 😉
If you want my opinion, and you probably don’t, but that projection to the summer of 2022 is a laughing matter. That’s why I put a smiling face at the end of my statement.
Ron,
I agree the EIA STEO is likely optimistic, especially L48 excluding GOM, what is your estimate?
Flat to lower.
Ron,
Thanks. US output averaged 11315 kb/d in 2020, so no higher than that for a 12 month average?
Yes, Dennis, no higher than that. And I think that is a pretty good bet as the current three-month average is already half a million barrels per day below that.
Ron,
I expect US output will be low in 2021 and 2022, but is likely to recover. I will post my expectation in the next post.
Hole in head,
I think oil prices will peak in the next 10 years (from today’s level) at something less than $150/bo in 2020 US$, by 2035 (at latest) we will see falling oil prices due to lack of demand, my best guess is 2032.
Yes things are different now than in 2011-2014. World real GDP is considerably higher in 2020 and by 2025 the IMF predicts World real GDP will be 38% higher than the 2011-2014 average.
Highly unlikely that oil prices 50% above today’s level (Brent=$66/b), so $99/bo will cause a financial crisis.
Let’s say prices average $99/bo in 2019$ in 2025. World real GDP in 2019$ is projected to be 100.7 trillion in 2025. I expect World C+C output will be roughly 85 Mb/d or roughly 31 Gb so World spending on C+C output would be 31 times 99=3.07 trillion dollars, so about 3.05% of World real GDP (roughly equal to World real income). In 2012 average annual Brent price was $124/b in 2019 US$, and output was 76.4 Mb/d or 27.96 Gb, spending on World C+C output was 3.467 trillion in 2019 US$. World real GDP in 2012 was 71.877 trillion in 2019 US$ so spending on crude was 4.82% of World real GDP (income).
So you are certainly correct that things will be different in 2025, in fact Brent prices would need to be $156/b in 2019$ in order for spending on C+C output to be at a similar level to 2012.
In short, I disagree with Schinzy’s analysis, a financial crisis is highly unlikely, if Brent prices rise to $100/b in 2019$, less than a 5% probability in my view. I agree that a sustained (12 months or longer) Brent oil price of $156/bo in 2019 US$ may indeed lead to a financial crisis, but that scenario is also low probability (again roughly 1 in 20 odds) in my view,
A sustained (12 months or longer) oil price of $156 in 2019 US$ would lead to a sharp and relative fast fall in consumption. Industrial/commercial consumers would move aggressively towards greater efficiency and conservation: lower truck and container ship speeds, aerodynamic retrofits, movement to EVs, movements from truck to rail, etc., etc., etc.
Non-transportation oil consumption,which is roughly 30% of overall oil consumption, would also fall sharply: asphalt would be replaced by concrete, plastic packaging would become thinner and be replaced or eliminated, and so on.
Individual consumers would also cut back. Telecommuting, carsharing, movement from SUVs to sedan, from sedans to EVs, etc., etc.
This happened in the past, it would happen again: from 1979 to 1983 high oil prices caused the US to reduce oil consumption by 23%, while GDP rose slightly.
Nick,
I doubt Brent prices will reach an annual average of $156/b in 2019 $ ever. Perhaps 125, but note that the aggressive response you envision (like in 1979-1985) was in response to oil prices increasing by a factor of 2 from 1978 to 1980 and by a factor of 7.6 from 1972 to 1980. Now if we see oil prices rise from $46.5 in 2019 $ in 2016 to 7.6 times higher in 2024 ($353/b), then we might see the response you envision (similar to the 1980s). In the 2011-2014 period (average brent price was $119/b) we saw no such response to an increase in price from $40/b in 2003 to $126/b in 2011, a factor of 2 increase from $65/b to $130/b might see only a mild response, but I believe supply may be adequate through 2030 to keep Brent prices (2019 $) under $110/b and likely (75% probability) at $100/b or less.
Note that I do expect oil consumption Worldwide will drop after 2033, as more consumers transition to electric transport and perhaps some water transport moves to natural gas, nuclear, or some other non-oil source of energy. Air travel might move to synthetic fuel if excess solar power capacity becomes available to utilize as an energy source. I doubt much happens on those fronts prior to 2040 (maybe even 2060).
Dennis, If you see this:
Your comment suggests that demand elasticity is log function of price (e.e., that doubling from different levels might have a similar effect). Professor Hamilton has said that it has a linear function. Have you seen things pointing to the kind of doubling effect you discussed?
Petroleum products supplied is basically the consumption of all petroleum products. It is a pretty good guide to how the economy is fairing. It grows as the population grows. More people consume more petroleum products. Notice that the 2008 banking collapse recession caused a collapse. We had finally recovered when the covid collapse happened. How long will it take to recover from that?
The data is through March 2021 and is in thousand barrels per day.
You might want to start that series in 1970, and put GDP on the same chart. Adjust the axes so that both US oil consumption and US GDP start at the same point, and so the percentage increase from the bottom point to the top point of each axis is the same.
You’ll see that GDP grows faster than oil consumption, and that oil consumption behavior changed in 1979: it dropped and didn’t get back to 1979 levels until recently, and even then not by a lot.
“GDP grows faster than oil consumption” ~ nick
Dataset please.
It seems reality begs to differ, as usual. Weak sauce from Nick, as usual.
https://www.researchgate.net/figure/a-Correlation-between-world-oil-consumption-and-world-GDP-both-plotted-as-logarithms_fig3_272757757
Oh wait…. Nick is cherry picking.
http://earlywarn.blogspot.com/2012/04/gdp-oil-consumption-and-prices.html?m=1
Much like Cold Blob Bob can’t see the temps outside of Kansas, Nick can’t see the oil consumption to GDP ratio outside of USA.
http://earlywarn.blogspot.com/2012/04/gdp-oil-consumption-and-prices.html?m=1
Nick, Iron Mike etc , would it not be better to use GVA (Gross Value Added) instead of GDP .
“GVA is the output of the country less the intermediate consumption, which is the difference between gross output and net output. GVA is important because it is used in the calculation of GDP, a key indicator of the state of a nation’s total economy. It can also be used to see how much value is added (or lost) from a particular region, state, or province.”
GVA=GDP plus SP−TP
where:
SP= Subsidies on products
TP= Taxes on products
Hole in head,
As long as their is no interplanetary trade, GVA and GDP for the World will be similar. Also GDP are the figures we have, have you seen GVA estimates for the World?
Oil consumption vs real GDP for world is lower now than before. See BP DATA.
Is that BOE including nat gas? Or just crude? If just crude I would expect some of those barrels shifted to nat gas/liquids over the past 20 years. It’s easy to see the declining oil vs real GDP ratio as the more is done with less trend has been firmly intact for decades, but some oil consumption may have shifted to nat gas. Would be interesting to see the combined crude nat gas/real GDP ratio over time.
Yes, BOE includes natural gas. That’s why they use the word “equivalent”.
Barrel of oil equivalent (BOE) is a way of standardizing natural gas and other energy resources to a barrel of oil’s energy. One barrel of crude oil generally has approximately the same energy content as 6,000 cubic feet of natural gas, so this quantity of natural gas is “equivalent” to one barrel of oil.
Yes Ron, BOE is clear to me after 30 years in O&G…. I was referencing the dataset Dennis is using for his oil consumption vs GDP discussion. Did it include nat gas & crude or just crude? My point was simply that including nat gas might be an interesting comparison as it would likely be a positive influence. Really it should be hydrocarbon consumption vs. GDP.
Gungagolonga,
Only included oil as defined by BP (that is C C NGL) and the data is in tonnes (rather than tonnes of oil equivalent). When we use mass rather than volume we get a rough measure of energy content (better than a volume measure). I agree fossil fuel vs GDP would be better.
Chart below has natural log real GDP in trillions of 2010 $ for World at market exchange rates (World Bank data) and natural log of fossil fuel energy consumption (oil, coal, and natural gas) in Exajoules from BP Statistical Review of World Energy.
From 1975 to 2019, the average growth rate for real GDP was 2.9% per year and for fossil fuel over the 1975-2019 period the rate of growth was 1.8%/year. If we use 1982 to 2019 the GDP growth rate is the same, but fossil fuel growth increases to 1.9% per year.
For 2005-2019 real GDP grows at 2.6%/year and fossil fuel consumption at 1.44%/year.
Need to look at natural log of each vs time.
Your chart shows correlation between natural log of gdp and oil consumption. Different question, we want natural log vs time.
http://peakoilbarrel.com/aprils-eia-oil-growth-projections/#comment-717205
survivalist,
If we take the natural log of World oil consumption in millions of tonnes of oil per year (from BP stats) and natural log of World real GDP in constant 2005 US $ using market exchange rates (World bank data) from 1982 to 2019 we find oil consumption grew at 1.3% per year on average over that 38 year period and World real GDP grew at 2.77% per year.
Bottom line, Nick’s observation is correct, oil consumption has grown more slowly than real GDP over the 1982 to 2019 period.
From 1960 to 1979 oil consumption grew at 5.73% per year on average, while real GDP grew more slowly (than oil consumption) at 4.64% per year.
So things seem to change over time with a big shift after 1980-1981. I expect we will see other shifts in the future as oil is replaced in land transport with electricity, also we will see less fossil fuel use as the World shifts to wind and solar from fossil fuel for electricity production and more electricity is used for heating buildings and water using heat pumps.
Thanks Dennis! You’re brilliant! You got any WAGs for 2020-2021? Maybe things have changed? I found this one interesting for future Global GDP guesses.
Global gross domestc product (GDP) at current prices from 1985 to 2025 (in billion U.S. dollars)
https://www.statista.com/statistics/268750/global-gross-domestic-product-gdp/
However, as you have shown- SOMETIMES GDP grows more quickly than oil consumption, and sometimes it DOES NOT. Things seem to change. Perhaps gov and consumer debt spending is juicing the GDP? Suppose it does and one day it is decreased and then things change again?
“GDP grows faster than oil consumption” ~ Nick
Therefore, Nick is wrong. Awesome job though.
Survivalist,
From 1960-1972, oil was very cheap and was not used very efficiently. From 1973 to 1980 oil prices increased by a factor of 7, this led to changes in the efficiency with which oil was used so less was needed per unit of GDP increase. A switch to non-oil transportation will change the relationship. There have also been time when oil use decreased but real GDP increased (1979-1983). This is likely to occur again starting around 2028-2030 (when peak oil consumption occurs).
As far as debt and GDP, there will be limits at about 300% debt to GDP (or perhaps higher), there are many nations with dbet to GDP ratios that are higher than 300%. I expect as the World becomes more fully developed and population growth slows down that real GDP growth rates will slow. Eventually World population will fall (starting in 2050-2070) and real GDP growth may cease. Real GDP per capita (using market exchange rates) has grown at about 1.45% per year from 1970 to 2019, so if population growth falls to -1.45% per year and the recent (past 50 year) average real GDP per capita growth rate continues then we have zero real GDP growth at that point.
No clue when or if this will occur. One simple model I have done suggests we reach this point in 2115 with real GDP growth becoming negative after that point, (this was determined by fitting a second order polynomial to a model by Wolfgang Lutz,) the model is very rough as I am no expert on demographics.
Inflation is when an entire generation of boomers comes to age and all buy their first homes and everything that goes in them. Demand driven inflation. What we are in now is totally different. We have wage deflation were paychecks just don’t go as far and it looks likes like inflation. This might have a little more room to the upside for prices to run. Judging by some dollar charts we might be heading to some lower lows for the dollar. And higher prices for oil and a lot of other things.
But higher prices in this environment aren’t inflationary they will prove to be very deflationary. I expect the economic data that has been hot to roll over as prices continue to rise.
HHH, you are correct . The current inflation is not demand driven but liquidity driven . I think in the last quarter of 2021 or first quarter of 2022 we will enter into deflation . This is conditional that their are no more stimulus checks being issued .
According to monetarism, inflation is more money chasing the each unit of produced goods. This can be caused by an increased money supply, or by increased velocity of money, defined as how often the same euro is spent in a given time period.
The velocity of money explains why the trickle down effect doesn’t work — when you give a rich man a dollar, he just puts it in his bank account, or buys bitcoin, but when you give a poor man a dollar, he spends it to meet his immediate needs.
What was the Hyper-Inflation in Germany 1923? I think it was state-demand-driven. Paying back war bonds and high reparations from the peace treaty all with printed money. The economic boom after the war wasn’t there – it was the time before bombing everything to dust in a war.
Is a scenario like this possible, with all these post covid stimulation packages on fresh printed money world wide?
Eulen , my take . We are going to have inflation in assets and commodities just like Japan did . We are already there now . An excerpt on Japan :
The Japanese asset price bubble was an economic bubble in Japan from 1986 to 1991 in which real estate and stock market prices were greatly inflated…The bubble was characterized by rapid acceleration of asset prices and overheated economic activity, as well as an uncontrolled money supply and credit expansion. More specifically, over-confidence and speculation regarding asset and stock prices were closely associated with excessive monetary easing policy at the time.
“At their peak, prices in central Tokyo were such that the Tokyo Imperial Palace grounds were estimated to be worth more than all the land in the entire state of California”
When the bubble will burst , we will go in a deflationary collapse just like Japan . This will result in crash of demand and closure of business worldwide . The Central bankers response will be to print currency and try to reinflate , but they will fail . Consequence too much money(currency) chasing too few goods and then inflation which is a self feeding loop leading to hyperinflation . The current inflation I have commented is liquidity driven but the inflation after deflation will be demand driven .
Fiscal policy is different from monetary policy.
When there is a lack of private demand government spending can fill the gap. If it is overdone spending can be reduced or taxes raised or monetary policy can be used to reduce inflation.
Dennis , all the time ” if” and ” but ” .
Cramer pitching Chevron as a divvy play to benefit from higher cap gains taxes, if they happen. Have forgotten CVX breakdown of revenue oil vs natgas. Probably still oil.
Euro oils have always paid higher div yield, but increased slower. Significant if it’s all a cap gains dodge.
Virus daily deaths have stopped declining in the US. Nothing good about this. Not being talked about.
“I can’t speak to the economics here in Marcellus/Utica, but the price paid for condensate by Ergon, the main purchaser here is $41.15 today, a $20 discount to crude. ”
This is from the comments section of Mike S blog . Any comment or view point as to whether at this well head price shale is viable .
Hole in head,
Not all tight oil is condensate. Much of it is light about 40 degree API gravity. At one time, in the 70s and 80s a premium was paid for such extra light oil.
Today in the US refineries are set up for heavy crude so less lighter weight grades of crude are needed. That is why much og the tight oil production is exported.
Dennis , I have this information already . My question is to the viability of operations at the price mentioned in the post . Perhaps SS will chime in .
At 41. Crude would not be viable, crude isnot condensate. Conxensate always sells at a discount, typically 25% less than crude.
Predictions by a Bank of American Exec.
Forecasts via BoA, analysts at the bank expecting:
Wed 28 Apr 2021 03:13:50 GMTAuthor: Eamonn Sheridan | Category: News
Brent and WTI to average $63/bbl and $60/bbl, respectively, in 2021
Our supply and demand forecasts suggest a 1.3mn b/d deficit in 2021 followed by a 170k b/d surplus in 2022
On the demand side the bank sees:
We forecast global demand will rebound nearly 6mn b/d YoY in 2021 after falling 8.7mn b/d in 2020.
During 2021-23, we forecast demand will grow by more than 9mn b/d, the fastest pace since the 1970s.
On supply:
Non-OPEC supply should grow more than 1 mn b/d YoY in 2021 and an additional 2mn b/d in 2022.
We project US supply to grow less than 200k b/d in 2021 and more than 1 mn b/d in 2022 thanks in part to robust NGL volumes.
OPEC supplies are set to rise 800k b/d in 2021 and 2.1 mn b/d in 2022 and OPEC+ adds back supply and as Iran returns.
For some time the production of the lowest tier of OPEC 13 has been bugging me . These are countries which are about a million barrels and less per day and declining due to natural cases or geopolitical issues . These are Congo ,Equatorial Guinea , Gabon, Venezuela ,Nigeria . Libya , Angola and Algeria . Add to these non OPEC like Ecuador , Colombia etc . Oilprice has a write up on the future of these low producers . Not very encouraging .
https://oilprice.com/Energy/Crude-Oil/Energy-Transition-Could-Doom-Africas-Oil-Producers.html
From that link-
“Whereas Africa’s oil and gas producers continue to hope that the ongoing rollout of Covid-19 vaccines will return global oil demand to some form of normalcy sooner than later, the long-term outlook remains dire, thanks to a more formidable foe: The renewable energy megatrend.
Maplecroft has warned that countries that fail to diversify their economies away from fossil fuel exports face a “slow-motion wave of political instability.’’
The consultancy says the move away from fossil fuels is set to hit high gear over the next 3-20 years, and that oil-dependent countries that fail to adapt risk facing sharp changes in credit risk, policy, and regulation.”
That is a kind way of saying that most countries dependent on oil income are going to face an extremely harsh reality in the 2030’s.
Take Nigeria for example. In the mid-2030’s they will be the fifth biggest country in the world, about as big as the USA today.
Just how money will they earn from oil then?
I think it is an example of a country with high risk for failed state status.
Boko Haram. Movement for the Emancipation for the Niger Delta (MEND).
Take your pick.
Hicks , I think by 2025 OPEC 13 will be OPEC 5 viz KSA , Kuwait , Iran , Iraq ,and UAE .
Nigeria. This is today-
“Nigeria’s Rivers state will ban people crossing its borders at night due to heightened insecurity, its governor said on Tuesday, as violence and lawlessness surge across the West African country…Rivers lies in Nigeria’s oil-producing heartland, the Niger Delta, where past unrest has crippled crude production as militants destroyed and raided facilities, sending Africa’s largest economy into a tailspin…Wike cited the killings of police, customs and civil defence officers on Saturday and of army soldiers on Sunday to justify the curfew.”
And
“In the northeast, the armed forces are still struggling in a 12-year war with Boko Haram and Islamic State’s West Africa branch. On Sunday, more than 30 soldiers died in an attack, soldiers and a resident said. “The nation is on fire,” Nigeria’s parliament called on the presidency, armed forces and police to address the country’s mounting security crisis on Tuesday, with the lower house urging President Muhammadu Buhari to declare a state of emergency…”
https://www.reuters.com/world/africa/nation-is-fire-nigerian-lawmakers-demand-action-security-crisis-2021-04-27/
This is all going to get worse as the Nigerian oil depletes, and the population gets dramatically larger.
And Algeria can’t feed itself . By the way Algeria is mainly condensate so it gets a much lower price .
https://www.africanews.com/2021/04/28/algeria-struggles-to-feed-its-people-as-crisis-persists/
Shortterm-
“India’s worsening COVID outbreak is set to disturb the nearly balanced global oil market, which will show a surplus of oil supply of as much as 1.4 million barrels per day (bpd) next month amid a sizeable loss of demand from the world’s third-largest oil importer, Rystad Energy says . India has seen fuel demand decline in recent weeks as record-high new coronavirus infections are prompting lockdowns and curfews in many states in the country of 1.3 billion residents, limiting mobility and slowing business activity. India’s combined demand for diesel, the most used fuel in the country, and for gasoline is set to plunge by as much as 20 percent in April compared to March, officials from refiners and fuel retailers told Bloomberg. Demand is further expected to decline in the coming weeks as curfews and localized lockdowns are likely to be extended.”
https://oilprice.com/Energy/Crude-Oil/Rystad-Energy-Indias-COVID-Crisis-Could-Result-In-Global-Oil-Glut.html
Trouble also in Brazil .
https://oilprice.com/Latest-Energy-News/World-News/Brazil-Reports-6-Oil-Output-Decline-In-Q1.html#:~:text=Crude%20oil%20production%20in%20Brazil,of%202020%2C%20the%20report%20said.
Oil price says drilling expected to increase by 10% in Brazil over the next 12 months.
Dennis , don’t know . The last info I got was that staff was not turning up for work due to Covid causing disruption . As of today the situation has not improved . Hope it gets better .
The virus is moving . Unpredictable consequences .
https://indianexpress.com/article/coronavirus/indian-strain-of-coronavirus-found-in-17-countries-who-7292616/
Oil consumption and GDP
Courtesy of Mr Art Berman’s twitter-feed
U.S. China = 32% of world GDP & 34% of world oil consumption.
… and further more
“GDP & oil consumption correlate as perfectly as anything in statistics.
Figure it out.” ~ Mr. Berman
https://twitter.com/aeberman12/status/1265473889993400321?s=20
I couldn’t upload the graphic. See it on link if interested.
Image attached re above
Gross national product and oil consumption in selected countries (2007).
https://www.researchgate.net/figure/Gross-national-product-and-oil-consumption-in-selected-countries-2007-Countries_fig1_26638085
The cornies will have you believe that we are doing more and more with less and less, and if you keep hope, before you know it, we’ll be doing everything with nothing at all.
The cornies will have you believe that we are doing more and more with less and less, and if you keep hope, before you know it, we’ll be doing everything with nothing at all . 🙂 🙂
Well said .
Well, as was noted above; Oil consumption vs real GDP for world is lower now than before.
And once again, I ask the same question asked by many
great historians- So what?
Perhaps this trend will continue to extrapolate into the future until everything comes from nothing (or nearer to it), or maybe something else is going on?
Yes, that’s the question: so what? What are we trying to figure out? It seems to me that this discussion is about the basic question: can we transition away from oil and fossil fuels?
It seems to me that it’s obvious that we can. There are questions of timing: how quickly should we do so, how quickly are we likely to actually do so?
I hope that it’s clear to everyone on this blog that we should do so ASAP: the hidden costs of oil & FF (pollution, security, etc) are very high. Oil producers would like some compassion and help in doing so, of course. I think that’s only fair, especially for the employees and small business owners who are working hard and just doing what’s in front of them. I don’t feel quite as good about FF investors and top management of large companies, who have been dishonest about the risks and costs of FF, but we may to compensate them for their losses in order to make progress.
So, the only questions remaining are timing and strategy: how quickly is the coming transition likely to proceed, and what’s the best policies and strategies for speeding it up?
“ can we transition away from oil and fossil fuels” – Nick
We can and we will, obviously, but nobody’s gonna like it very much. I suspect you envision a very happy time will be had.
I’m actually addressing your statement from earlier.
“GDP grows faster than oil consumption” ~ nick
Whilst your PR training might encourage you to change the subject- I think we shouldn’t.
GDP always increases in a world with growing debt and population.
If, as of late, GDP is variable in relation to oil consumption (in a manner that pleases you), then we might ask why. Is it the green energy machine taking over, or something else? Perhaps it’s consumers and governments loading up on debt to maintain spending?
Transition…We can and we will, obviously, but nobody’s gonna like it very much.
I think that’s the most basic question: really, you’re saying that a transition isn’t possible, in the sense of a transition to something that does the job that an energy source should do.
BTW, you talked about changing the subject, but making an accusation about my background Is changing the subject by making personal ad hominem remarks.
So, back the main question: why do you think renewables can’t replace oil & FF?
Numerous people here have commented on your attempts at pro PR and disingenuous statements that once called on you deflect from. Weak sauce from Nick, as usual. Very PR.
Hole in head,
There are other types of energy besides fossil fuel, so much can be done using very little fossil fuel as an energy source as non fossil fuel energy sources are ramped up. From 2005 to 2019 World per capita fossil fuel use increased at a rate of 0.26% per year. The average fossil fuel use per capita over those 15 years was 63 EJ per person per year and the annual average increase was 0.16 EJ per capita.
Dennis , there are lies and then there are statistics and figures . The OPEC cut production by 6/7 mbpd because there is no demand and price goes from $ 45 to $ 65, but OPEC did not increase production even at this price . Now GS says the price to be $ 80 . The GDP grew by 6.4 % in the last quarter , but did they mention about the $ 1.8 T debt the economy has taken . No mention of the fact that 34% are depending on the govt for support . Boeing lost a couple of billions and the stock price did not move . Tesla makes all its profits out of Bitcoin and carbon credits . This is a topsy turvy world right now . I am from the old school where ” If you earn $ 1000 and spend $ 990 you are OK , and if you spend $ 1010 then you are in trouble ” . I try to keep my feet on the ground and not get carried away . The truth is ” We are past peak and we are in trouble ” , a millimeter left or right is not going to change the situation .
P.S : Price is going to go higher because there is a strike from 15 th May by workers in Scotland and also the pipeline maintains from 27th May .
https://www.zerohedge.com/economics/record-34-all-household-income-us-now-comes-government
Hole in head,
OPEC wants oil prices at $75 to $85/bo, they will increase output when prices reach that level. If they see a big rise in US tight oil output at $65/bo, they may act sooner so they don’t lose market share. So far increases in tight oil output have been modest and oil prices may continue to rise to $75/bo.
I do not know how to talk about the future without the word if, the other word (rhymes with hut) not used above. 🙂
Hi Dennis,
If in the future, OPEC is looking for $75 to $85/bo. Where did you get those numbers?
My thinking, shale is the marginal high cost producer and OPEC can maximize income by keeping the lid on price around shales cost of production. I have not seen any OPEC statement with your numbers, but your close to the range I was thinking.
Dennis , read carefully . I said this is a topsy turvy world . There is no more price discovery because of continuous intervention in the markets by the CB’s . Just checked , housing starts are what they were in 2009 ( peak was 2006 just before the GFC ) and lumber prices are above by 300 % . Same goes for oil . For some period I am going to excuse myself from the daily chatter of prices . I stand by my conviction of $ 25 by 2025 .What OPEC + or Non – Opec does is irrelevant in the current environment . There are other extraneous factors that are at play regarding oil prices example Iran , Russia even Afghanistan withdrawal , China , Covid India .
Huntington beach,
Just a guess based on analysis that suggests many OPEC producers need $80/b to balance their fiscal budgets. Also the fact that they have not increased output very much suggests they want prices higher than present level.
Art Berman has some great data on this issue of GDP and oil consumption.
Well, the US has been an oil importer since WWII, so it makes sense that high priced oil imports would have some effect. It’s a good argument for the US to eliminate it’s dependence on oil imports.
“GDP grows faster than oil consumption” ~ nick
Is this a trend you’ve been observing?
Dataset please. Preferably a global one.
From what I can tell, falling oil consumption means falling GDP. I’m savvy with getting of oil, don’t use much myself, and I can probably handle the falling GDP better than most; but you want to pretend that the world will get of oil and GDP will just keep chugging along. You don’t make a very convincing or seductive argument for that claim, primarily because when called upon to defend your argument you instead exhibit a pattern of deflecting and getting butthurt.
Read Dennis comment above at 4:48pm
Thanks HB. I appreciate it! I’m on a handheld and it’s easy to miss a spot.
“From 1960 to 1979 oil consumption grew at 5.73% per year on average, while real GDP grew more slowly (than oil consumption) at 4.64% per year.
So things seem to change over time” – DC
“GDP grows faster than oil consumption” ~ Nick
Thanks to Mr. Coyne’s analysis it appears that SOMETIMES GDP grows faster than oil consumption and sometimes it DOES NOT.
Nick is wrong. It’s easy to see. He’s on here selling absolutes, and a few other things.
Actually Nick is right and your chart below confirms it. Your chart shows GDP has out preformed oil consumption with the same numbers Dennis give you at 4:48pm from 1980 to 2010. America has been getting more oil efficient per GDP for the last 40 plus years. But, efficiency has not been able to offset GDP growth year after year.
On the bright side, your idol Elon is going to change the last 40 year correlation with EV’s and be the techno savior you have always dreamed about.
After the gas lines of late 1973 and peak US, the American auto manufacturers stopped building aircraft carriers that got less than 8 mpg a fighter pilot could land a jet on the hood. The era of 4 cylinders Janpanse got a foot hold into the America auto market.
A little dated but still fun. Anyone see any hopeful trend lines that I’m missing?
“From 1960 to 1979 oil consumption grew at 5.73% per year on average, while real GDP grew more slowly (than oil consumption) at 4.64% per year…. From 1982 to 2019 we find oil consumption grew at 1.3% per year on average over that 38 year period and World real GDP grew at 2.77% per year.” -Dennis
I think I might have figured out how we pulled the old switcharoo on that one. It doesn’t look good. Perhaps Nick thinks it does.
https://blogs.imf.org/2019/01/02/new-data-on-global-debt/
Survivalist. Yeh, your point that oil correlates well with economic growth is a true one, and obvious to all.
Keep in mind that economic growth correlates (and is dependent on) more than just oil production.
Others forms of energy are perhaps just as important.
Electrical generation may be even more closely correlated- I don’t have the fancy data or charts to attempt showing it.
I expect electricity to become even more relevant to economic growth as more and more of the worlds engines/motors become electric over the next two decades.
I won’t bet if we will see economic growth, or contraction, over the next two decades.
Either way- the overall energy production will be up or down with it.
Hickory,
I’ll have a look at the statistics and charting for electrical power consumption and GDP.
I want to re-iterate here, a point probably Dennis and I will disagree upon, but I think that GDP is quite a poor yardstick as a measure of progress, or a nations health.
Below is a well written article on the topic if anyone is interested:
https://www.theguardian.com/business/2021/jan/17/bobby-kennedy-was-right-gdp-is-a-poor-measure-of-a-nations-health
Also with asset bubbles, the exchange of houses and shares at higher prices will count towards GDP, but that doesn’t imply actual usage of energy in the process. It’s mere the exchange of assets with an increase in value.
So one has to be careful when looking at such datasets and take it with a grain of salt. These government released statistics are more for political image keeping than actual substance in my opinion.
Iron Mike,
I agree real GDP is a poor measure of how well a nation is doing, income distribution, pollution and other factors are also important. Real GDP is just a simple measure we have data on. I simply take the World real GDP data produced by international agencies.
There is a good correlation of real GDP with energy use, electricity use, oil use, coal use, natural gas use, etc. We could do a multilinear regression of real GDP vs various primary energy sources, it is a bit of work to separate out electricity as we don’t have a clear picture of the percentage of electricity produced by various sources and how it has changed over time (or it would take a lot of work to sort out).
Agree Iron Mike and Dennis.
Thanks Hick, although I’m pretty sure it’s not obvious to Nick!
Here Nick accuses Jason Bradford of pushing fossil fuel talking points.
http://peakoilbarrel.com/usa-oil-production/#comment-686913
Here Nick accuses Nate Hagens of pushing fossil fuel talking points.
https://peakoilbarrel.com/opec-october-2020-production-data/#comment-711028
He seems to make this accusation because they differ in opinion from him in terms of predicted future economic scenarios.
Does anybody else here think that Nate and Jason are pushing fossil fuel talking points?
Does anybody here take Nick as an ethical broker of intellectual honesty?
Cue the histrionics.
Does anyone here feel Survivalist doesn’t have a comprehension problem?
Survivalist, Nicks first two words in your link provided is “I feel”. It’s a blog, he’s giving you his opinion. You have your own belief and intellectual honesty issues. Time to move on.
Brigaded by Nicks cubicle buddies; and for what, telling it like it is.
So now your the victim, go ahead and play the survivalist “old switcheroo” excuse
Did you graduate from the white man school of Trump University?
The decline of oil has already begun
We live in the era of peak oil, but just as the modern oil industry attempts to deny the effects of carbon emissions, the industry has also found it convenient to deny that oil is a finite resource that will peak and decline. Since 1956, when Shell geophysicist Marion King Hubbert predicted (accurately) the peak of US conventional oil, industry cheerleaders have mocked anyone who dares to speak about the natural peak and decline of oil.
Last year, the International Energy Agency claimed that, “The United States is increasingly leading the expansion in global oil supplies,” and promised that a “second wave of the US shale revolution is coming.” Forbes magazine, a relentless denier of oil limits, stated in 2017 that “Peak oil is not in sight,” and that any impact of limits on energy policy or production “will not be a force for some time.” This sort of bravado bolsters oil company stock prices, but ignores geo-physical reality.
And then there is the other side.
Goldman Sachs forecasts the biggest jump in oil demand ever (Headline story behind paywall i can’t get)
Goldman Sachs is forecasting the largest jump in oil demand on record as the world opens up again amid the Covid-19 vaccination rollout.
The firm is raising its outlook on oil based on this expected upswing in demand. “The magnitude of the coming change in the volume of demand — a change which supply cannot match — must not be understated,” it said Wednesday in a note to clients.
A change which supply cannot match. Quite a call.
Thanks, Ovi, you got enough of the post to get the general drift of the story. I just don’t get it. How can anyone predict a jump in demand while the pandemic is raging at its highest level ever? Anyway:
Texas oil pipelines face dry months as production languishes
Nearly half of all oil pipelines from the Permian basin, the biggest U.S. oilfield, are expected to be empty by the end of the year, analysts and executives said.
Pipeline companies went on a construction spree throughout 2018 and 2019 to handle blistering growth in U.S. crude production to a record 13 million barrels per day (bpd). However, the coronavirus pandemic crushed both fuel demand and oil production, and neither have recovered fully, leaving many pipelines unused.
Major pipeline companies are exploring ways to ship other products in those lines and considering selling stakes in operations to raise cash.
The coronavirus pandemic upended the global energy supply system and worldwide fuel demand. U.S. gasoline consumption is now estimated to be past its peak and as refiners process less crude, producers are not filling pipelines used to transport it.
By the fourth quarter, total utilization of the largest oil pipelines from the Permian is expected to drop to 57%, consultancy Wood Mackenzie said. The nadir during the last market bust in 2016 was roughly 70%.
U.S. crude output is currently about 11 million bpd, and is not expected to grow much until 2022. But more pipelines were already set to come online, growing the gap between production and capacity covered by long-term contracts to a record over 1 million bpd in February, according to energy research firm East Daley Capital.
“We do not expect to be at pre-COVID production levels by end-2022,” said Saad Rahim, chief economist at commodities merchant Trafigura.
There is a lot more to this article but this enough to tell you what is really going on. Some articles give you hype and some, like this one, tells you what is really going on.
Ovi , one word crap . Japan dead . China dead , India dead , EU dead , Africa dead , MENA cannot feed itself ,
Latin America dead , Central America dead , USA dead ( yes 6.4% growth but what about the $ 1.8 T debt to get there ) . My opinion has been when GS and JPM say ” sell ” then ” buy” and vice versa .
Disclaimer : I do not do stock ,commodities , currency markets .
If anyone is interested here is the plot for World oil consumption growth rate vs World GDP annual % change.
World oil consumption growth rate is measured relative to the previous year in TWh. Data courtesy of ourworldindata. World GDP annual change data is courtesy of the worldbank.
ttest statistics for Dennis:
tstat = 5.72
p-vale = 9.67E-08 -> implies null hypothesis is rejected, as expected.
Interesting. Oil growth on one-year change seems preceding the world GDP growth on one-year change, which suggests the dependence of economic growth on oil avaibility.
Jean-Francois,
There is a lag in the data due to changes in stock levels, It is likely that the causation runs from GDP to oil demand to oil supply, often consumption data is based on output of refined liquids, but their is a lag here as well where in some cases stocks go from low levels when the economy is growing rapidly to high levels when the economy slows down, this leads to a lag in the data for oil consumption.
Hickory,
Here is World electricity consumption (EIA) vs World real GDP (WB). As you can tell from the plot it is much smoother compared with oil which ill post below for comparison. Obvious reason is because electricity production is not as geopolitical as oil.
Thanks Iron Mike.
Its what we should have expected.
Interesting to see the 2009 financial crises show up.
And we will see the Covid pandemic show up too.
World oil consumption vs World real gdp
We seen to have a move up in the oil market.
Let’s see if this continues.
Survivalist,
Nick’s earlier comment was about oil and GDP since the 1970s.
If we use EIA C plus C annual World output data from 1973-2020 and World bank real GDP data for World in 2010 US$ from 1973-2019 and tack on IMF 2020 estimate for World real GDP in 2010 US$ to get a complete data set from 1973 to 2020, we find the average growth rate for World real GDP over that 48 year period was 2.9% per year and the average annual increase in World C plus C output was 1.09% per year. So it seems to me that Nick was correct in saying that oil consumption grows more slowly than real GDP since the seventies.
Did anyone know that it takes 18 days for Alaskan oil to flow from the North Shore to Valdez, up from just 4.5 days in 1988?
Oil production in Alaska reaches lowest level in more than 40 years
Crude oil production in Alaska averaged 448,000 barrels per day (b/d) in 2020, the lowest level of production since 1976. Last year’s production was over 75% less than the state’s peak production of more than 2 million b/d in 1988. Production declined in 28 of the 32 years since Alaska’s oil production peak as the state’s oil fields have matured. The 4% decrease in annual oil production in Alaska in 2020 was part of a larger decline in U.S. oil production.
The Trans-Alaska Pipeline System transports crude oil from the North Slope of Alaska to Valdez on Alaska’s southern coast. Pipeline deliveries have decreased because of less production. Lower oil volumes cause oil to move more slowly in the pipeline, and the travel time for oil from the North Shore to Valdez has increased from 4.5 days in 1988 to 18 days in 2020.
TAPS basics
– 48-inch diameter carbon steel pipe
– 800 miles long
• 420 miles above ground
• 380 miles below ground
– 178 mainline valves
– 78,000 vertical support members
– Includes Valdez Marine Terminal
and Ship Escort/Response Vessel
Syste
I wanted to point out one very important sentence from this Seeking Alpha article: Bold mine.
Russia’s Oil Production To Never Return To The Peak? That’s Not A Surprise
Russia’s energy ministry forecasts production to never surpass its previous peak.
In its base case, Russia’s oil production is expected to recover to ~11.1 mb/d and peak there. In its most bullish case, it rises to ~12.8 mb/d.
We wrote last year that the Saudi price war combined with the demand drop from COVID-19 will result in permanent production loss worldwide including Russia.
If Russia’s decline profile is anything similar to that of the US (for smaller producers), we estimate that even if Rosneft produced all out, Russia will produce ~11 mb/d.
But the Russian story is just one part of the bigger story, other non-OPEC ex-US production declines will also become more pronounced in the years ahead.
It is not that other nations are also in decline, but there will be more nations joining the decliners. And as the article states, this decline will become more pronounced in years ahead.
Using BP statistical review of World energy statistics for primary energy per capita (EJ), fossil fuel consumption per capita (EJ), oil consumption per capita (EJ), and World real GDP per capita data in constant 2010$ (thousand $ per capita) from World bank and taking natural log of all data to look at average growth rates from 2010 to 2019, I get chart below.
Real GDP per capita grew at an average annual rate of 1.63%, primary energy per capita consumption at 0.34%/year, oil consumption per capita at 0.13%/year, and fossil fuel consumption (oil, natural gas and coal) almost flat at 0.02%/year. Nearly all of the increase in primary energy consumption per capita (0.32%/year) was from non-fossil fuel, with decreases in coal use offsetting most of the increase from natural gas consumption. Also the rate of growth in non-fossil fuel primary energy per capita grew at an average annual rate of 2.26% from 2010 to 2019.
https://www.bp.com/en/global/corporate/energy-economics/statistical-review-of-world-energy.html
https://data.worldbank.org/indicator/NY.GDP.PCAP.KD
The EIA’s Monthly Energy Review, which came out Tuesday, got February’s US oil production data half a million barrels per day too high, according to the EIA’s Petroleum Supply Monthly, that came out today. The Petroleum Supply Monthly is always far more accurate and the MER always has the same data after about four months.
I have seen the MER off before but never off by that much. The Data:
……………. MRE …… PSM
Oct-20 10,439 10,439
Nov-20 11,168 11,168
Dec-20 11,101 11,088
Jan-21 11,080 11,059
Feb-21 10,364 9,862
Mar-21 10,968
The February disaster in Texas was worse than the EIA predicted, if the tight oil estimate for Permian and Eagle Ford is correct and the PSM is also correct, then conventional output in New Mexico and Texas fell by 507 kb/d from 962 kb/d in Jan 2021 to 454 kb/d in Feb 2021. It is more likely we will see a future revision in tight oil and/or PSM estimates.
Of course, there will be revisions. There are always revisions but most of the time the revisions are not all that great. The question is, how large will these revisions be, and in which direction? My guess is the MER will be revised downward by a huge amount and the PSM will be revised upward by a very small amount.
With all this talk about GDP and oil/energy consumption relationship, its important to keep in mind just what we are all getting at-
Our civilization is completely linked to massive energy consumption.
And if we sit and watch the population grow and oil deplete (and nat gas),
then the economy of the world will be forced into contraction, the hard way.
Long and hard. Catastrophic before long.
And perhaps that is the most likely scenario, and what many consider inevitable.
Keep in mind however that degrees of severity, timing, and local variation can and will make all the difference.
Or at least a hell of a lot of difference.
By that I mean that many countries won’t go down the path of energy shortage at anywhere near the severity, or as quickly as others. Some will quickly descend into failed state status, and no country is ever guaranteed to
escape that fate.
And yet many countries are very well endowed with more solar, wind, hydro and nat gas energy reserves than they could use if they were serious about developing it. The solar reserves of the world are enormous, as previously demonstrated. Yes, at todays technology level and todays pricing levels. Not for all countries, but for most.
Timing will matter a lot.
USA for example can wait for crisis level pricing in oil, or can get to the task at hand now in proactive manner. [Seems like Texas will be a big winner either way]. These things (deployment of solar and wind energy) don’t happen overnight. It will takes decades to accomplish a level of significant diversification away from oil in transportation, as an example, if we start now in earnest.
Or we can wait for crisis time and watch things get torn apart, before we take serious action.
Choices on what we spend money on, who we elect, what we care about…or if we even care, will make huge differences in outcome.
This will be interesting to watch.
https://www.spglobal.com/platts/en/market-insights/latest-news/natural-gas/043021-oil-trader-vitol-acquires-midland-basin-shale-assets-from-hunt-oil?utm_source=social&utm_medium=twitter&utm_term=plattsoil&utm_content=2413cb22-e1b3-47bb-ade6-ebdce435dd36&utm_campaign=hootsuitepost
Or, shortened using Bitly:
https://bit.ly/33iDE45
What is interesting is that Chevron has one if its big units listed for sale publicly. Eunice/Hobbs in New Mexico. 4,000+ BOPD. LOE has been running in the teens. They are even selling all off the royalty.
Of course, this is just one property. But would think if oil prices keep rising CVX could keep minting money from Eunice/Hobbs.
Does anyone here know why CVX would be liquidating a legacy asset like Eunice/Hobbs?
A new thread US February Oil production has been posted.
http://peakoilbarrel.com/us-february-oil-production-plunges-due-to-winter-storm/
A new Open thread Non-Petroleum has been posted.
http://peakoilbarrel.com/open-thread-non-petroleum-may-1-2021/