By Ovi
This is a shortened report because the EIA is delaying its release of US November production till Friday February 6. The EIA state charts will be published a few days later.
State Oil Production Charts
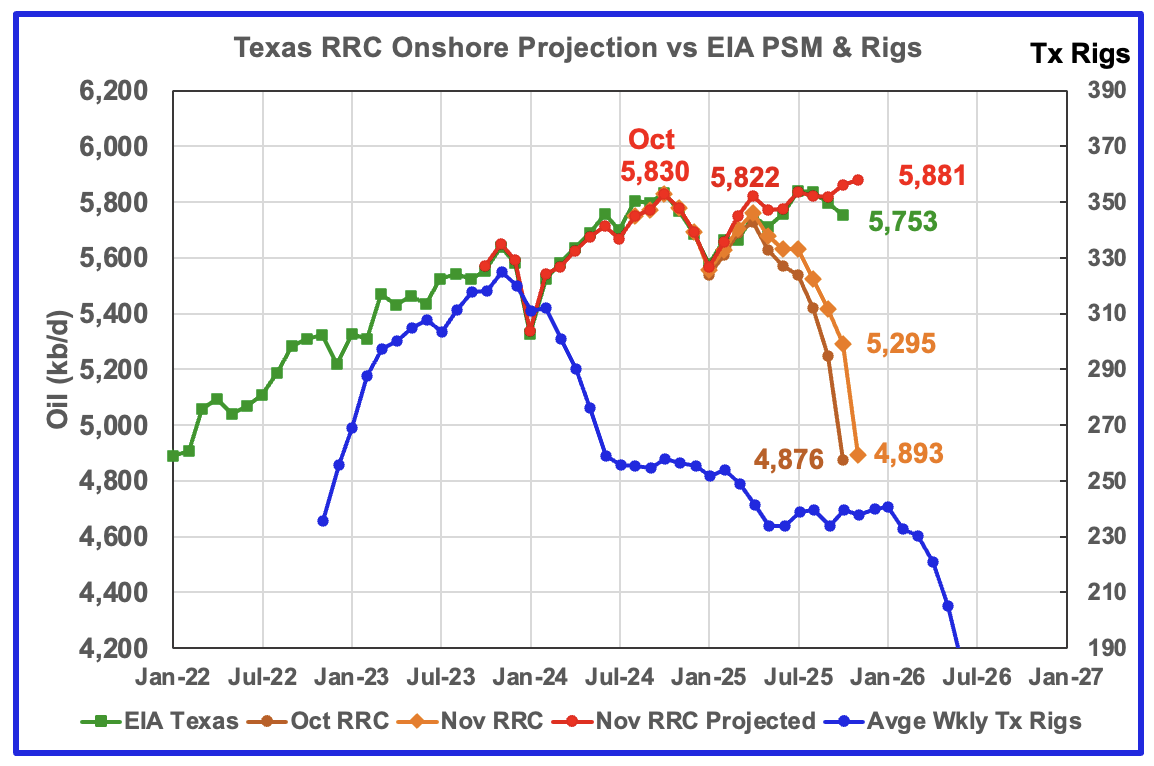
This chart shows EIA’s Texas October production and projected November production. The projection was optimistic and what is shown is more realistic and possibly still a bit optimistic. The Texas data for October appeared to be under reported which results in Texas as whole along with the county charts, shown further down, being optimistic. Texas production appears to be on a plateau and close to entering its decline phase.
The red graph is a production projection using October and November Texas RRC data.
The blue graph shows the average number of weekly rigs reported for each month shifted forward by 10 months. So the 276 rigs operating in July 2023 have been shifted forward to May 2024. From February 2024 to July 2024, the rig count dropped from 312 in time shifted February 2024 to 256 in July 2024. That drop of 56 rigs had no impact on production up to July 2025. August 2025 appears to be the first month when the impact of the rig count drop on oil production started to show up.
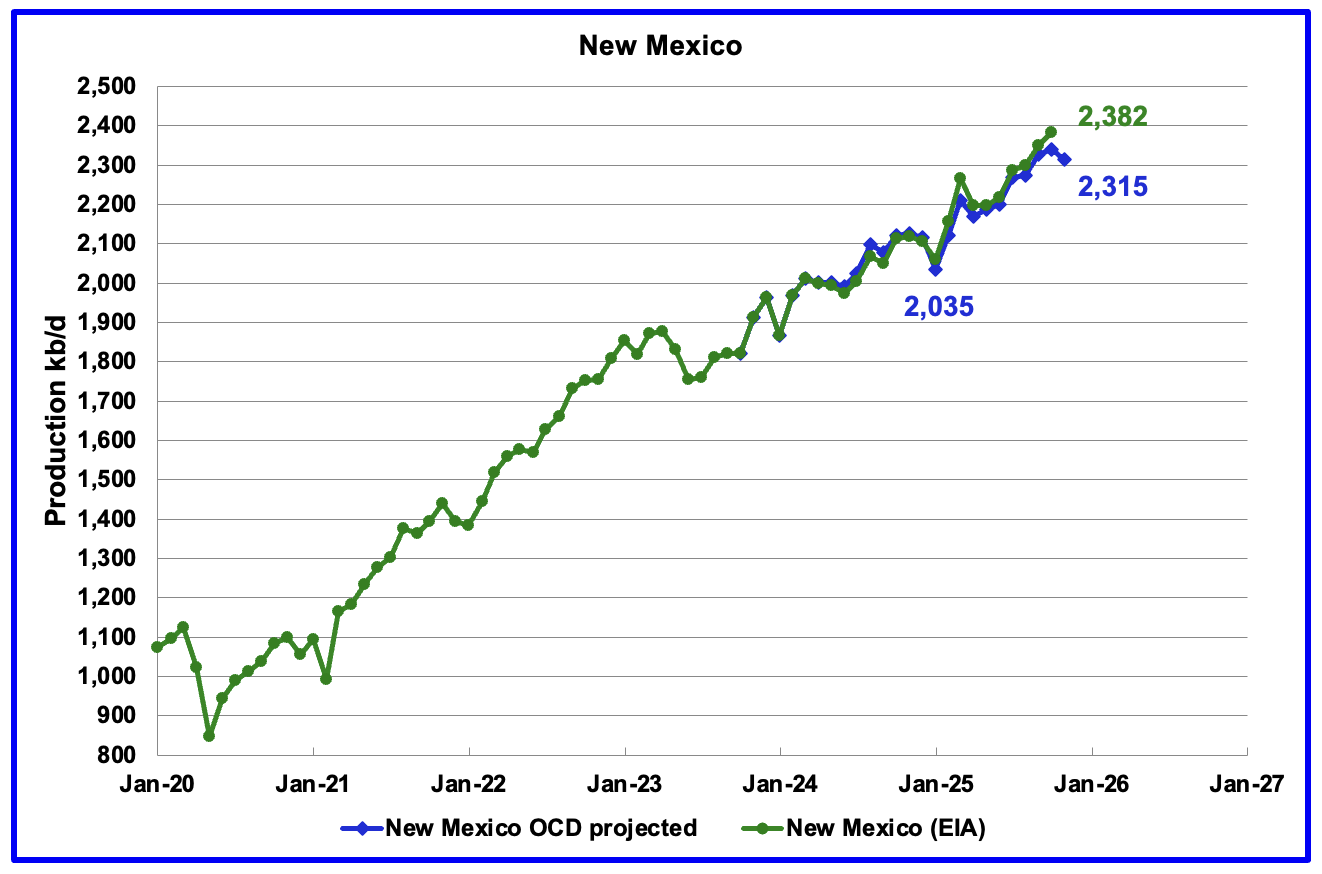
This chart shows EIA’s NM October production and along with NM’s projected November production. NM’s projected production dropped by 26 kb/d to 2,315 kb/d.
The blue graph shows the projected output up to November.
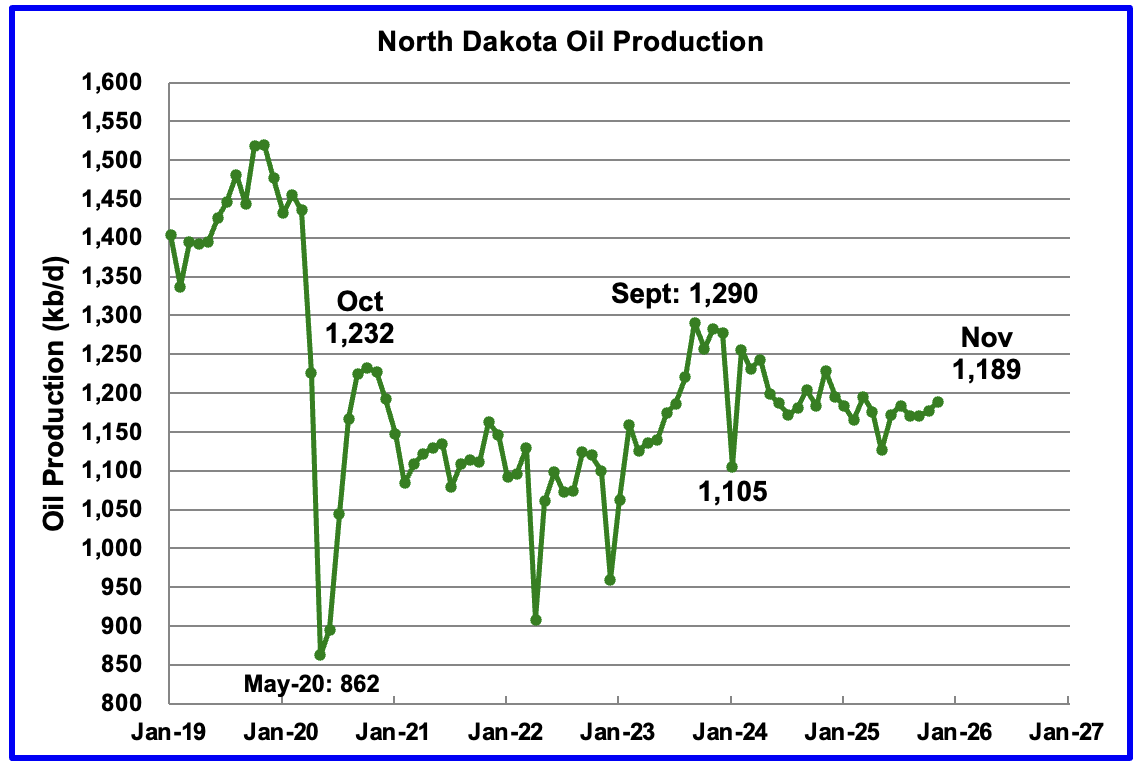
The North Dakota Department of Mineral resources reported November production increased by 12 kb/d to 1,189 kb/d.
According to this Article, ND’s November oil production was 3.4% above revenue forecast.
“Nathan Anderson, director of the Mineral Resources Department, said last week in the January Director’s Cut report of the state’s oil and gas production, that total was 3.4% above the revenue forecast of 1.15 million barrels of oil a day.
Last week, Harold Hamm, founder of Continental Resources, announced the company is pausing drilling due to low oil prices but the company is not leaving the state.
The top 15 oil producers in North Dakota, according to the North Dakota Department of Mineral Resources, are as follows, including operator, 2025 total oil produced in barrels of oil (BBLS) and percentage of state total:
– Continental Resources, Inc.: 61,250,565; 15.6%
– Hess Bakken Investments 11, LLC (Chevron): 40,375,628; 10.3%
– ……. More oil companies.
Permian Basin Report for Main Counties and a District
This special monthly Permian section was added to the US report because of a range of views on whether Permian production will continue to grow or will peak over the next year or two. The issue was brought into focus many months back by two Goehring and Rozencwajg Reports and Report2 which indicated that a few of the biggest Permian oil producing counties were close to peaking or past peak.
A more recent report was issued and can be reviewed Here. In this report they state:
“For years now, we have outlined with what we hoped was clarity, and what we now submit was prescience, the view that U.S. shale oil, that great source of modern supply, could not grow forever. It would mature, crest, and begin its long descent. That moment, by our models and measures, has arrived: shale has plateaued, and 2024 appears to be its high-water mark. And yet, investor sentiment has scarcely been more downbeat.”
This section will focus on the four largest oil producing counties in the Permian, Lea, Eddy, Midland and Martin. It will track the oil and natural gas production and the associated Gas Oil Ratio (GOR) on a monthly basis. The data is taken from the state’s government agencies for Texas and New Mexico. Typically the data for the latest two or three months is not complete and is revised upward as companies submit their updated information. Note the natural gas production shown in the charts that is used to calculate the GOR is the gas coming from both the gas and oil wells.
Of particular interest will be the charts which plot oil production vs GOR for a county to see if a particular characteristic develops that indicates the field is close to entering or in the bubble point phase. While the GOR metric is best suited for characterizing individual wells, counties with closely spaced horizontal wells may display a behaviour similar to individual wells due to pressure cross talking . For further information on the bubble point and GOR, there are a few good thoughts on the intricacies of the GOR in an earlier POB comment and here. Also check this EIA topic on GOR.
New Mexico Permian
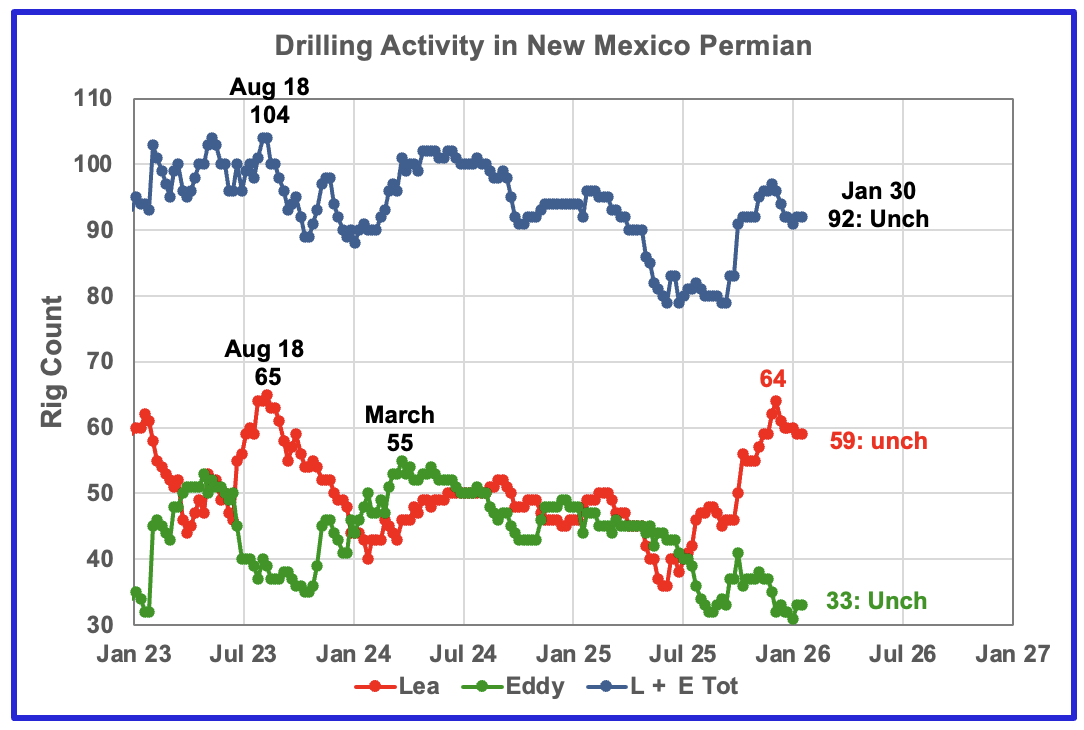
The current rig counts in Lea and Eddy counties are moving in different ways. Lea County has been dropping rigs while Eddy is holding steady. Over the past two months Lea County dropped 5 rigs to 59 while Eddy has held essentially steady at 33. Overall NM dropped 4 rigs in December and January to 92.
Oil Production in New Mexico’s Primary Permian Counties
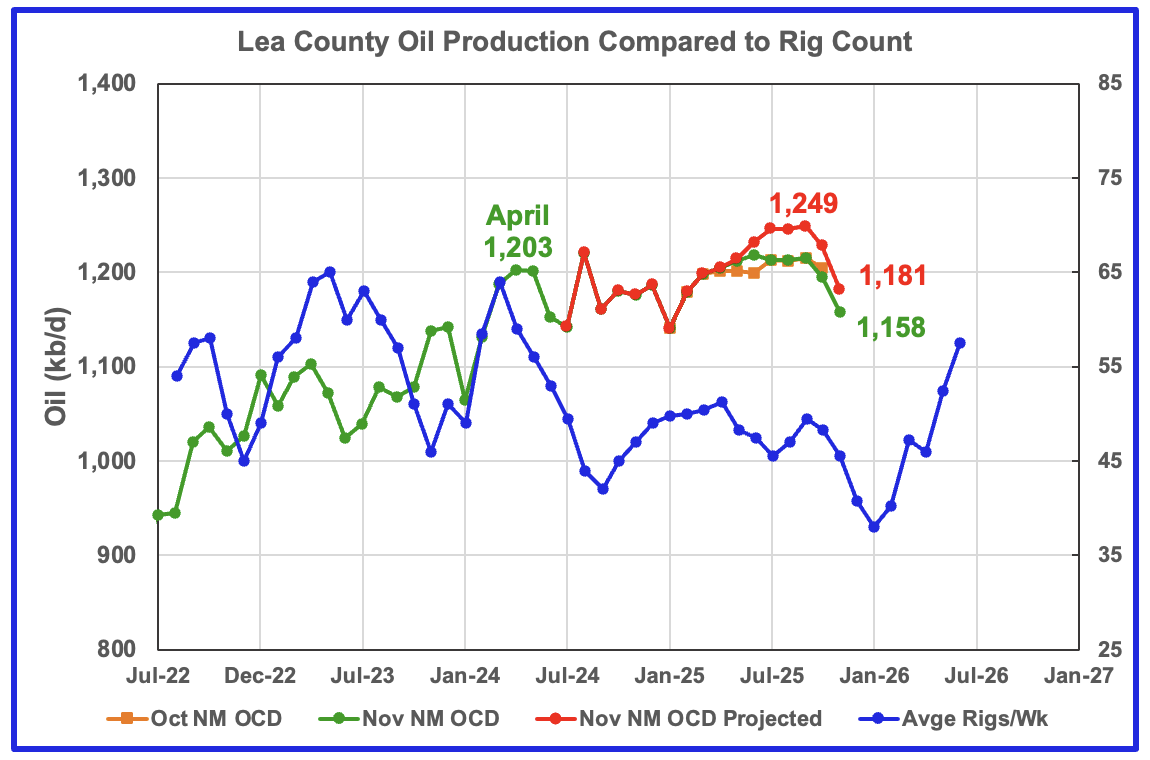
Lea County’s oil production started its plateau phase in April 2024 at 1,201 kb/d and it continued to September 2025. October and November are seeing production drops in both the projected and NM OCD’s production. November’s projected production is down by 68 kb/d from September’s 1,249 kb/d to 1,181 kb/d.
Preliminary November data from New Mexico’s Oil Conservation Division (OCD) indicates Lea County’s oil production dropped by 35 kb/d to 1,158 kb/d, green graph, and is a second indictor that production may be in decline in Lea County. The November production drop could be associated with the dropping rig count that starts in time shifted October 2025. This raises the question of whether the rising rig count starting in time shifted January 2026 could restore production to a new plateau phase.
The blue graph shows the average number of weekly rigs operating during a given month as taken from the weekly rig data. The rig graph has been shifted forward by 7 months. So the 64 Rigs/wk operating in August 2023 have been time shifted forward to March 2024 to show the possible correlation and time delay between rig count, completion and oil production.
Note that rig counts are being used to project production as opposed to completions because state completion data is not available. However completion data from the Drilling Productivity report below indicates that extra DUCs are being completed in the Permian at this time.
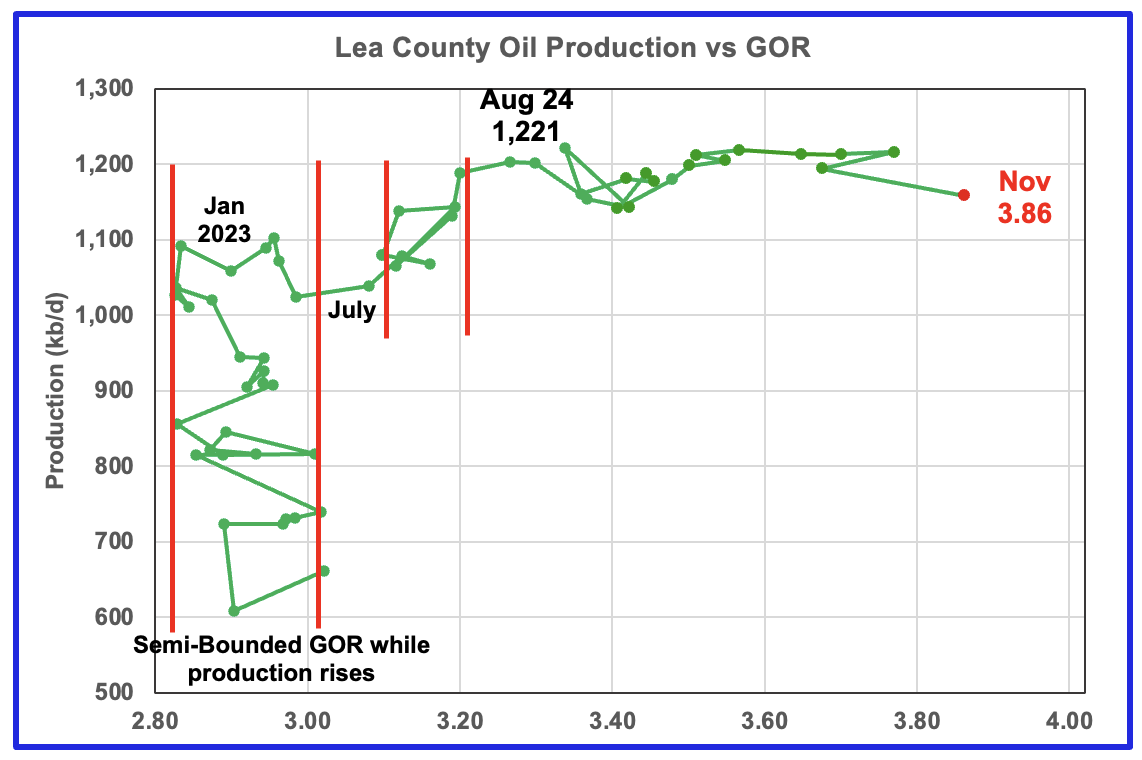
After much zigging and zagging, oil production in Lea county stabilized just below 1,100 kb/d in early 2023. Once production reached a new high in January 2023, production appeared to be on a plateau while the GOR started to increase rapidly to the right and first entered the bubble point phase in July 2023.
Since July 2023 Lea County’s production continued to increase as the GOR remained within a second semi-bounded region. This may indicate that additional production was coming from an oilier part of a layer since the GOR’s behaviour since August 2023 to March 2024 time frame appears once again to be in a second semi bounded GOR phase accompanied with rising production.
The GOR moved out of the second semi-bounded GOR region in April 2024 and production hit a new high of 1,221 kb/d August. From August 2024 to February 2025 the GOR was range bound between 3.34 and 3.48 but from March 2025 to November 2025 the GOR has risen every month, except for one, to hit new highs. November saw both a production drop to 1,158 kb/d and the GOR increase to a record 3.86.
This zigging and zagging GOR pattern within a semi-bounded GOR while oil production increases to some stable level and then moves out to a higher GOR to the right has shown up in a number of counties. See a few additional cases below. The rising GOR to new highs and dropping oil production in Lea county is an early indicator that production may be entering a declining phase.
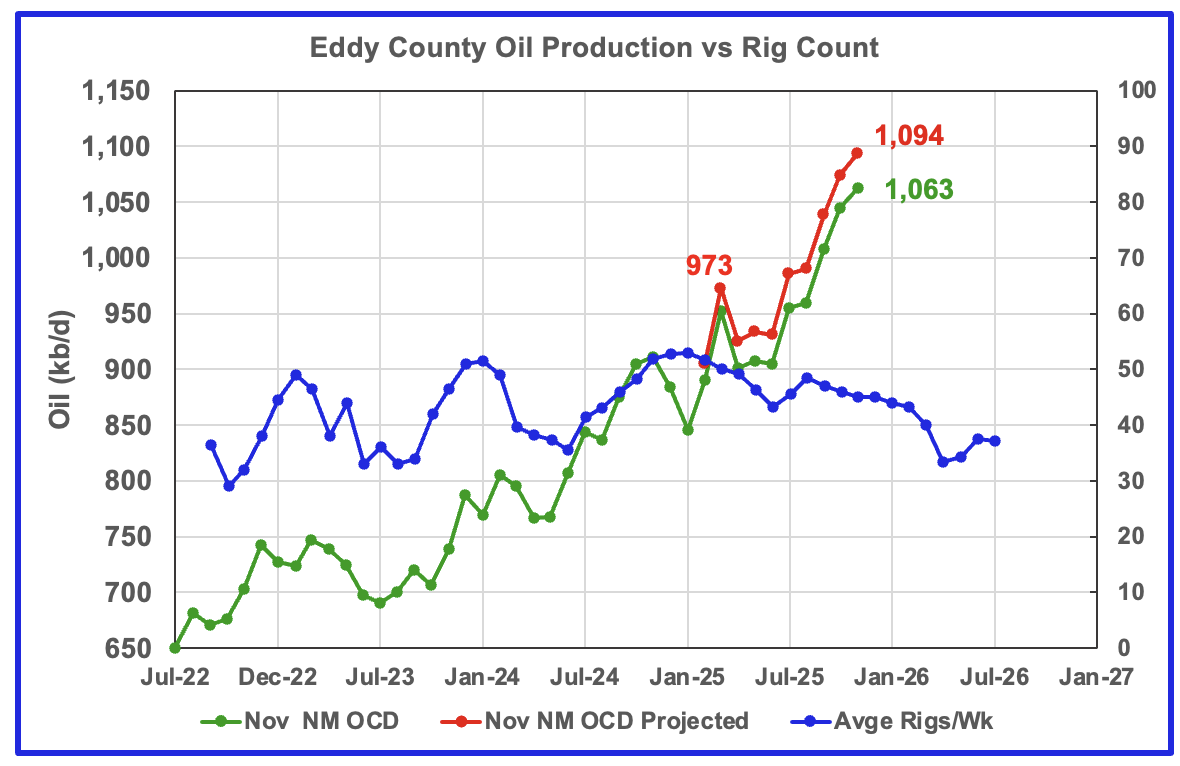
November’s projected oil production increased by 20 kb/d to 1,094 kb/d, a new high while preliminary production from the NM OCD also increased by 18 kb/d to 1,063 kb/d. Eddy county’s month over month production updates are very few and small and primarily occur in the last two or three months which indicates their preliminary production is very close to final. This month’s updates/revisions again were minimal.
Note that from June 2025 to October 2025, projected production in Eddy County increased by 146 kb/d. The November increase was relatively small compared to previous months.
The rising production could be linked to the increasing rig count starting in time shifted June 2025. However the rig count for September and October and going forward is dropping while production continues to rise. This implies that Eddy County has been drilling in some very productive areas or been completing extra DUCs or drilling longer laterals beyond three miles.
The blue graph shows the average number of weekly rigs operating during a given month as taken from the above weekly drilling chart. The rig graph has been shifted forward by 8 months to roughly coincide with the increase in the production graph starting in November 2023.
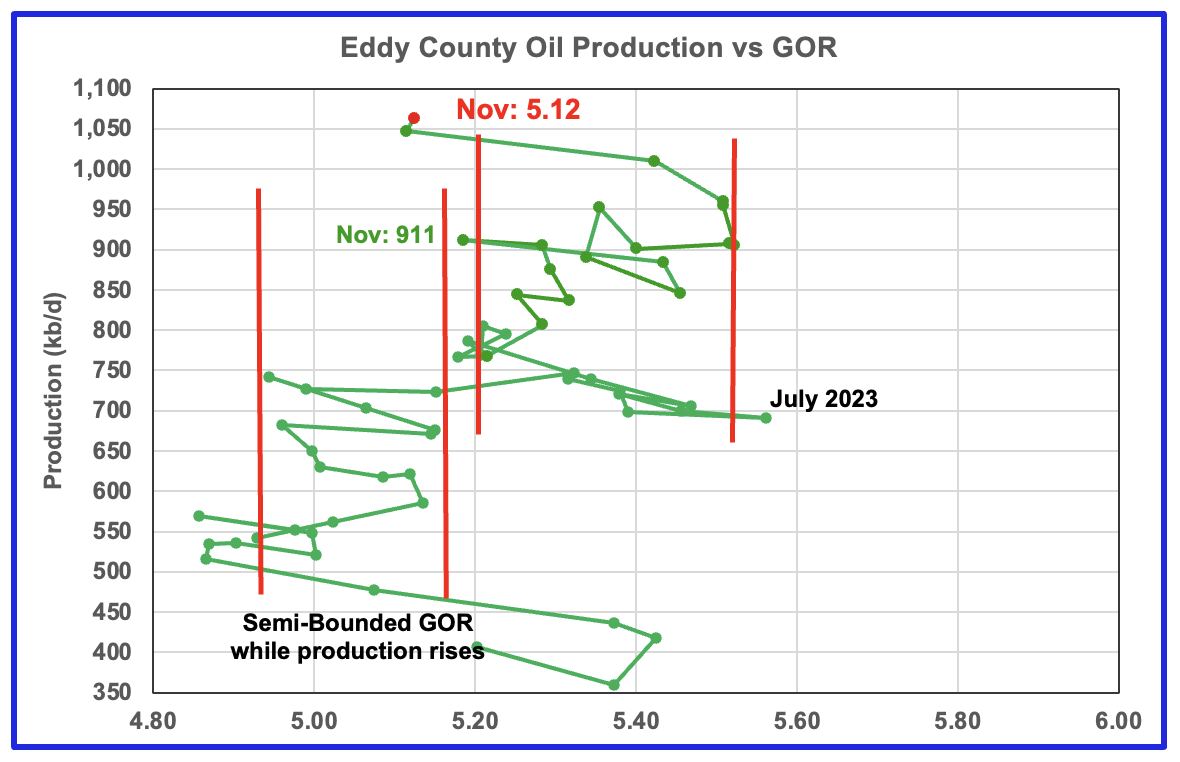
The Eddy county GOR pattern is similar to Lea county except that Eddy broke out from the first semi bounded range earlier and then added a second wider semi-bounded GOR phase. For November New Mexico’s Oil Conservation Division (OCD) reported preliminary oil production increased by 16 kb/d to 1,063 kb/d while the GOR rose slightly to 5.12 and remained within the first Semi-Bounded GOR range.
Texas Permian
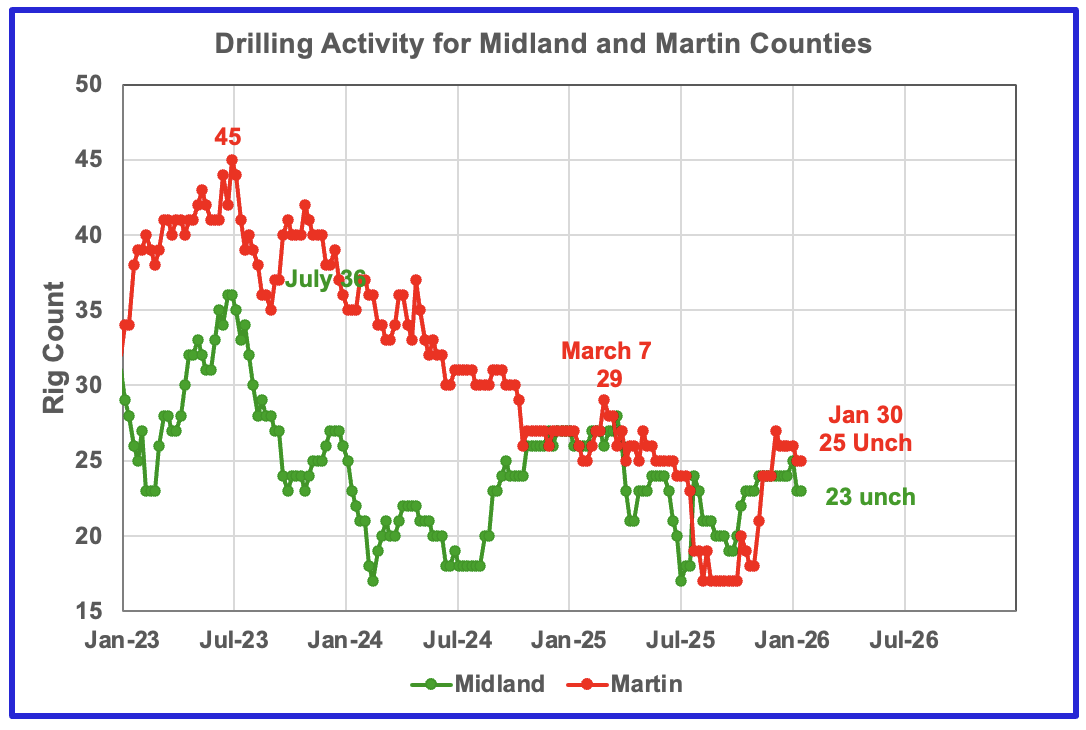
The rig counts in both Midland and Martin counties have decreased over the past few months. Martin dropped 2 rigs to 25 in January after adding rigs in October, November and December while Midland dropped 2 to 23 in January.
Oil Production in Primary Permian Texas’ Counties
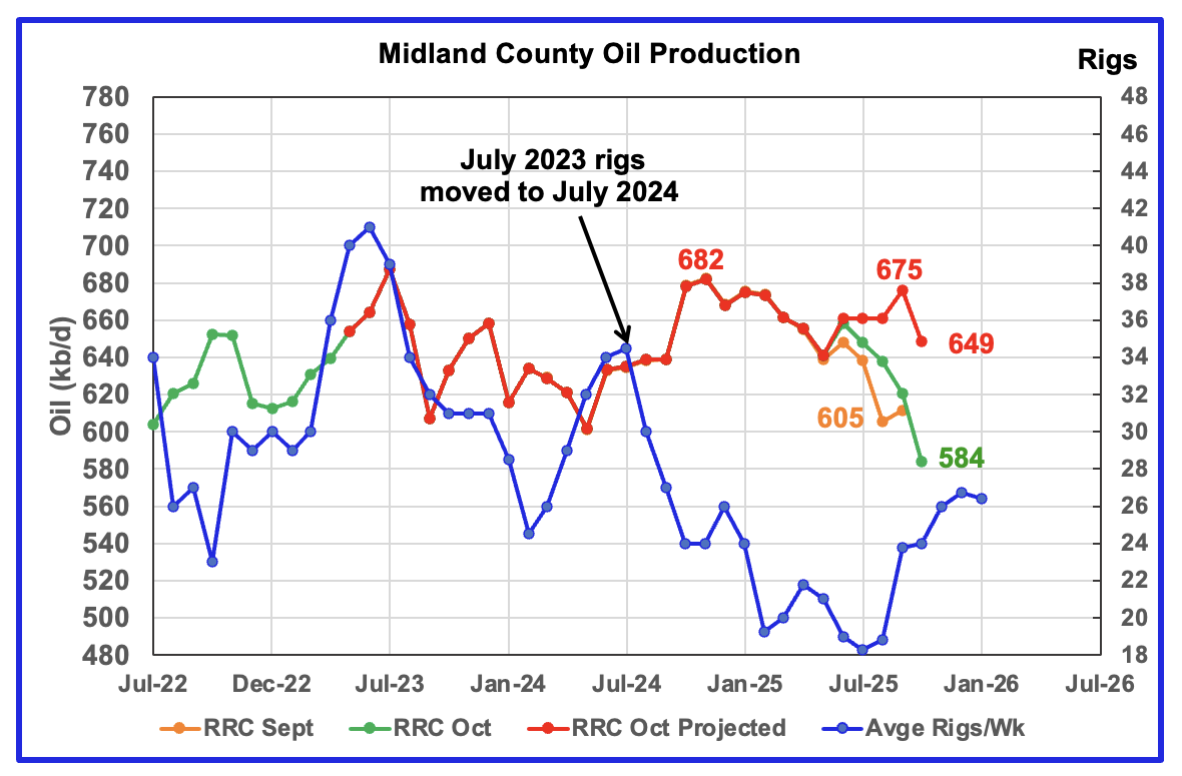
Comparison chart from the October report.
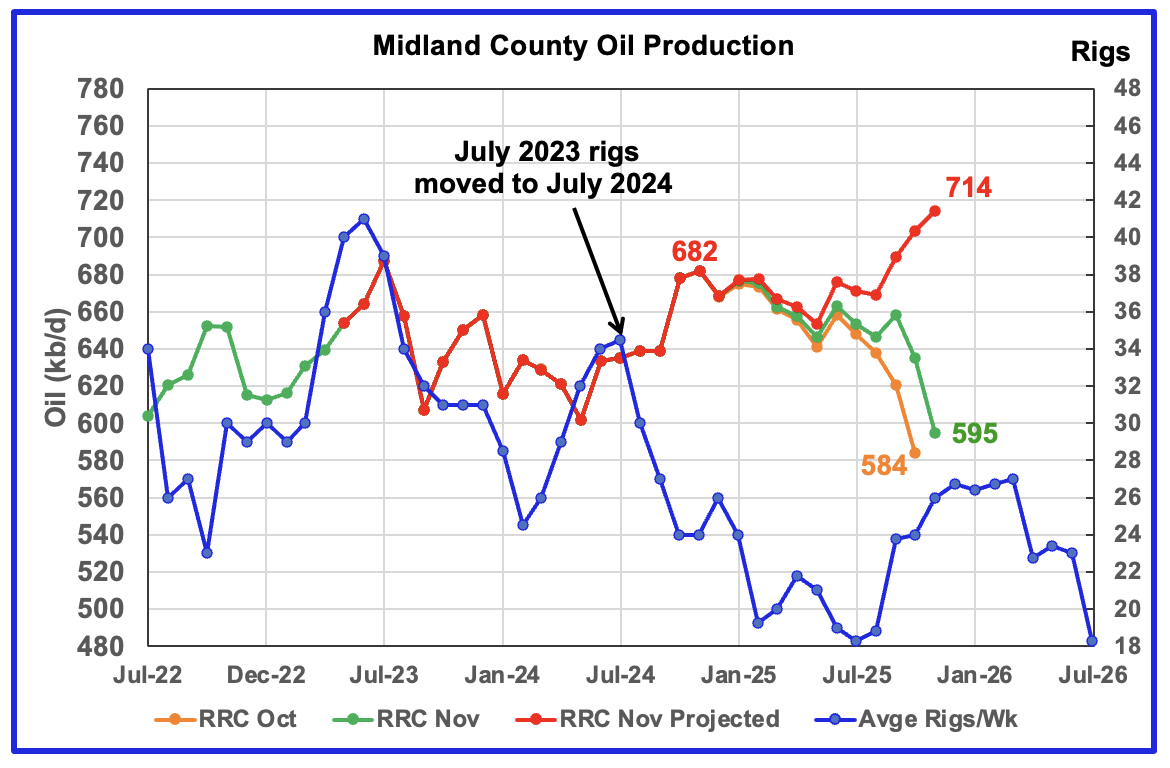
November’s projected production rose by 10 kb/d to 714 b/d. I think November’s projected production looks a bit optimistic, see comparison chart above. A more realistic production projection for November would be in the 690 kb/d to 700 kb/d range.
Compare the gap between the orange and green graphs in this chart with the previous comparison chart. Production revisions after August in the current chart are much larger than the comparison chart, increasing the probability that the projection may be optimistic. The projection is indicting Midland may be in a slowing rising productopm phase. The rise could be associated with the increasing rig count that started in time shifted September 2025.
The orange and green graphs show preliminary oil production for Midland County as reported by the Texas RRC for October and November. The red graph uses October and November data to project production as it would look after being updated over many months.
The blue graph shows the average number of weekly rigs operating during a given month as taken from the weekly drilling chart. The rig graph has been shifted forward by 12 months to better align with production. So the average 34.5 Rigs/wk operating in July 2023 have been moved forward to July 2024 to show the possible correlation and time delay between rig count, completions and oil production.
The 12 month rig time shift is much larger than the typical six to eight months used in other counties. It is not clear why there should be such a difference. Last month I noted: “It is surprising how the large jump of 6 rigs/wk from time shifted July 2025 to October 2025 only manages to keep production flat.” Maybe not. Production may have started to catch up since it is rising.
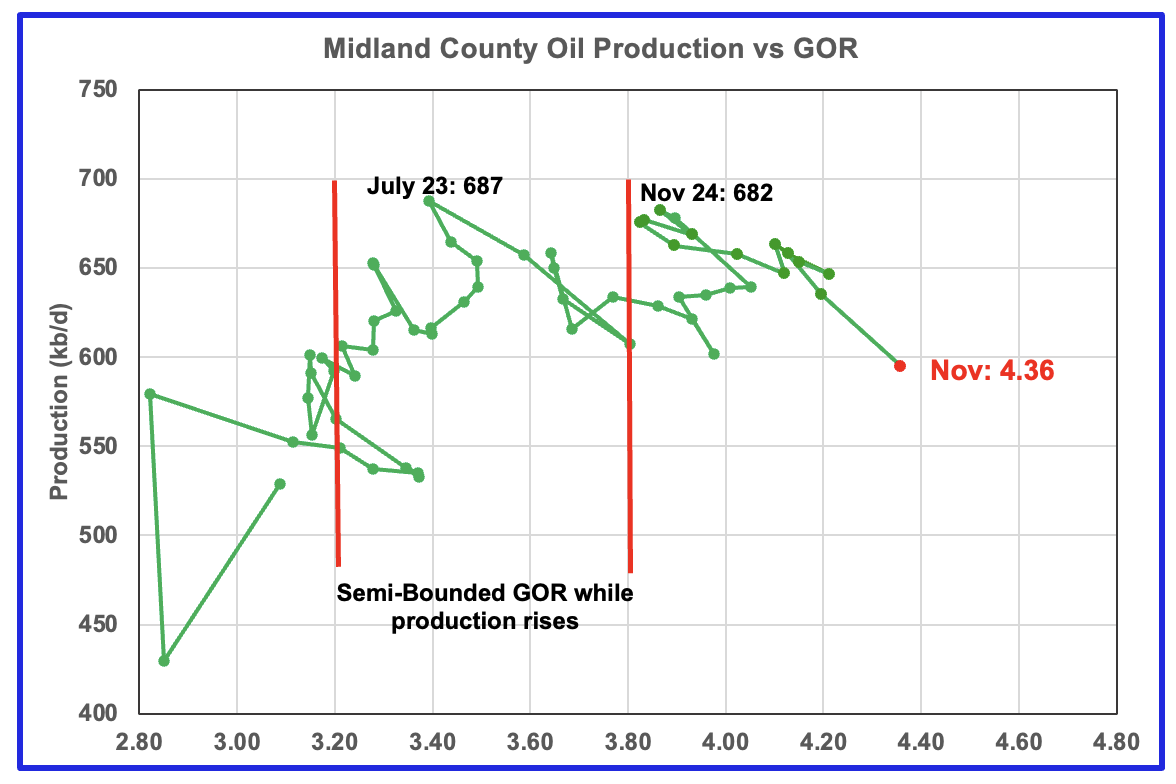
For November the Midland GOR ratio rose to 4.36 from 4.20 in October while the reported preliminary oil production dropped by 40 kb/d to 595 kb/d.
When Midland county GOR initially moved into the bubble point phase, oil production and the GOR stayed within a narrow GOR range of 3.8 to 4.0 outside of the initial Semi-Bounded GOR region from March 2024 to March 2025. However after March, the April to October 2025 GORs broke out to new highs. The November GOR rose to a new high of 4.36. The rising GOR is another indicator that Midland County is approaching its peak production.
The oil production and GOR data shown in this chart are based on the RRC’s November preliminary production report.
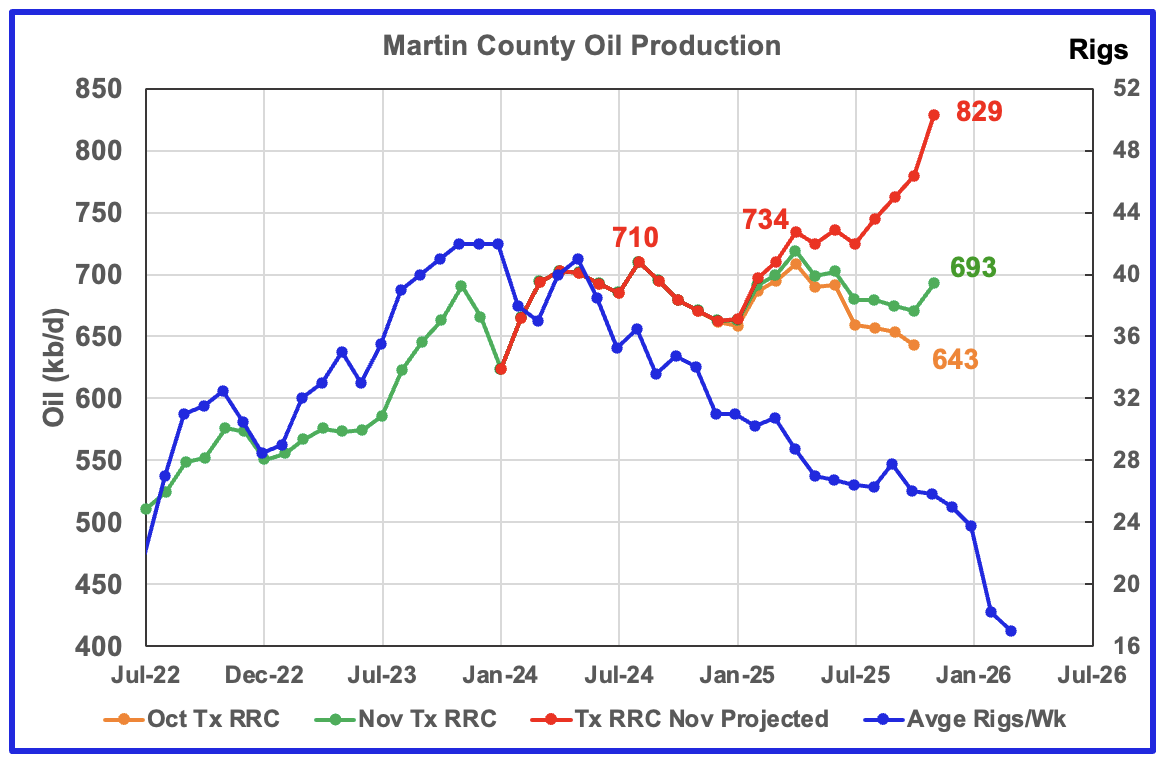
Martin county’s projected November oil production rose by 50 kb/d to 829 kb/d. I think November’s projected production is a bit optimistic and a more realistic level would be somewhere between 750 kb/d and 775 kb/d. The November projected production is optimistic because the MoM updates, the gap between the orange and green graphs, are larger than in previous months over the last three to four months.
The August 2024 and April 2025 peaks are close to 710 kb/d and 734 kb/d respectively. Considering the falling rig count and projecting the production rise from August 2024 to April 2025, 750 kb/d to 775 kb/d seems like a more reasonable estimate for November production.
The red graph is a projection for oil production as it would look after being updated over many months. This projection is based on a methodology that uses preliminary October and November production data.
The orange and green graphs show production for Martin County as reported by the Texas RRC for October and November. The blue rig graph time shifts the rig count forward by 6 months.
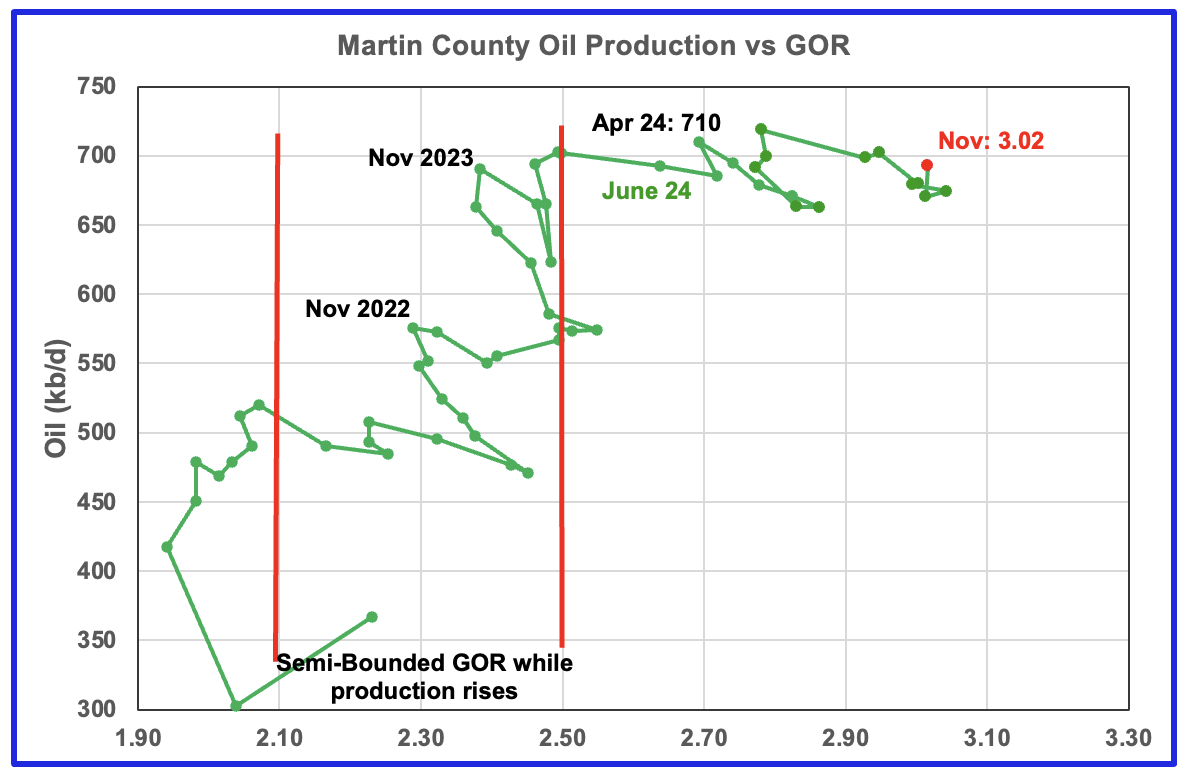
Martin county’s oil production after November 2022 increased and at the same time drifted to slightly higher GORs within the semi bounded range. However the June 2024 GOR saw its first move out of the semi bounded region. The RRC’s preliminary November 2025 production for Martin County shows a 23 kb/d increase accompanied by a negligible increase to the GOR to 3.02.
Martin county has the lowest semi-bounded GOR boundary of the four counties at a GOR of close to 2.50. The November GOR is now clearly out of the semi-bounded region. Martin County has now entered the bubble point phase that should result in a slowing oil production rise.
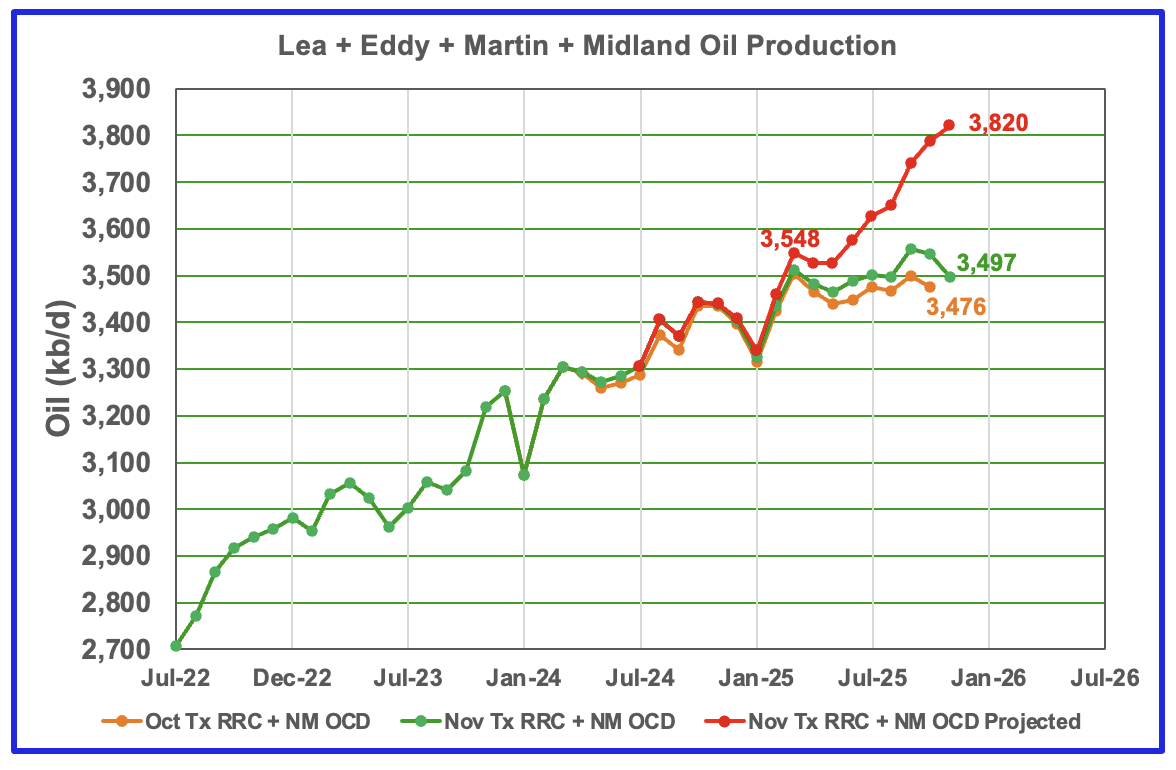
This chart shows the total oil production from the four largest Permian counties. Assuming current Permian production is close to 6,600 kb/d, these four counties account for 58% of the total. November’s projected production increased by 33 kb/d to 3,820 kb/d and is the sixth consecutive month showing increasing production.
The production projection is too optimistic by orders of 100 kb/d. November’s production should be closer to 3,700 kb/d. It is too optimistic due the under reported production for September and October 2025 in the last report, the gap between the green and orange graphs. The main source for real production growth has been Eddy County.
The October and November initial production data are shown in the orange and green graphs respectively. The red graph uses the September and October production data to project a more realistic estimate for the final updated November production.
Findings
– The preliminary November production data for New Mexico is OK. The Texas RRC’s November production data had MoM revisions showing October production was under reported that resulted in optimistic November projections.
– Lea county entered its plateau phase in May 2024. While oil production is not following the rig count graph directly, the dropping rig count has resulted in Lea County production being in a steady flat plateau phase up to September 2025. However October and November had production drops. Lea has entered a declining phase that could enter a lower level plateau phase as the rig count begins to increase.
– July to October production in Eddy County saw a steady increase to a record high of 1,078 kb/d and is possibly signalling the beginning of a short increasing production phase. While November projected production increased, it was smaller than previous monthly increases and may be indicating a slowing growth phase going forward.
– Updated November Texas RRC production indicates that Midland County’s projected production was optimistic. A more realistic production projection for November would be in the 690 kb/d to 700 kb/d range. The addition of six new rigs to Midland county in real August 2025 to 24 from 18 was an unexpected surprise and makes one wonder what it implies for Midland county oil production going forward after allowing for a rig count/production delay.
– Martin’s county November projected production is a bit optimistic and a more realistic level would be somewhere between 750 kb/d and 775 kb/d.
Texas District 8
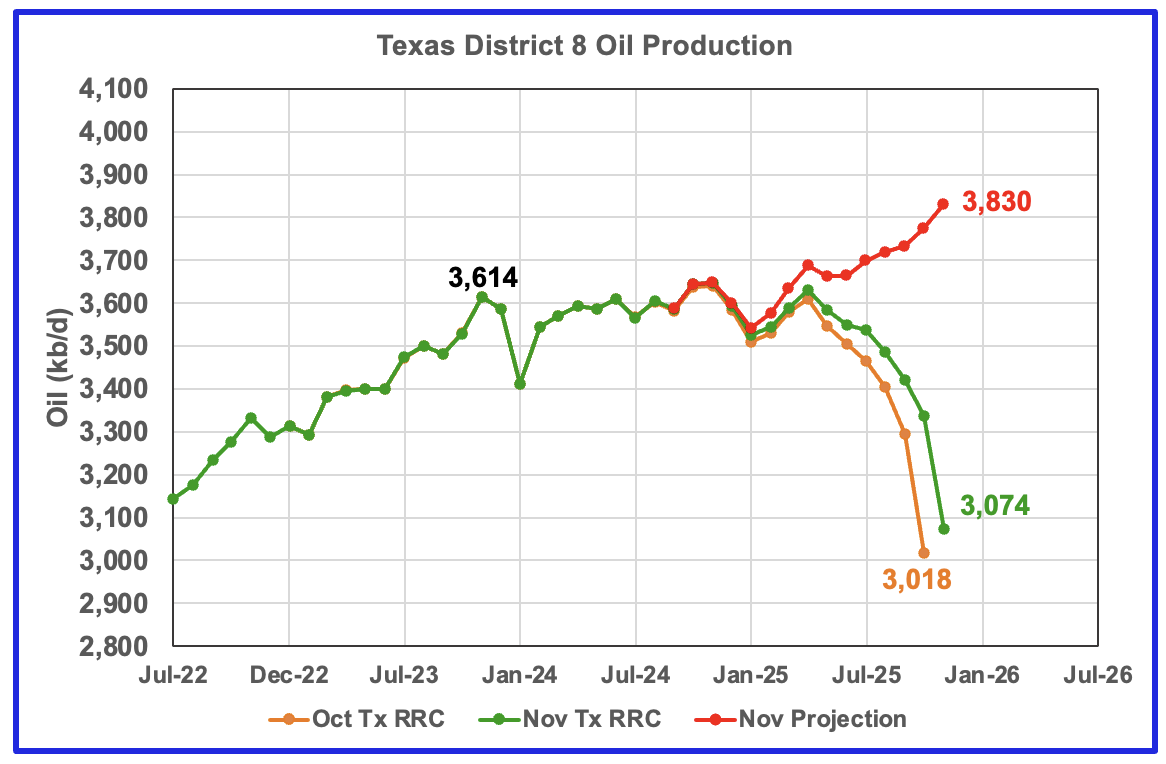
The District 8 projected production chart is too optimistic due to under reporting of September and October production. October production was revised up from 3,018 kb/d to 3,337 kb/d, an increase of 319 kb/d. A more typical increase is closer to 200 kb/d. Notice that all the three green peaks are close to 3,600 kb/d which may be indicating an upcoming plateau phase.
November’s projected production and a few previous months should be in the 3,600 kb/d to 3,700 kb/d range.
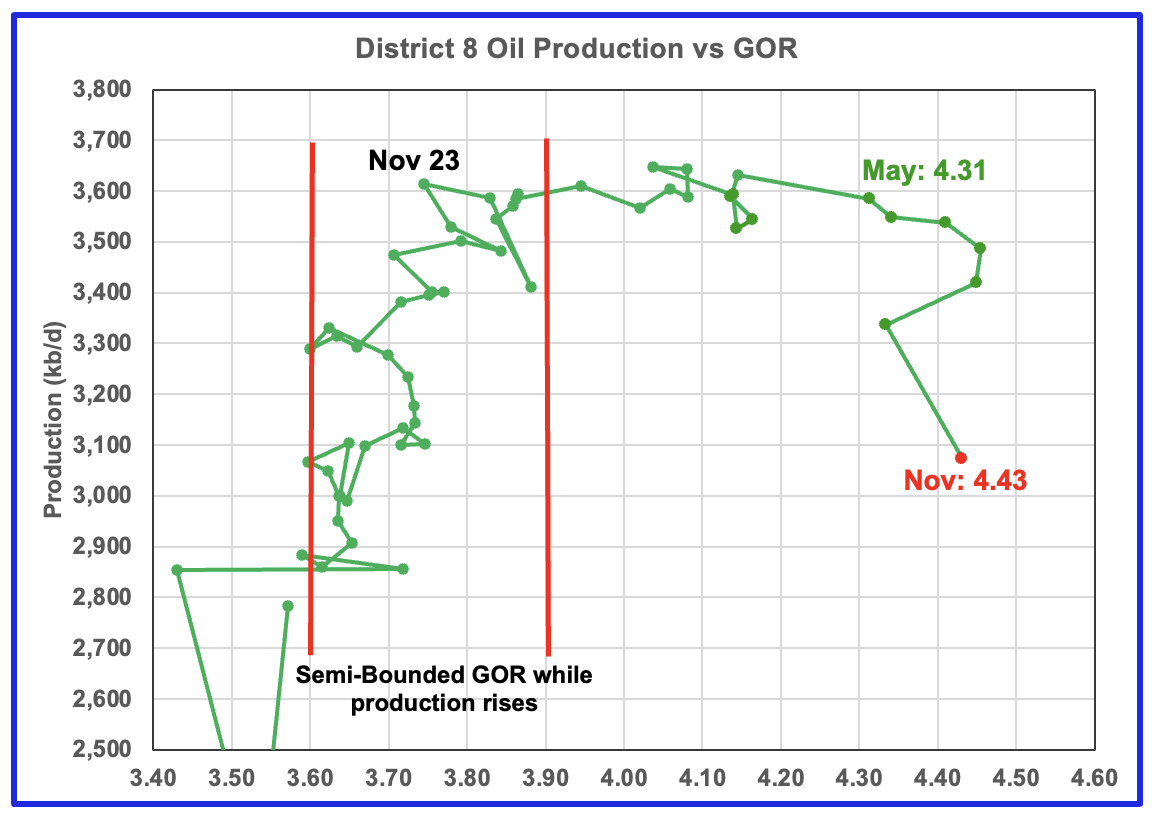
Plotting an oil production vs GOR graph for a district may be a bit of a stretch. Regardless here it is and it seems to indicate many District 8 counties may well be into the bubble point phase. The November GOR increased to 4.43 as the preliminary RRC production took a large drop of 262 kb/d to 3,074 kb/d.
The District 8 preliminary production chart continues to show dropping production and a steady GOR around 4.40 since May 2025.
Oil Production and GOR Charts for Four of the Next Larger Texas Oil Counties
Texas November data appears to be OK data but the projections may be slightly optimistic because October production was under reported.
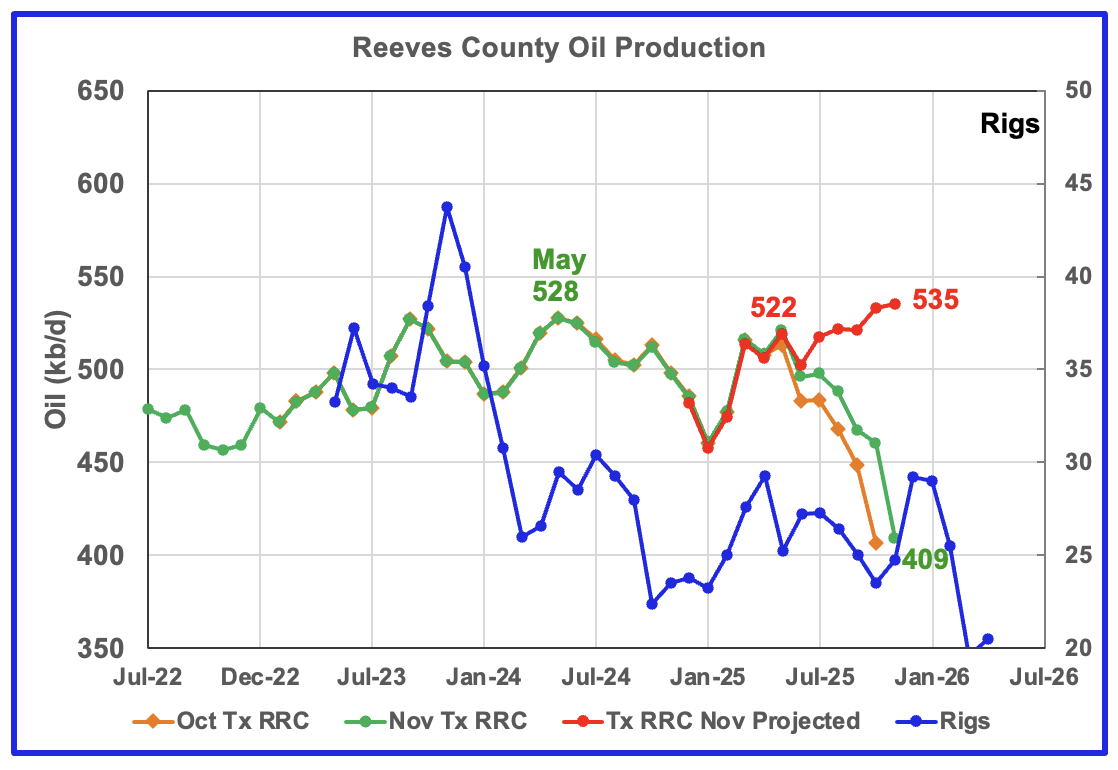
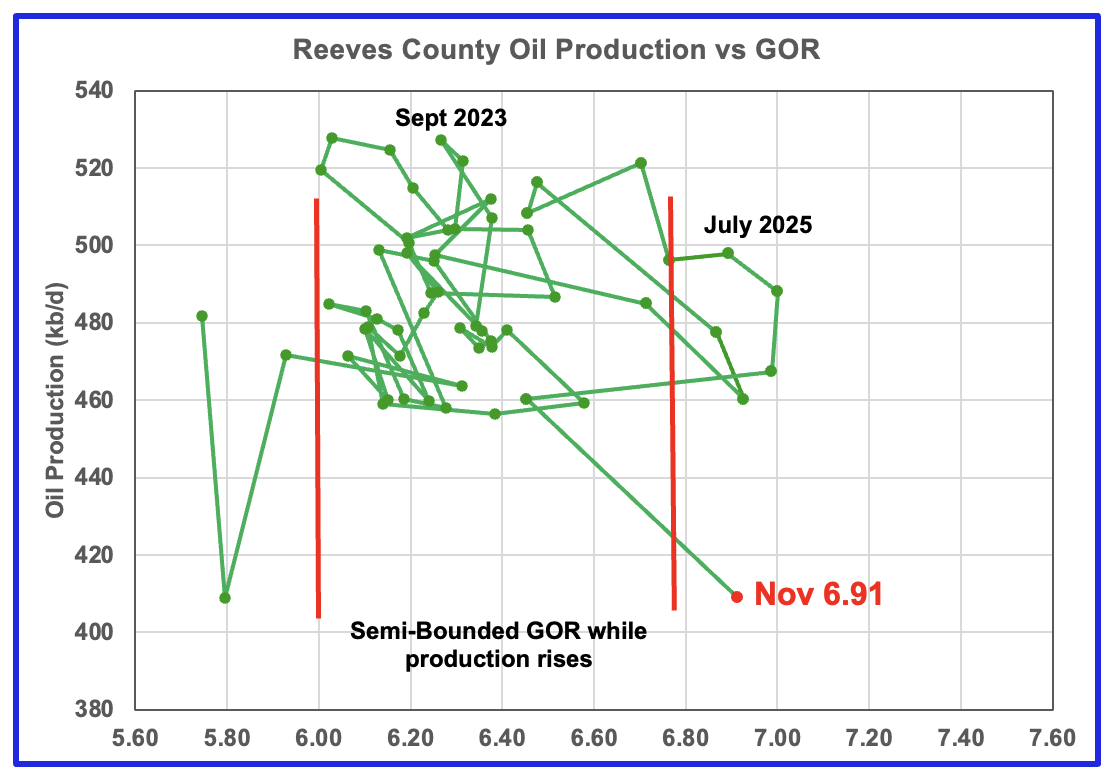
Reeves county GOR is high because it is the number one Texas county ranked by gas production. The current C + C production is almost split between crude and condensate, with condensate about 5% higher than crude. November’s projected production rose by 2 kb/d to 535 kb/d. I think the projected production is a bit optimistic because October production was under reported. I think it is closer to 520 kb/d and moving into a plateau phase.
Reeves County GOR first moved out of the Semi-Bounded region in July and popped back in October. It re-emerged in November.
The rig count is time shifted forward by 7 months.
In Real June 2025, 29 rigs were operational in Reeves county. By late January 2026 the rig count had dropped to 11. That is a large drop in 8 months.
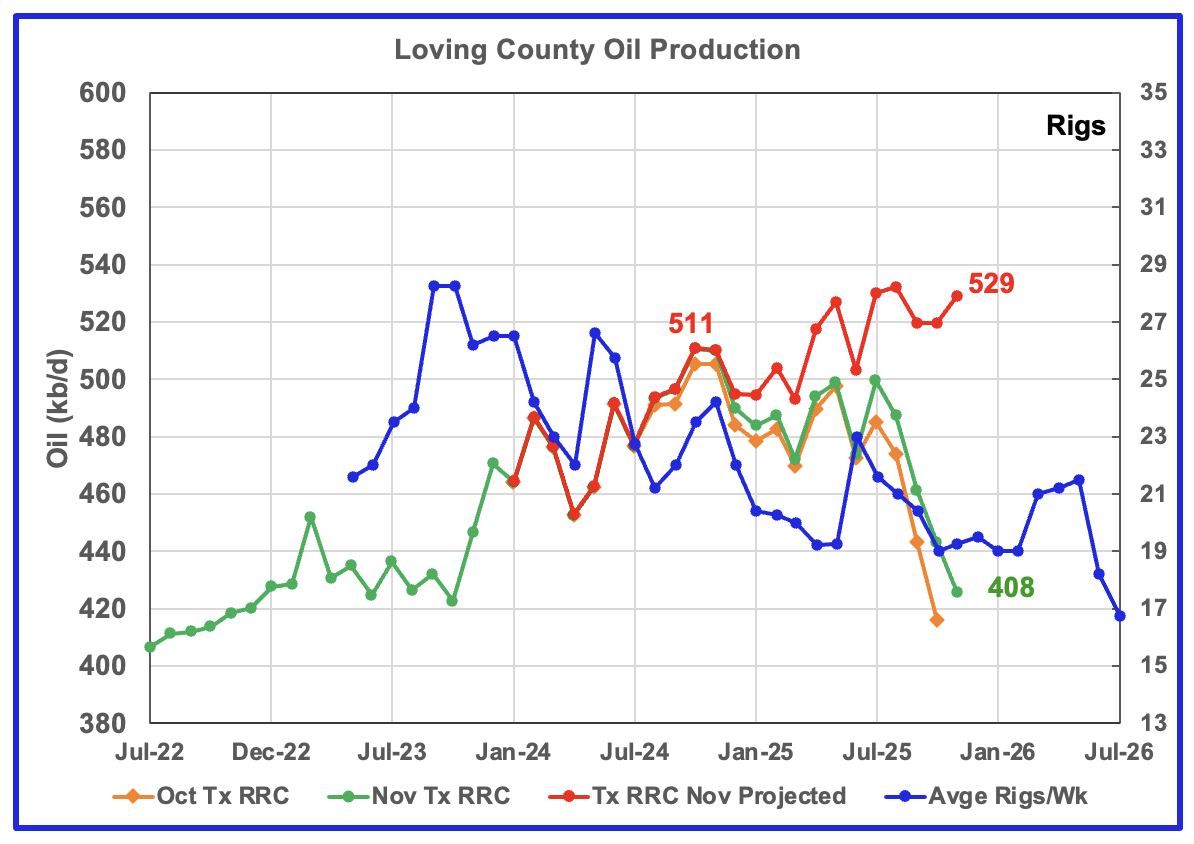
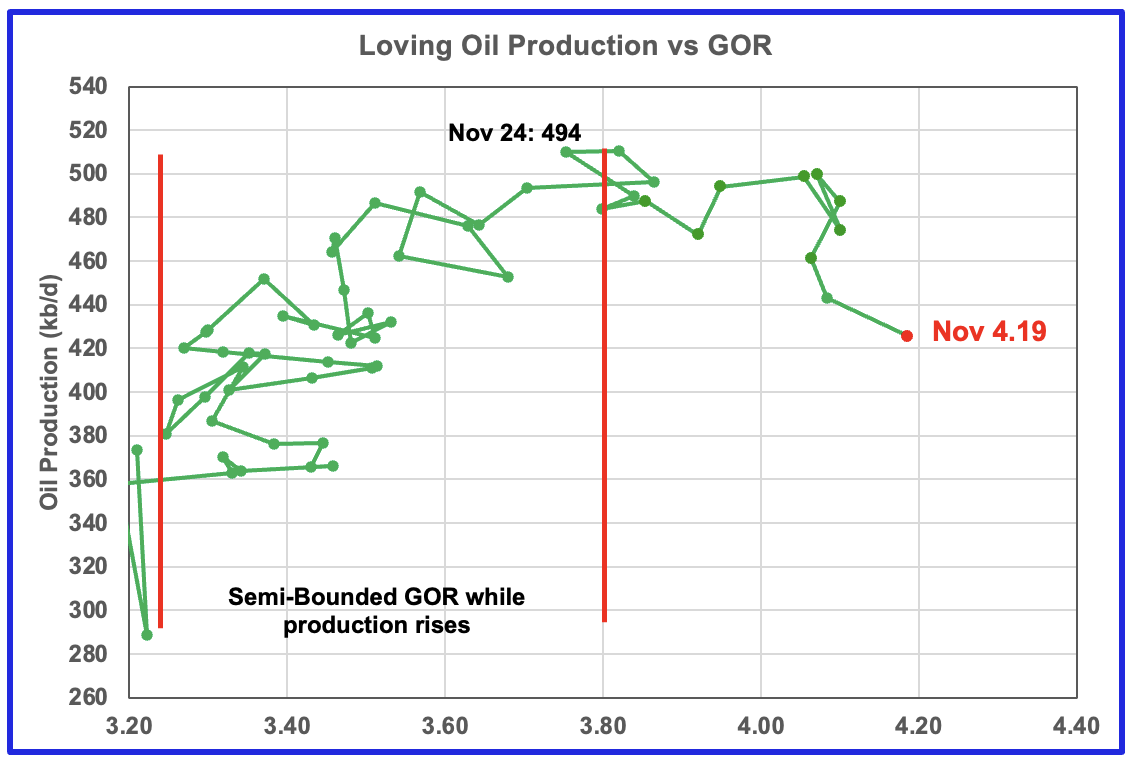
Loving’s projected production rose by 9 kb/d to 529 kb/d in November. Loving may be entering its plateau phase. For November, the GOR increased to 4.32, a new high.
While Loving had 19 operational rigs in real June, they jumped by 3 to 22 in real September and then dropped to 17 in late January.
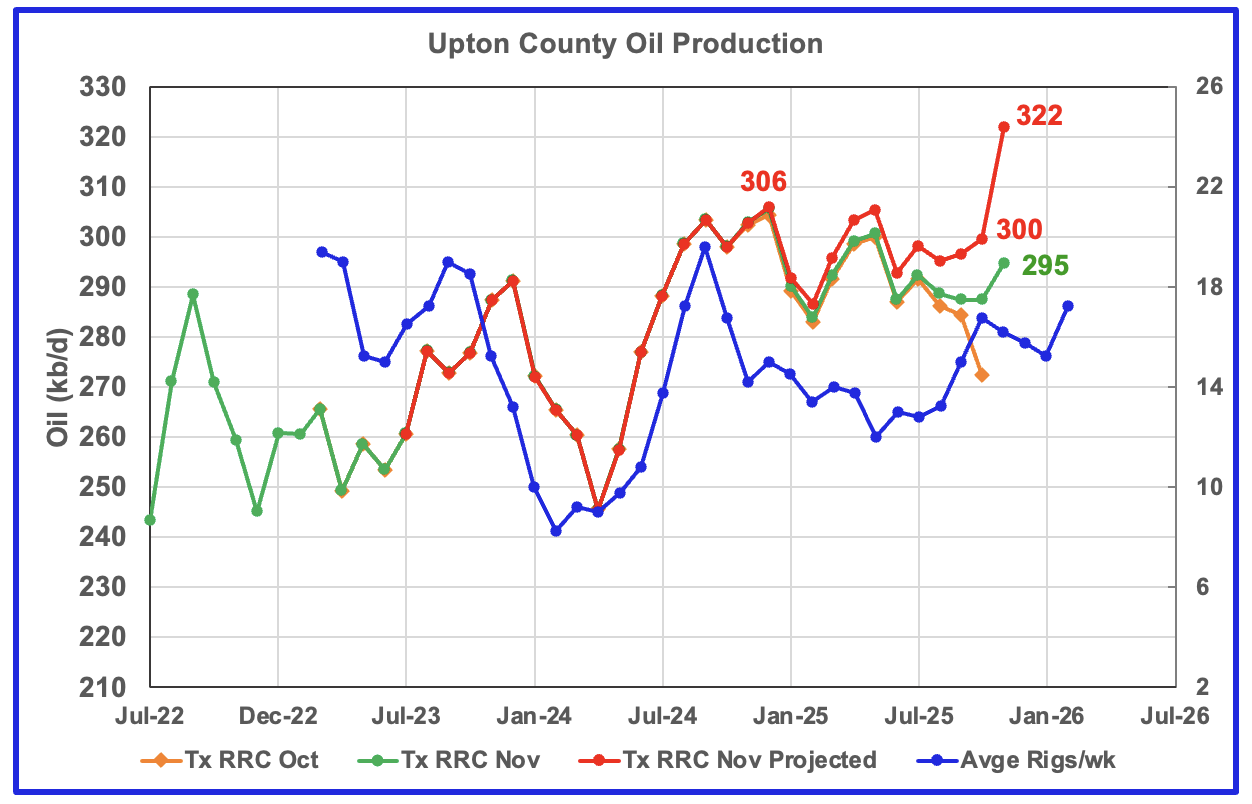
Upton’s projected November production rose by 22 kb/d to 322 kb/d. I think this projection is too optimistic because of the under reporting of October’s production, see sharp drop in the orange graph. A more realistic projection would be 310 kb/d.
For the next few months Upton County may see a production increase associated with the rising rig count which started in time shifted August 2025. A decline may begin in November/December.
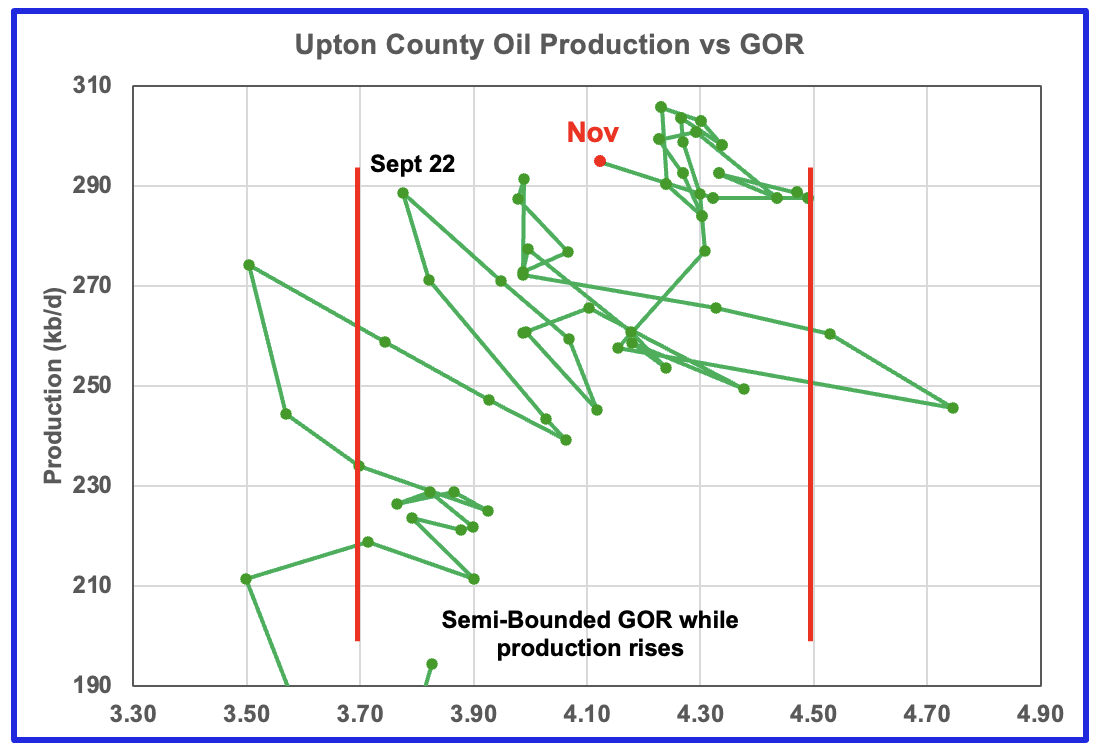
Upton’s GOR continues to stay within the Semi-Bounded region.
Upton’s rig chart has been time shifted forward by six months. Upton began the 2025 with 13 rigs. In real January 2026, 7.5 rigs were operating.
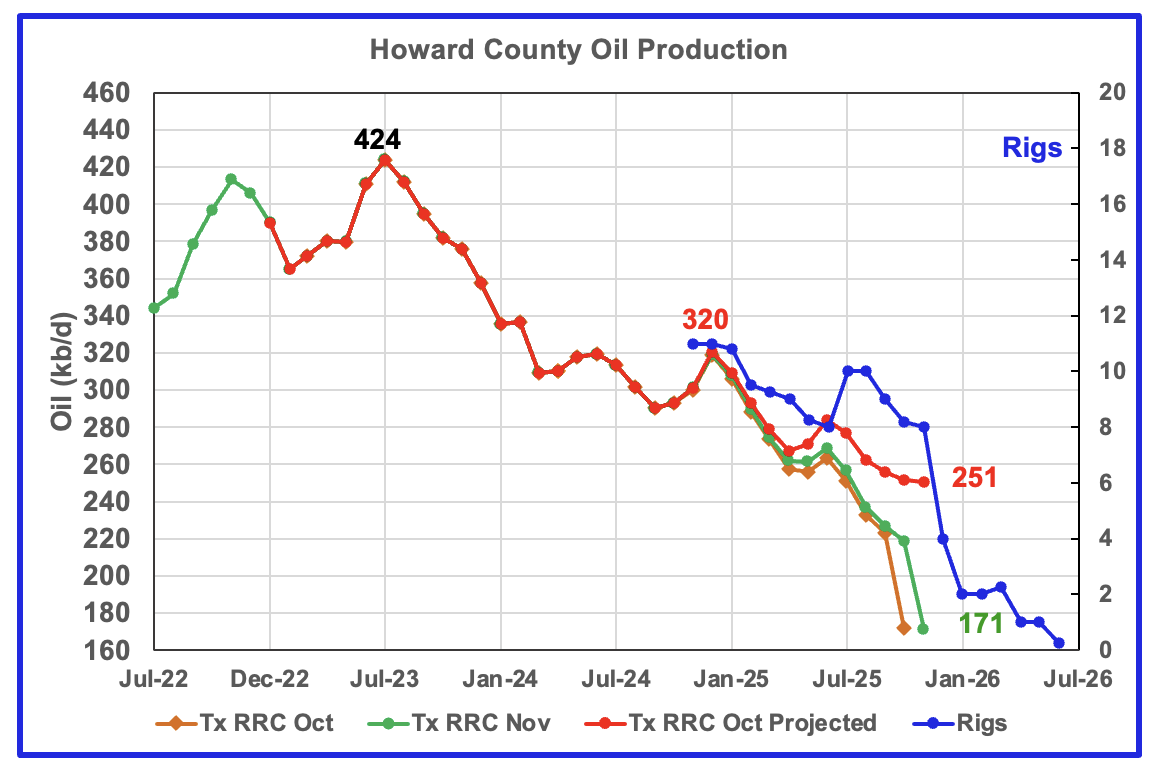
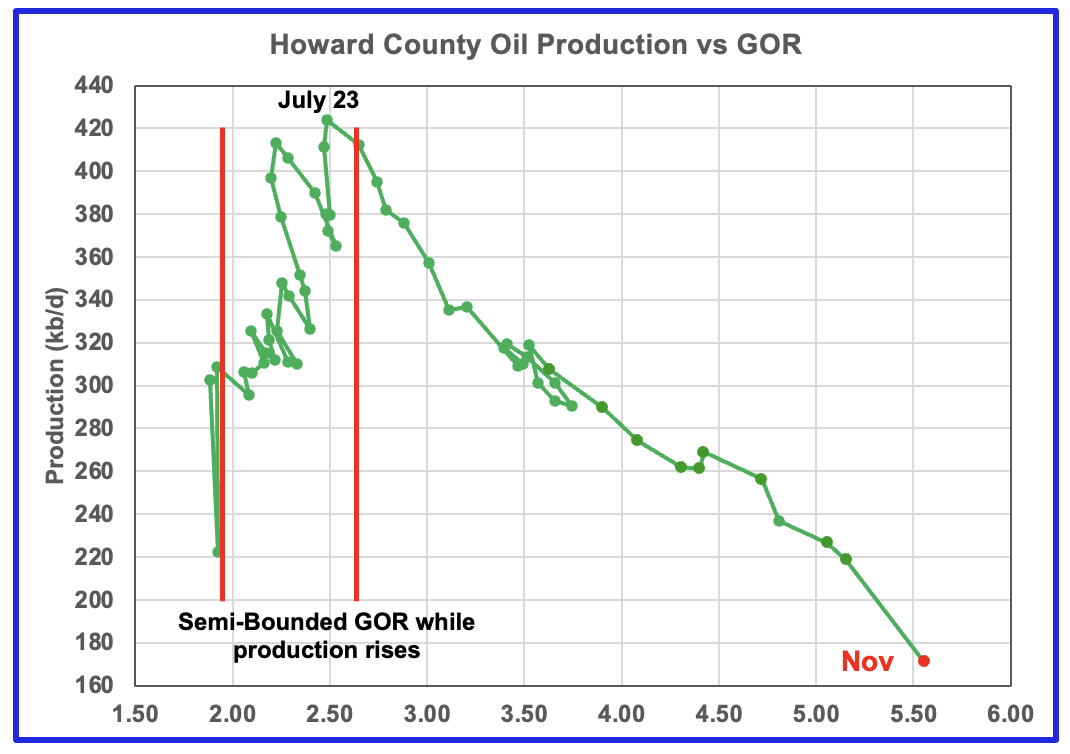
Howard County oil production peaked in July 2023 and has been in a slow decline ever since. The falling production has been falling along with the dropping rig count. In November the projected production dropped by 1 kb/d to 251 kb/d.
Note the rig count in time shifted June 2026 is 0.25, i.e. 1 rig for one week in real January 2026. The rig graph is time shifted forward by 5 months.
The GOR continues to increase as production drops. The GOR ratio reached a new high of 5.56 in November.
Drilling Productivity Report
The Drilling Productivity Report (DPR) uses recent data on the total number of drilling rigs in operation along with estimates of drilling productivity and estimated changes in production from existing oil wells to provide estimated changes in oil production for the principal tight oil regions. The new DPR report in the STEO provides production up to November 2025. The report also projects output to December 2026 for a number of basins. The DUC charts and Drilled Wells charts are also updated to November 2025.
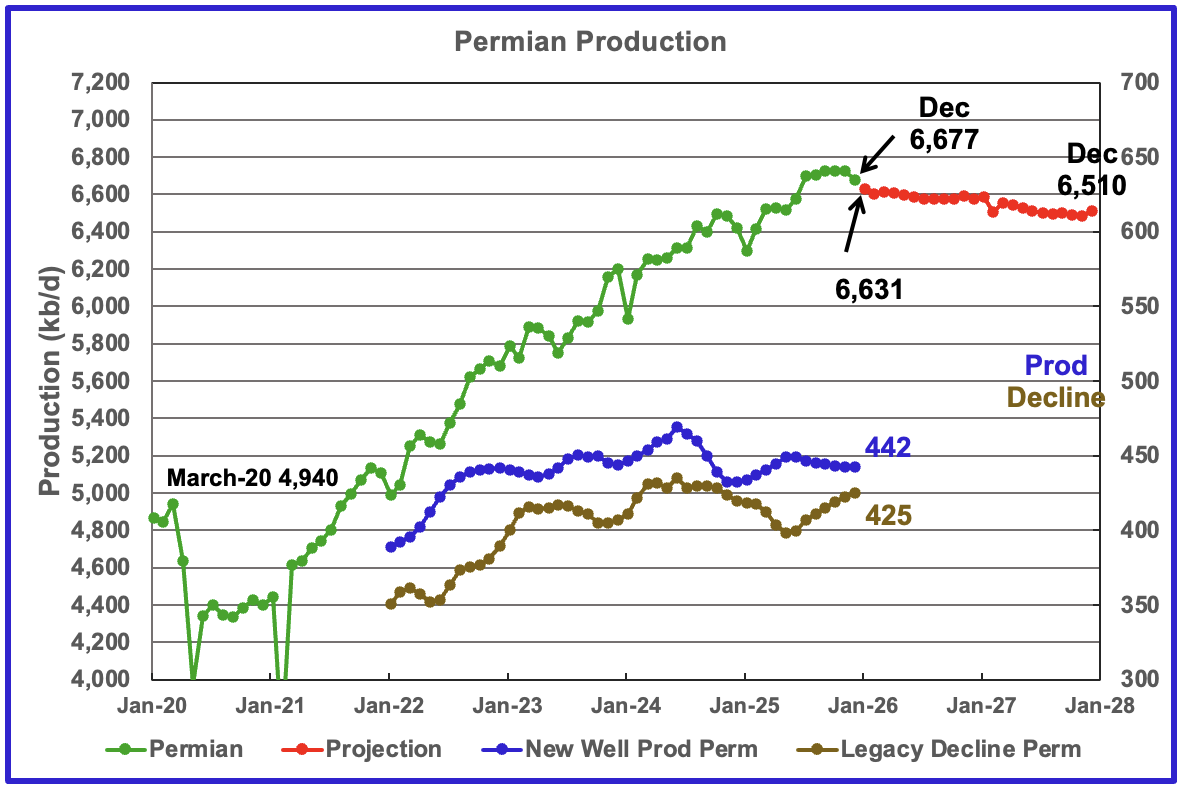
The EIA’s January STEO/DPR report shows Permian December output dropped by 50 kb/d to 6,677 kb/d. January is expected to drop an additional 46 kb/d to 6,631 kb/d. From February 2026 to January 2027 output will be essentially flat at 6,600 kb/d.
From December 2025 to December 2027 output is expected to drop by 167 kb/d to 6,510 kb/d.
Production from new wells and legacy decline, right scale, have been added to this chart to show the difference between new production and legacy decline.
These numbers reflect a one year production trend and provide the production contribution from new wells over a rolling 12-month period to determine if the rate of new production is increasing or decreasing compared to previous periods. If the new well production reported were instant, new well production should be lower than decline since December production is lower. The averaging process adds about a six month delay.
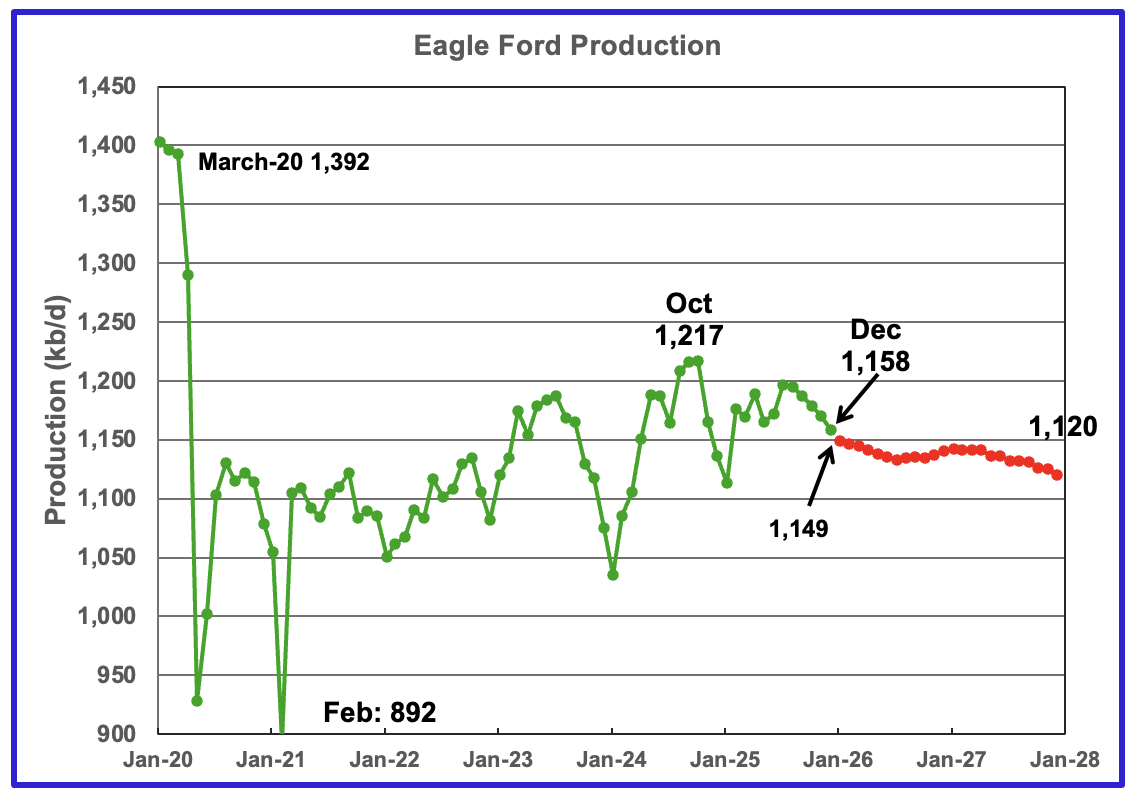
December’s output in the Eagle Ford basin decreased by 12 kb/d to 1,158 kb/d. January’s 2026 production is forecast to drop by 9 kb/d to 1,149 kb/d.
Output in December 2027 expected to be 1,120 kb/d down 38 kb/d from December 2025.
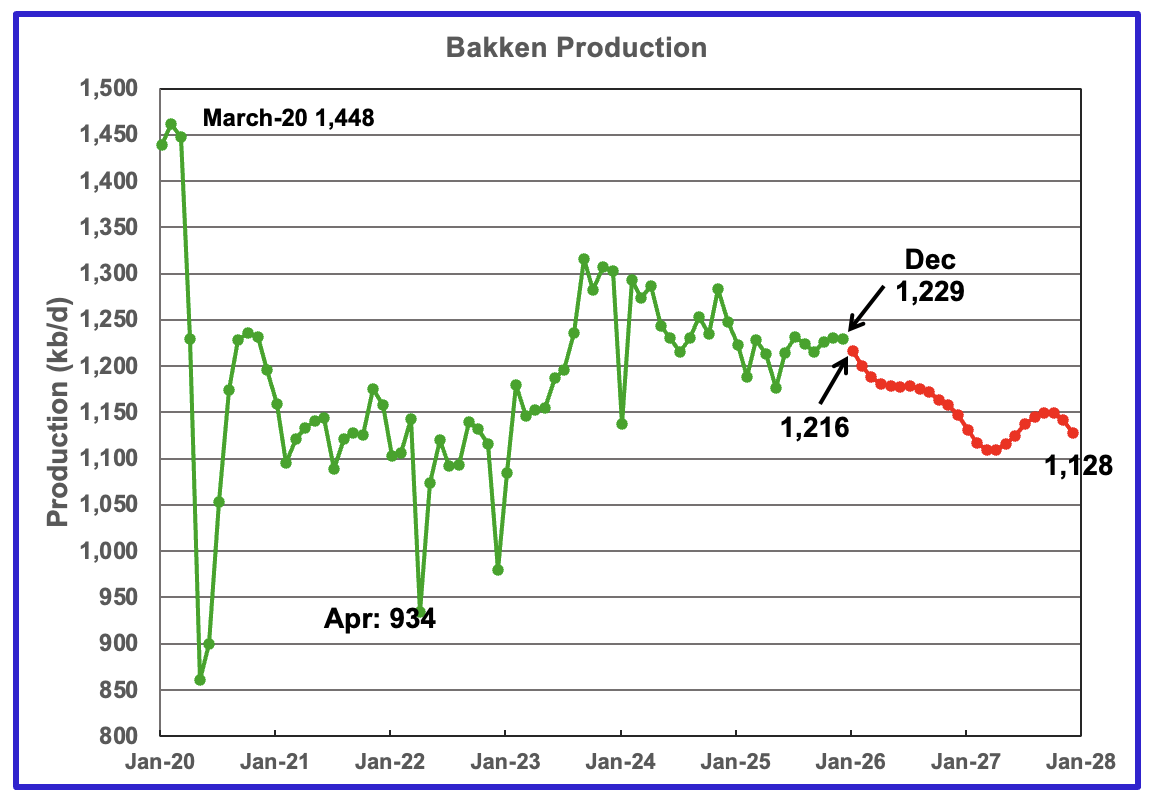
The DPR/STEO reported that Bakken’s December output dropped by 1 kb/d to 1,229 kb/d. January 2026 production is expected to decrease by 13 kb/d to 1,216 kb/d. The STEO/DPR projection, red markers, shows output dropping to 1,128 kb/d in December 2027.
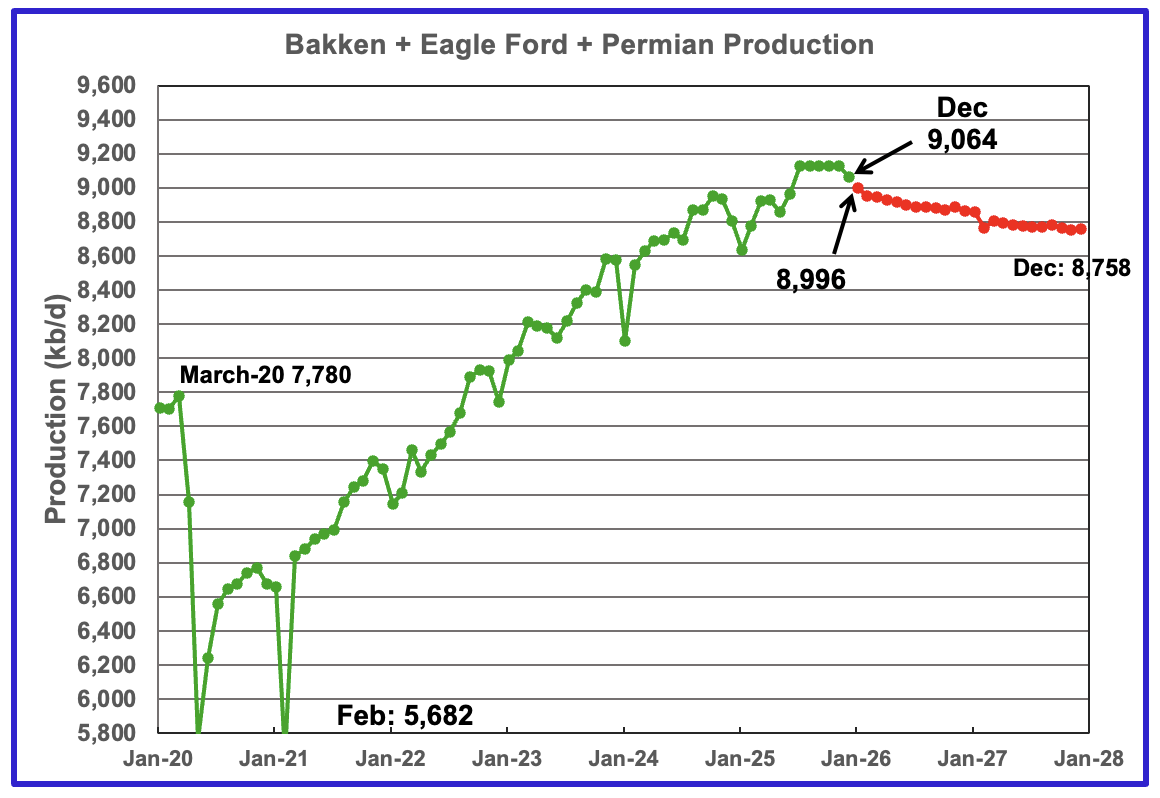
This chart plots the combined production from the three main LTO regions. For December output decreased by 64 kb/d to 9,064 kb/d. Production for December 2027 is forecast to be 8,758 kb/d.
DUCs and Drilled Wells
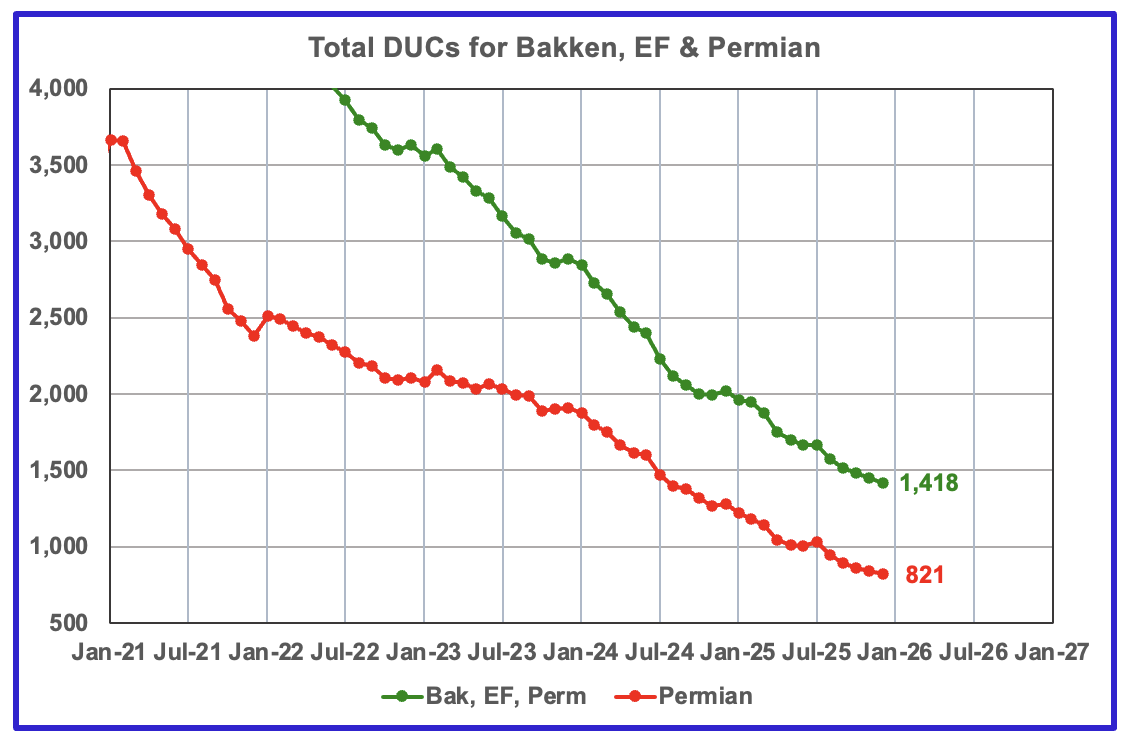
The number of DUCs available for completion in the Permian and the three major DPR regions has returned to a dropping trend. December’s DUC count for the three basins dropped by 31 to 1,418. In the Permian the DUC count dropped by 21 to 821.
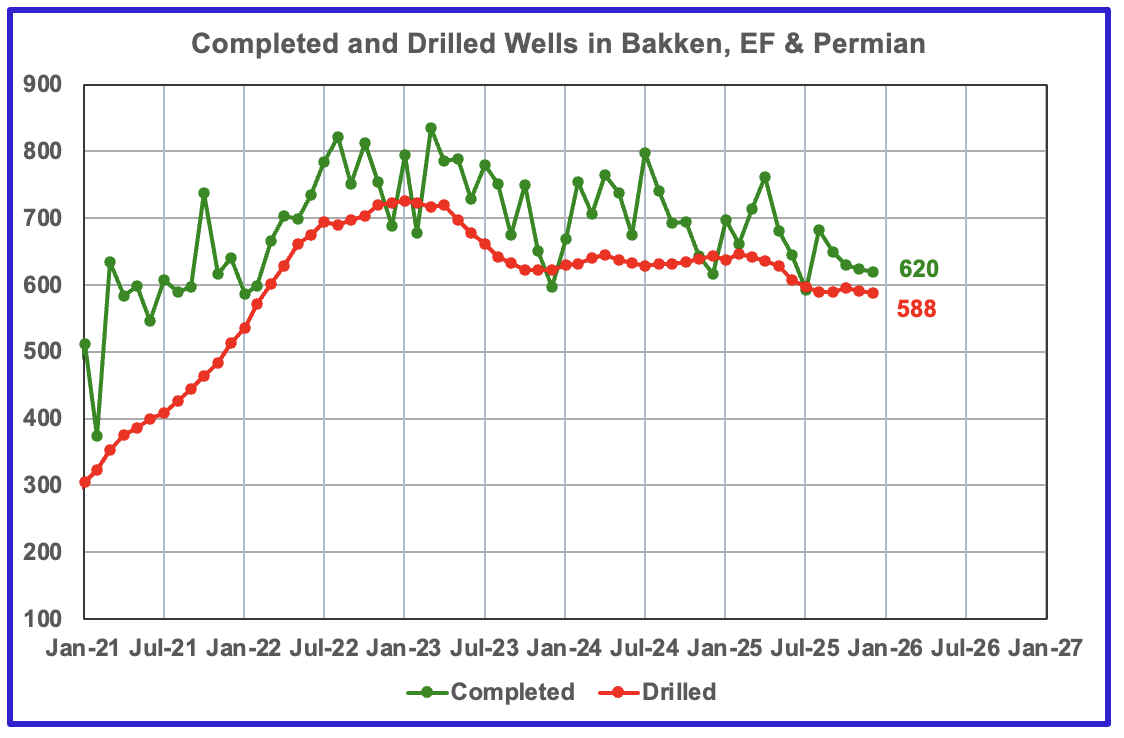
In the three primary regions, a total of 620 wells were completed in December, four fewer than in November. There were 588 wells drilled in December 2025. For the past 6 months, an average of 592 wells were completed each month. For comparison, In January 2023, 726 wells were drilled.
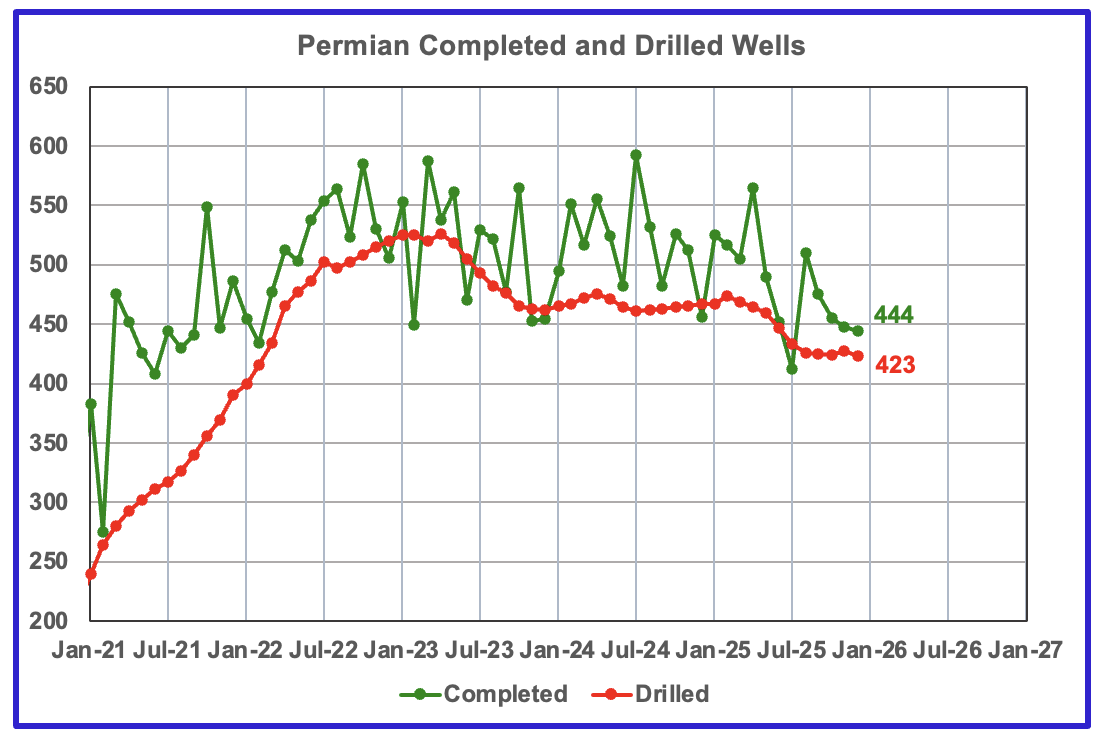
In the Permian, the monthly drilling rates have stabilized around 425 for the last 5 months.
In December 2025, 444 wells were completed and 423 new wells were drilled.
52 responses to “US November Oil Production Report”
Great Job Again, Ovi!
BOEM will have a 3rd round of lease auction “BBG” in March, 2026 and claiming potential reserve to be discovered at 29.55B BO and 54.84TCF gas.
https://www.boem.gov/oil-gas-energy/leasing/big-beautiful-gulf-2-bbg2-oil-gas-lease-sale
Those remaining reserves numbers are from 2019. They were published in 2021. Even then I thought they were way too high. Since 2019 there have been maybe 1-2 BBO discovered. Some of the bigger discoveries include Daenerys by Talos in 2025, Winterfell by Beacon in 2020, Tiberius by Kosmos in 2023. These 3 are either online or very likely to become producing fields. There have also been a number of 15-30 MMBO type tiebacks. But it takes a lot of those to amount to 1 BBO.
I’d put the current yet to be discovered number in the 1-4 BBO range.
This March lease sale is likely to be pretty anemic, but yet there will be a lot of bluster and happy talk about this sale as evidence of US energy dominance, etc. In my view, it would be classified as a successful sale if more than 50 blocks receive bids.
The December 2025 sale had 181 blocks receiving bids. Some industry cheerleaders said the number was low because companies were holding back because they knew there would be another sale in a few months, and another one a few months after that. I don’t buy that. If an operator has a prospect on an open block, they are going to place a bid on it; otherwise someone else might come along and pick it up.
Sheng Wu
Thanks. Much appreciated.
The latest January STEO shows production in the GOM increasing in 2026 to a little less than 2,100 kb/d. The chart infers 2,100 kb/d is near the limit of the GOM’s production capacity.
GOM
Mr. Meltz,
Thanks for your input. Do you include the approximately 1.6 Gb of proved reserve growth in the GOM from 2019 to 2023 is your discovery estimate? If not then we would have perhaps 1.5 Gb of new discovery plus 1.6 Gb of P1 reserves and maybe 0.8 Gb of P2 reserves (2P=2.4 Gb) for a total discovery (including reserve growth) of 3.9 Gb. This would be about 1 Gb per year, perhaps this continues out to 2035 at 1 Gb per year of total discovery for a total of 12 Gb of total C+C discovery from 2024 to 2035.
Where is that 1.6 number from? The 2025 BOEM report listed the reserve growth number from 12/31/2019 to 12/31/2023 as about 1.1 Gbo, (discoveries + reserve revisions – production).
In my previous comment, I separated discovered reserves from reserve growth due to revisions (also, I am not backing out production). I think it is fair to say that if you include reserve revisions to my 1-2 Gbo of discoveries since 2019 the total reserve growth (discoveries plus revisions) since 2019 is 3-5 Bbo.
My estimated projections of average annual reserve growth out to 2035 would be in the .4-.8 Gb per year (again, not backing out production). Some time in the next 10 years annual total reserve growth will start going negative (when annual production exceeds annual reserve growth due to discoveries plus revisions). I haven’t thought this out too much, but I would think in the early 2030s, when production levels are still high but discoveries are severely falling off, and reserve revisions are also falling off.
Mr Meltz,
I used EIA proved reserve data for C+C in central and eastern GOM and took changes in reserves from 2019 to 2023, then added back production over the period, to arrive at reserve growth of about 1.6 Gb for 2019 to 2023. Typically proved plus probable would be 50% higher than proved so we would get 2.4 Gb of reserve growth over 4 years so about 0.6 Gb per year. Perhaps I am double counting if new discoveries have very quickly become reserves, but typically new discoveries take at least 5 years and often longer from discovery to becoming proved reserves. I was assuming the 1.5 Gb (average of 1 to 2 Gb) of new discoveries since 2019 would not yet be included in proved reserves. Note that negative reserve growth is possible, but I back out production so If reserves are 4 Gb and 0.4 Gb were produced, I would expect reserves should be 3.6 Gb if there was no reserve growth. Often there are contingent resources which get added to reserves over time and sometimes prospective resources get discovered as technology improves over time. Eventually reserve growth (as I define it) and discoveries will cease and reserves will fall as oil gets produced, but the downslope in output may not be as steep as some envision due to the gradual movement of contingent resources into the reserve category.
Mr Meltz,
BOEM in 2021 estimated about 20 Gb of undiscovered economically recoverable oil resources in GOM at $60/b for oil and $3.20/MCF for natural gas.
See (you know doubt have read this report)
https://www.boem.gov/sites/default/files/documents/regions/gulf-mexico-ocs-region/resource-evaluation/2021%20Gulf%20of%20Mexico%20Oil%20and%20Gas%20Resource%20Assessment%20%28BOEM%202021-082%29.pdf
Note that the report is based on data through the end of 2018. Cumulative oil production at the end of 2018 for GOM was 18.7 Gb and proved reserves for GOM C+C was 5.2 Gb for a total of 23.9 Gb. BOEM estimates in 2021 that contingent resources plus future reserve growth would be 14.5 Gb for a total discovered resource (including reserve growth) of 38.4 Gb. undiscovered economically recoverable resources after 2018, were expected to be about 20 Gb at $60/b. The total economically recoverable oil resource estimate is approximately 58 Gb for the mean GOM estimate at $60/b.
Dennis,
You are right, the time window started from 1/1/2019, not 12/31/2019.
A good example of why I believe BOEM’s assessments of future exploration potential are too high is if you look at how they have evaluated the Wilcox. On page 29 of their report, they list Mean Level UTRR (BBOE) for all 30 or so plays. They show the Lower Tertiary Slope (Wilcox) as having about 9.5 BBOE yet to be discovered. That is, in my view, way too high. Wilcox fields have been online since 2010 and have only produced a bit over 1 billion barrels. Those fields probably have another billion to go,, and those were the low hanging fruit (“easiish” to see on seismic). There are some attractive new projects coming on line (Whale, Anchor, Shenandoah, Salamanca), the estimated total EUR from these fields is another 1.5-2 billion, give or take. When you add in the likely future projects, like Sparta, Kaskida, Tiber and maybe a few more you maybe get another 1-5-2 billion. So, from all of the discovered projects that have either been producing for years, are just starting to produce, or likely to produce, you get 5-6 billion barrels. Believe me, the play has been well explored with over 70 exploration wells. To expect another 9 billion barrels to be found is just too much for me to believe.
And it is a similar story with a lot of the other plays. Their yet to be discovered potential for the Miocene (Upper, Middle and Lower) is over 15 BBOE. While there continue to be Miocene discoveries being made, they are dominated by 15-30 MMBO tiebacks. I can see another billion or two from the Miocene, but 15 billion?
Same thing with the Norphlet. They show over 3 BBOE of undiscovered potential. The producing Norphlet fields will probably produce 1-2 billion barrels, but very little Norphlet exploration is occurring these days.
Thanks Bob,
You are much more familiar with what is going on than me, the BOEM 2021 estimate is far lower than the 2016 estimate for UTRR. Perhaps they are still too high, one thing to consider is that often estimates prove to be conservative (though not true in 2016). Maybe P95 for GOM oil UERR of 5 Gb, P50=10 Gb and P5=20 Gb?
https://www.youtube.com/watch?v=_F-HnjpwX7s
5 minutes
End of the Shadow Fleet – French addition.
5 mbopd plus logistical problems of Russia, Iran and Venezuela not being able to ship their oil.
A shipping asset company (????) wants to purchase seized shadow boats and sell off parts.
NATO can “easily” halt shadow fleets because they are required to go thru various choke points.
Commentators approximate words not mine!
https://www.msn.com/en-us/money/economy/how-global-shadow-fleet-of-crude-tankers-is-navigating-high-seas-hunt-for-sanctioned-russian-iranian-venezuelan-oil/ar-AA1VzWmy
India agrees to a trade deal to stop buying Russian shadow fleet oil.
Instead they will buy USA and/or Venezuelan oil????
Royal United Services Institute article on The Shadow Fleet.
https://www.rusi.org/explore-our-research/publications/commentary/old-ships-modern-menace-how-tackle-worlds-shadow-fleets
The shadow fleet operating from Iran funds the revolutionary guard who murdered 20,000 protesters recently.
As I said before start to seize these vessels sell the cargo and use the money to support democratic movements in and outside of Iran.
https://united24media.com/latest-news/shadow-fleet-under-pressure-as-malaysia-detains-tankers-carrying-130-million-in-oil-15586
Malaysian authorities seize shadow tanker
TEAMWORK MAKES THE DREAM WORK!
https://www.yahoo.com/news/articles/uk-threatens-seize-russia-linked-142321405.html
UK threatens to seize Russia shadow fleet vessel
THERE IS NO “I” in “TEAM”
https://www.planetearthandbeyond.co/p/the-ai-layoff-myth
For those following the AI story. I do believe this relates to energy ( data centers ).
Maybe it is just Alim and I talking back and forth.
AI layoffs a myth???
It may just be us Andre. It is a little off topic.
That said, it is a big energy topic, with hyperscalers demanding ALL the electricity. It’s also a major economic topic, since the US economy seems dead in the water except for AI data center construction. And AI is causing chip shortages that will touch all manufacturing. Also it’s a vast financial topic, with Wall Street dominated by the AI bubble. And then there’s the crypto-currency scams run by bots and popping up everywhere, even coming from the White House.
The big news is OpenClaw. Hundreds of thousands of people have allowed this bot complete access to their systems and some are letting it run their email and social media etc — without supervision. OpenClaw can acquire skills online, many of them scams or trojan horses. It has a social media page (moltbot) where thousands of bots chat with each other, a web site for bots to hire humans etc.
When OpenClaw changed it name the first time, they should have claimed the new domain before they released the old one. But they left both domain names open for about 10 seconds. A crypto scammer used those 10 seconds to launch a crypto coin in their name, pump the value to $16 million, and then dump it and disappear.
I’ve been following the industry hype since the 70s and it has never been this crazy. It’s impossible to tell the difference between reality, scams and parodies. Trillions of dollars are on the line.
Oh yeah, and Telsa basically quit the car business and will only make humanoid robots and robotaxis in the future.
UPDATE: Hmmm, maybe the bubble is already bursting.
Thanks for that Alim.
“I’ve been following the industry hype since the 70s and it has never been this crazy”
Moore’s law – 1970 – 2026
Internet full of training data and a mechanism to communicate hype
Massive cash furnance Data Centers
Algorithm change very minimal,
nowhere for Agentic AI (AI that can think and decide vs blind probibalistic pattern matching) to possibly be.
“ Telsa basically quit the car business”
My understanding is that Tesla is discontinuing two models – the S and the X. And, I read that they account for about 2% of Tesla’s sales. Am I missing something?
Nick,
Tesla car sales are no longer growing, all the eggs are in the robotaxi basket, also profits are falling, people are starting to doubt the Musk hype. Once that occurs, Tesla goes down hard.
Musk has been saying full self driving would be solved by the end of the year for about 7 years. It has been solved, by Waymo.
Musk is a clown.
Nick G
The cybertruck is a joke, the roadster and truck are vaporware, the S & Y are dead and the 3 is in sharp decline, with no updates announced. There are are plans for a robotaxi called Cybercab and a minibus but only the Cybercab is real. Well sort of real. It was supposed to be released in July 2025 and now they hope to start production in 2026. And the software doesn’t work.
It takes years to design and build a car, and Tesla has stopped doing that. Musk is bored, I guess.
https://www.msn.com/en-us/money/markets/6-trillion-mineral-jackpot-could-permanently-reshape-the-global-economy/ar-AA1V5Z4P
Australia hits 6 trillion dollar Iron Ore jackpot in the outback
“As The Economic Times summarized, the newly mapped reserve contains roughly 55 billion metric tons of ore, enough to supply global steelmaking for decades. Geologist Dr. Liam Courtney-Davies, who co-authored research on the area, called the discovery “a radical transformation” for the mining sector and a potential game changer for countries that depend on imported iron.”
It’s too bad iron isn’t the metal we’re running out of. If this was copper or something, that’d be more of interest.
Kleiber, perhaps the Iron ore could be made into long conductive steel strings, perhaps paired in two, then they could be used for low friction transport also, in some fashion.
Copper and aluminium would be too soft for that version though, probably…
Shadow fleet
Some good information about the dark fleet
https://windward.ai/glossary/what-is-the-shadow-fleet/
They carry millions of barrels every day and nobody knows exactly how much not even Dennis.
Oil prices are governed by how much and how cheaply illegal oil is sold
Iver,
I agree that nobody knows how much oil is moved by the shadow fleet. Oil production is what I focus on, I do not know how each individual barrel is moved. Oil production is also just an estimate, no data is known with absolute precision.
Dennis
Nice of you to admit that the data coming out of countries such as Russia just may be a tiny bit manipulated by a totalitarian, murdering and totally corrupt group of thugs.
https://www.theguardian.com/world/2025/oct/30/russian-army-chiefs-torturing-and-executing-soldiers-who-refuse-to-fight-in-ukraine-report-says
Investigative journalists are going round from cemetery to cemetery to get an idea of how many men have been killed in Ukraine. They are putting together all their data which shows far more men have been killed than what the government is saying.
There are no individuals going around the hundreds of oilfields counting the barrels produced. A tankers gets loaded with oil and travels to a meeting place, meets another tanker. The oil is sold who knows where. I can assure you the Chinese do not say we bought 100 million barrels of illegal oil in January. It is all estimates and guesses.
Not on oil, but Reuters has an article behind paywall with the following topic;
“Peak coal may be elusive, but peak seaborne coal is here”.
So, uh, with the war drums sounding louder, what happens if everything goes kinetic with Iran and the US and Israel this weekend, as seems increasingly likely? I see oil spiked a bit today, I’m wondering what it does if the Strait of Hormuz is impeded or blocked entirely or the KSA gets whacked (or Iran’s oil, for that matter).
The fragility of the Strait of Hormuz has always seemed like a very good reason to kick the ICE habit. China gets that, as do an increasingly large number of other countries…
Its been ten minutes and I am still laughing at this comment about the Strait of Hormuz. WTF does the United States Immigration and Customs Enforcement Agency have to do with the Middle East? WTF cares about what China thinks about anything? It is the worse enemy the U.S. has on the planet; it sent us COVID in 2019, continues to steal our intellectual intelligence every second of the day, anyway it can, and now there is this: https://www.msn.com/en-us/news/crime/feds-investigating-alleged-chinese-linked-biolab-in-las-vegas-home/ar-AA1VFTzM?ocid=BingNewsSerp.
Who cares about China and what other countries think of the U.S. trying to remove 10MM illegal immigrants allowed into the country during the Biden administration?
Far left wing liberal dirt bags like Nick G, who always take whatever opportunity they can, wherever they can, to advance their anti-America agenda. This his beyond pathetic. Truly.
If there is any single identifiable reason for the decline in peakoilbarrel.com, from a fairly rational discussion of oily matters in the world to nothing but hateful, divisive rhetoric about American politics, its you Nick. Congratulations. You are indeed controlling the content of the blog, and running it into the ground.
Mike,
You have politics on the brain. Let it go – if you weren’t overly focused on left vs right politics you’d have realized I was talking about Internal Combustion Engines, not immigration. And yes, China is leaving the US way behind in the car and power industries – we can only hope we can catch up when the US government stops being crazy.
The energy stuff you describe as wacko liberal is incredibly mainstream – it’s the consensus in the science and engineering community. It’s US republicans that have lost their minds, especially on energy, where they’re hurting the US every day.
Have you noticed the Secretary of the Interior promoting “beautiful, clean coal” with a mascot called…”Coalie”??
He must be so embarrassed…
https://www.bloomberg.com/opinion/articles/2026-01-29/meet-coalie-the-lethal-mascot-for-dirty-energy?embedded-checkout=true
You are lying, Nick. You know it. I know it; most people know it.
In the circumstances we are now in, “ICE” means only one thing on social media in the U.S. You are not as clever as you think you are and I for one second do not believe you are above referring to the term any other way than its meaning regarding immigration. Let other people decide.
I personally think that if you held the intellectual high ground over others you think you do, and actually wanted to make a valid point, you would have written internal combustion engines, not ICE. How about gasoline engines. That’s what we called it for 130 years.
Its you that has politics on the brain, man.
Nice try. Be more specific in your limited writing skills; I mean really, if you are going to control the entire content of the blog, try harder. Be more clear. And for God’s sake, learn more about what you are writing about. You are embarrassing yourself.
https://www.foxnews.com/politics/sba-freezes-100000-california-borrowers-sweeping-9b-pandemic-fraud-crackdown
When is all this stealing of my tax money going to stop? !!
“ “ICE” means only one thing on social media in the U.S.”
Well, you’re spending way too much time on social media. I’m sorry – I use social media very little: the occasional message to a friend or family member. Happy birthday, etc. I certainly don’t read news on social media or on Fox News – they’re incredibly bad sources of information. If you want to be brainwashed, then read news on social media and watch Fox Entertainment (yes, entertainment: Fox’s legal defense against lawsuits is that they’re not news, they’re opinion and entertainment and no one can be reasonably expected to take them seriously).
I read and comment on POB primarily on energy stuff, and in that context ICE means Internal Combustion Engine. Just look at some of my old comments – it’s easy, as I’ve been commenting for 20 years, on TOD and then POB.
Re-read the comment I was replying to: “ I’m wondering what it does if the Strait of Hormuz is impeded or blocked entirely…”. That comment was obviously talking about the fragility of the Strait of Hormuz, as a choke point for oil exports.
Re-read my comment: “ The fragility of the Strait of Hormuz has always seemed like a very good reason to kick the ICE habit. ”
how could immigration have anything to do with the Strait of Hormuz????? What would be an “immigration habit”???
Obviously I was saying that the dependency of the US and oil importers in general on fragile exports from the Persian Gulf was an existential mistake and that oil consumers should kick the *oil* habit, at least to the extent of not depending on those imports.
As for gas engines: I’ve always referred to ICEs because gasoline for passenger vehicles is a US-only kind of thing, and ICEs include heavy diesel vehicles as well.
Finally what the heck would China have to do with an immigration debate? China is important here because they’re leading the way towards EVs, with more than 50% of light vehicles being electric, and heavy vehicles moving strongly toward electric as well.
If people are unclear on the meaning of something, they can just ask before going off on a wild goose chase. Saves a LOT of time.
Hi Mike and Nick, I appreciate reading both your viewpoints on oil and energy. I would like to reassure Mike when I read ICE in the context Nick used it, I read “Internal Combustion Engine” just as when I read EV, I read “Electric Vehicle”.
That said, I’m from Australia, and I read a lot more articles about EV vs ICE than I do about US politics.
Cheers Phil
On the contrary, “ICE-OUT” here in Minnesota has another meaning::
https://geoenergymath.com/2026/01/27/minnesota-ice-out-update/
Where the women are strong, the men are good looking, and the children are ALL above average!
MIKE
You are writing and sounding like an idiot. Taking a break would make your life a lot better. You are deranged. It’s a little embarrassing, honestly.
Good luck.
There will always be the old versus the new.
And the people who can see ahead are in the minority at first.
Oil is on the way out, in 20 years it will be irrelevant outside of industrial usage.
So the prep should have started already. At least on this blog we mostly seem to foresee this.
Sure Klim
https://atag.org/facts-figures
And the 1,000 airports built in the last 15 years will all close.
And the 4.8 billion passengers will all stay at home no one will fly to New York or Paris or holidays abroad.
https://www.iata.org/en/iata-repository/pressroom/fact-sheets/industry-statistics/
All ships will be battery powered.
https://en.wikipedia.org/wiki/List_of_largest_cruise_ships
Yes you may be right, I can see a definite fall in oil consumption over the last 30 years.
https://ourworldindata.org/grapher/oil-production-by-country?country=~OWID_WRL
Oh no actually had graph upside down. End of last year we hit 85 million barrels per day.
And this is where we are heading
https://www.unep.org/news-and-stories/story/world-likely-exceed-key-global-warming-target-soon-now-what
Equinor forecasts 10%–20% production decline at Johan Sverdrup field in 2026
Equinor expects oil production from the Johan Sverdrup field — the North Sea’s largest producing asset — to decline by 10% to 20% in 2026, marking a turning point for one of Europe’s most important sources of supply growth.
https://www.worldoil.com/?oly_enc_id=2571D6158145G5W
Looks like the shutdown of Valero’s Benicia refinery (150,000+ bbld) has been accelerated from end of April to last week.
Thermal imaging is said to show stone cold readings and a supply pipeline (San Pablo Bay) has stopped flow.
This now makes for an abrupt departure of about 300,000 bbld from the market in just a few months’ time.
Gonna be maahhtee interestin’ to see the impacts in the coming months.
Nosebleed gasoline prices (currently averaging over $4/gallon) look to be the norm right shortly.
https://www.oilystuff.com/group/operational-stuff/discussion/caf54fe4-b603-4053-b864-4492fd0f1325
Link above has an update on Delaware sub-basin U shaped wells from Mr. Shellman.
US November Oil Production
Down 82 kb/d to 13,782 kb/d. Most of the drop is from the GOM, 76 kb/d.
A US
Rig Report for the Week Ending February 6
The rig count drop that started in early April 2025 when 450 rigs were operating dropped this week. Drilling continues at a steady rate of 365 ± 5 rigs per week since August 2025 and WTI moving into the lower $60s/b.
– US Hz oil rigs dropped by 1 to 367, down 83 since April 2025 when it was 450. It was also up 5 rigs from the low of 362 first reached in the week ending August 1. The rig count is down 18% since April 2025.
– New Mexico Permian dropped 1 to 91. Lea held at 59 while Eddy dropped 1 rig to 32 .
– Texas was unchanged at 166. Midland and Martin were unchanged at 23 and 25 respectively.
– Eagle Ford was unchanged at 29.
– NG Hz rigs rose by 6 to 114.
A Rig
https://oilprice.com/Energy/Energy-General/US-Oil-Drillers-Add-Rigs-Even-in-Price-Uncertainty.html
there is a sharp increase of exploration rigs in the oil and gas sectors.
Sheng Wu
I just report the number of horizontal rigs operating in a week since they are the largest number and produce the most oil. The second largest number of rigs are directional. I wonder if these are used to drill the U shaped wells. Chart attached for last year and up to February this year.
Below is a listing of the different types of rigs operating over the last two weeks,
Jan 30 Feb 6
Horizontal 368 367
Directional 34 37
Vertical 9 8
Total 411 412
A
Ovi,
I am not sure if the “Directional” is for U-horse shoe laterals.
Usually Directional is closer to Vertical than Lateral?
Sheng Wu
I thought vertical rigs these days were primarily for starting the first part of horzontal and directional wells. Just guessing.
Frac Spread Report for the Week Ending February 6
The frac spread count dropped by 3 to 145. It is not clear if this small drop of 3 relative to last week’s drop of 15 is due to continuing severe cold weather or low oil prices or a combination of both. From one year ago, it is down by 53 spreads and is down by 70 since March 28.
A Frac
An update to US November Oil Production has been posted.
https://peakoilbarrel.com/us-november-oil-production-drops
MIKE
You are writing and sounding like an idiot. Taking a break would make your life a lot better. You are deranged. It’s a little embarrassing, honestly.
Good luck.
Surf, I consider POB one of the most hateful, divisive, anti-God, anti-American forums on social media, its title completely misleading, its ranking committee member, Nick.
Having said that I misinterpreted Nick’s statement about ICE and it was indeed dumb of me.
I hate to be called an idiot, for a dumb mistake, by a coward with no name, and you are, but alas, that’s POB. Nasty and always anonymous. My mistake is a week old now, I’ve been ridiculed for it several times, if you need to vent more I suggest getting a whistle and protesting on your local beach. You can make a sign that says…MIKE OUT!