By Ovi
All of the Crude plus Condensate (C + C) production data, oil, for the US state charts comes from the EIAʼs Petroleum Supply monthly PSM which provides updated information up to February 2025.
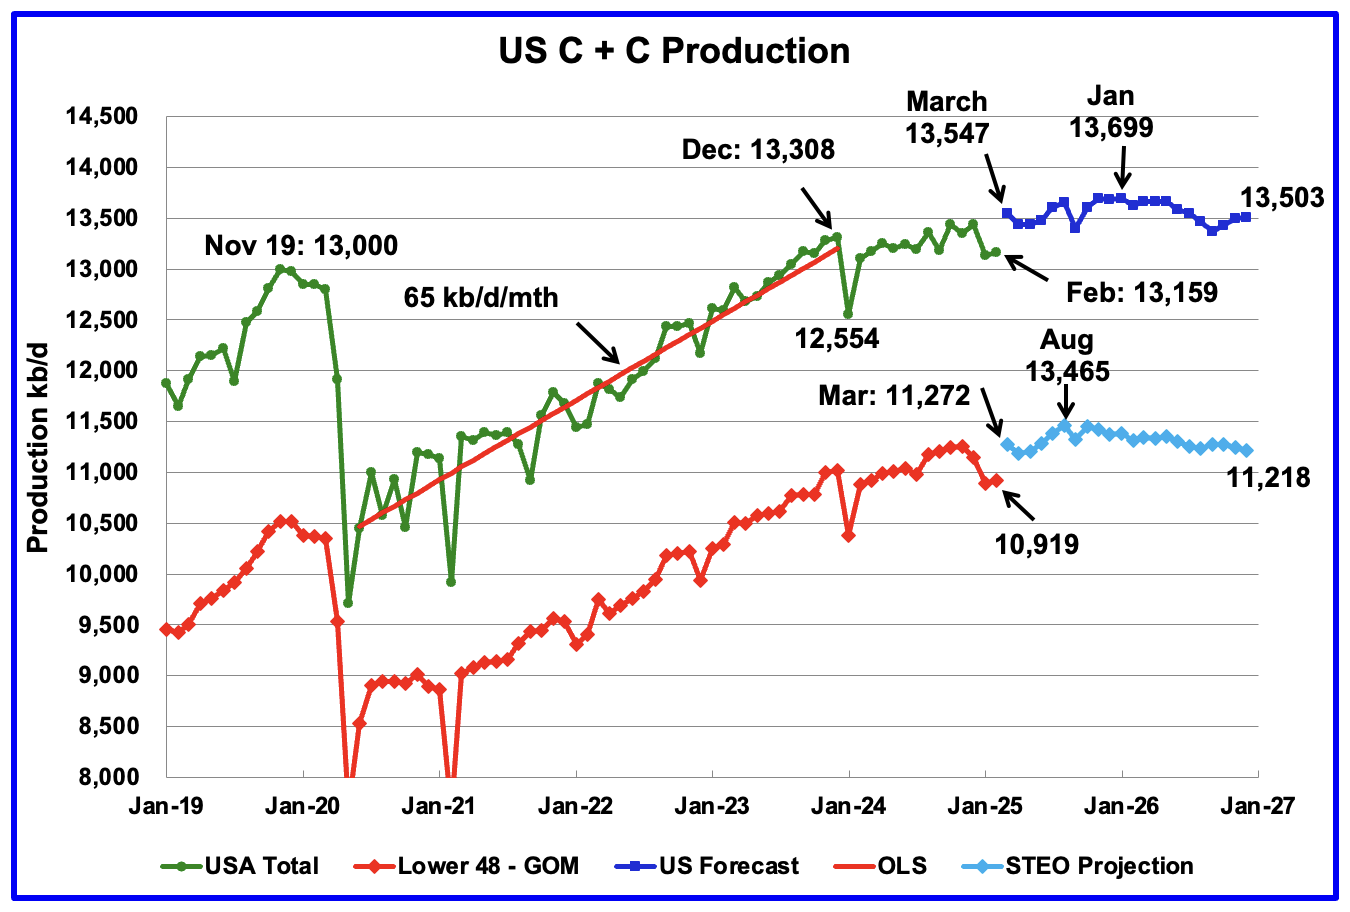
U.S. February oil production increased by 29 kb/d to 13,159 kb/d, 149 kb/d lower than December 2023’s 13,308 kb/d. The largest increases came from Texas and New Mexico. January’s production was revised down from last month’s 13,146 kb/d to 13,130 kb/d a decrease of 16 kb/d which is more than one half of February’s increase.
Production in March is expected to increase by 388 kb/d. For the last two months the STEO forecast has been really off the mark, too high by a significant amount. February was too high by 379 kb/d.
The dark blue graph, taken from the April 2025 STEO, is the U.S. oil production forecast from March 2025 to December 2026. Output for December 2026 is expected to reach 13,503 kb/d. From March 2025 to December 2026 U.S. production is expected to decline by 44 kb/d.
The light blue graph is the STEO’s projection for output to December 2026 for the Onshore L48. February Onshore L48 production rose by 24 kb/d to 10,919 kb/d. From March 2025 to December 2026, production is expected to decrease by 54 kb/d to 11,218 kb/d. December 2026 production was revised down from 11,440 kb/d by 222 kb/d from last month. Note how production starts declining in mid 2025 to December 2026.
In the previous US post, it was not clear how much of the January 305 kb/d drop was due to cold weather vs the lower completions associated with the low January Frac Spread count. A maximum drop of 90 kb/d was estimated as being related to the cold weather. The continuing low February production points to fewer completions along with possibly geology, i.e. fewer Tier 1 wells, dropping pressure and increasing GORs as being the main cause of the January and February production drop.
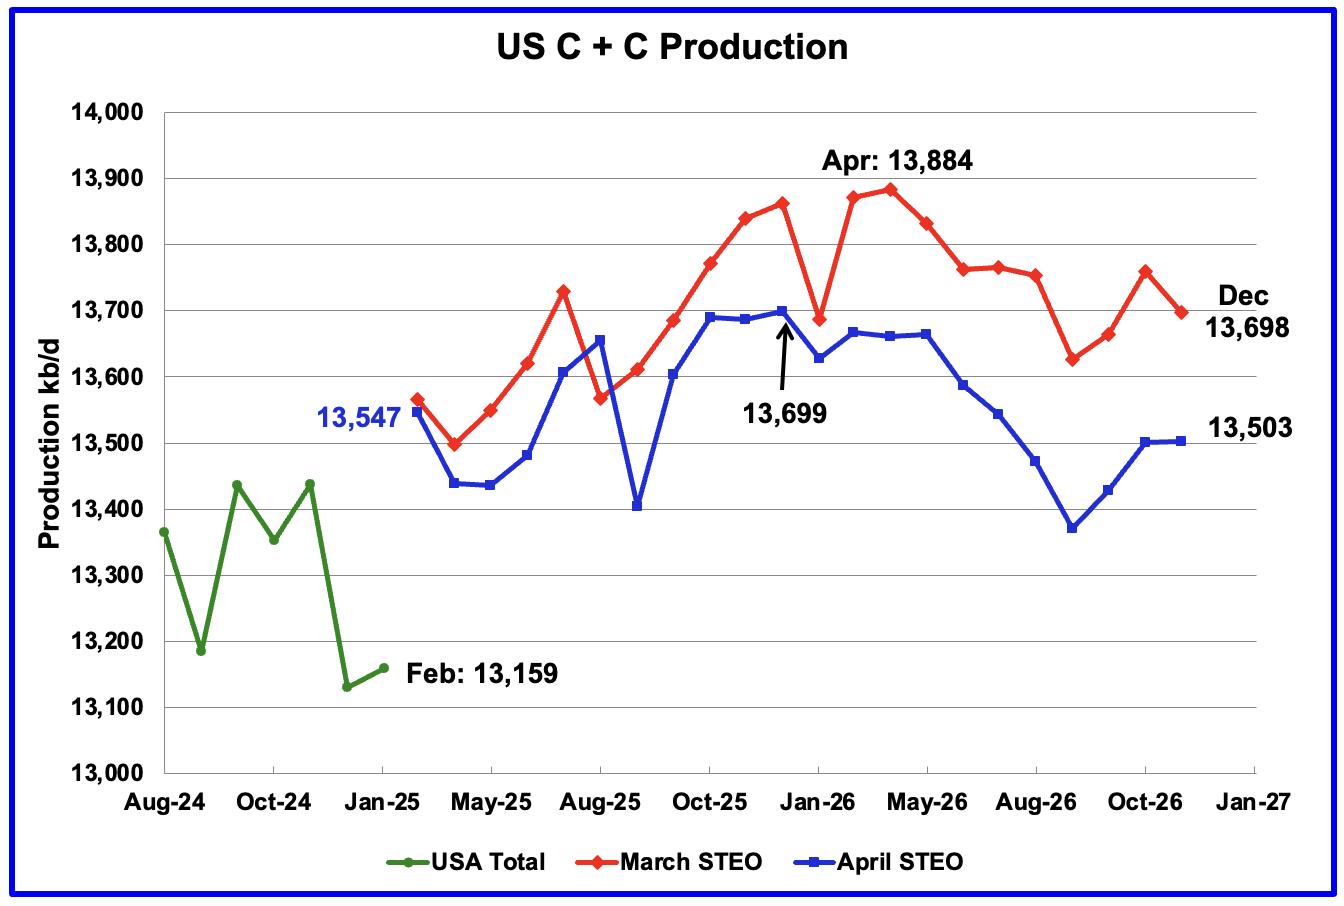
This is a comparison of the STEO’s March and April forecasts on an expanded scale since it would be difficult to see on the previous chart.
On April 2, the US President announced Liberation day. Under normal circumstances the April STEO would have published on April 8. However due to the impact that Liberation day tariffs would have on the World’s/US‘ economy, the STEO analysts decided to revise their original April report and delay its publication to April 10. While there was little change to March 2025, the December 2026 production forecast was lowered by 195 kb/d to 13,503 kb/d. The green and blue graphs are the same as those in the previous chart.
U.S. Oil Production Ranked by State
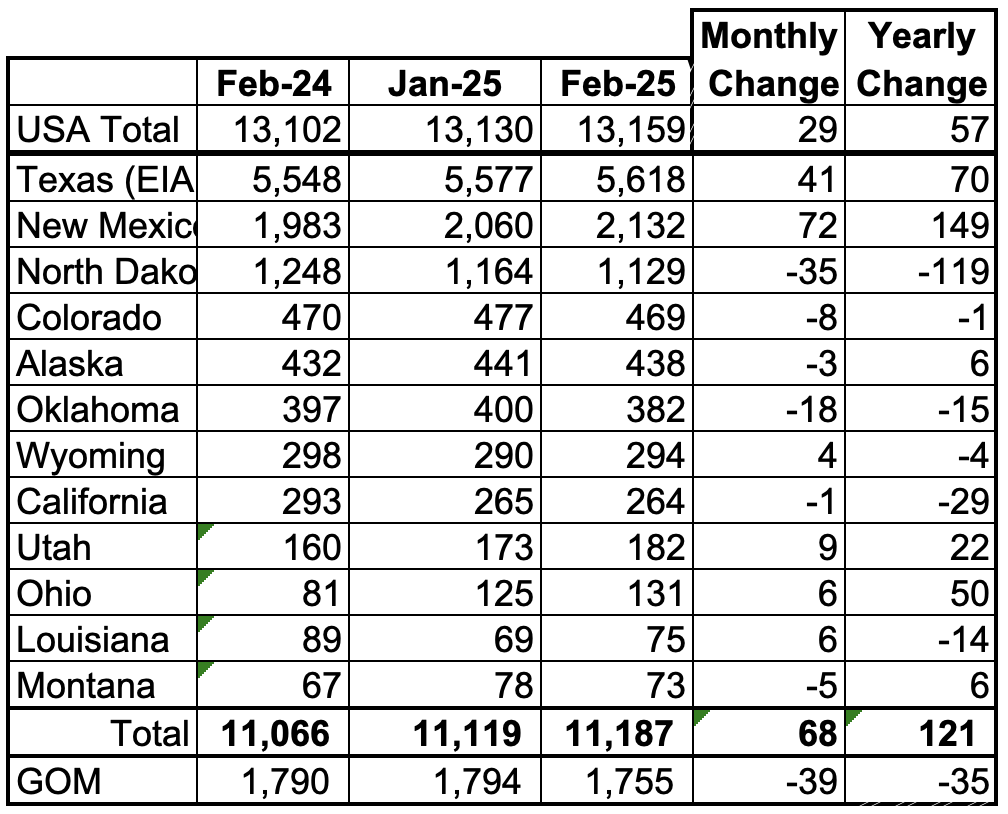
Listed above are the 12 US states with the largest oil production along with the Gulf of Mexico. Montana was added to this table a few months back since its production exceeded Louisiana’s production and we wish to keep tracking Louisiana.
These 12 states accounted for 85.0% of all U.S. oil production out of a total production of 13,159 kb/d in February 2025. On a MoM basis, February oil production in these 12 states rose by 68 kb/d. On a YoY basis, US production increased by 57 kb/d with the biggest contributors being Texas and New Mexico, offset by a North Dakota decline.
State Oil Production Charts
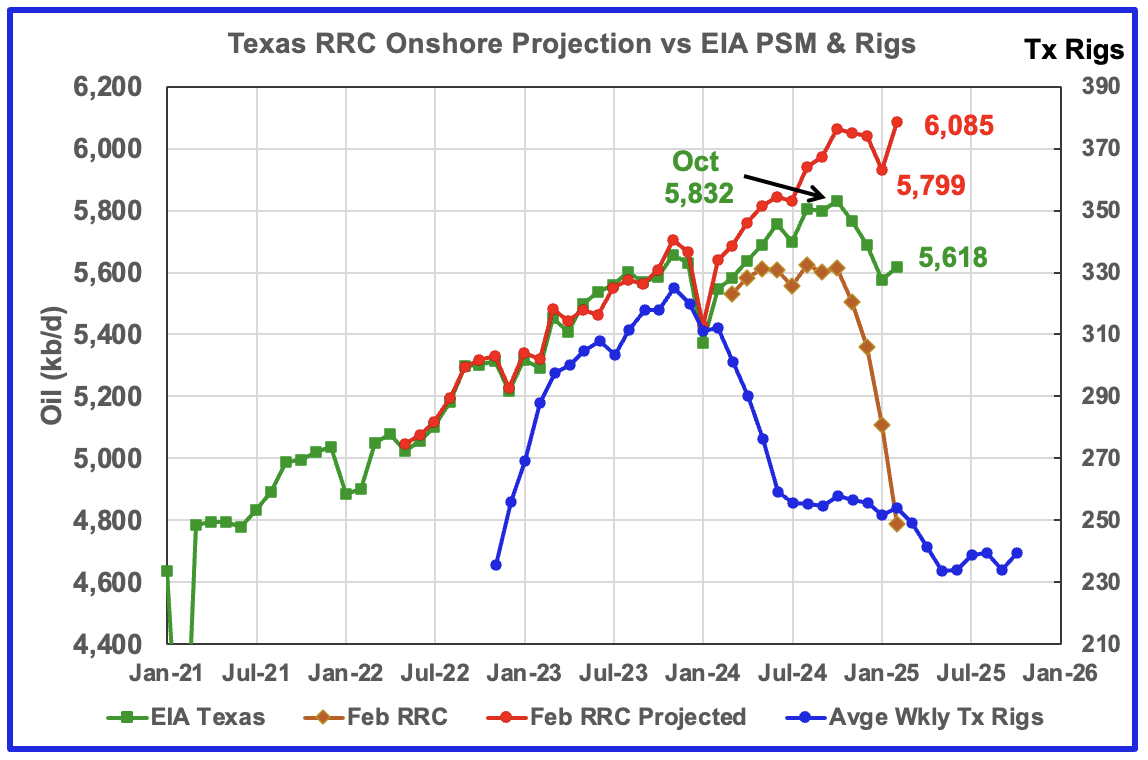
According to the EIA, Texas production increased by 41 kb/d in February to 5,618 kb/d and is 214 kb/d lower than October 2024. YoY production is up by 70 kb/d. Note that both December and January production from last month were revised down by 6 kb/d and 7 kb/d respectively.
Texas production has been dropping since October. The drop could be related to the drop in completions that started in October while the January drop could be a combination of cold weather and low completions. A few more months of data is required to see if Texas is nearing a production plateau and possible peak.
The red graph is a production projection using January and February Texas RRC data. Due to more production revisions than typical to earlier months in the February report, the projection is too optimistic by roughly 400 kb/d. However, note that both the projection and the EIA show production rolling over in October and dropping in January and increasing in February.
The blue graph shows the average number of weekly rigs reported for each month, shifted forward by 10 months. So the 276 rigs operating in July 2023 have been shifted forward to May 2024. From February 2024 to July 2024, the rig count dropped from 312 in time shifted February 2024 to 256 in July 2024. That drop of 56 rigs has had no impact on production up to August 2024 but November may be the first month when the rig drop impact on oil production is starting to show up along with fewer completions.
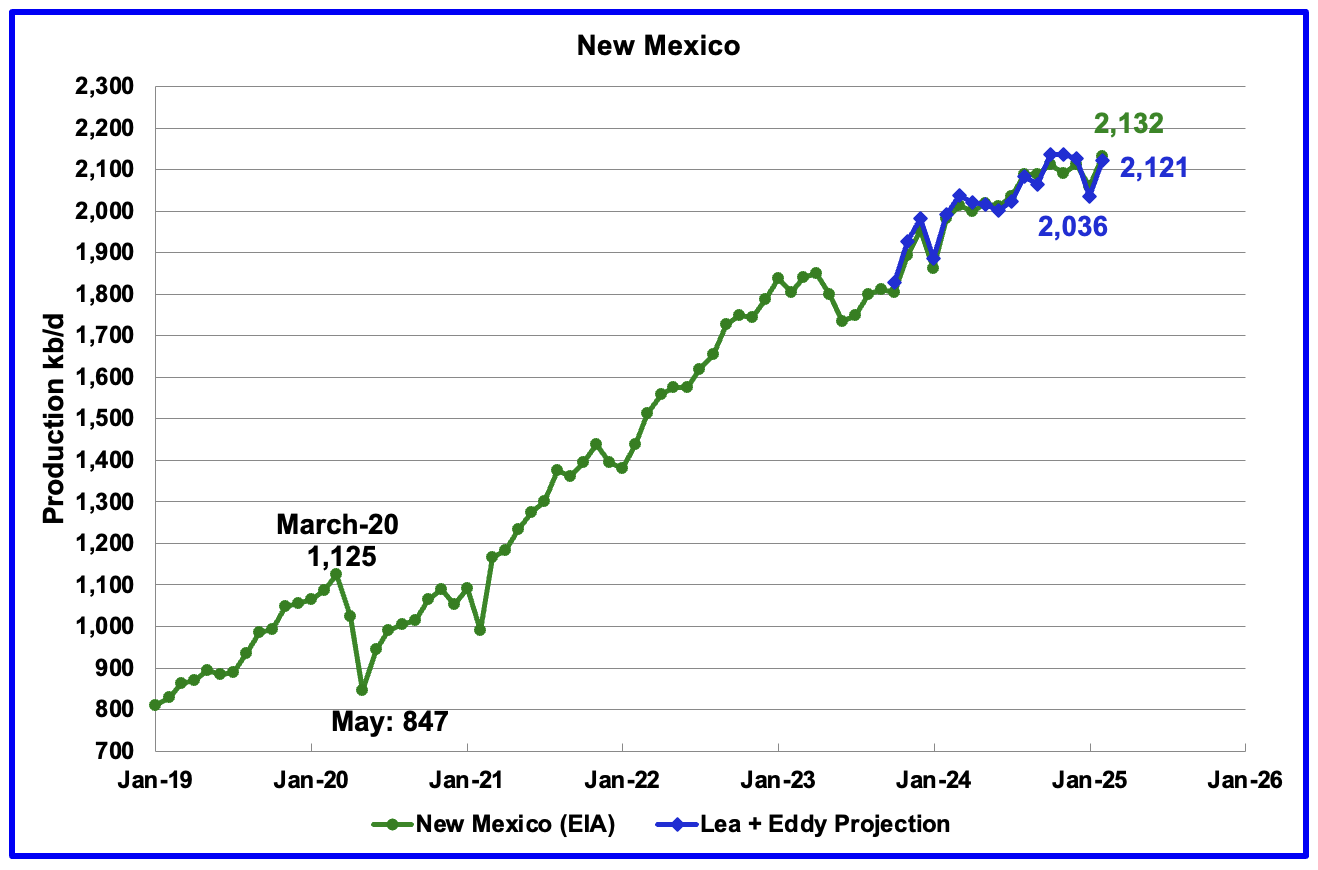
According to the EIA, New Mexico’s February production rose by 72 kb/d to 2,132 kb/d.
The blue graph is a production projection for Lea plus Eddy counties. These two counties account for close to 99% of New Mexico’s oil production. The difference between the January and February preliminary production data provided by the New Mexico Oil Conservation Division was used to make the projection. A 1% correction was added to the Lea plus Eddy production projection to account for their approximate fraction of New Mexico’s oil production. The methodology used for projecting New Mexico production is identical to that used for Texas.
The projection estimates February production was 2,121 kb/d an increase 85 kb/d over January, similar to the EIA’s report. The increase is related to February production increases in both Eddy and Lea counties and is discussed further down in the Permian section.
More oil production information for a few New Mexico and Texas counties is reviewed in the special Permian section further down.
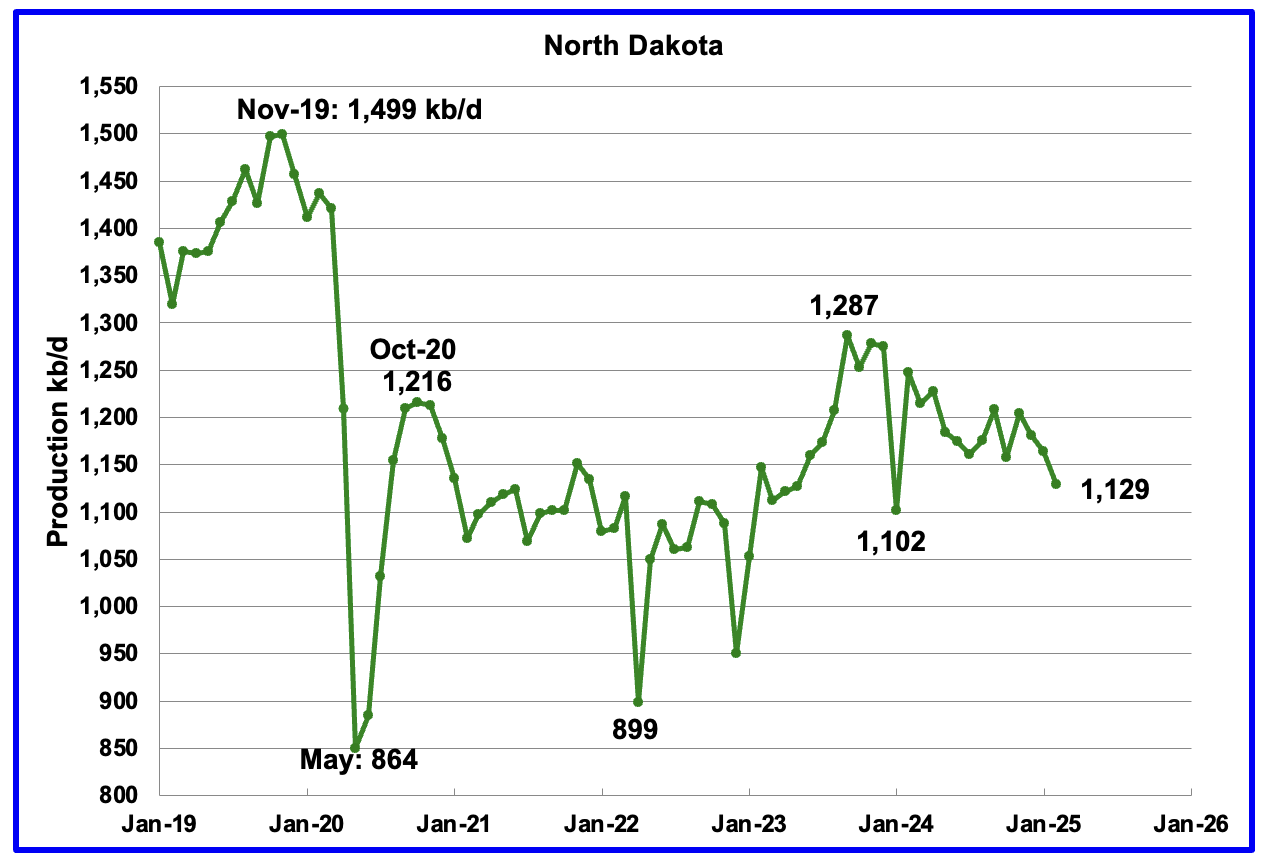
February’s output dropped by 35 kb/d to 1,129 kb/d. Production is down by 158 kb/d from the post pandemic peak of 1,287 kb/d. The North Dakota Department of Mineral resources reported February production was 1,164 kb/d.
The unusually large difference between the EIA and the ND DMR may be due to an over estimation by the EIA associated with very cold February weather in ND. During February production dropped between 120,000 and 150,000 barrels of oil per day according to this Article.
According to this Article, North Dakota oil prices are near breakeven levels. The report has a lot of information of breakeven prices. “Breakeven costs in the Permian Basin of West Texas and New Mexico range between $38 and $42 a barrel.”
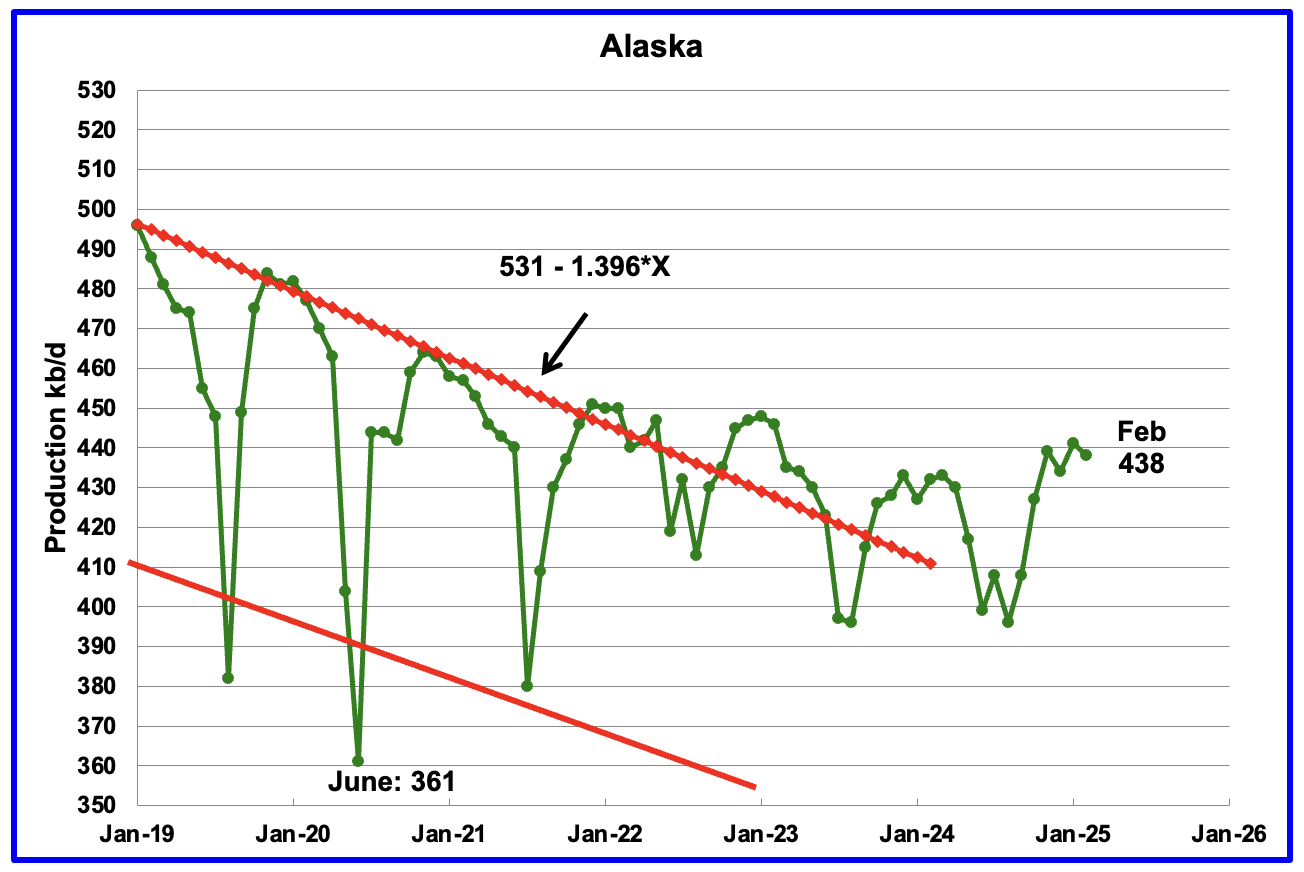
Alaskaʼs February output dropped by 3 kb/d to 438 kb/d while YoY production rose by 6 kb/d. The rise in production to close to 435 kb/d over the last four months is an indication that production for the next few months will be on its regular plateau after summer maintenance. EIA’s average weekly February production for Alaska is the same at 438 kb/d.
Alaska has recently brought new fields online to consistently have YoY and monthly production gains which have broken away from the earlier dropping production trend red lines. According to this Article, first oil production begins at Nuna project in Alaska in December.
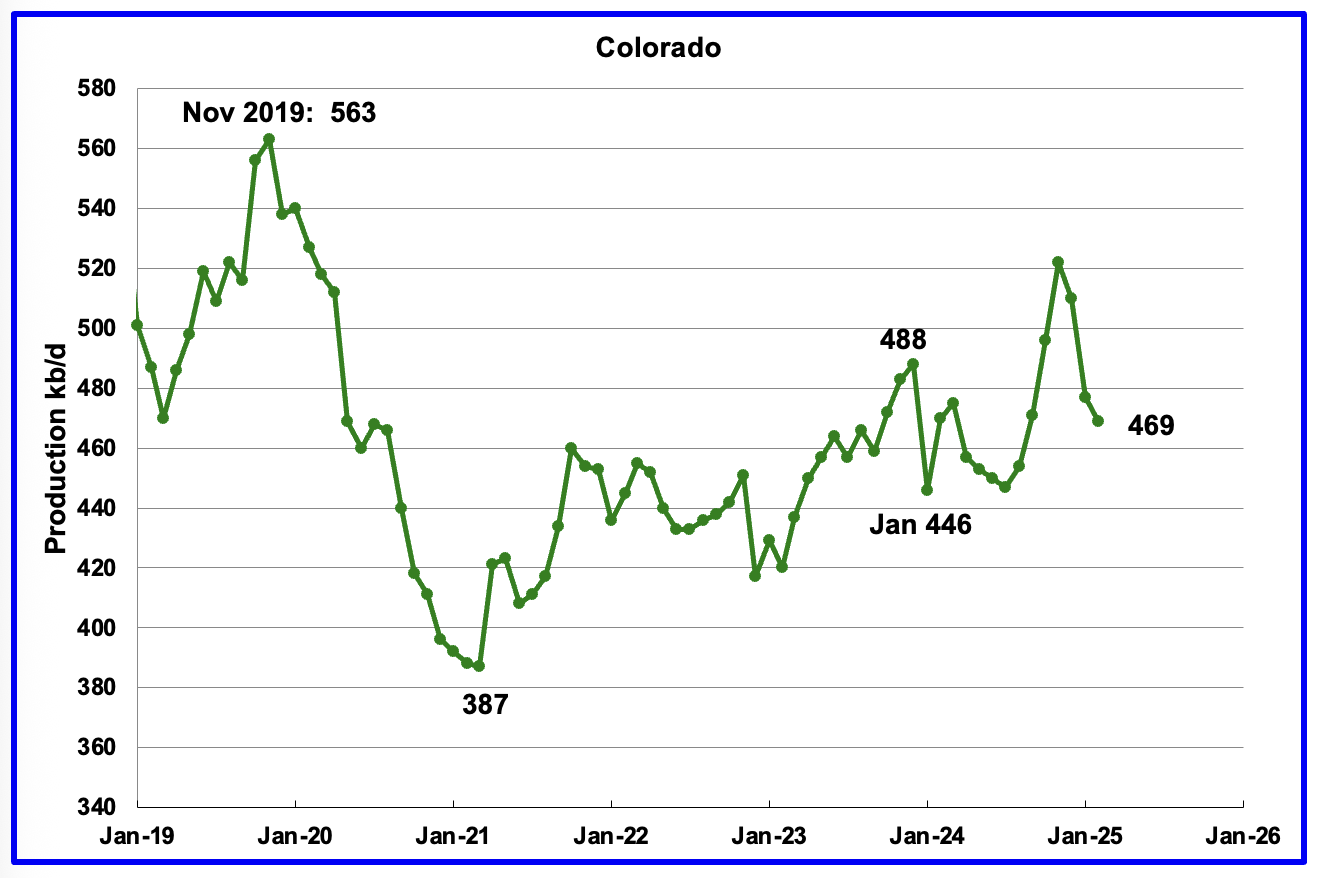
Coloradoʼs February oil production decreased by 8 kb/d to 469 kb/d.
In August 2024, Colorado had 10 rigs operating and ended the year with 7. Colorado began 2025 with 7 rigs in January and February and dropped to 5 in March/April. Is the dropping rig count beginning to show up in dropping oil production?
It should be noted that Colorado drillers are facing increasingly stricter environmental rules according to this Article which could be reducing drilling locations.
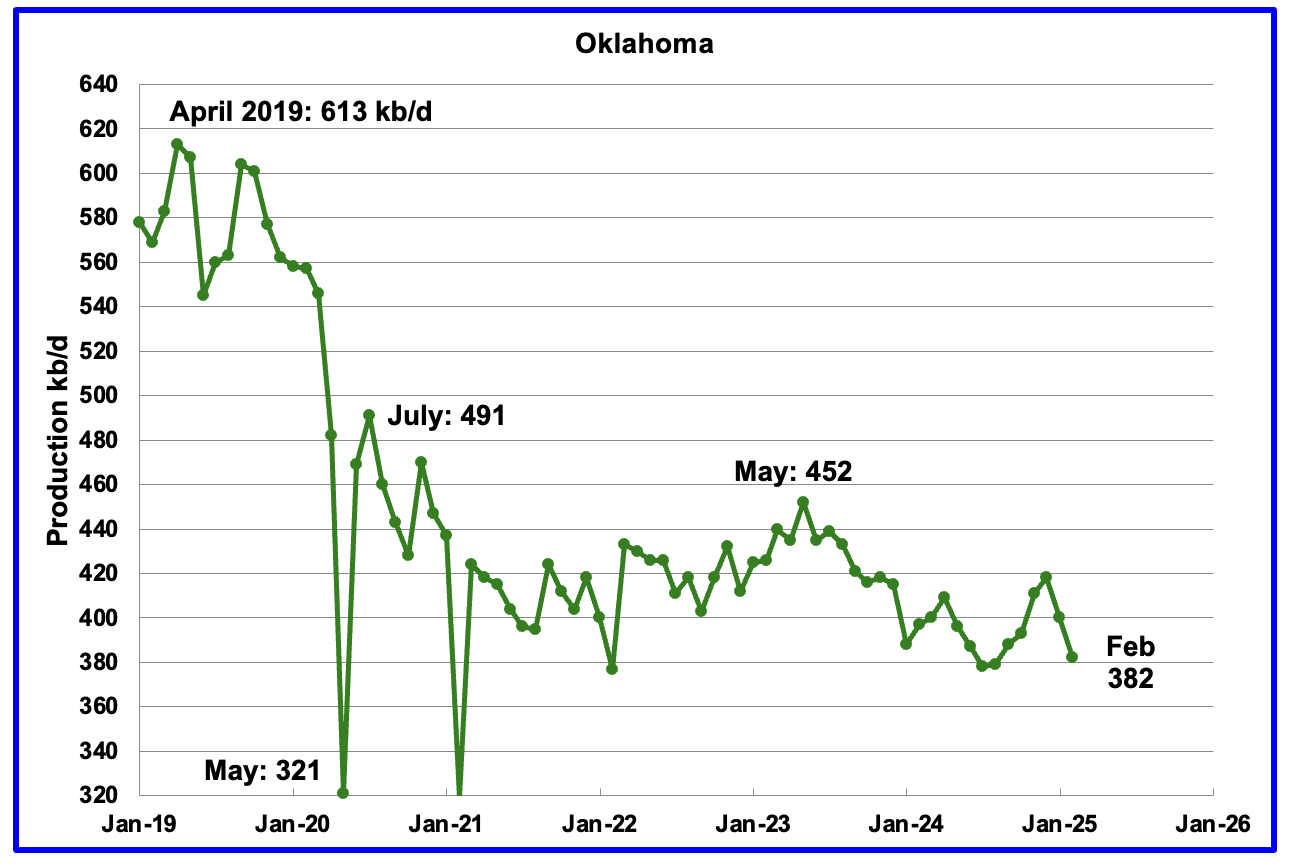
Oklahoma’s output in February dropped by 18 kb/d to 382 kb/d. Production remains below the post pandemic July 2020 high of 491 kb/d and is down by 70 kb/d since May 2023. Output entered a slow declining phase in June 2023.
At the beginning of the year, there were 40 operational rigs. In February 6 rigs were added to bring the total to 46 and an additional 4 were added in March to raise the count to 50 in March and April. Will the increase in the rig count result in increasing oil production going forward?
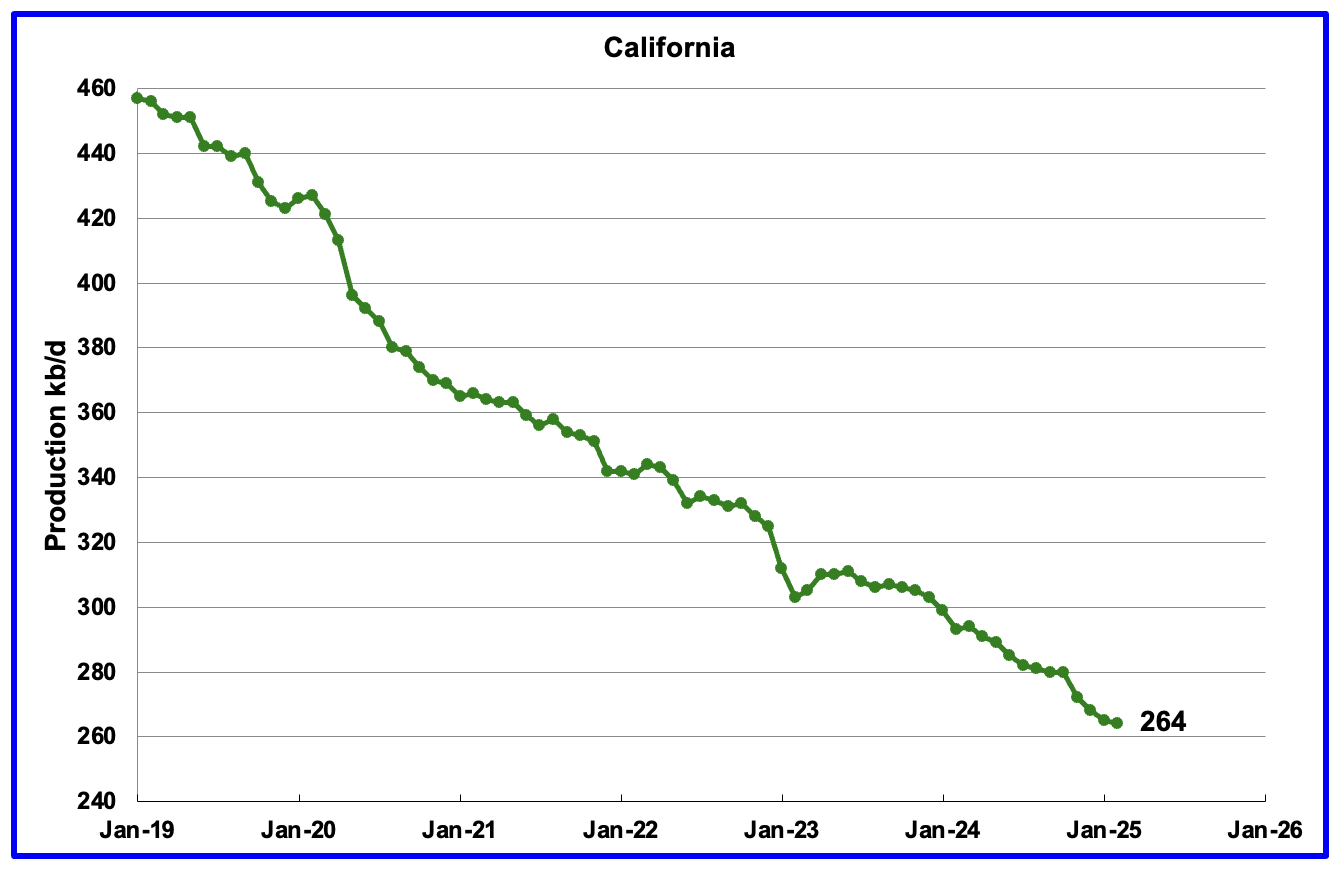
California’s declining production trend continues. February production dropped by 1 kb/d to 264 kb/d.
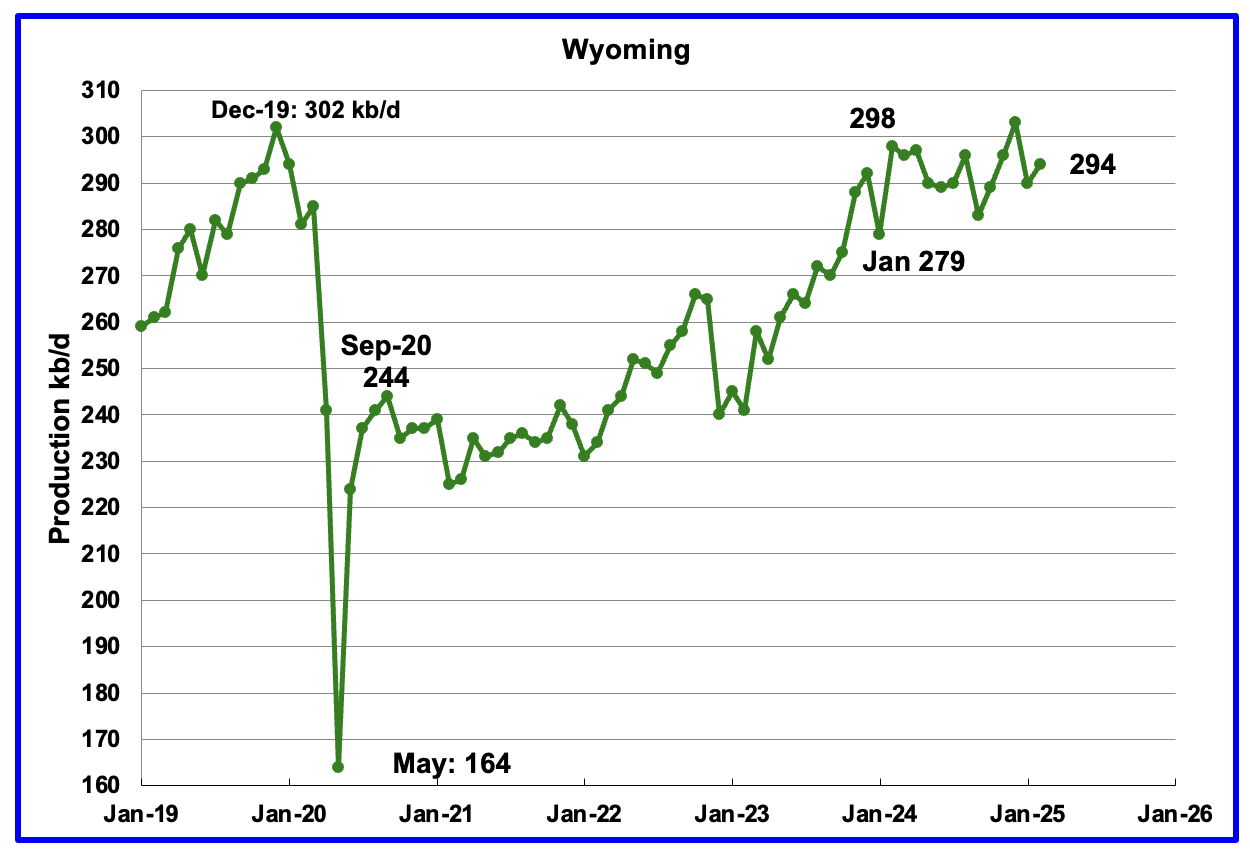
Wyoming’s oil production has been rebounding since March 2023. However the rebound was impacted by the January 2024 storm. Production peaked in February 2024 and is now showing signs of being on a plateau. February’s production rose by 4 kb/d to 294 kb/d.
In August Wyoming had 8 operational rigs. The rig count has slowly risen to 14 from November to January and to 16 in April.
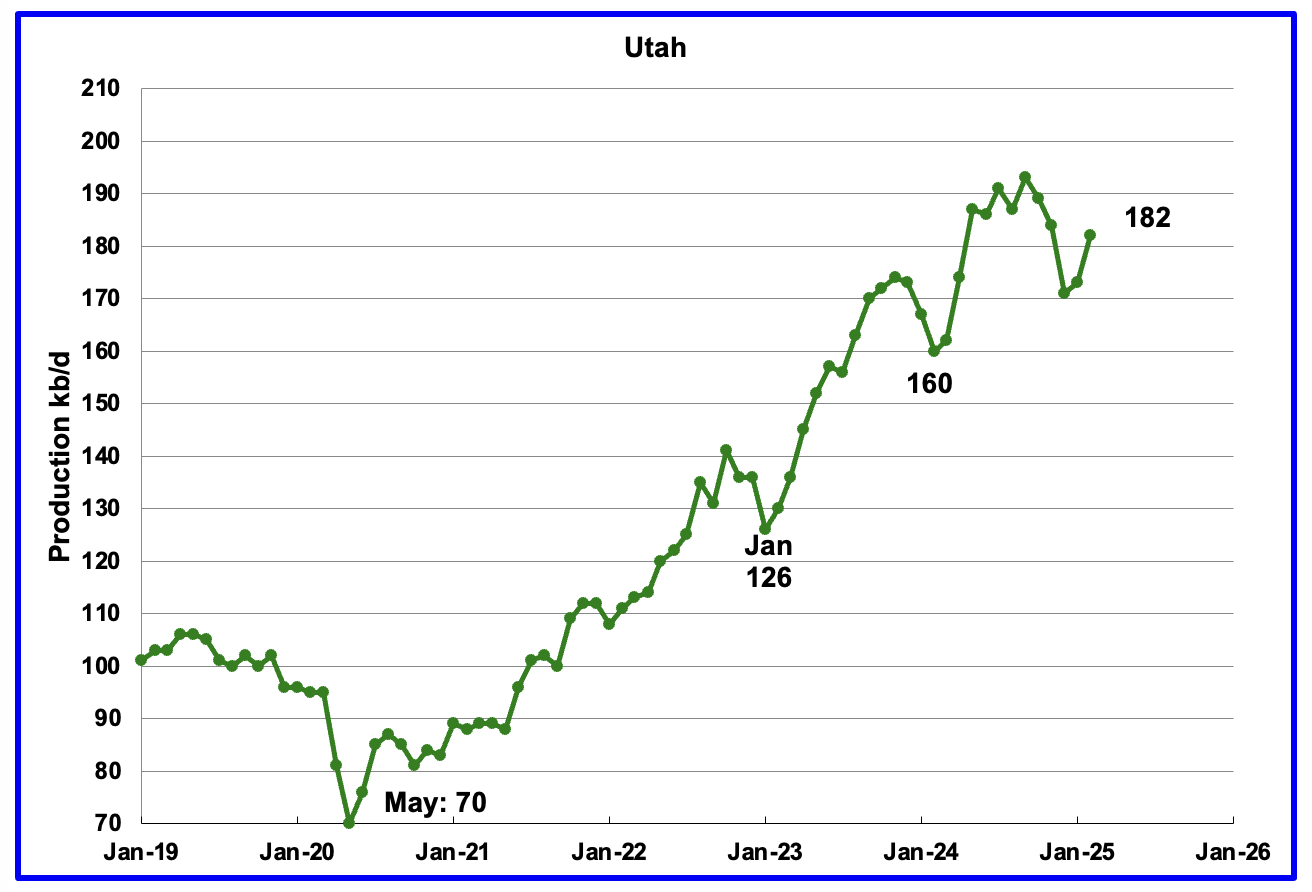
February’s production increased by 9 kb/d to 182 kb/d. Utah had 8 rigs operating from October through April.
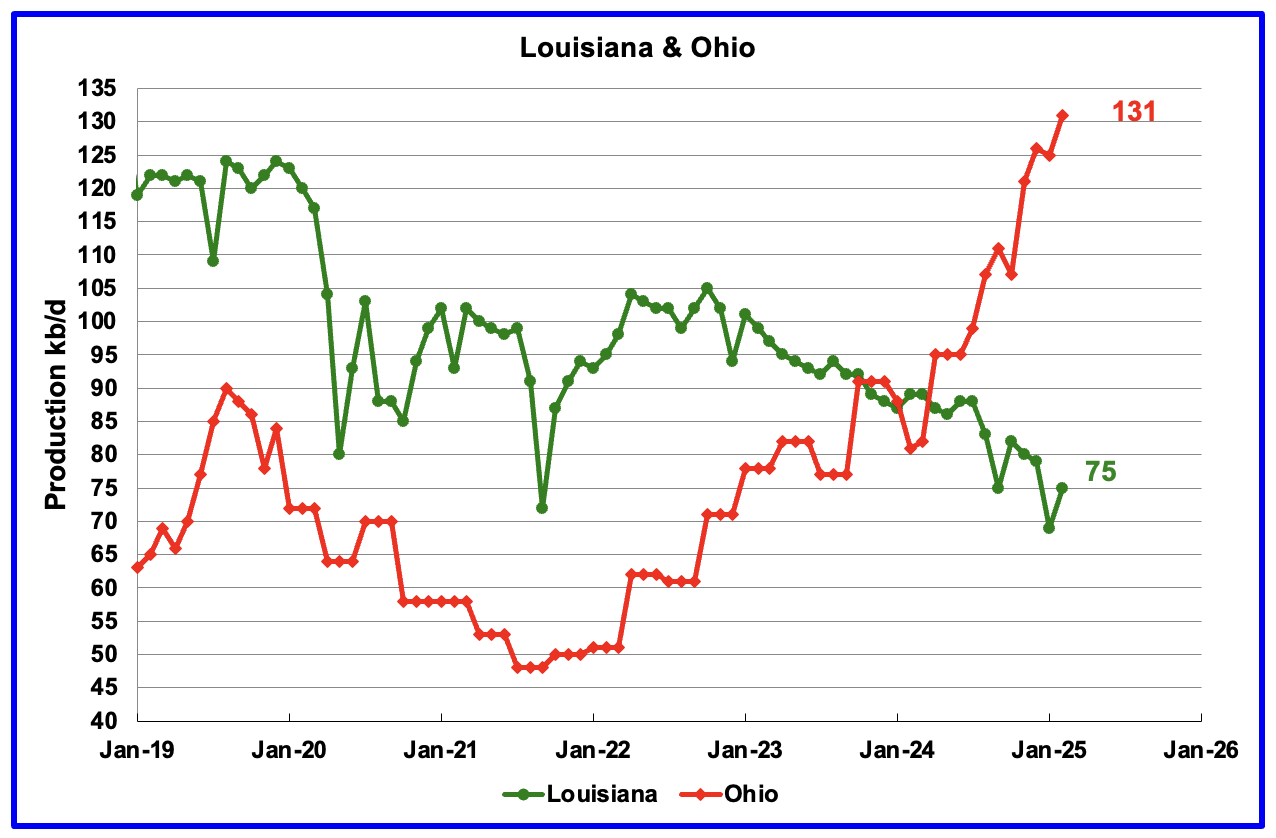
Ohio has been added to the Louisiana chart because Ohio’s production has been slowly increasing since October 2021 and passed Louisiana in November 2023.
Louisiana’s output entered a slow decline phase in October 2022 and continued to fall in January but recovered a bit in February. February’s production rose by 6 kb/d to 75 kb/d. As of all of 2025, there are no oil rigs operating in Louisiana. In November 2024, one rig was operating. Anybody have any thoughts on this and can it be confirmed?
Ohio’s February oil production increased by 6 to 131 kb/d, a new record high. The most recent Baker Hughes rig report shows 1 horizontal oil rig operating in Ohio in December and January. In April, 8 rigs were operational. Is Ohio’s crude primarily condensate recovered from NG wells?
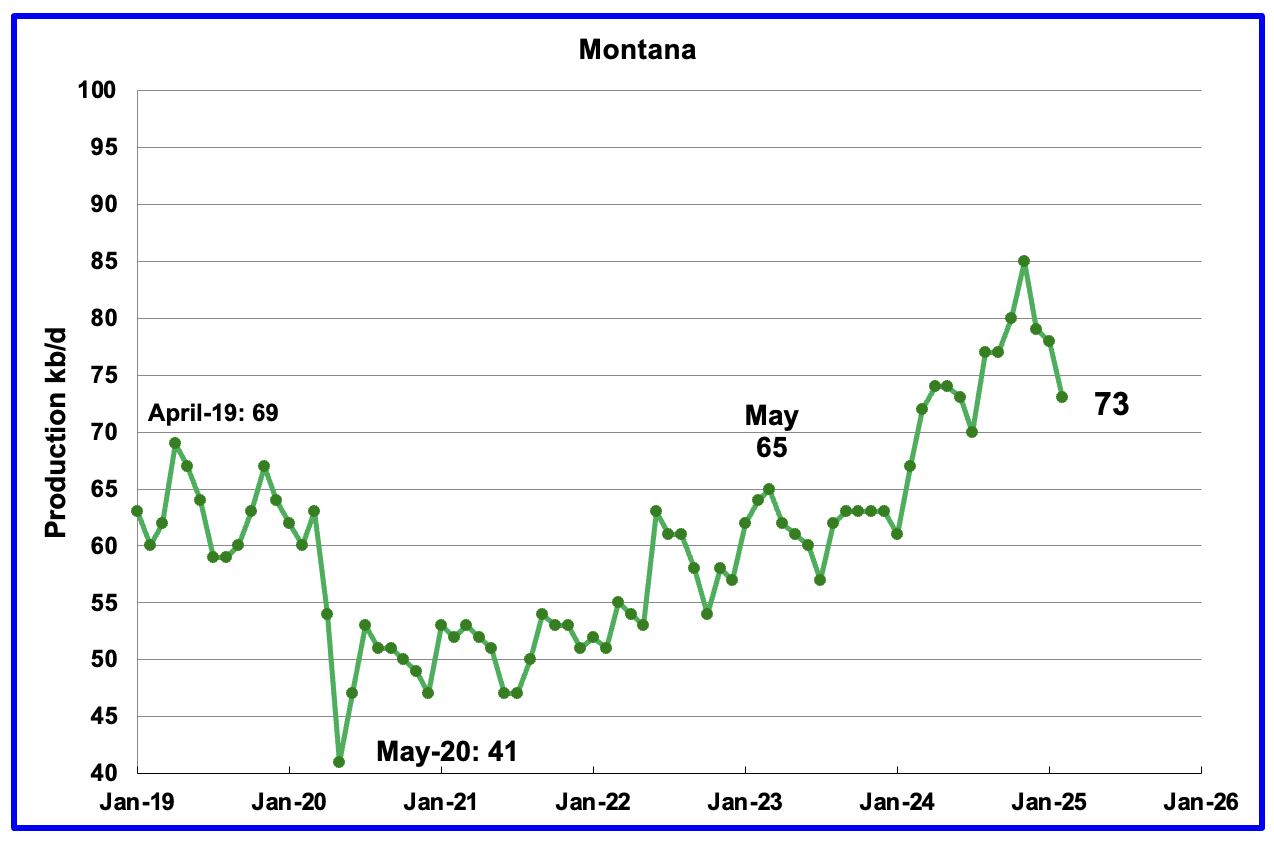
February’s oil production dropped by 5 kb/d to 73 kb/d. Montana had one oil rig operating from December through April.
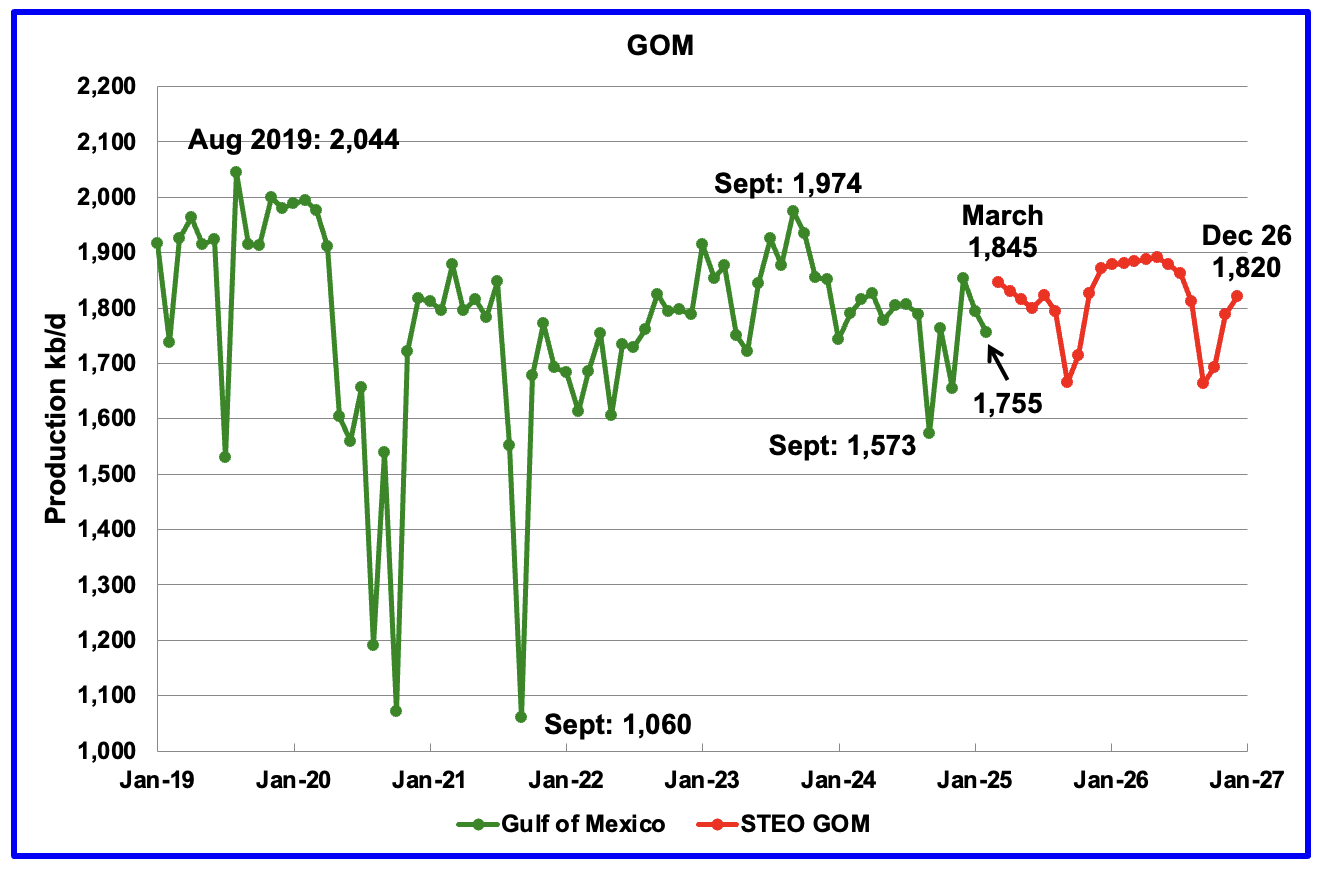
GOM production dropped by 39 kb/d in February to 1,755 kb/d vs the STEO forecast that it was expected to rise to 1,865 kb/d in February, a 110 kb/d over estimation. March production is projected to rise to 1,845 kb/d.
The April 2025 STEO projection for the GOM output has been added to this chart. It projects production in December 2026 will be 25 kb/d lower than March 2025 at 1,820 kb/d.
According to the OPEC MOMR, in the coming months, output is expected to be supported by project ramp-ups and several new projects, such as the deepwater Whale platform that started production in January.
A Different Perspective on US Oil Production
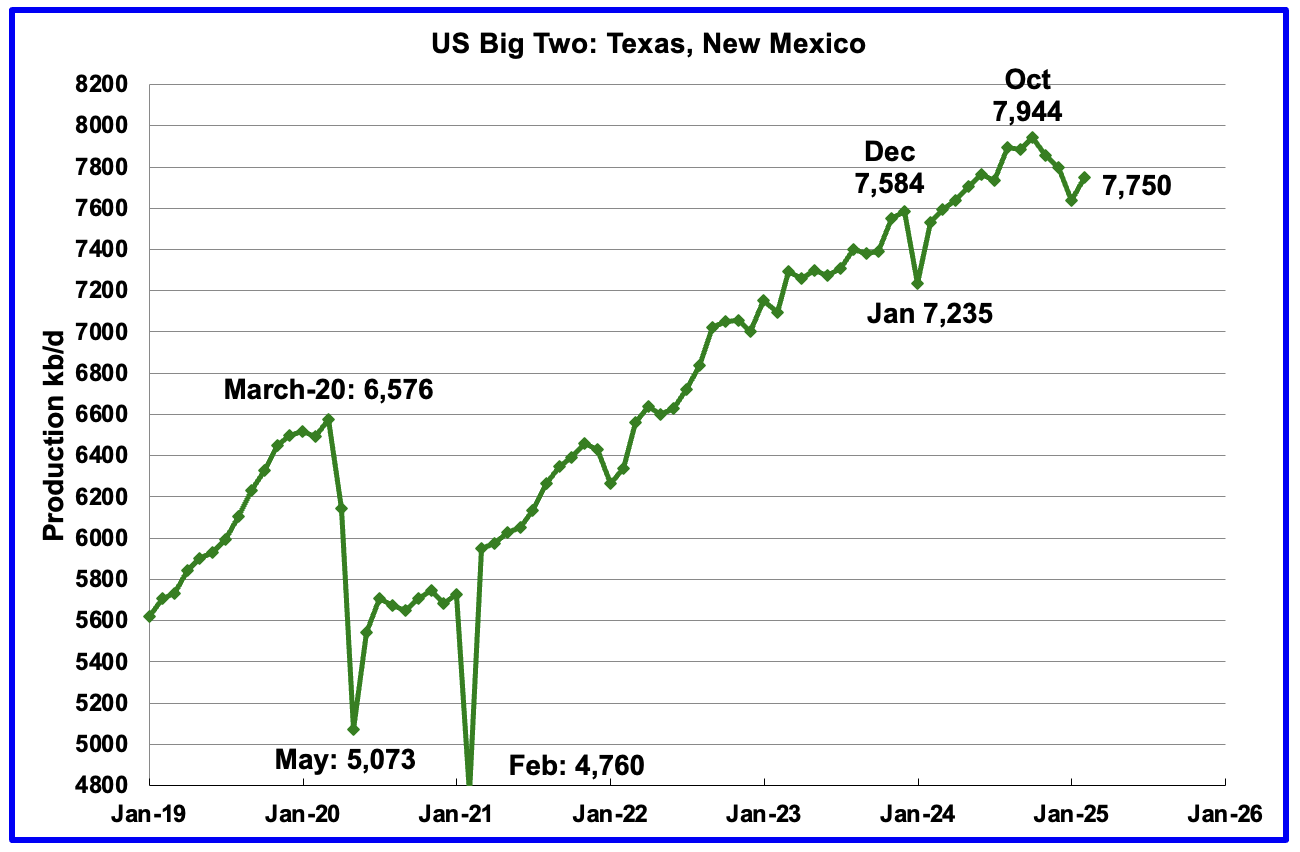
Combined oil output for the Big Two states Texas and New Mexico.
February’s production in the Big Two states increased by a combined 113 kb/d to 7,750 kb/d and is 194 kb/d lower than October 2024. Clearly these two states were the drivers of US oil production growth up to October 2024. Has the trend flipped?
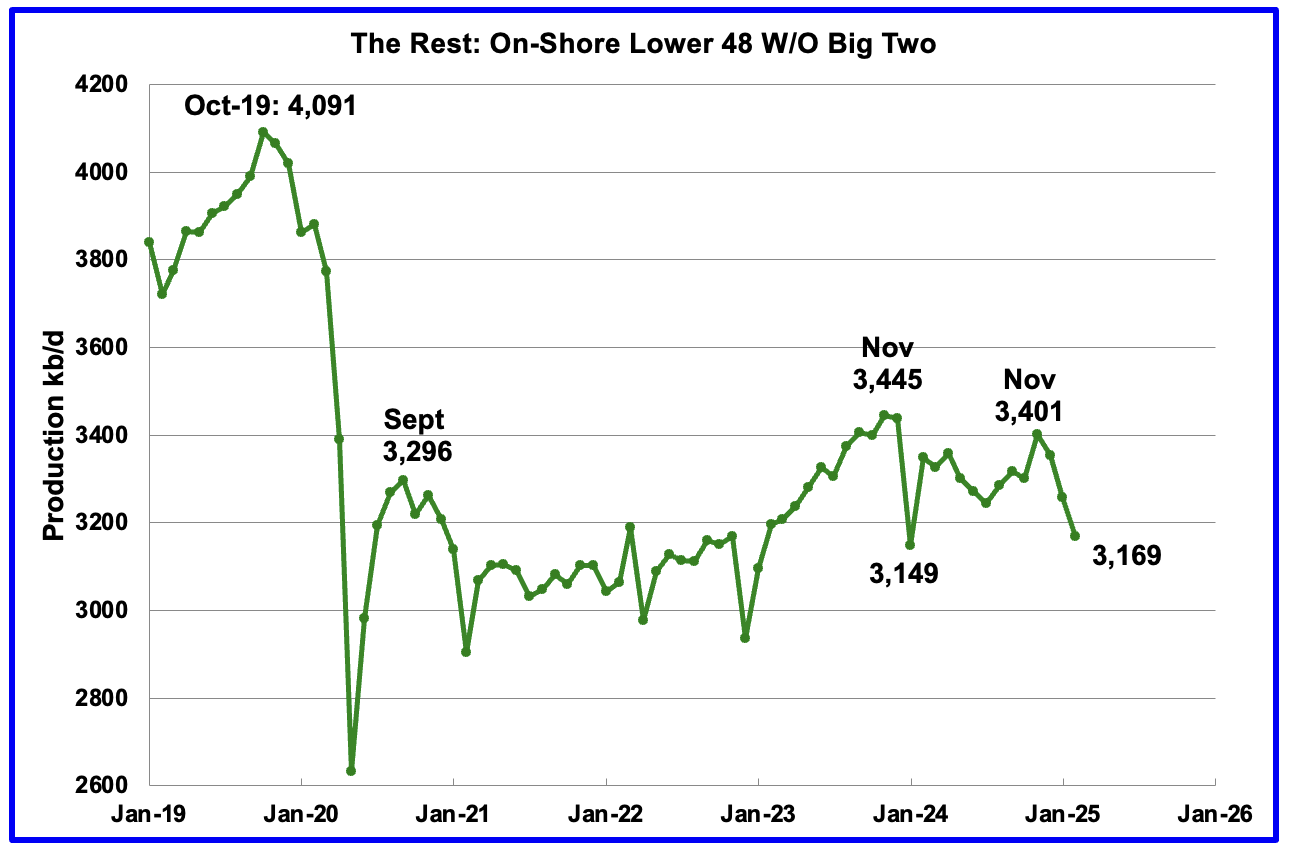
Oil Production by The Rest
February’s oil production by The Rest dropped by 89 kb/d to 3,169 kb/d and is 232 kb/d lower than November 2023.
Permian Basin Report for Main Counties and Districts
This special monthly Permian section was added to the US report because of a range of views on whether Permian production will continue to grow or will peak over the next year or two. The issue was brought into focus recently by two Goehring and Rozencwajg Report and Report2 which indicated that a few of the biggest Permian oil producing counties were close to peaking or past peak. Also comments by posters on this site have similar beliefs from hands on experience.
This section will focus on the four largest oil producing counties in the Permian, Lea, Eddy, Midland and Martin. It will track the oil and natural gas production and the associated Gas Oil Ratio (GOR) on a monthly basis. The data is taken from the state’s government agencies for Texas and New Mexico. Typically the data for the latest two or three months is not complete and is revised upward as companies submit their updated information. Note the natural gas production shown in the charts that is used to calculate the GOR is the gas coming from both the gas and oil wells.
Of particular interest will be the charts which plot oil production vs GOR for a county to see if a particular characteristic develops that indicates the field is close to entering or in the bubble point phase. While the GOR metric is best suited for characterizing individual wells, counties with closely spaced horizontal wells may display a behaviour similar to individual wells due to pressure cross talking . For further information on the bubble point and GOR, there are a few good thoughts on the intricacies of the GOR in an earlier POB comment and here. Also check this EIA topic on GOR.
New Mexico Permian
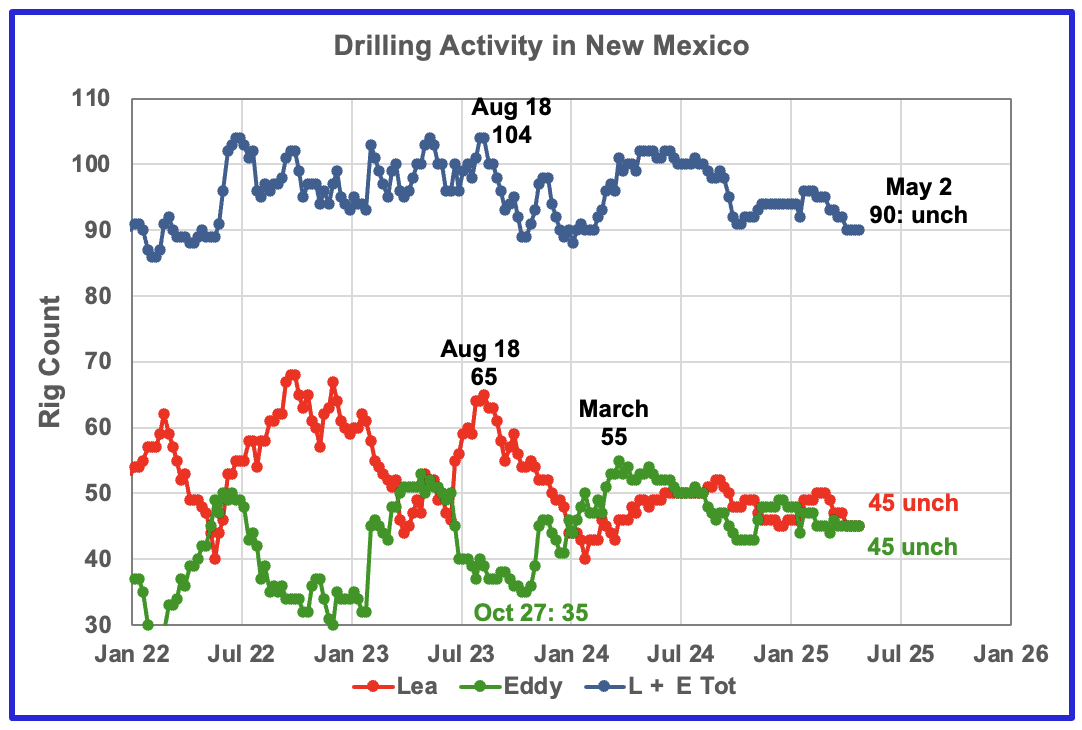
The total rig count in Lea and Eddy counties in the week ending May 2 was 90 and is down 10 from the July 2024 count of 100. The total rig count has held steady at 90 for the last four weeks.
Lea and Eddy county rigs have both stabilized around 45 over the last few months but are hinting at a slow decline.

Lea County’s oil production appears to have entered a plateau phase in May 2024 at 1,240 kb/d. February’s projected output saw an increase of 41 kb/d to 1,216 kb/d after the January drop to 1,175 kb/d. Preliminary February data from New Mexico’s Oil Conservation Division (OCD) indicates Lea County’s oil production increased by 30 kb/d to 1,170 kb/d.
Production has been essentially flat to slightly down since May 2024 as the rig count fell. February’s large production increase could be related to a production rebound associated with January’s cold weather.
The blue graph shows the average number of weekly rigs operating during a given month as taken from the weekly rig chart. The rig graph has been shifted forward by 8 months. So the 64 Rigs/wk operating in August 2023 have been time shifted forward to April 2024 to show the possible correlation and time delay between rig count, completion and oil production.
Comparing the flattening oil production since May with the dropping time shifted rig count, indicates/implies the newer wells drilled since June had higher IPs to offset the decline associated with the fewer wells drilled by the declining rig count. The rising rig count starting in November 2024 may be able to slow the declining/flattening production in Lea County but the writing on the wall is saying that Lea County is close to peak production.
Note that rig counts are being used to project production as opposed to completions because very few extra DUCs are being completed at this time.
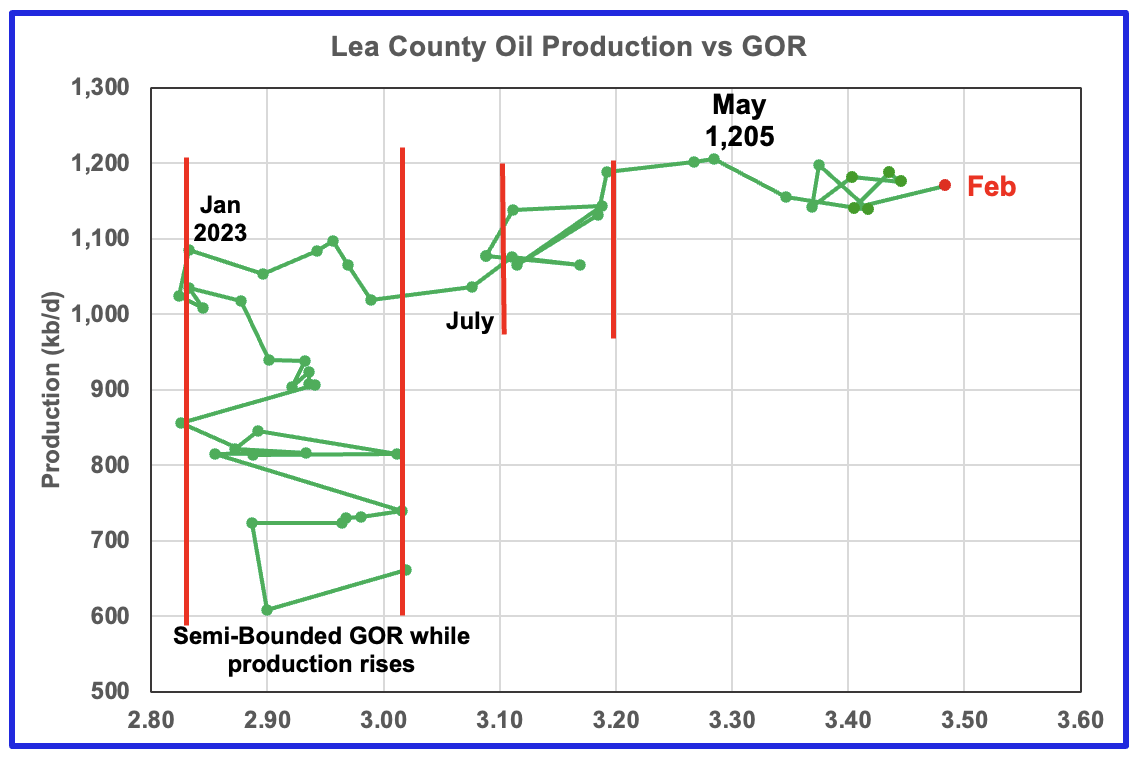
After much zigging and zagging, oil production in Lea county stabilized just below 1,100 kb/d in early 2023. Once production reached a new high in January 2023, production appeared to be on a plateau while the GOR started to increase rapidly to the right and entered the bubble point phase in July 2023.
Since July 2023 the Lea County production has continued to increase as the GOR remained within a second semi-bounded region. This may indicate the recent additional production is coming from a new field/area since the GOR’s behaviour since August 2023 to March 2024 time frame appears once again to be in a semi bounded GOR phase accompanied with rising production.
The GOR moved out of the second semi-bounded GOR region in April and hit a new high in May. Since July the GOR has bounced around 3.4. February saw a production rise as the GOR increased to a new high of 3.48.
This zigging and zagging GOR pattern within a semi-bounded GOR while oil production increases to some stable level and then moves out to a higher GOR to the right has shown up in a number of counties. See a few additional cases below.
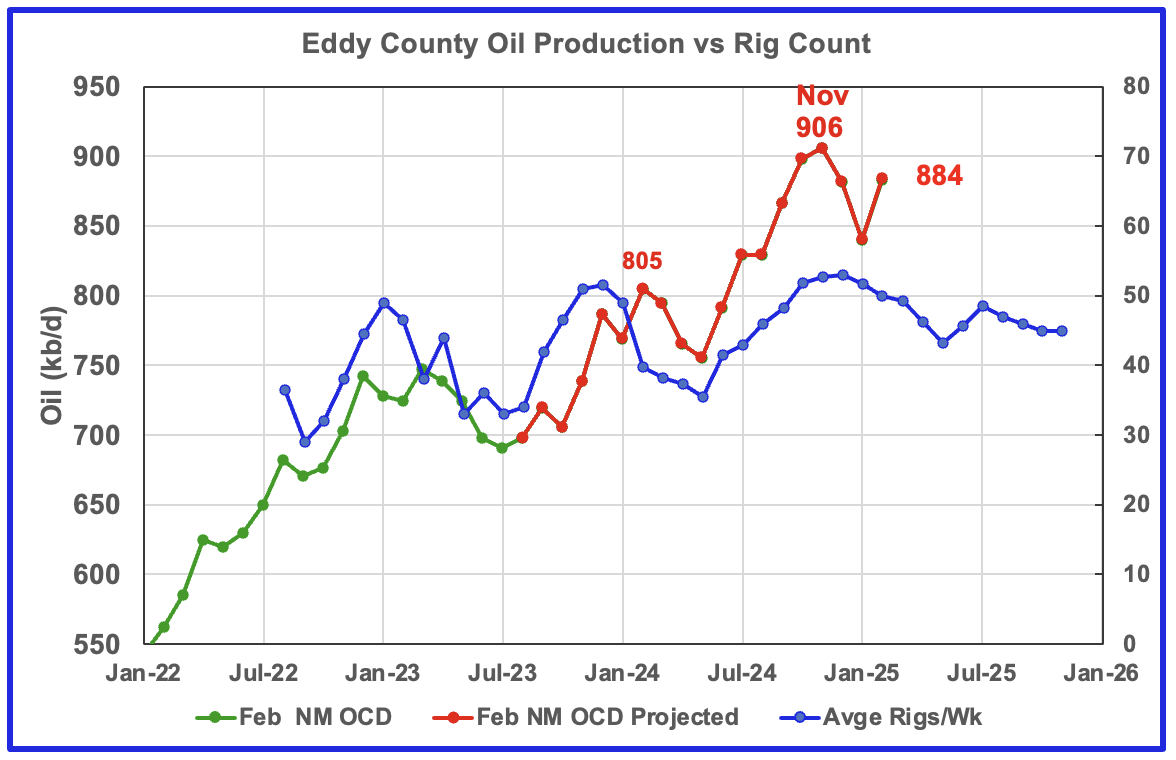
February’s projected oil production increased by 44 kb/d to 884 kb/d. Similar to Lea County, the production increase could be due to a rebound from January’s bad weather.
Eddy County’s oil production first peaked in February 2024 at 805 kb/d. After dropping for three months, the number of rigs and associated wells increased and so did oil production. From May to November, production rose from 755 kb/d to 906 kb/d, an increase of 151 kb/d, while essentially paralleling the increasing rig count. Over that same time shifted rig period, 14 to 15 rigs were added to Eddy County as production rose. Was a new Tier 1 region/area discovered to attract such a large increase in the rig count?
In November 2024 the projected oil production increased by 8 kb/d to a new high of 906 kb/d. This smaller increase relative to previous months also appears to reflect the production impact associated with the slowing increase in the rig count.
The blue graph shows the average number of weekly rigs operating during a given month as taken from the above weekly drilling chart. The rig graph has been shifted forward by 7 months to roughly coincide with the increase in the production graph starting in November 2023.
Clearly the production rise up to November 2024 is closely associated with the rise in the rig count and associated well completions delayed by roughly seven months. The smaller November increase is the second clue that the production rise associated with increasing rigs is about to end. The dropping rig count starting in January 2025 implies that production in Eddy county may be heading into a short term plateau phase between 850 kb/d and 900 kb/d.
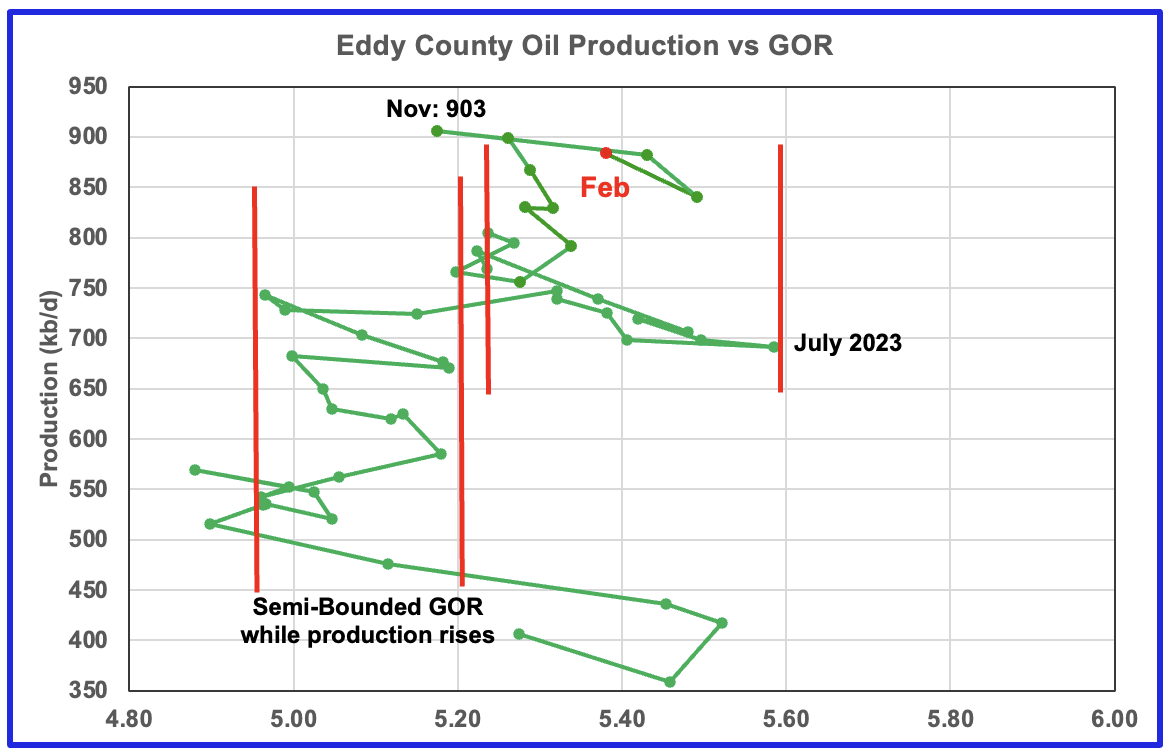
The Eddy county GOR pattern is similar to Lea county except that Eddy broke out from the semi bounded range earlier and for a longer time and then added a second semi bounded GOR phase. For February New Mexico’s Oil Conservation Division (OCD) reported oil production increased by 43 kb/d to 883 kb/d and stayed within the second semi-bounded region.
Note the big increase in the GOR from November to January. The February drop in GOR along with rising oil production implies the new wells are being drilled in a region/area with a much lower GOR.
Texas Permian
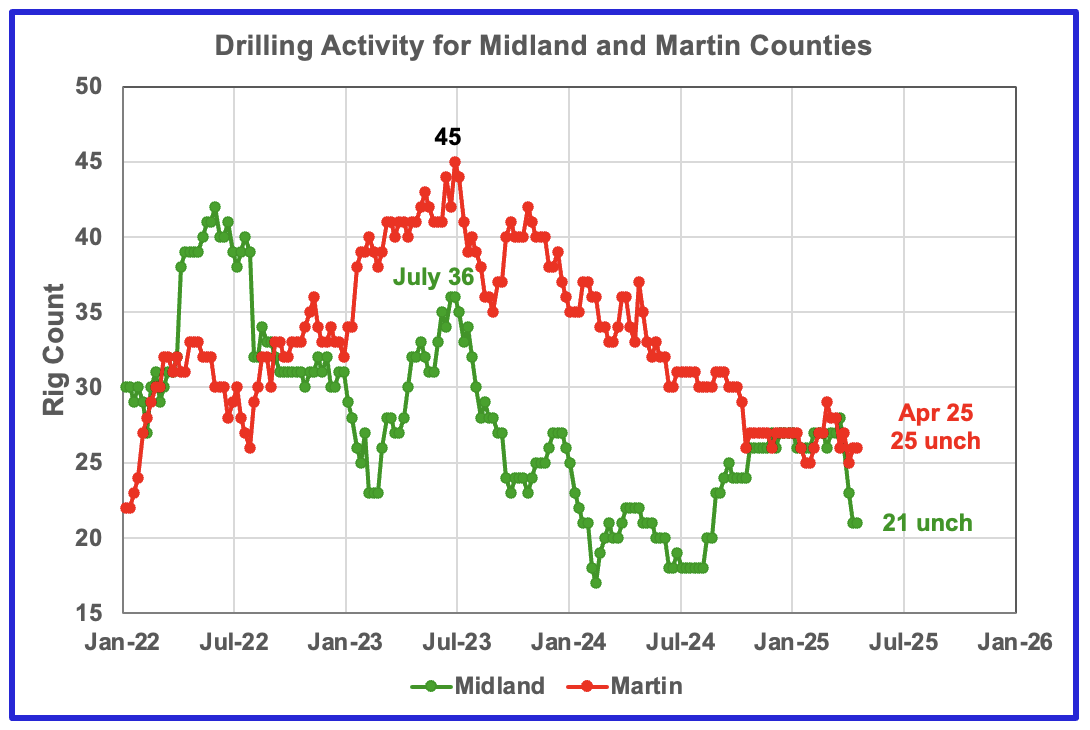
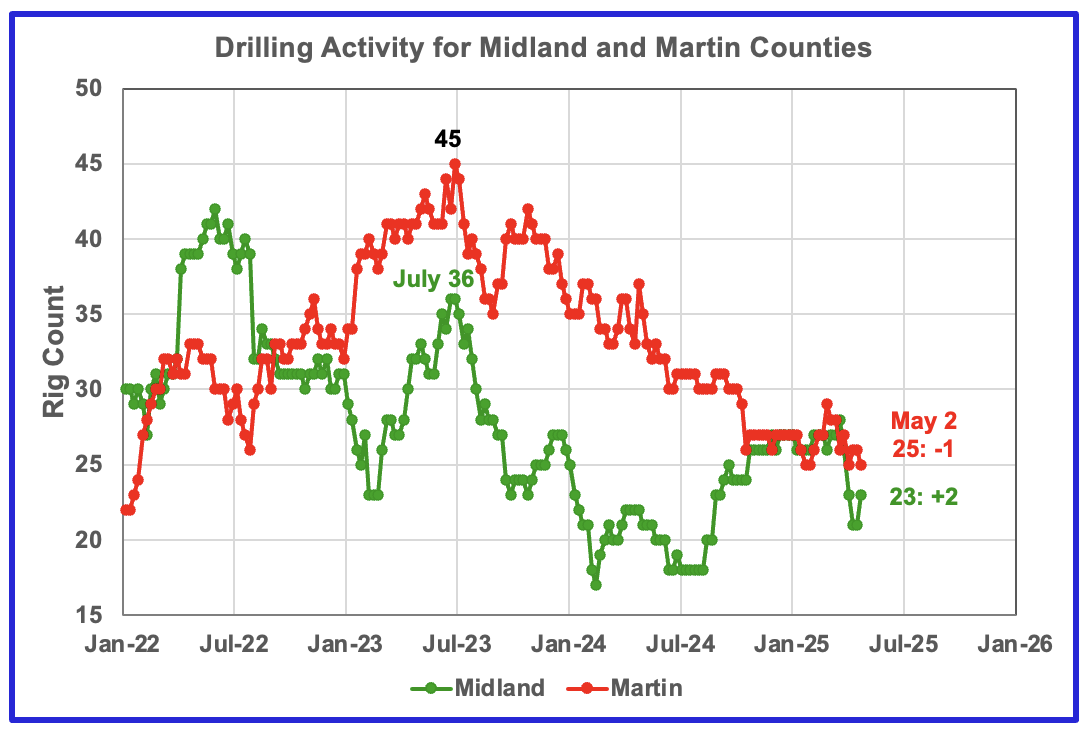
The Midland county rig count has been rising since July 2024 and was up 10 to 28 at the end of March 2025. However it dropped by 7 rigs to 21 by the end of April has rebounded by 2 to 23 in the first week of May.
The opposite is true for Martin county. In the week ending May 2, 25 rigs were operational, down 19 from 45 in July 2023. Since the end of October Martin’s rig count has been fairly steady around 26.
Oil Production in Texas Counties
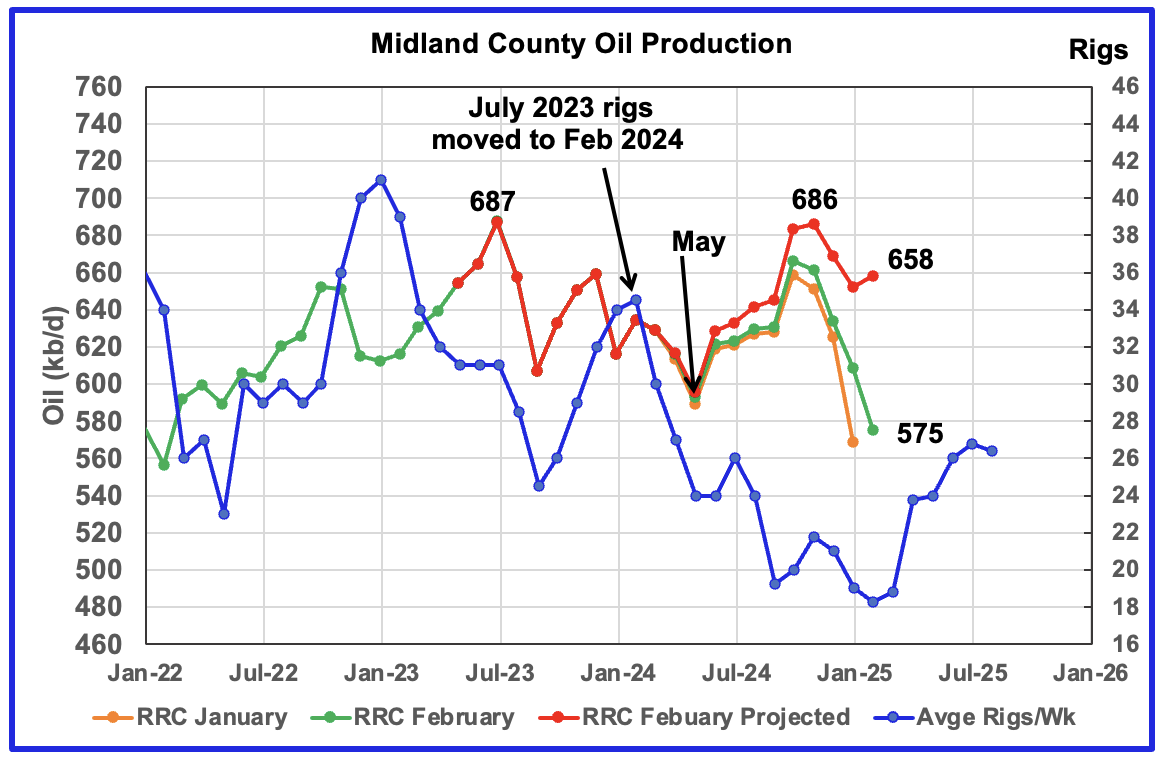
February’s projected production added 6 kb/d to 658 kb/d. Both the December and January projected production reported in the previous post have been revised lower as expected because large updates to earlier months did not occur. December dropped by 15 kb/d to 669 kb/d and January dropped by 10 kb/d to 652 kb/d.
The orange and green graphs show the oil production for Midland County as reported by the Texas RRC for January and February. The red graph uses the January and February data to project production as it would look after being updated over many months.
Even though the rig count is dropping, I think the increase in the projected production after May 2024 is real based on the increasing preliminary production shown from June to October in the latest February RRC report. Flat October and November production and December dropping is signalling an imminent production peak/plateau.
The blue graph shows the average number of weekly rigs operating during a given month as taken from the weekly drilling chart. The rig graph has been shifted forward by seven months. So the average 34.5 Rigs/wk operating in July 2023 have been moved forward to February 2024 to show the possible correlation and time delay between rig count, completions and oil production. If the seven month shift in the rig count is approximately correct in that oil production can be tied to the rig count, oil production in Midland county should increase starting in April for a month or two before resuming its decline.
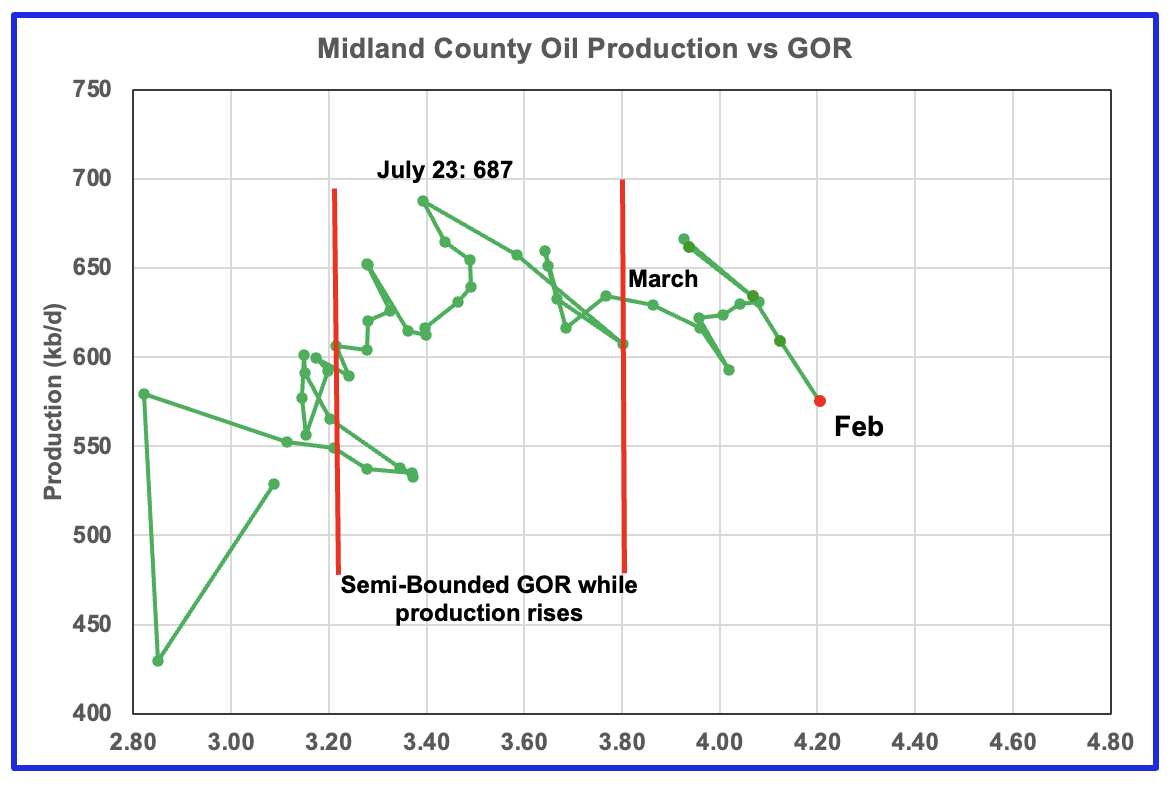
For February the GOR ratio increased to 4.21 from January’s 4.13 while reported preliminary oil production dropped.
With Midland county into the bubble point phase, oil production and the GOR have stayed within a narrow range outside of the initial Semi-Bounded GOR region since March. February GOR increased over January while production came in at a new low since the July 2023 production high.
The oil production and GOR shown in this chart are based on the RRC’s February production report. Note that while the last few months are subject to revisions, the July 2023 to May 2024 production data has been steady for a number of months.
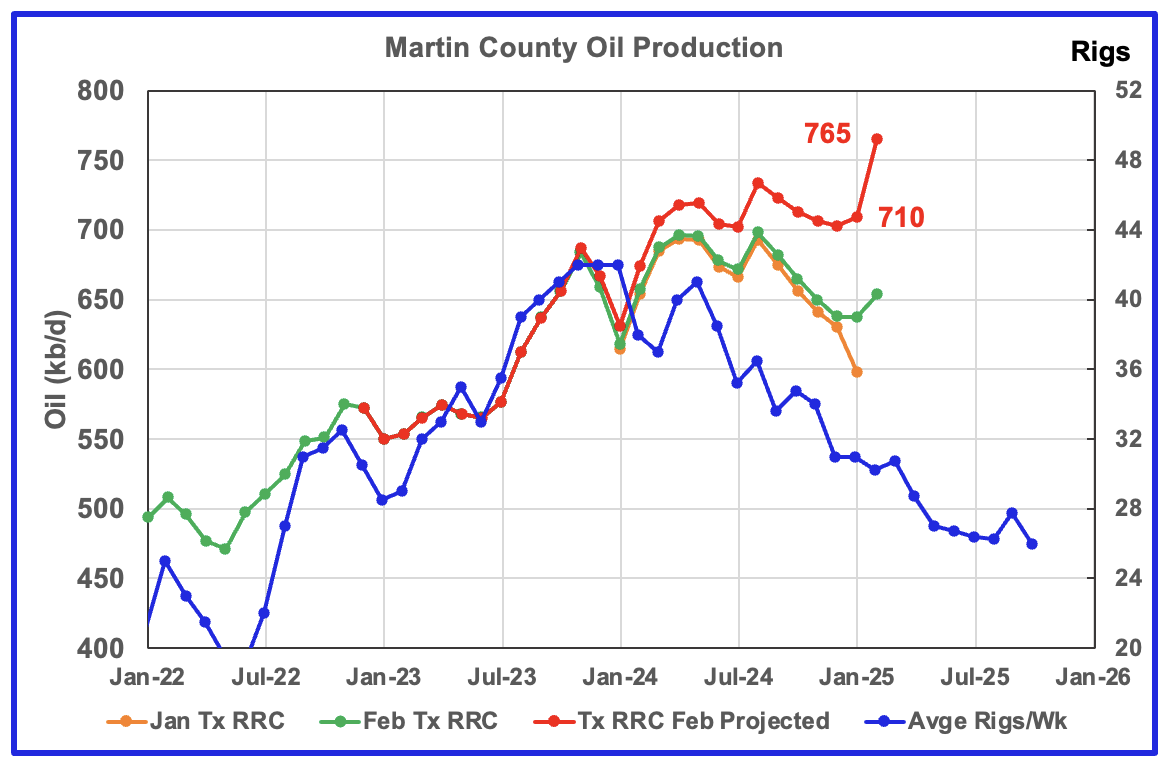
Martin county’s projected February oil production increased by 55 kb/d to 765 kb/d. The February projection is an over correction due to production being too low in January due to bad weather. The trend from May 2024 to January 2025 is a more realistic production projection for Martin county, it’s on a plateau. For example, January production reported in the previous post has been revised down by 42 kb/d from 752 kb/d to 710 kb/d.
The orange and green graphs show the production for Martin County as reported by the Texas RRC for January and February. The blue chart shifts the rig count ahead by 6 months.
The red graph is a projection for oil production as it would look after being updated over many months. This projection is based on a methodology that uses preliminary January and February production data. The green graph shows oil production reported by the Texas RRC for February and it is higher than January’s. Note how production has dropped from September 2024 to January 2025, green graph.
My best guess for Martin County production is that it is on a plateau closer to 725 kb/d and on the verge of starting to decline as indicated by the production from August to January.
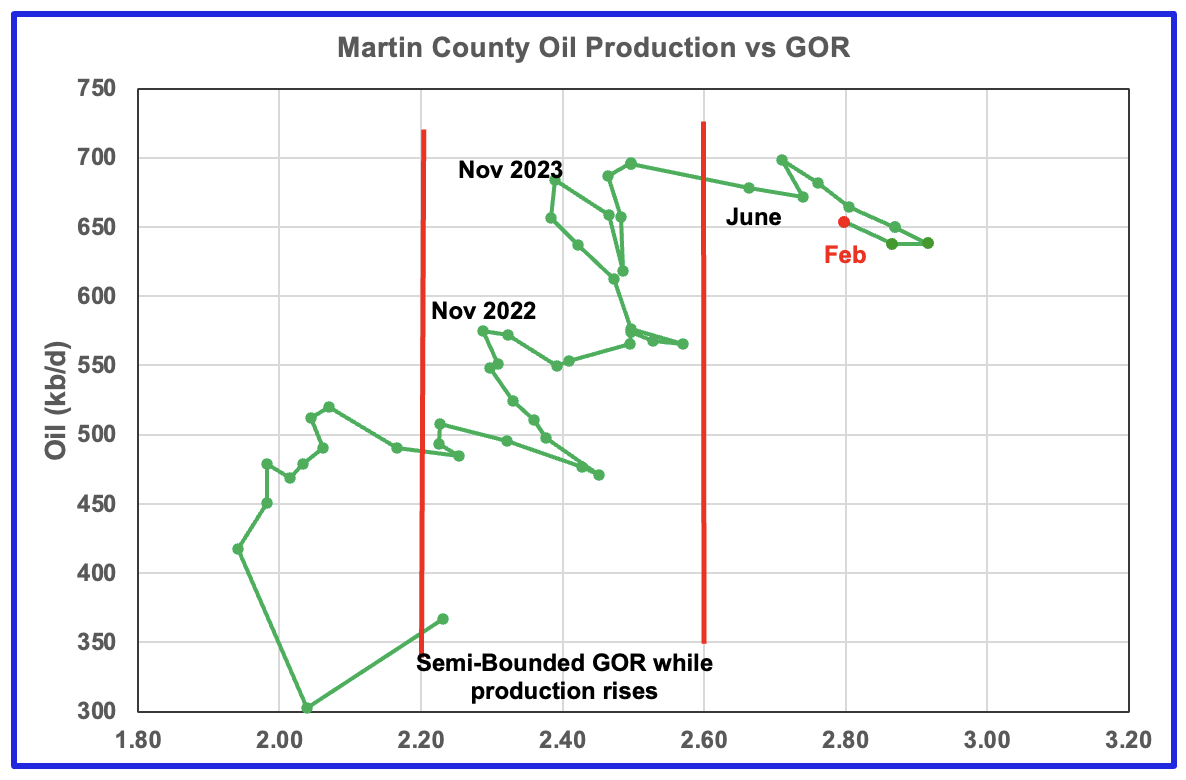
Martin county’s oil production after November 2022 increased and at the same time drifted to slightly higher GORs within the semi bounded range. However the June 2024 GOR saw its first move out of the semi bounded region. The preliminary Texas RRC’s February production for Martin county shows a decrease in the GOR accompanied by an increase in oil production.
Martin county has the lowest semi-bounded GOR boundary of the four counties at a GOR of close to 2.60. In February the GOR dropped from 2.87 in December to 2.80. Nevertheless, it is clearly out of the semi-bounded region. Martin County has now entered the bubble point phase that should result in oil production entering a plateau phase.
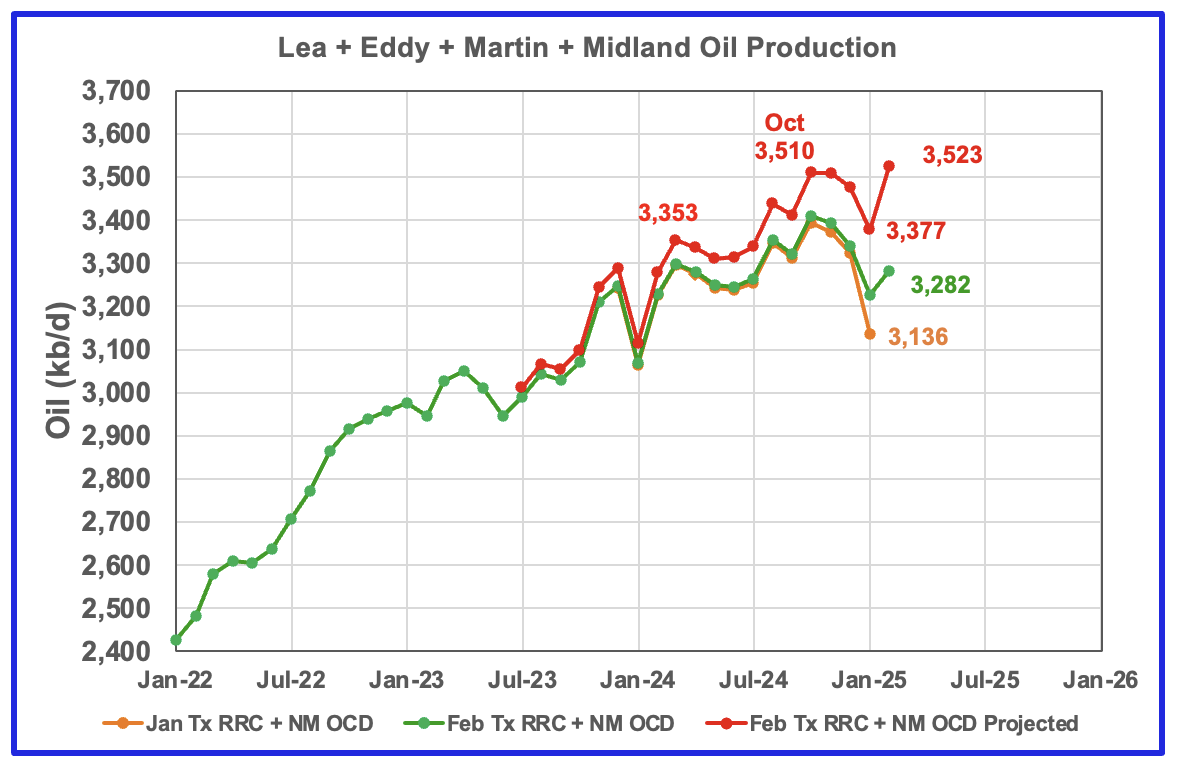
This chart shows the total oil production from the four largest Permian counties. Assuming that current February Permian production is close to 6,400 kb/d, these four counties account for close to 54% of the total. The projection for February production is overly optimistic primarily because Martin’s January production was too low which resulted in an optimistic projection for February. Also the February rise is related to smaller production increases in the other three counties. A more realistic projection would be closer to a plateau between 3,400 kb/d and 3,500 kb/d, possibly showing up next month.
The January and February initial production data is shown in the orange and green graphs respectively. The red graph uses the January and February data to project an estimate for the final February production. The large February rise is related to the production rise in all four counties.
The projection indicates that February production from these four counties increased by 146 kb/d to 3,523 kb/d. The combined preliminary February production data is higher than January’s by 146 kb/d to 3,282 kb/d.
This Article reports that: “When Exxon Mobil and Chevron report first-quarter results this week, investors will be focused on how falling oil prices have increased the risk to dividends and share repurchases for the rest of 2025.”
It further notes that: “Chevron may reduce buybacks if weak oil prices persist, said analysts from four firms. The second-largest U.S. oil company previously guided annual share repurchases between $10 billion and $20 billion.
The company is in the process of cutting up to $3 billion in costs and laying off up to 8,000 employees.”
Rystad has Lowered its production outlook for the US onshore L48 states.
“Expansion of oil production in the lower 48 US states is expected to be less than 150,000 barrels a day, as measured from the end of last year to the end of 2025, Rystad said Monday in a report. That’s down from a previous growth estimate of about 300,000 barrels a day. The consultant expects oil output in the region next year to decline based on current prices.
“We expect activity declines to be most concentrated in the Permian, as other basins already are in maintenance mode,” said Amber McCullagh, senior vice president at Rystad, referring the Permian Basin, the world’s biggest shale patch, which is located in West Texas and New Mexico.”
Findings
– The February production data was in general good and most of the projections are reasonable with only a few Texas counties being optimistic. In general all of the four largest county production charts are in a plateau phase. Taking into consideration that the price of WTI is stuck close to $60/b, the rig count is holding steady around 445, the continuing lower frac spread count and the plateauing of the four biggest counties, taken all together all point to peak production in the onshore lower 48 within the next six months.
– Lea county entered a plateau phase in May 2024. While oil production is not following the rig count graph directly, the dropping rig count is resulting in Lea production currently being on a plateau. The February projected production rise could be a rebound from the low January production associated with the January cold weather.
– Eddy County’s oil production initially peaked in February 2024. It started a new increasing phase in June as it followed the uptrend in the rig count and exceeded its previous February peak. Production peaked in November 2024 and is now in decline and possibly heading into a lower production plateau phase.
– Midland county peaked in July 2023 and has roughly followed the declining rig count graph up to May 2024. It appears to have started a new increasing phase in June 2024 and peaked in November 2024. November could be the beginning of its plateau phase.
– Martin County may have peaked in August 2024 and may have entered a plateau phase. The February projected production rise is due to the lower reported production for January which results in a too optimistic production for February. Regardless Martin county has been on a plateau closer to 725 kb/d for the last six months.
– All four of the largest Permian oil producing counties are now in their plateau phase with all four hinting that the decline phase is close at hand. Need a few more months of data to clarify the future growth/decline trend of these four counties.
Texas District 8
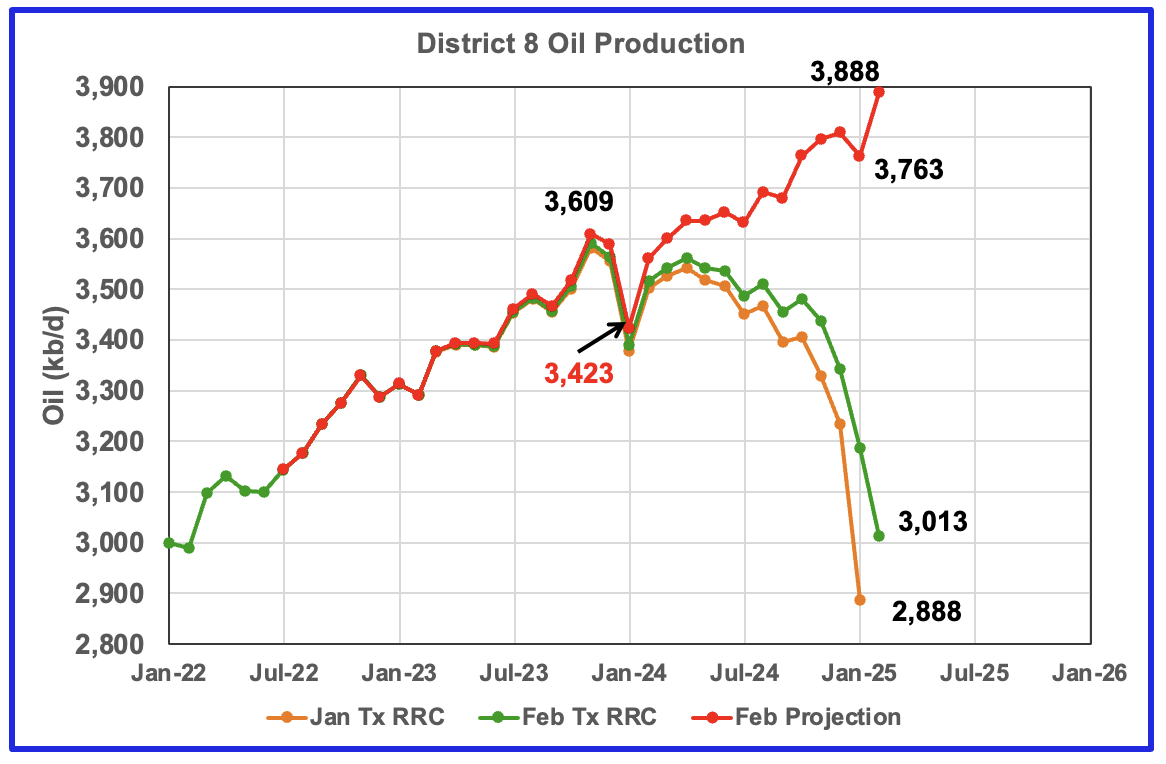
The large number of small revisions to the previous months in the February report has made the February production increase of 125 kb/d in District 8 optimistic. The major contributors being Martin and Loving. This optimistic increase will hopefully be corrected in the next report. Regardless the portion of the increase up to July 2024 is real and the January drop is more than likely real.
Texas District 8 contains 20 counties. Of the 20, eight are reviewed in this post, Midland, Martin, Loving, Reeves, Howard, Upton, Reagan and Glasscock. From January 2024 to January 2025, production in District 8 increased by 340 kb/d. Of the 340 kb/d increase, those eight counties accounted for 288 kb/d or 84.7% of the increase.
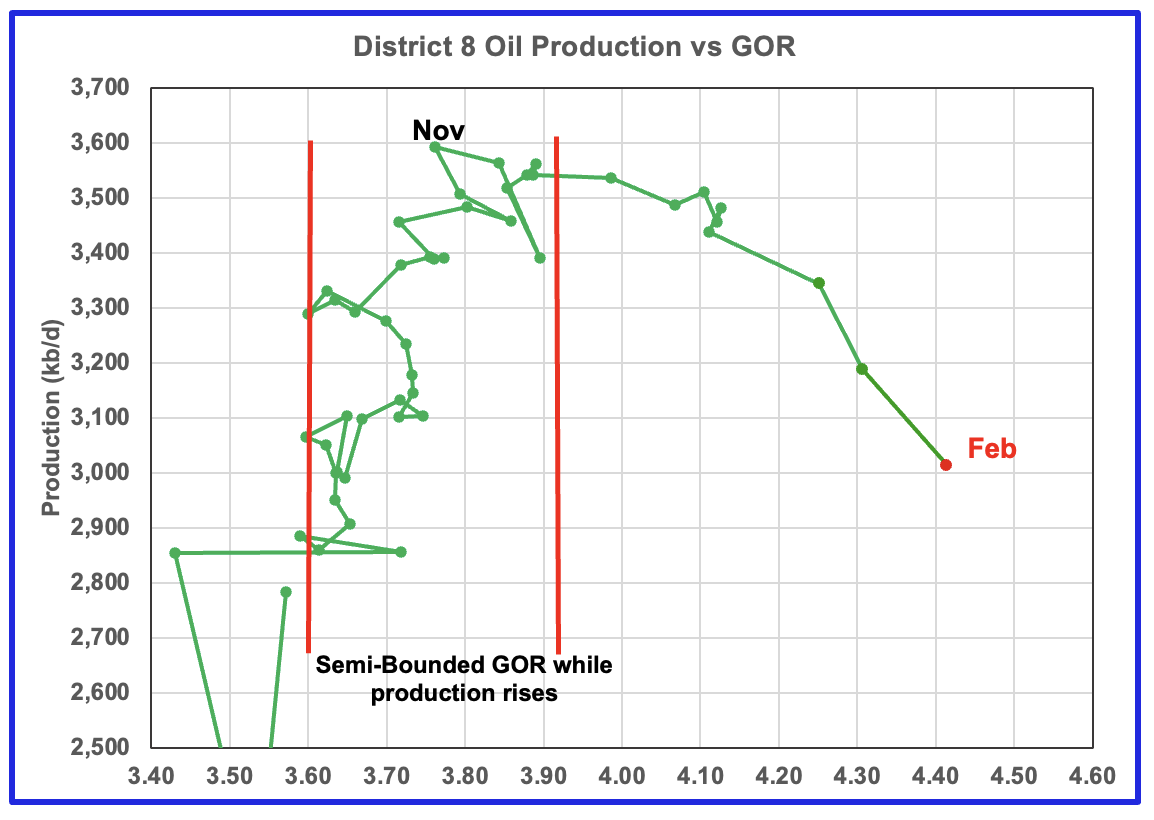
While the revisions in the production chart affect the projection, it does not affect the GOR.
Plotting an oil production vs GOR graph for a district may be a bit of a stretch. Regardless here it is and it seems to indicate many District 8 counties may well be into the bubble point phase. The GOR continued to increase in February to 4.41. This is another indicator that implies District 8 may be on a production plateau even though the projected production chart says otherwise.
Oil Production and GOR Charts for a number of Larger Texas Oil Producing Counties
Below are the next six top oil producing counties in Texas.
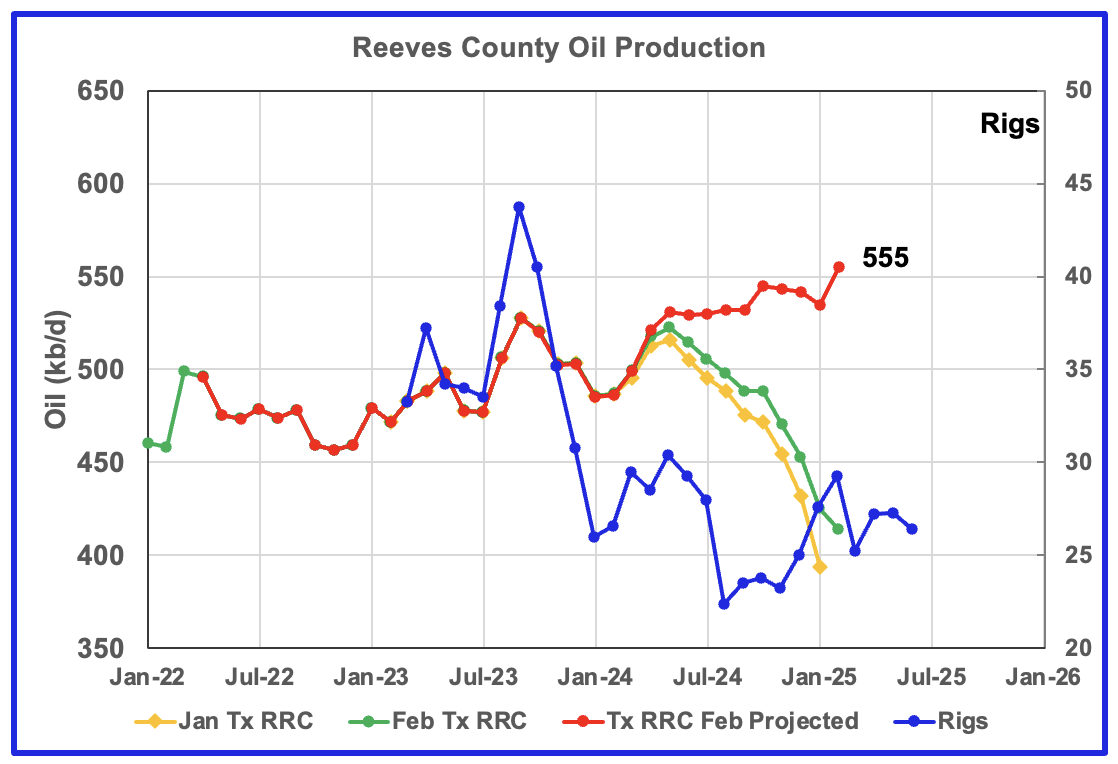
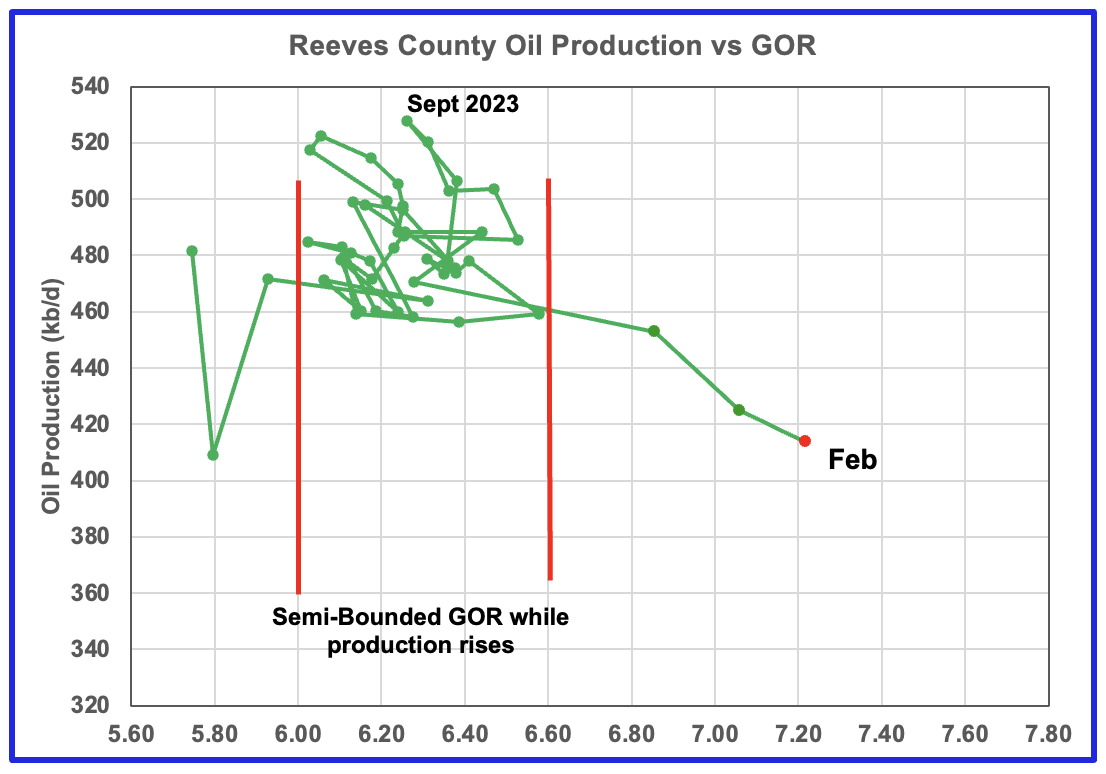
February’s projected oil production for Reeves county rose largely because the under production in January affects the February projection methodology. Production up to January is a better indicator of what to expect for oil production going forward. The GOR chart indicates that Reeves County entered the bubble point phase in December and production is entering a plateau phase before beginning to fall.
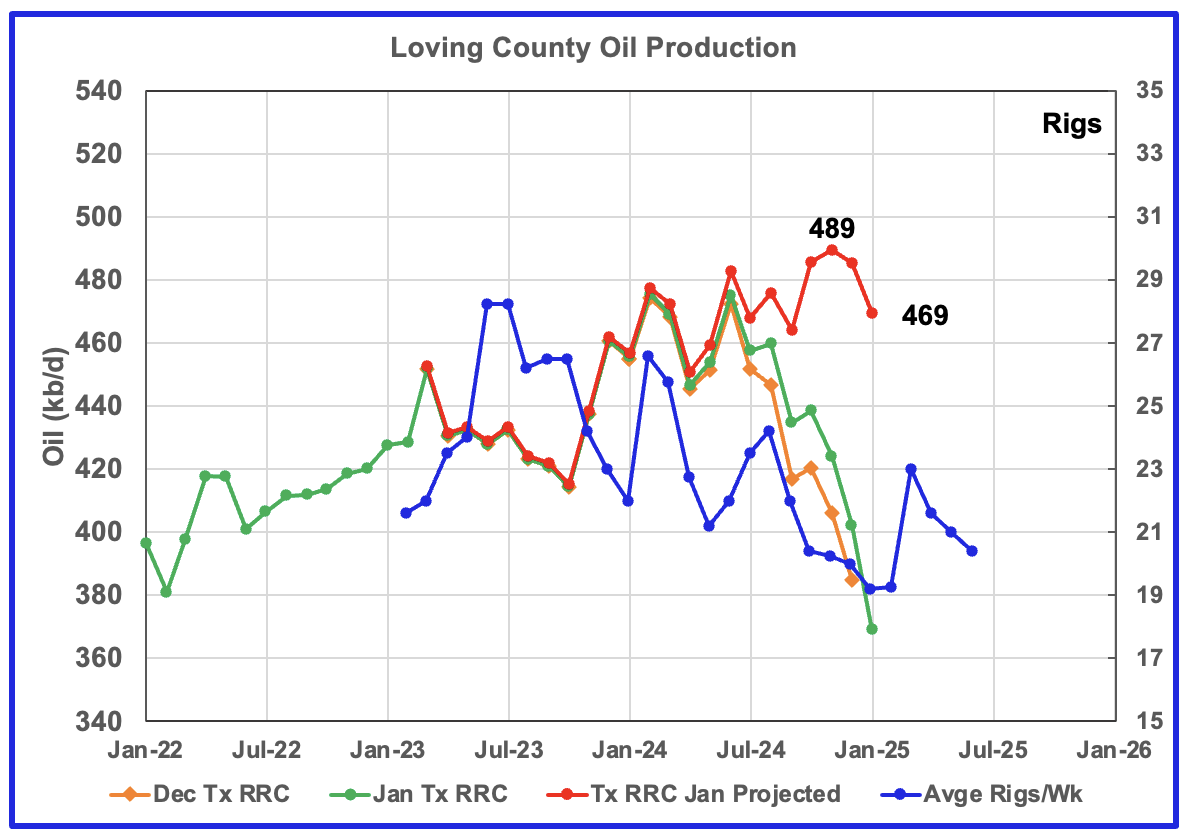
For Comparison: Loving’s January oil production chart posted in the April report.
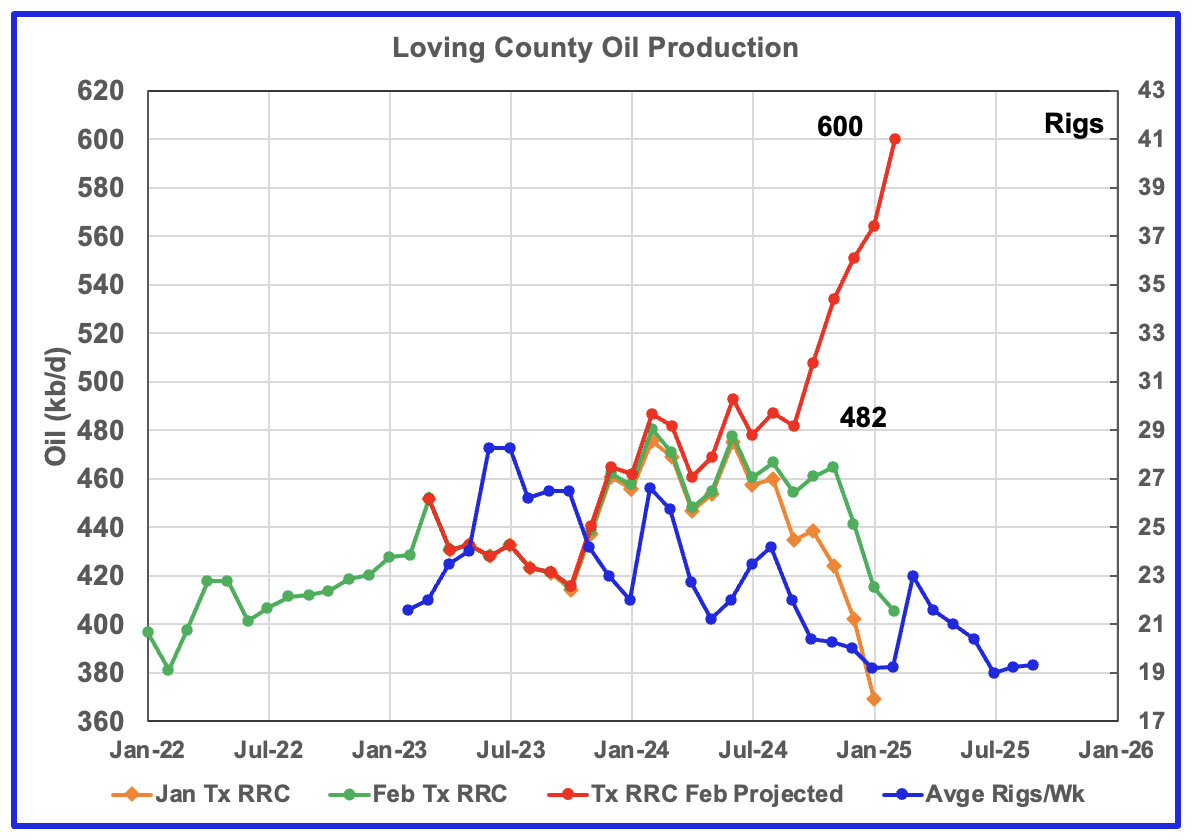
As can be seen by comparing the January and February production projection charts, Loving’s county production is very volatile. July 2024 to September 2024 are the last reasonable production points. Revisions to past months has made the post September projections questionable. However it is important to note that there was jump in the March rig count in the time shifted rig count graph.
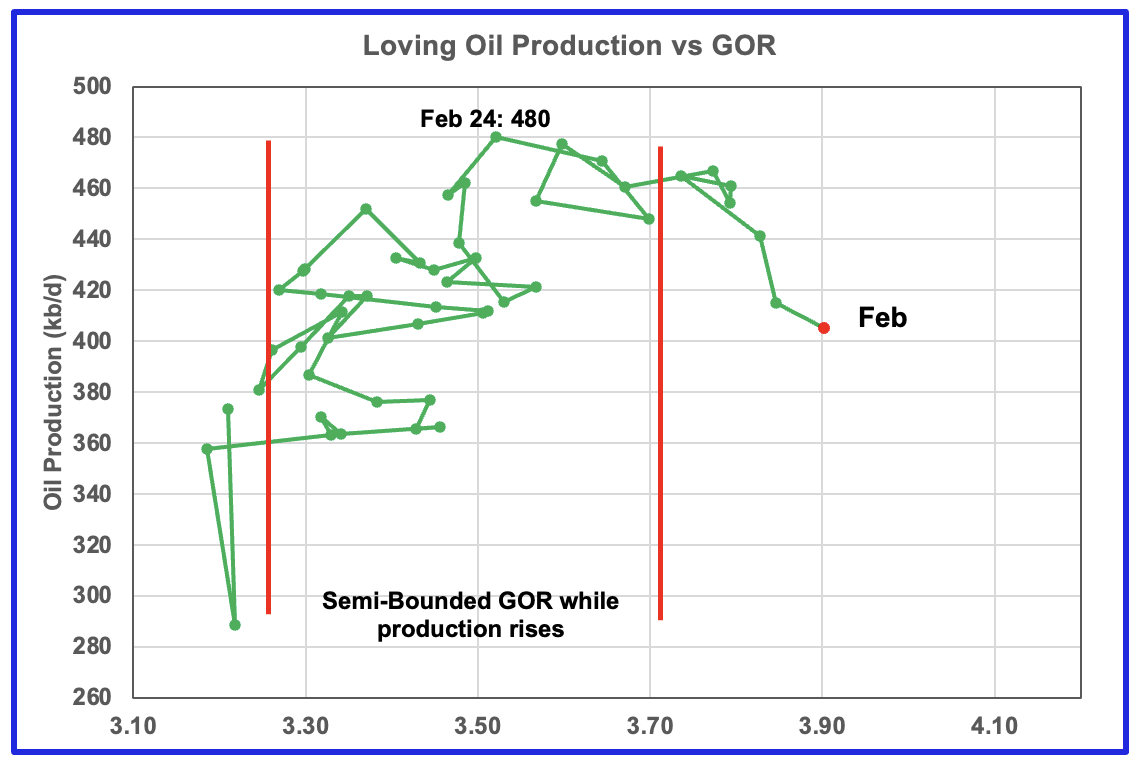
We will have to wait for the March data to make a more realistic assessment of oil production in Loving county. The GOR has moved into the bubble point which is an indication that production growth should be slowing.
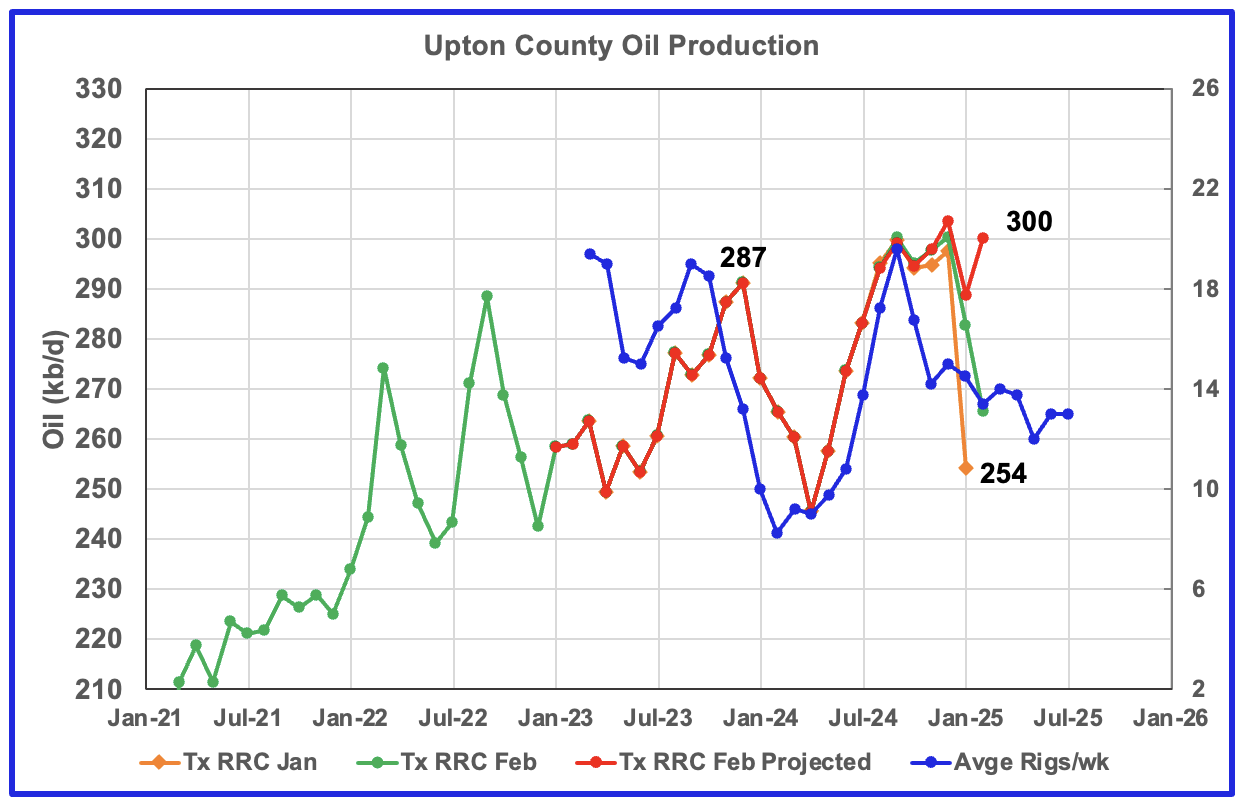
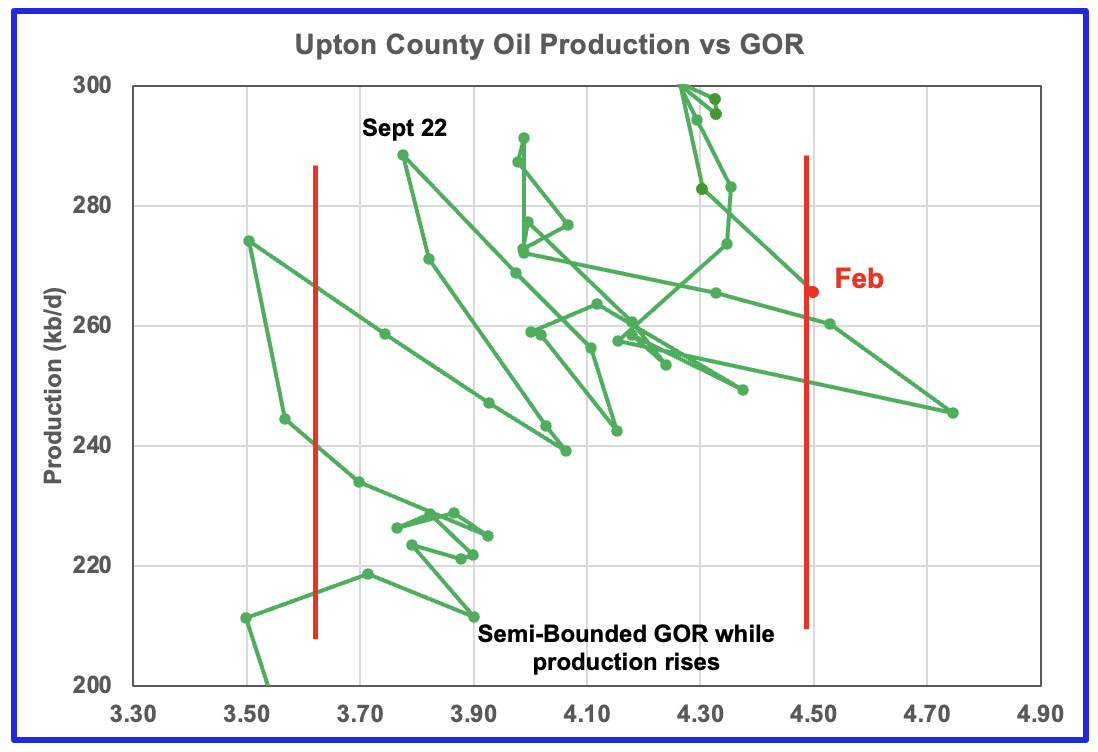
Upton county production has followed the rig count graph since January 2024 and may have peaked in December. February saw a rebound in both the preliminary production and the production projection. The GOR may be on the verge of moving out to the semi-bounded region.
The rig graph in the oil production chart has been shifted forward by six months.
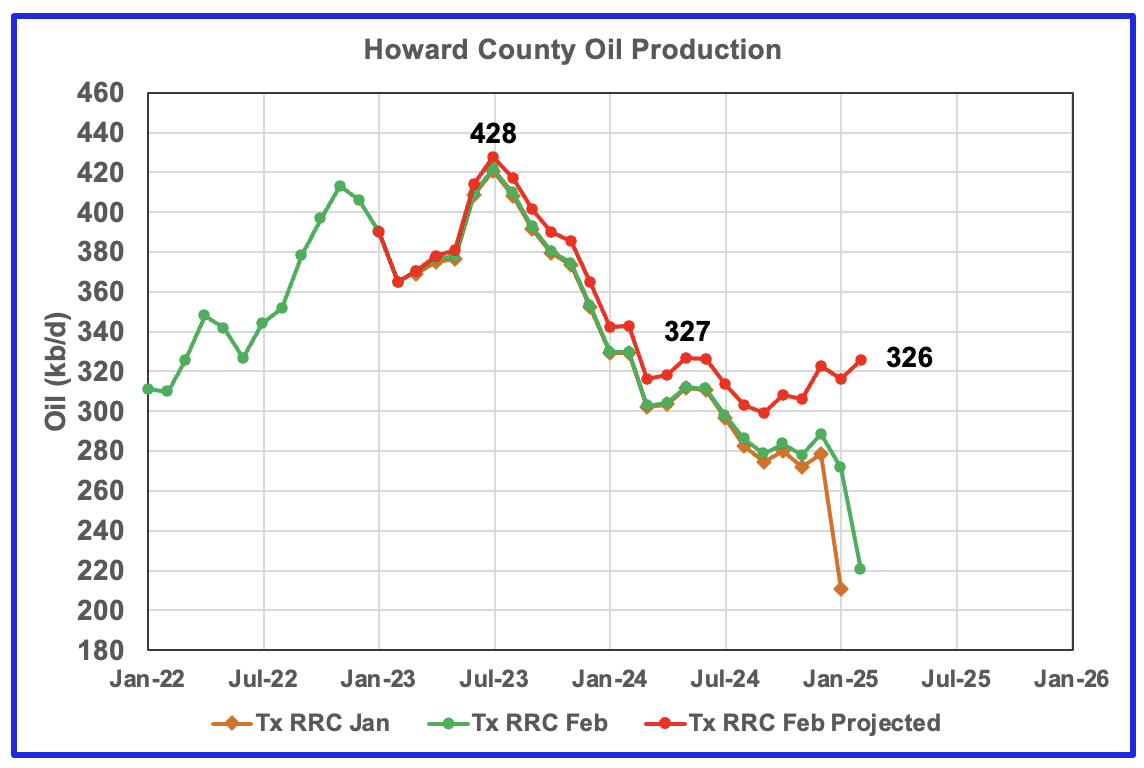
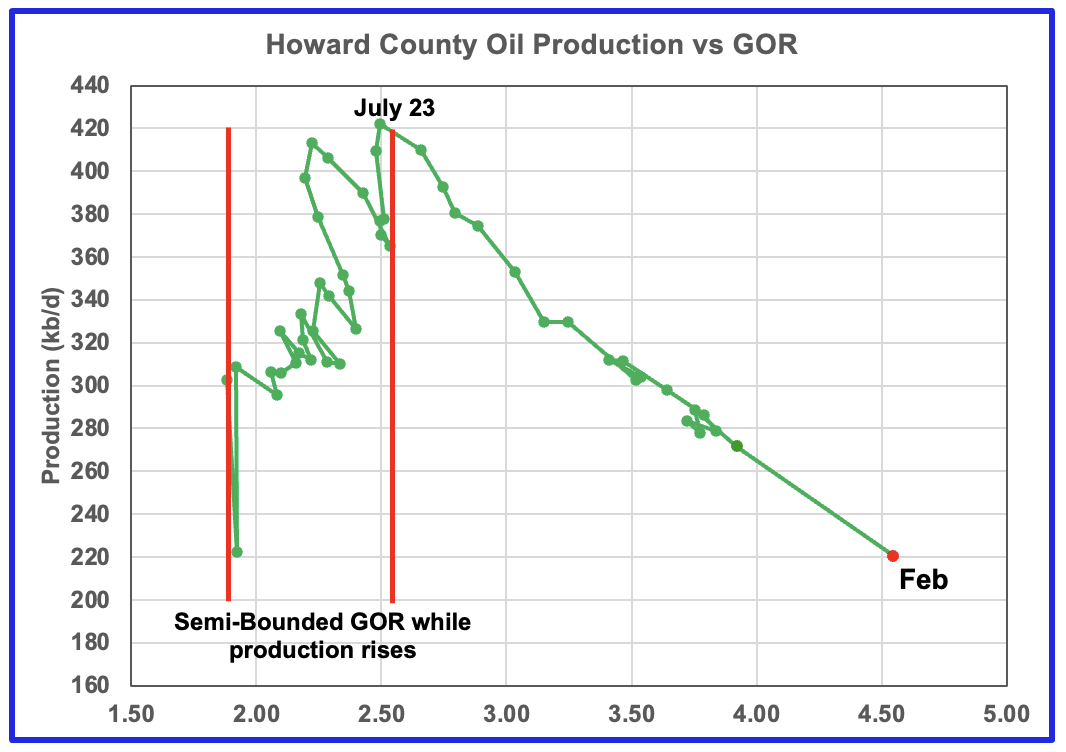
Howard county peaked in July 2023 at 428 kb/d. Note the rapid movement of the GOR to higher ratios once it broke out of the Semi-Bounded GOR range. While the GOR has risen to new highs, preliminary production has kept on falling. However the projected production rise shown after July 2024 may be an indication that production has moved into new and lower plateau zone.
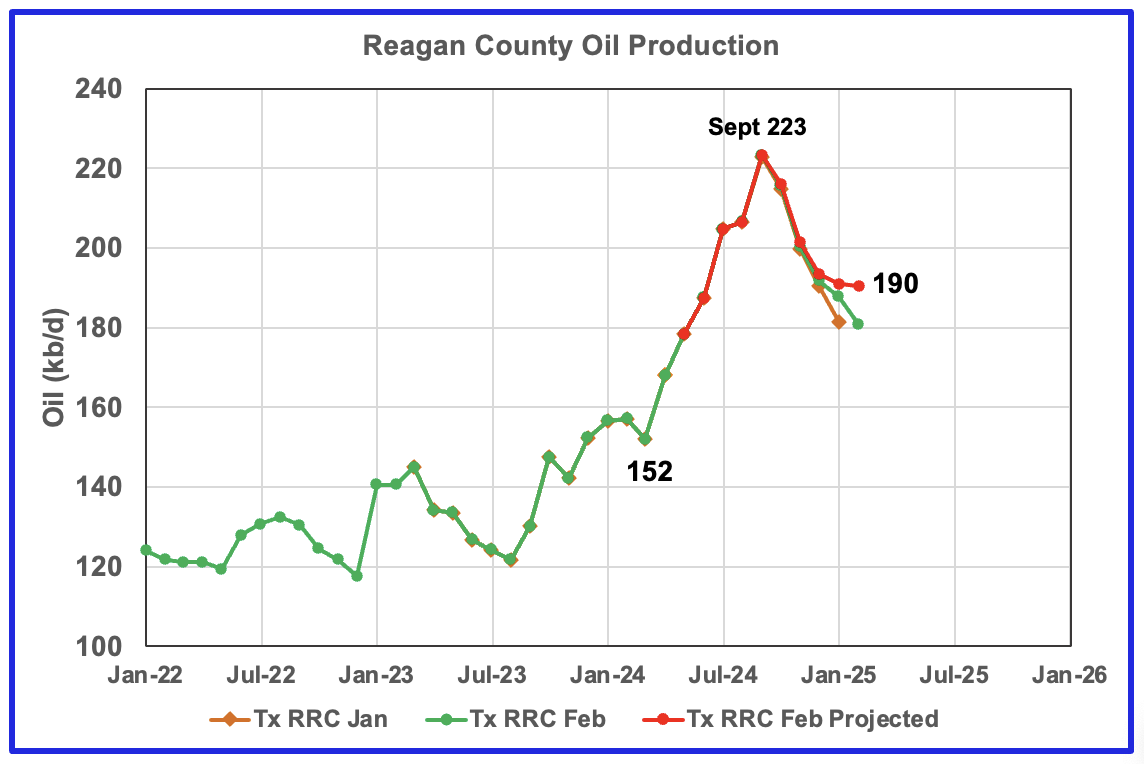
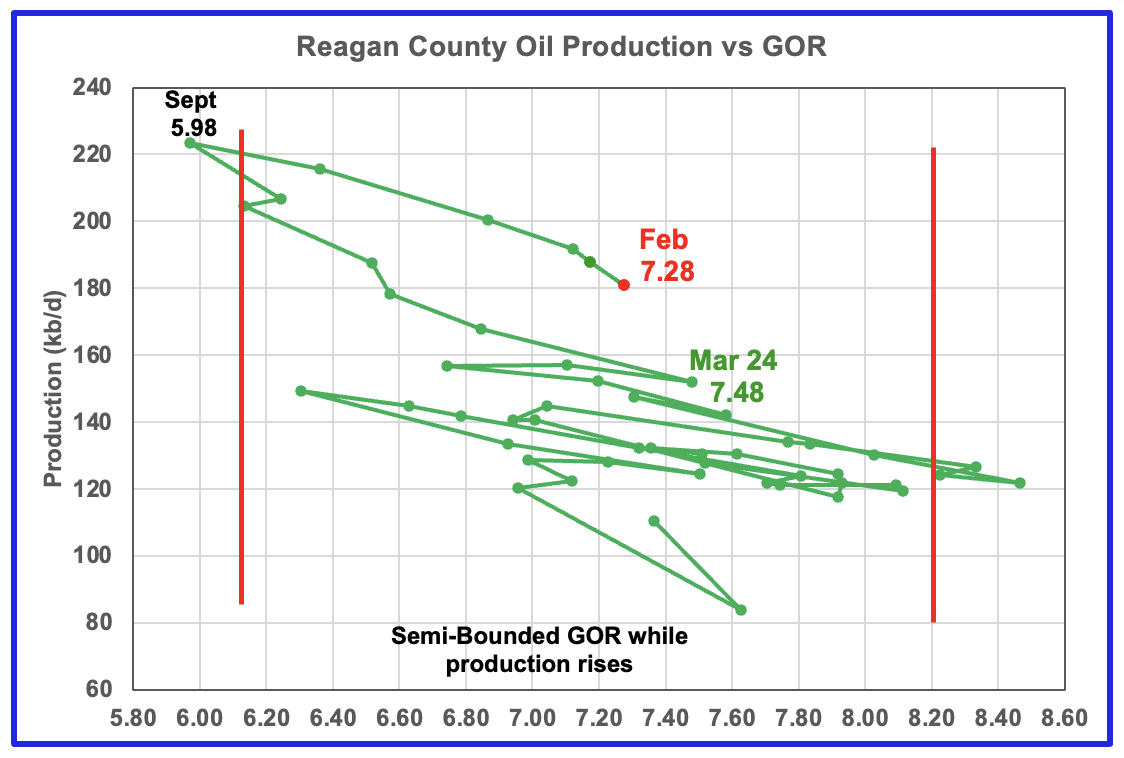
Reagan county oil wells have a very high GOR. The production chart indicate that oil production has been falling since September along with an increasing GOR.
Starting in March 2024, output increased by 72 kb/d to a peak of 226 kb/d in September 2024. At the same time the GOR fell to a new low of 5.98. These new wells must have had a very low GOR to drop the average GOR from 7.48 to 5.98. After the September production peak, the GOR began to rapidly increase to the current level as production fell.
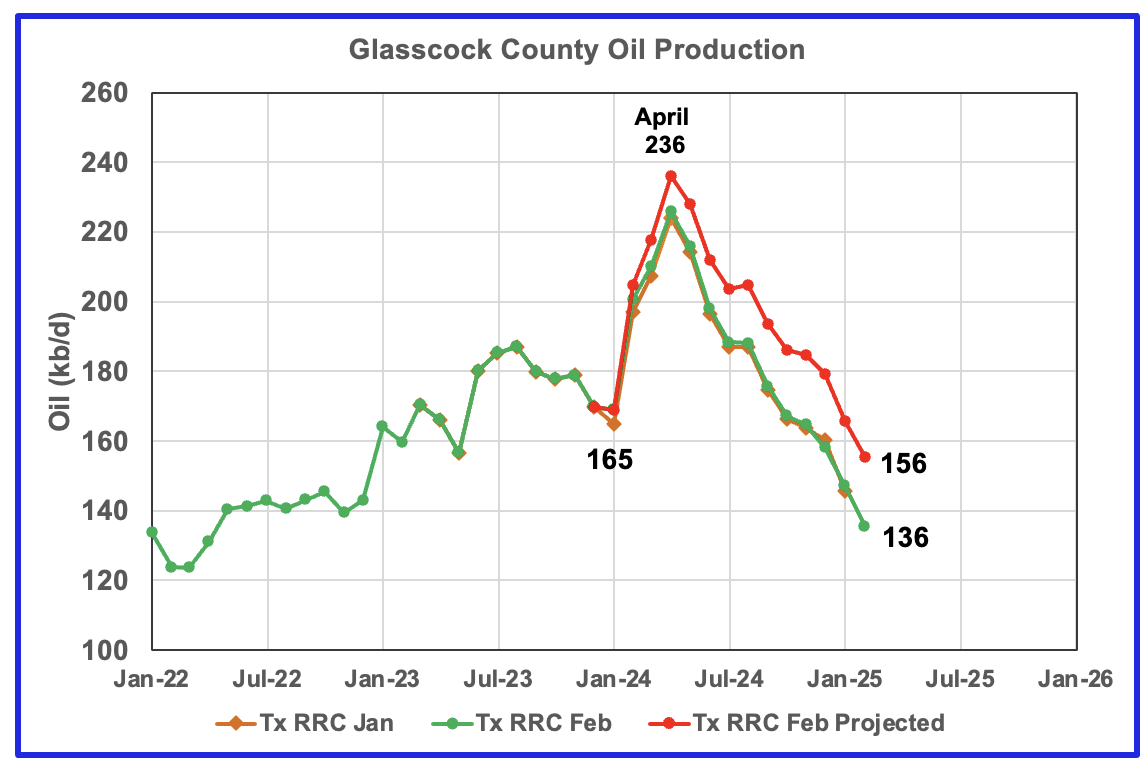
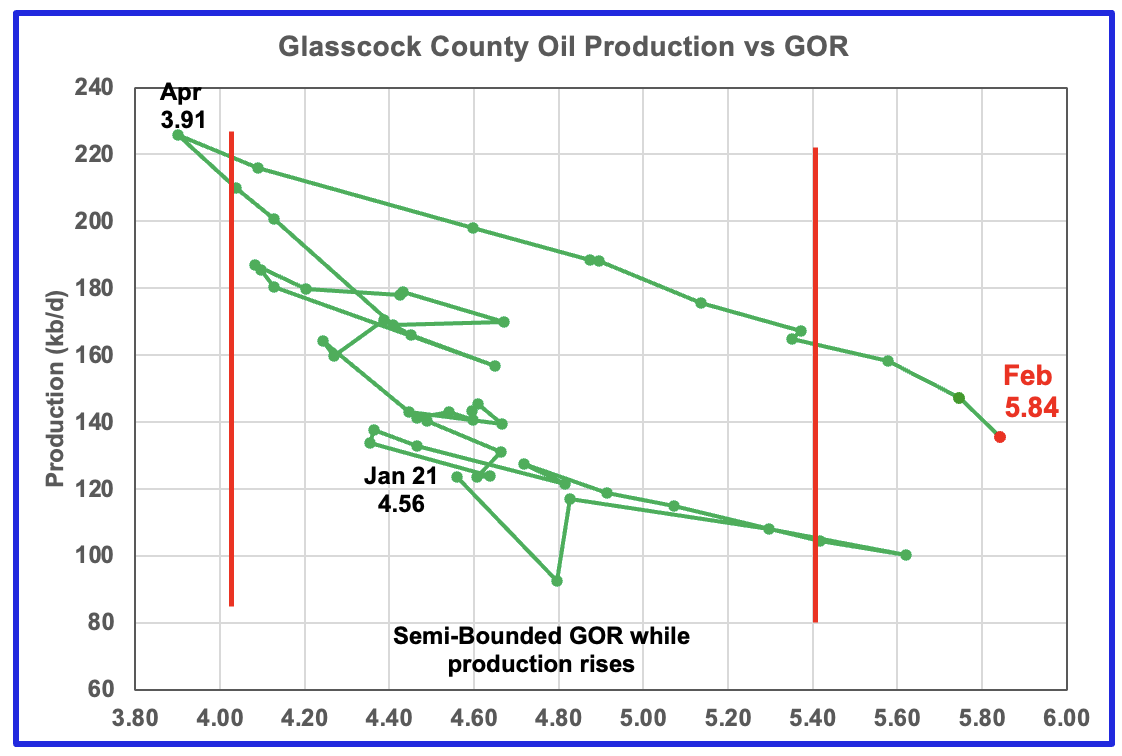
Glasscock production has been falling since April 2024 and does not show any sign of slowing. The GOR moved out of a very wide Semi-Bounded region to a new high of 5.84 in February. Note the rapid increase in the GOR starting from 3.91 in April 2024.
Frac Spread Count

This table summarizes the Frac Spread count for these Permian Counties for the week ending April 11. These counties are the main ones reviewed above. As I have noted before this data base is a bit difficult to work with and is not fully up to date. For instance there is no information for Martin County for the week ending April 11. The latest data for Martin county is for the week ending March 27. During that week, there were 19 Frac Spreads in operation, assuming the data base was up to date.
Since the company collecting this data is private, the information may be supplied on a voluntary basis by the Frac Spread companies.
As can be seen the greatest activity is occurring in the top 3 counties. For Eddy, Lea and Midland counties, the Frac Spread count to Rig count ratio is 0.51, 0.44 and 0.52 respectively. Interesting that the ratios are so close.
Drilling Productivity Report
The Drilling Productivity Report (DPR) uses recent data on the total number of drilling rigs in operation along with estimates of drilling productivity and estimated changes in production from existing oil wells to provide estimated changes in oil production for the principal tight oil regions. The new DPR report in the STEO provides production up to March 2025. The report also projects output to December 2026 for a number of basins. The DUC charts and Drilled Wells charts are also updated to March 2025.
The oil production for the 5 DPR regions tracked by the EIA’s STEO is shown above up to March 2025. Also the March 2025 STEO projects production out to December 2026, red markers. Note DPR production includes both LTO oil and oil from conventional wells. DPR oil production for the Anadarko and Niobrara regions is no longer available.
The March oil output in the five DPR regions increased by 187 kb/d to 9,334 kb/d. Production is expected to drop by 75 kb/d in April to 9,059 kb/d. Note the sharp production rise of 269 kb/d from April 2025 to August 2025. After that, production growth becomes production decline. Considering the flat rig count and low completion rate, it is not clear why production should rise over this period.
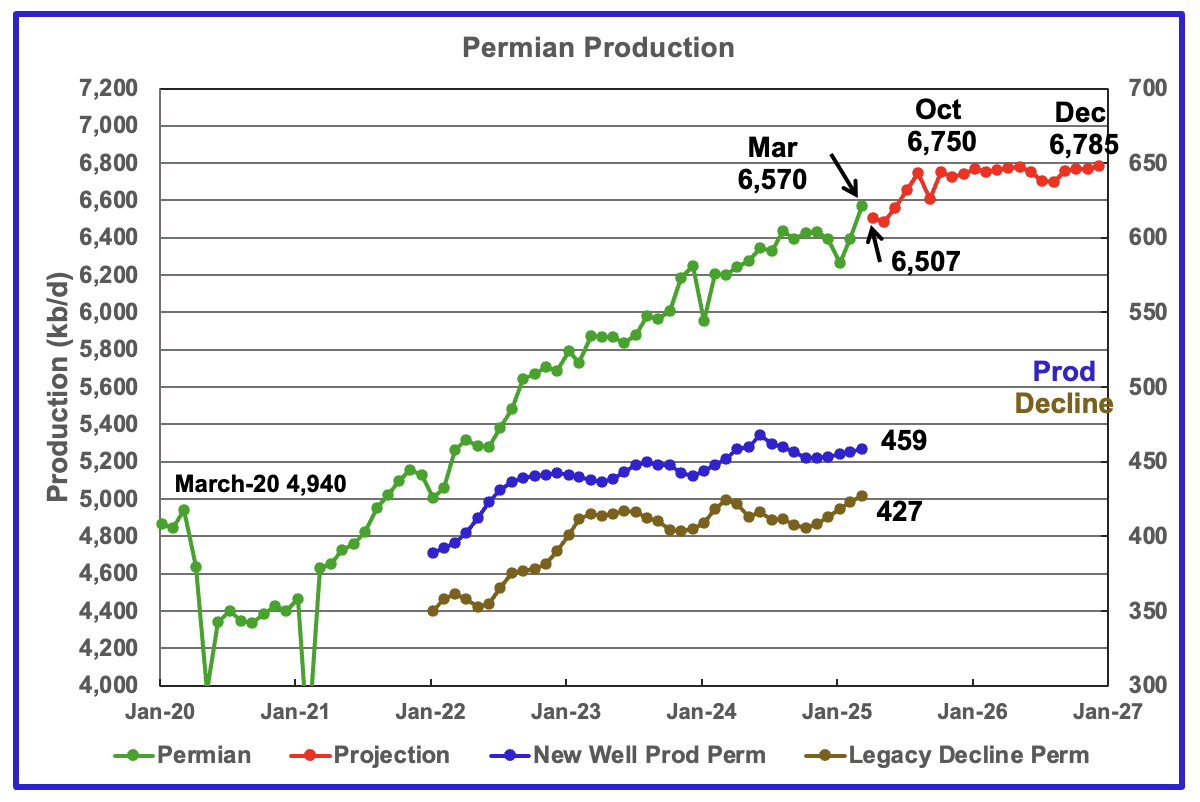
The EIA’s April STEO/DPR report shows Permian March output rose by 175 kb/d to 6,570 kb/d. From April 2025 to December 2026 output is expected to rise by 278 kb/d to 6,785 kb/d. Also note how production rises by 243 kb/d from April to October 2025 followed by production being essentially flat.
Production from new wells and legacy decline, right scale, have been added to this chart to show the difference between new production and legacy decline. Note how the decline rate is growing faster than production rate.
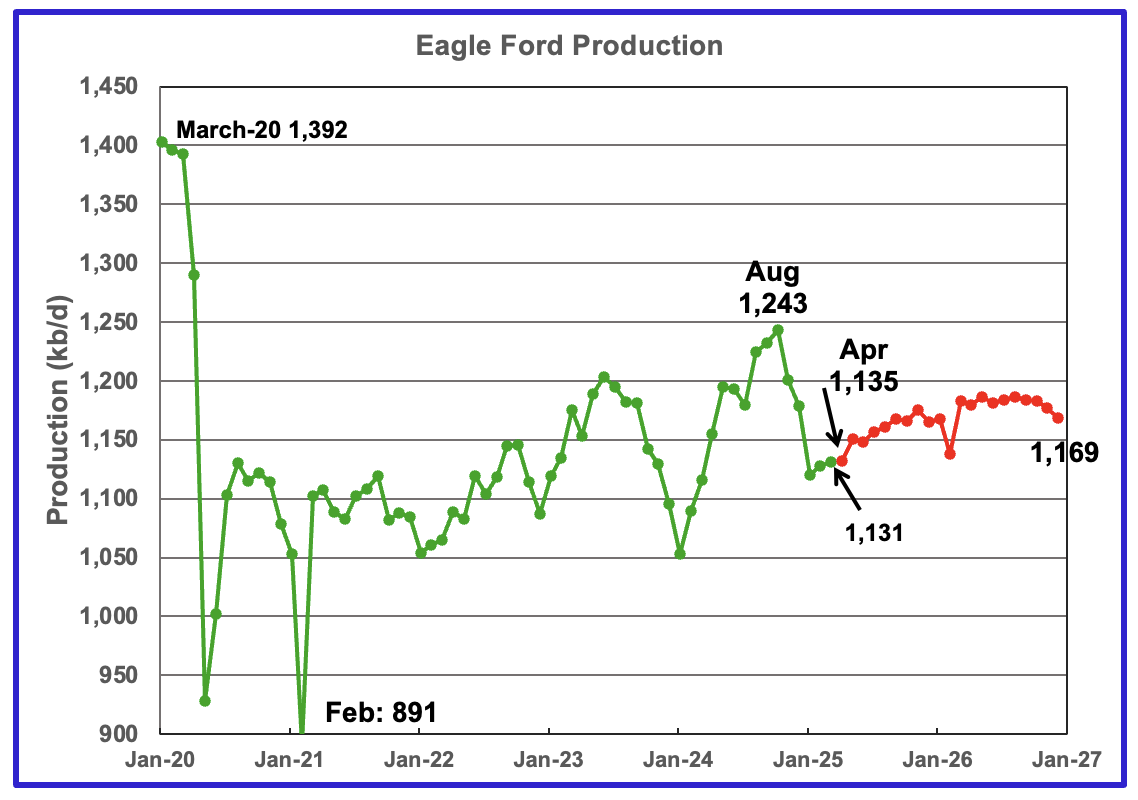
Output in the Eagle Ford basin had been increasing since January 2024 and appears to have peaked in August 2024 and then dropped every month until January 2025. March production increased by 3 kb/d to 1,131 kb/d. April 2025 production is forecast to increase by 4 kb/d to 1,135 kb/d.
Production over the next two years is expected to peak in the later half of 2026 at close to 1,180 kb/d. Output in December 2026 expected to be 1,169 kb/d.
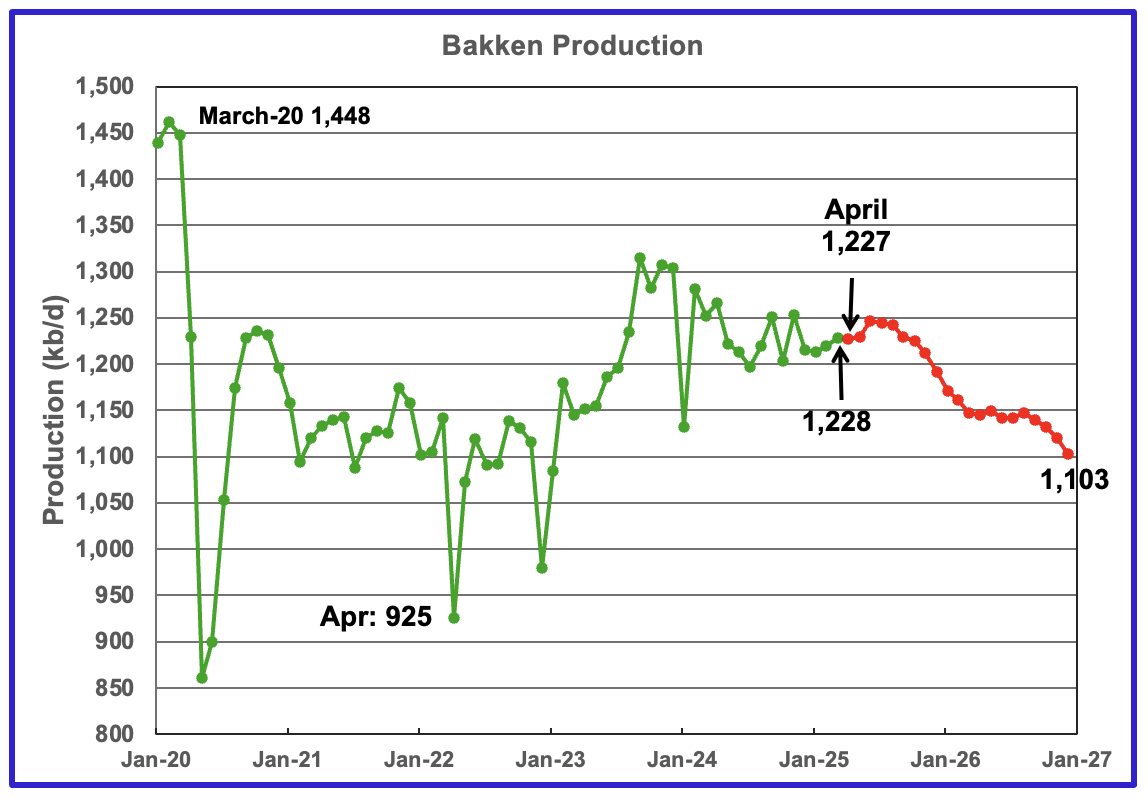
The DPR/STEO reported that Bakken output in March rose by 8 kb/d to 1,228 kb/d. The STEO/DPR projection, red markers, shows output to be essentially in decline after July 2025, dropping to 1,103 kb/d in December 2026.
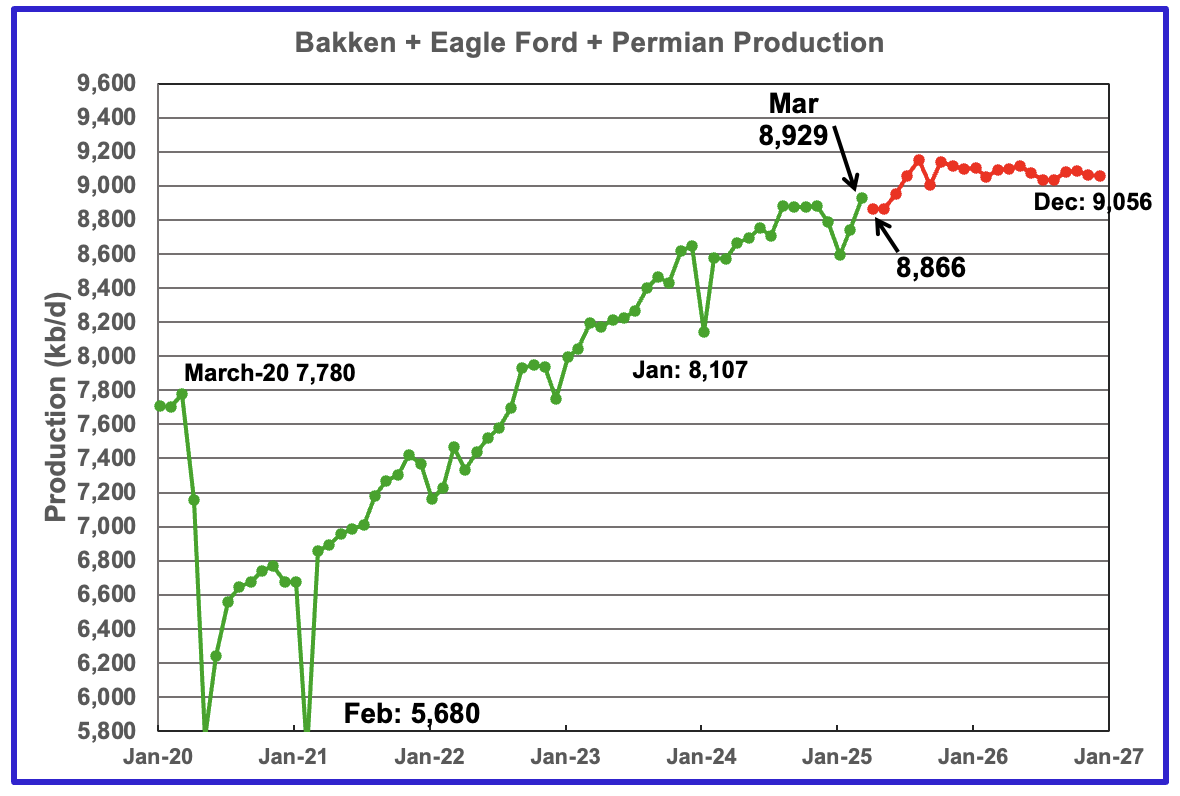
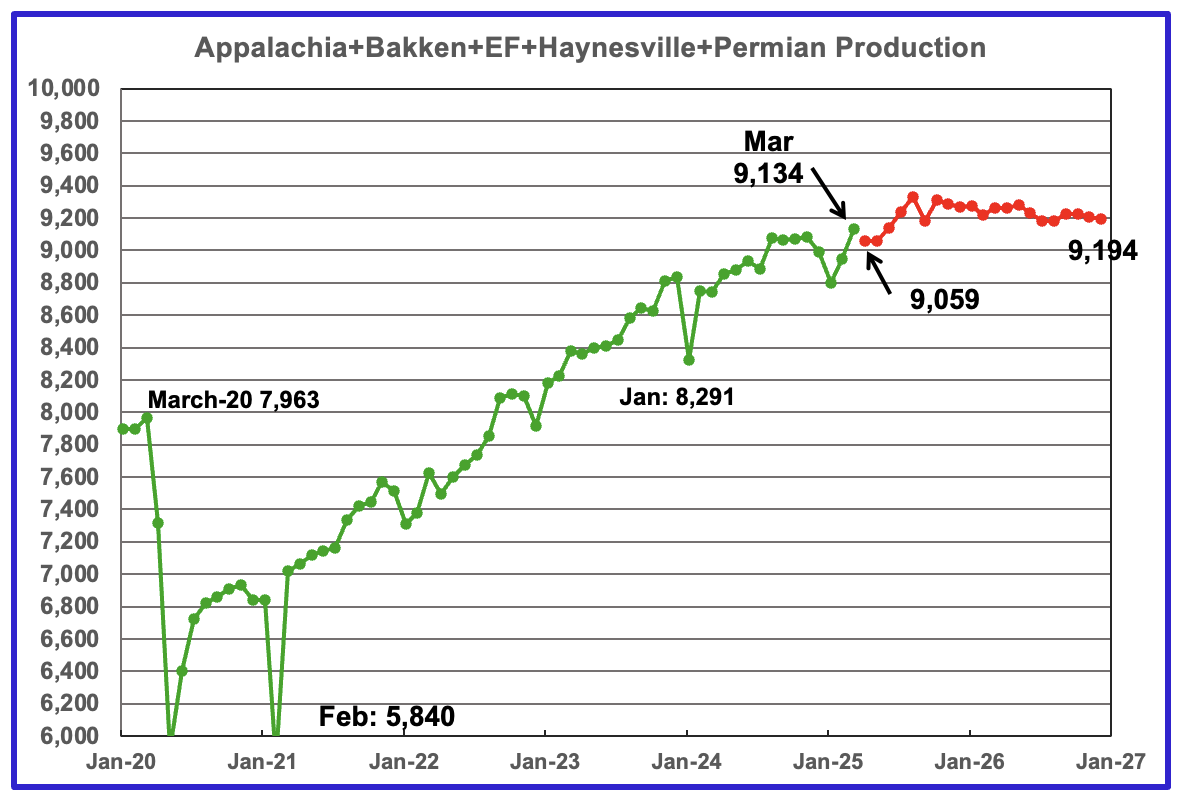
This chart plots the combined production from the three main LTO regions. For March output rose by 186 kb/d to 8,929 kb/d. Production for December 2026 is forecast to be 9,056 kb/d, a downward revision of 145 kb/d. Production declines after August 2025.
DUCs and Drilled Wells
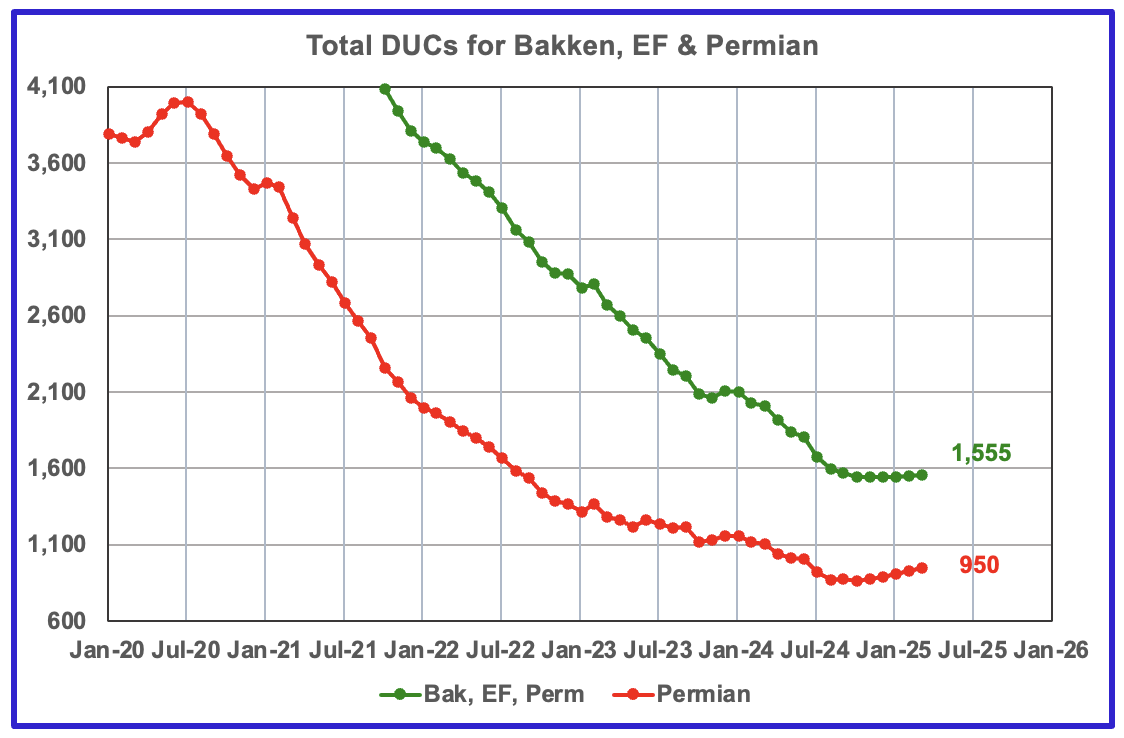
The number of DUCs available for completion in the Permian and the three major DPR regions has fallen every month since July 2020 to December 2024. March DUCs rose by 6 to 1,555. In the Permian, the DUC count increased by 20 to 950.
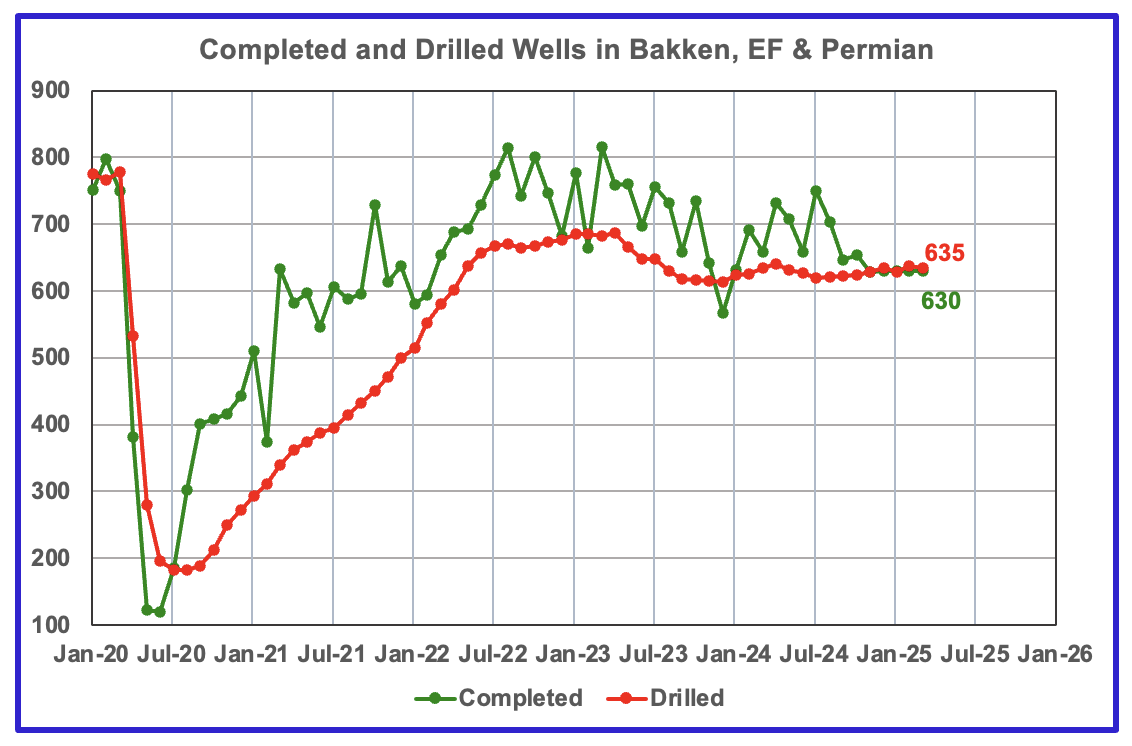
In the three primary regions, 630 wells were completed and 635 were drilled.

In the Permian, the monthly completion and drilling rates have been both stabilizing in the 440 to 460 range over the last 6 months.
In March 2024, 443 wells were completed while 463 new wells were drilled. This is the sixth month in a row in which the number of wells drilled exceeded the number of completed wells.
159 responses to “US February Oil Production Marginally Higher”
Rig Report for the Week Ending May 2
This week’s rig count is the first sign that low oil prices are affecting the count. However the combined rig count of the 4 big Permian counties was up by 1. Eagle Ford and Ohio were the biggest losers by dropping 3 each. NG was up.
– US Hz oil rigs were down 6 to 437.
– New Mexico rigs were unchanged at 90 while Texas dropped 4 rigs to 228. Texas Permian was down 2 to 184.
– In New Mexico, both Eddy and Lea were unchanged at 45 and have held there for 4 weeks.
– In Texas, Midland added 2 to 23 while Martin dropped 1 rid to 25. Midland is down 4 rigs over the last 6 weeks.
– Eagle Ford dropped 3 to 38.
– NG Hz rigs added 3 to 85.
Frac Spread Report for the Week Ending May 2
The frac spread count dropped by 4 to 201. It is also down 51 from one year ago and down by 40 spreads since October 11.
https://x.com/MrGlobal2025/status/1918708456992682420
“Oil Markets to Collapse Monday” ???
https://youtu.be/Fzefz-_ywqg
https://www.zerohedge.com/commodities/we-are-tipping-point-shale-giant-diamonback-says-us-oil-output-has-peaked-slashes-capex
Low prices have bad consequences… on the industry…
Almost 400kbarrels/day under the projection and no serious increase in price…?
Svaya,
Oil prices are determined on the World Market which seems to be oversupplied,especially with recent OPEC announcements to increase output and a possible Worldwide Recession that many expect due to Trump Tariffs which will reduce World Oil consumption.
Also keep in mind that most oil analysts realize the EIA STEO is often wrong. It will be interesting to see the EIA revisions in May to the STEO, though in a Trump executive branch one wonders if these will only become worse in the future as pressure may come from the White House to alter forecasts to their wishes. The independence of agencies from political pressure seems to be at a low point.
Something to watch.
DC
Of course numbers are fake or messaged at the very least for political or economic gain. Biden’s jobs being created in an election year overstated by some 815,000 jobs is a prime example.
This type of shit goes on everywhere under every politician. China’s GDP is fake and to a certain extent so are the GDP numbers in the US.
Which is why using GDP numbers to calculate or forecast anything is meaningless. Because the numbers aren’t real to begin with.
Oil producers overstating their reserves is another prime example of what is happening for political and economic gain.
Corruption is widespread. We don’t have any honest folks in power anywhere.
HHH
Only the gullibles believe the numbers.
>Also keep in mind that most oil analysts realize the EIA STEO is often wrong.
Ok but that doesn’t change the fact that it’s >300Kbarrels/day under the December 2024 peak. But then the markets are chaotic anyway so I wouldn’t be surprised if it increases next weeks and month.
Svaya,
The price of oil is screaming recession. The economic background doesn’t support higher oil prices.
OPEC gave up on their supply cuts because they didn’t work to keep prices higher. Contrary to popular belief OPEC isn’t in the driver’s seat controlling oil prices. Though they can send prices even lower by increasing production during a global recession.
What we are going to get is interest rates cuts and back to QE everywhere. Not that either of those things matter but that’s the direction we are heading. The fact that they will be doing both is just an acknowledgement of how bad the economic background actually is.
Low to no growth environment.
Remember that the dollar denominated debt that exists outside the US in the Eurodollar market isn’t owed to the US. The banks outside the US created all that dollar denominated debt. The rest of the world owes those dollars to themselves collectively.
Got dollars? Because absolutely everyone outside the US needs dollars to repay the debt. They don’t need gold or bitcoin or their own local currencies. They need dollars.
What’s it going to look like outside the US if the banks in Japan lending the dollars into China get defaulted on?
The world can’t leave the dollar system without defaulting on themselves.
The scramble for dollars outside the US will continue. And sometimes that scramble for dollars will involve the selling of US dollar denominated assets.
De-dollarization implies the value of the dollar going through the roof.
Re-dollarization implies the dollar going back to 2008 lows.
If you pull out a long term chart of both WTI, Brent and DXY you’ll see that oil prices at their all time highs coincided with the dollar being at an all time low.
It was because credit in the Eurodollar market was flowing freely prior to 2008. Not so freely ever since 2008. Credit is still flowing but the cost of obtaining credit has gone much higher since 2008. Not talking about just interest rates. Talking about collateral and what it cost to actually borrow money. And a lot of the time collateral is borrowed in order to obtain credit in REPO.
Dollars are just more expensive to obtain now than they were in 2008.
HHH, I don’t understand since the banks originated the loans, why can’t they just tell their customers that they will accept a different currency instead of us dollars in repayment (a kind of bank-customer currency swap deal at rates both parties can live with), and at least circumvent a scramble for dollars?
Phil S,
You can go into the FX market and sell Yen or Euro’s or whatever currency you have in order to buy dollars. It’s more costly to do than just borrowing. But banks will generally do it. At least for most of the major currencies that aren’t the dollar.
And since all those other currencies are in fact loaned into existence instead of printed. It will create a shortage of their local currencies which will create problems in their local economy’s. Because they are creating bank liabilities in their own currencies that have to be repaid in their own currencies. But are buying dollars.
Banks want to be repaid in a currency that is accepted everywhere as money. The Chinese yuan isn’t money globally. Eurodollars are money globally.
If banks accepted other currencies for dollars denominated debt directly it’s no different Then selling Yen or Euros or whatever and buying dollars.
It will create Yen and Euro and whatever currencies shortages. Because of the liabilities of bank balance sheets when money is loaned into existence.
The idea of a free lunch by just printing money to repay debts is a false idea.
Government debts aren’t really ever paid back. They are just expanded. Rolled over with new debt at maturity.
However private debts are repaid every month. Which shrinks the actual money supply. So we need economic growth in order to repay debt and energy in order to grow.
Without private growth tax receipts fall. And government’s income get cut.
Government debts are financed through money created on the balance sheets of commercial banks. There is a bank liability somewhere on some banks balance sheet that has been used to purchase those government treasury securities.
All loans are liabilities on one bank balance sheet and deposits on another banks balance sheet.
People think money is free and clear from any debt because they went and earned it. No! There is a bank liability on some banks balance sheet where the money used to for your paycheck is owed to a bank by someone.
It might indeed be free and clear for you to use but it’s still owed to some bank somewhere because it was loaned into existence.
I subscribe to a relatively fast collapse of BAU as we know it because the debts aren’t payable in a energy contracting world.
It doesn’t matter if we still have a lot of oil, coal and natural gas. It doesn’t matter if we can build solar panels and windmills to produce electricity.
What matters is can we grow or not. And governments are hiding issues by overstating GDP numbers and job numbers and so on.
In a true energy transition. Solar and wind energy would have to repay all the debts incurred during the time before the energy transition took place when FF were what was used.
I’m not buying that idea.
There will be no growing our way out from under our debt. Mass insolvency and hyper-deflation is the future.
Banks can do that but that doesn’t change anything. The dollar deposits were created when the bank made a loan and the only way to “uncreate” the deposits is to pay off the loan. So it doesn’t really matter who holds the deposit – it exists and there is no other way to get rid of it except for repayment.
rgds
WP
HHH
Government debts aren’t really ever paid back. They are just expanded. Rolled over with new debt at maturity.
Interesting claim. What happened to the surpluses the German government ran from 2010 to 2020?
Great job Ovi,
I would note that the claims that breakeven prices in the Permian are around $40/b are very different from my own estimates for average Permian wells. If we assume the average Permian well has full capital cost of $12 million (includes plugging at end of life, overhead, and land cost), at a nominal discount rate of 12.5% per year the discounted net revenue over the life of the well is about 10 million at $60/b at wellhead , NGL at 35% of crude price at wellhead and NG at $3.20/MCF at wellhead (this is a very optimistic price for Permian where WAHA spot prices have been under $2/MCF).
In short breakeven prices are not $40/bo, that might be LOE for a flowing well, but nobody makes money in the Permian at that price for their entire portfolio of wells. There might be 5% of all Permian wells drilled to date that might have been profitable at $40/b and $3/MCF, maybe only 1%.
Hmmmm,
“If we assume the average Permian well has full capital cost of $12 million”
Yesterday I posted this link from Reuters-
“Exxon is the largest producer in the Permian basin, the top U.S. oilfield, and operates the lucrative Stabroek block off the coast of Guyana. Cost of supply in the Permian is less than $35 per barrel, the company has previously said, allowing it to make money even at lower oil prices.”
Not sure both of you are talking about the same costs. But, one thing for sure Dennis is that you don’t know what Exxon’s costs are. If you are using numbers on the cost of pipe for example from guys like Shellman or Shallow Sand. I can tell you for sure that’s not the cost Exxon is paying for it. That would be like comparing GM’s productions cost to build a car to yourself in your garage or your local convenience store costs to Costco.
I wouldn’t be suprised if Exxon’s average capital costs to complete and cap a well in the Permian is less than $8 million.
Huntingtonbeach,
You can look at 10Q to get an idea of capital cost for a well. You may believe XOM’s costs are lower, but I would say there is a lot of hype in investor presentations, including those by XOM. You are correct that I don’t know what XOM’s costs are, but only a fool would believe the numbers that are in an investor presentation, read the fine print which says in a nutshell, don’t believe these numbers.
Also my analysis is based on the basinwide average, it is possible that XOM only drills above average wells, and has costs that are 66% of the average producer. If you believe that, I have a bridge in Brooklyn I can sell you.
ExxonMobil And Nabors Test Fully Automated Drilling Rig In Permian
As the U.S. rig count continues a slow rise in a somewhat muted response to higher prices for crude oil and natural gas, two giants of the industry announced last week that they are partnering in an effort to make the drilling process safer and more efficient through automation. In an industry first for a land drilling rig, ExxonMobilXOM subsidiary XTO Energy and Nabors Drilling have reached total depth on the first of a planned three horizontal wells in the Permian Basin using an innovative Nabors drilling rig with a fully-automated, unmanned rig floor.
Anyone who has ever worked in the oil patch proper knows that the floor of an active drilling rig has long been one of the most dangerous places in the business. Whether drilling downhole, changing out drill bits or pulling strings of drill pipe out of the hole, the labor intensive activities necessary to drill these deep holes into the earth have always accounted for a significant percentage of reportable, lost-time accidents that companies incur every year.
In its Oct. 7 press release, Nabors announced that the technology now exists to drill these horizontal wells in the Permian Basin – and presumably any other oil and gas producing region – with no employees having to be present on the rig floor, where the action takes place.
https://www.forbes.com/sites/davidblackmon/2021/10/11/exxonmobil-and-nabors-test-fully-automated-drilling-rig-in-permian/
Nabors Announces World’s First Fully Automated Land Rig Has Successfully Drilled Its First Well
The PACE®-R801 concept rig has safety and efficiency at the core of its design, purpose-built to showcase Nabors technology and to push the boundaries of industry performance and possibilities
Nabors Industries Ltd. (NYSE: NBR), a leading provider of advanced technology for the global energy industry, today announced its PACE®-R801 – the world’s first fully automated land drilling rig – has reached total depth on its first well, a horizontal well for ExxonMobil in the Permian Basin.
Combining Nabors proprietary Smart Suite of automated drilling software with Canrig® robotics on the PACE®-R801 creates an unmanned rig floor that removes crews from red zone areas and delivers consistent, predictable drilling performance.
https://www.nabors.com/nabors-announces-worlds-first-fully-automated-lan/
Oil Drilling Automation: Revolutionizing the Industry for Efficiency and Safety
Overview
Oil Drilling Automation: Revolutionizing the Industry for Efficiency and Safety
Drilling automation has become increasingly relevant in the oil industry. The integration of advanced technologies and computer-controlled systems has led to more efficient, safer, and cost-effective drilling operations. With the rise of automation, companies are able to maximize performance while minimizing human exposure and environmental impact.
The adoption of automation technologies in drilling operations includes the use of machine learning, robotic systems, and real-time data analysis. These technologies enable the drilling process to be optimized, improving the overall productivity of oil extraction. The growth and improvements in drilling automation also have the potential to enhance worker safety by reducing the need for manual labour in hazardous environments.
As the industry looks to the future, continuous research and development will be crucial in pushing the boundaries of drilling automation technologies.
Key Takeaways
Automation leads to more efficient and safer oil drilling operations
Advanced technologies such as machine learning and robotics play a key role in drilling automation
Addressing challenges and staying ahead through research and development are crucial for the future growth of the industry
Overview of Oil Drilling Automation
Evolution of Drilling Automation
In the past, drilling operations were manually intensive, requiring significant human intervention and expertise. With time, the oil and gas industry has witnessed a shift towards the adoption of automated solutions to enhance safety, efficiency, and data-driven decision-making. The development of drilling automation technologies has been driven by advancements in AI, control systems, and digital transformation, enabling companies to optimize drilling processes and reduce human error.
Key Benefits of Automation in Drilling Operations
Performance improvement: Drilling automation can maximize drilling operations and improve overall consistency. Automation technologies help ensure consistency in performance, regardless of operator skill level or environmental challenges.
Enhanced safety: The integration of autonomous systems reduces the need for manual operations in high-risk environments, minimizing the potential for accidents and injuries. Advanced visualization and monitoring tools enable real-time supervision, fostering a safer workplace for drilling personnel.
Data-driven decision-making: Modern drilling automation solutions are equipped with sensors and data collectors, enabling efficient data processing and analytics. These data insights, combined with AI-powered algorithms, allow drilling operators to make informed adjustments and optimize drilling performance.
Cost-effectiveness: Automation systems reduce manual processes that have a high level of variability so that crews can more effectively run the drilling operation. Moreover, optimized drilling practices can reduce wear and tear on equipment, contributing to lower maintenance expenses.
Environmental impact: Drilling automation promotes sustainable practices by limiting resource consumption, reducing waste, and enhancing overall efficiency. Improved precision and consistency can lead to a reduction in days on location.
https://www.helmerichpayne.com/resources/product-highlights/oil-drilling-automation-revolutionizing-the-industry-for-efficiency-and-safety
Like you said Dennis, you don’t know the cost.
Huntingtonbeach,
For people in the industry, they are very dubious of the XOM claims, but you are right I don’t know, I rely on others in the business that know far more than me.
Whenever this wank from California uses my name in his comments I feel the incessant need to go outside and rinse off with a garden hose.
Last I looked there was only one Nabors R801 IN the entire Permian and I have no idea if its working anymore; its day rate was 2 times a normal 2000 HP, semi-automated rig working in the Permian. Rig automation is not helping Exxon one ioda.
Exxon is a poor tight oil operator. It uses its “power” to bully service providers into lowering costs, which in turn hurts other smaller operators in the play and RAISES costs for everyone else. That hurts America.
Exxon has $40B of long term debt and pays almost a $B a year in interest. Its 1Q25 profits are lower and going way lower 2Q25 when <$60 oil kicks in. Trump was in office only 2/3rds of the entire quarter and the price of oil did not get near $60 until THE BEGINNING OF THE 2ND QUARTER! Everybody waiting for rigs to fall after 30 days of $60 oil is nuts!
Its amazing a far left, progressive socialist like this guy from Californy is defending Exxon earnings; that must be about…let me guess…personal dividends. I thought you folks were anti-oil?
Nony, I got the reference. I am flattered. I am too smart to have operated tight oil wells, but too dumb to never have had working interest in them. It was the only time in 65 years I ever lost money in an oil play. Have you ever even seen one?
Your hero, Permian Resources, drills horrible wells. 55% gas in their Delaware production stream? In 2024 it GROSSED 80 cents an MCF for its gas, AFTER hedge protection.
It has 4.2 billion dollars in long term debt and only 312,641 MM BO of PDP reserves GROSS of royalty (SEC 10K). Net of royalty it therefore has to have an additional $18 per BO breakeven price, just to pay off its long term debt. Then there is retirement costs, or don't you have the ability to understand that.. oil extracted from a well is burdened by all the costs and liability of the company that extracts that oil?
You don't seem to understand well economics at all. That the U.S shale sector keeps drilling wells that don't make sense to us "peak oilers" is the exact same reason it has lost $400B already in the 14 years of its existence, with another $200B yet to be paid off. Plus the cost of plugging its wells and cleaning up its mess. Everything the shale sector does going forward is based on…more indebtedness.
I don't like this place anymore. If y'all are going to continue to rag on me, get your shit straight, at least.
I am trying to help my country understand the oil and gas business better, to be better prepared for the future, in the face of qazillions of people who will lie to, to your face, for the sake of a lousy dollar. Or because they falsely believe they have the intellectual, and moral, highground over you, They don't.
I like you, actually. The Red Adair history is fascinating.
Thanks Mike,
I realize now where you get the 12 to 13 million cost for the average Permian well from reading your blog, I appreciate the lesson. It is land cost and plugging cost (mostly land cost) that adds another 2.5 million to D and C cost, other overhead (tank farms, gathering lines and electric power lines, and 1000 things I don’t know about) might add another 0.25 million per well on average.
To add to Mike’s comment – XOM in 2024 spent 19.3bn of stock, paid 16.7bn in dividends for a total of 36bn – just in 2024. Pretty close to the 40bn in debt. It’s a game of pushing up the stockprice by reducing the float and increasing the dividend.
rgds
WP
The above is so true. I have drilled many many many wells in the Permian and I will not drill there again at these prices. Investors are just trading dollars. I can tell you it is an uneconomic venture. The Majors do get services cheaper as they can prepay for services which vendors love. I have drilled with the Majors and their well costs are over $11 million dollars per well.
Thanks LTO Survivor. Am I correct in assuming the $11 million is just D & C or is that full cycle costs, including land cost?
LTO, I hope you are well. I appreciate these comments; I otherwise get so much shit from people who try so hard to make giants out of nothing but piss ants; I appreciate the positive, real life feed back. Thanks WP. Thanks DC.
Look, debt is debt, man. You can change defintions, move the goal posts, say stupid things like “sunk” costs don’t count….OK then, pay the debt back. That is all I care about. I mean really, you have to be really sorta fucked up to admire, and defend a business model that was created on, and feeds on, debt. All these giant, monster wells in this place or that…so what?
When people tout big IP’s and new, phony technology, 10/40 tail ends and 18,000 foot laterals with dissolvable frac plugs, landmen with ORRI’s who tout the “wonder” of drilling HPHT wells (been done for 70 years !) and ignore economics, and debt, I envision bored people in the basement looking at something so important as American shale oil and gas as….entertainment. I see them sitting on the couch playing shale oil like a video game. Then going to the mailbox every 25th.
The shale oil phenomena would not exist but for debt. Nobody in their right mind that cares about their kids, or their country, could see it any other way.
I haven’t been giving Dennis the cost of steel or anything else for a long time.
I’ve maybe given him what our costs are in the past few years? I don’t really remember.
I haven’t studied 10k and 10q for upstream companies for a long time either.
Huntingtonbeach,
XOM capital and exploration expenditures for US upstream in 2024 were $11.252 B and about 546 net wells were completed in the US in 2024, so upstream capital spending was over $20 million per well, based on the 10k for 2024. In 2022 when there were fewer aquisitions, US capital spending per well was 13.32 million for XOM. This pretty close to the oilystuff.com estimate of 12 to 13 million per well for full cycle costs in the Permian.
Thanks Dennis, but I really don’t think 20 million is a good number from the 10K. To many other expenses could be in there distorting the well cost. I did ask the question to Google AI and got this:
what is the break even point for the cost of oil in the permian basin
The break-even point for oil production costs in the Permian Basin varies depending on several factors, including the specific sub-basin (Midland vs. Delaware), the type of well (existing vs. new), and the individual producer’s operational efficiency.
Here’s a general overview:
1. Existing Wells vs. New Wells:
Existing Wells: The Permian Basin boasts some of the lowest break-even prices in the United States for existing wells, often below $50 per barrel.
New Wells: Break-even costs for new wells are typically higher, reflecting the initial investment in drilling and completion.
2. Midland vs. Delaware Basins:
Midland Basin:
Existing Wells: Reportedly around $38 per barrel.
New Wells: Reportedly around $62 per barrel.
Delaware Basin:
Existing Wells: Reportedly around $31 per barrel.
New Wells: Reportedly around $64 per barrel.
3. Average Break-Even for New Wells:
Average across Permian Basin: Data from a Dallas Fed Energy survey indicates an average break-even price of $65 per barrel for drilling new wells in the Permian Basin.
Regional Average for New Wells: Another source suggests the average break-even price for drilling new wells in the Permian Basin is around $62 per barrel.
Important Considerations:
Fluctuating Costs: Break-even prices can change over time due to factors like technological advancements, operational efficiency improvements, and fluctuations in service costs.
Company-Specific Costs: Individual companies may have different break-even points depending on their specific circumstances, drilling techniques, and asset quality.
Full-Cycle Costs: Full-cycle costs, which include exploration, drilling, completion, and operating expenses, can be significantly higher than just operating expenses for existing wells.
Oil Price Volatility: The break-even point is highly sensitive to changes in oil prices, and companies may adjust their production plans based on current market conditions.
In conclusion, while the Permian Basin is known for its low break-even costs, especially for existing wells, it’s crucial to consider the specific factors influencing these costs when analyzing the profitability of oil production in the region.
*****
Existing wells must mean workovers. This is probably were the $35 number from Exxon is coming from. I noticed AI goes behind paywalls to get some of it’s information. Might be useful. Also, I thought it was interesting that Shellman responds to me and I think he is a policial ****** ****. But you, really go overboard trying to be nice and work with him. Yet he still calls you just as bad as thing as me and won’t respond to you. Maybe you’re using the wrong approach. Anyway, look out below because I used his name again. I really don’t care anymore, my life is to short for that. That’s the next generation problem. I live in Trumpland and see it everyday I visit the club. The business guys are starting to figure it out and are getting pissed at Trump. On the other hand, the religious idiots I don’t think will ever come around. Last week a guy wore a t-shirt that said – “Transsexual are just retarded gays”. One more thing, I guess we have a local election coming up here soon. When you drive around town there are signs that say – “Protect our children from pron Vote No on A & B”. I guess now the parents are having to explain what porn is to their young kids and not happy about it. Can you imagine. Their trying ban books for children like “Everybody poops” because it’s pornographic. God help us, we’re going to need it. LOL
A general ballpark number for breakeven is all that is really important anyway.
Dennis
Thanks.
I was surprised to read those low cost Permian production numbers. Two things to note.
The New Mexico rig count has been very steady at slightly over 90 rigs/wk since October. Also Midland and Martin seem to be settling in close to 25 rigs/wk each since October. If this continues then that lower breakeven price may have some credibility.
On the other hand if your numbers are closer to the truth, then the companies face the question of not drilling and having their quarterly report show a production drop, which share holders won’t like. On the other hand they could drill and report a smaller profit/loss but show steady production.
I was wondering if you could run your Permian model and then suddenly in early 2025 drop the number of monthly completions by 10% for say 6 months and then back up to the original number, I am assuming prices rebound back to $70 six months later. I ask this because I am wondering whether the production drop that occurs with the drop in completions ever gets recovered in three or 4 years.
Attached is an article which shows the cost pressures Chevron is facing.
“The Permian Basin, a key area for Chevron, will see a reduced budget of $4.5bn–5bn as the company shifts its focus from production growth to enhancing free cash flow.”
This statement lends more credence to your breakeven oil price and possibly slower growth in US production. We will have to keep watching the weekly rig count and Frac spread for the next few months to get a better idea of how the oil price affects rigs and fracs,
https://finance.yahoo.com/news/chevron-plans-reduce-2025-capex-102326434.html
Ovi,
This is the scenario you requested. I simply modified my scenario in the way you requested.
Dennis
Thanks
What was the completion rate pre-drop?
There is a production drop but not as big as I expected and it recovers much more quickly than I expected.
In Dec 2024 it was 487 completions, it falls to 438 completions from Jan to June 2025, then increases to 482 in July 2025 (as that was my initial scenario rate).
Here is anothet article that mention 60 usd/bbl WTI. Think the tarrifs will inctease cost level for imported equipment and spare parts.
https://finance.yahoo.com/news/cheap-crude-tests-u-shale-220000404.html
Actual I had exspected about 75 – 80 usd/bbl. Think there have been a positive impact on cost by use of simultaneously
fracking. I read that they frack 3 wells simultaneously fracking. This might also they do with drilling horizontal wells. Higher utilization of equipment and pepole, reduced transport cost reduce cost each foot well. But I believe productivity improvement goes slower now.
Freddy,
Productivity is decreasing when normalized for lateral length, this has been the case since 2016 in the Permian Basin. I am convinced that $60/b or lower will be a problem for tight oil producers in the US.
There is also several other issues that is a growing challange in shale buisiness. The higher utilization of a field means more chield well interference. Beside that it seems more wells became gasier. There is also a growing water production. Thoose 3 elements together with the fact that geology are getting more challenging as the best area is already drilled Tier 1 Area. Think now they operate Tiere 2 and 3 area. If it had not been for improved drilling, fracking processes break even price would have been much higher. But this tecnology requires huge capital and Area and the smaller Company have significant higher break even price than Exoon.
some of the lowered EUR/ft numbers are delayed because the decline tail is 3 years behind, the IP/ft might be just as good or looks slightly higher with longer laterals and more proppant/liquid loading.
The EUR estimates or EIA/USGS reserve estimates all might be over estimating for shale oil by 30~>50% based on higher IP and a slower decline curve; while underestimate shale gas, especially in Marcellus, where the decline tail also scales up with longer lateral, higher IP.
Ovi,
Slight variation with DPR completion rates for Jan 2024 to Feb 2025 used, then 10% drop (from 443 to 399) from March to August 2025, then back to 443 wells in Sept 2025, I assume an annual rate of decrease in new well productivity (EUR) of 2% starting in Jan 2025 for this scenario. I also assume the completion rate is 443 wells per month from Sept 2025 to Dec 2028 and then completion rate decreases falling to zero by August 2035.
On the rigs in Louisiana, my guess is that most of the oil is condensate from gas wells. Chart with C+C and wet natural gas for Louisiana from 1997 to 2025 below.
Lousiana Horizontal Oil and Gas Rigs, HOR=horizontal oil rigs, HGR=horizontal gas rigs
Dennis
Thanks. Looks like Louisiana is mostly condensate.
Ovi:
TLDR: Most OH reported oil would be considered “lease condensate”. Most LA reported oil would not.
EIA used to report crude gravity by state, at every ten API points (LT30, 30-40, 40-50, GT50). I could not find data more recent than FEB2024, but as of that time, ~80% of OH crude was higher than 50 API gravity, a threshold that almost anyone would consider marketing as “condensate”. In contrast, only about 20% of LA oil was above 50 API gravity.
Basically, I think the story of LA oil is that it is mostly legacy (declining) conventional crude from onshore and state GOM waters. It’s not like nobody will ever drill another oil well in LA, but mostly what is going on now is drilling of the Haynesville (which is very dry gas, with almost zero condensate, often not even processed for NGLs…but placed directly into dry gas long haul pipes!). So, overall the state is more of a mix of active drilling for dry gas (almost zero associated crude/condensate) and just declining conventional crude oil (with negligible drilling) and occasional up/down from weather, especially hurricanes.
Ohio is a different story. Almost all the drilling is going after the Utica or Marcellus and, in OH, these wells produce significant amounts of BOTH gas and associated lease condensate. They are truly “in betweener” wells. In contrast, LA where it is more a story of different populations.
But even in OH, it’s not as simple as “gas was growing and oil (lease condensate) grew with it”. This is because if you look at the changes over time, oil has been growing FASTER than gas in OH.
In general, you can expect gas to oil ratios to grow over time, because oil decline curves are steeper than gas decline curves. So, for a prospect like ND, where they drill enough to essentially keep crude production flat, they see gas grow. But in OH, it has been the opposite, gas production has been essentially flat, while oil quixotically grew!
Consider that in SEP2021, OH oil production was only 48,000 bopd. And it has almost tripled since then. Meanwhile, over the same time frame, gas production slightly declined (from 6.1 to 5.5 BCF/d). So…yes, there really is sort of a little “oil play” within OH. I wouldn’t overdramatize it. It’s not NM. But it is not just EOG spin machine either. It’s happening.
As for the BH data on “oil directed” or “gas directed” rig count, I would maybe not read too much into it. First of all, BH data is not perfect (not to slam it, very happy we have something). Second for OH, I suspect these wells need both oil and gas revenue to be NPV+. So, it’s really kind of arbitrary what you call the rig–it is actually drilling for both. I suspect there’s more than one rig in the “oil play” of OH. I think EOG has one and so does Encino. They just don’t care what they call the “directed” field on the BH data.
Nony
TLDR: I try to let the charts tell the story.
Thanks for the detailed info on OH and LA.
As for BH data, maybe the numbers themselves are not as important as the trend. While the numbers are dropping, there is no info on how to compare today’s rigs with those in January 2023. Do the new rigs have double or triple the power of the January 2023 rigs. If so, not as many are required to drill the same number of wells. Difficult to interpret those number without more info.
Bottom line. we really need to know how many wells are being drilled every month. Novi Labs used to provide that info but it is not available for free now. In 2023, the last year of significant rising US production, Novi Labs was reporting an average of 460 new wells per month. Production and Rig counts have been flat since the end of 2024 to today. What has changed?
Agreed. And cool, man. Yes, per rig productivity has gone up. Even leaving out lateral length increase (which helps by spreading setup and vertical), you just have an aspect of speed. They have gotten faster over the years, even within the lateral.
There is also an issue of high/low grading. This happens not only with the land, but with the crews and equipment. So, the best crews/rigs tend to be concentrated more during a bust. (Conversely of course, when we have a boom, then more marginal equipment and greenhorn drilling crews are mobilized.)
Also, of course there can be an effect of cost deflation. If very few rigs are drilling, the rig rates tend to be low. (During a bust.) During a boom, they rise rapidly. Can be a 2x difference across the cycle. (And yes, there are many inflationary aspects also: tarrifs, inflation itself, etc. But during a bust, you will see capital costs to drill a well go down…this happens every cycle.)
One small note: if you want to look at number of wells, than the relevant metric is per well production, not normalized by length. If you decide to look at normalized (by foot) productivity, than you also have to know how many feet were drilled, not how many wells!
Oh…and if you just want a “chart story” for LA and OH crude density comparison, here is the relevant data:
https://www.eia.gov/dnav/pet/PET_CRD_API_ADC_MBBLPD_M.htm
I would do a double column 100% comparison, for FEB2024. Not a time series.
https://d2mvzyuse3lwjc.cloudfront.net/doc/en/UserGuide/images/100_Stack_Column_Graph/100_Stack_Column.png?v=38773
here is a chart from EIA (https://www.eia.gov/petroleum/production/#ng-tab) of gross gas from WV, PA and OH, and I combine the WV PA together to show a 4th plot.
Details: most gas from WV and PA are from Marcellus, and Utica only has about ~0.8 and ~0.5 BCFPD for PA and WV respectively. Therefore, one could see the total Marcellus gas is still increasing and clearly not peaking yet, e.g. from ~24BCFPD Feb2020 to ~29BCFPD in Feb 2025; while the PA Marcellus has been flat since Feb2020 mainly due to wellhead prices way lower than HH. And total production to date for Marcellus only is already ~100TCF since 2010.
OH gas is mainly from Utica, and because lower GOR ratio and drilling targeting only condensate to oil, the gas production has been falling.
Marketed natural gas production from PA, WV, and Ohio. The OLS trend from March 2022 to Feb 2025 (36 months) is an annual increase of about 0.51 BCF/d. Unless pipelines are built to NE or to Gulf Coast or a new LNG facility is built in Maryland we are not likely to see a big increase in Appalachian Natural Gas output (includes both Marcellus and Utica Formations).
Dennis,
Nony’s comment down below about ‘trying to at least know what you don’t know’ may be particularly apt when it comes to the Gas World … specifically App Basin future production.
As you have focused primarily on oil these past many years, it is understandable that you have limited familiarity with all things gas.
The possibility of more pipe to serve NYS and New England is growing stronger, but it is the data center build out that will greatly boost App Basin natgas output.
The Homer City operation alone will consume close to a Billion cubic feet (~800) when it is fully online in a few years’ time.
The current backlog from Siemens, Mitsubishi and GE Venova for large natgas turbines is approaching 5 years, despite a ramping up of production capacity.
It would not be surprising to see App Basin increase output of natty by 5 to 10 Bcfd in a decade’s time if current plans come to fruition.
Coffeeguyzz,
Perhaps output will increase, depends on prices and demand. The future is difficult to predict.
I would caution talking about normalized per foot production in the context of well go nogo investment decisions. When you are deciding to drill or not, you look at the capital cost versus the production. At the well level.
Yes…for a peak oiler, it may be interesting that rock productivity is down. But for an investment decision, it is not the relevant metric. Even if you just think of it as a capital efficiency increase, longer wells can help. Essentially more feet for the same 12 million or whatever initial capex.
The benefit of a longer well is the vertical and the move setup cost being spread over a longer lateral.
Of course there are tradeoffs. We have very few 4 mile wells for instance. But we have very few 1 milers any more either. It’s been a gradual evolution of capability to allow economic drilling at longer lengths. Steering. Lease boundary trading. Etc.
Nony,
I only look at productivity per foot to get an idea of utilizing the productive area of each formation, so for example if an operator claims they have 30000 locations left to drill, it makes a difference if they are talking about 10k wells or 15k wells. For my models I just use well productivity that is not normalized for lateral length, future productivity is a guess, but I simply assume lateral lengths will remain what they were for the most recent well that I have the data to do a decent well profile estimate (currently for 2022 wells) and assume productivity may decline at a rate similar to the rate we have seen normalized productivity decline in the Permian since 2016 (about 2% per year). The guess is likely to be incorrect, but I don’t have any new data at the average well level.
I think with capital budgeting, it’s important to know that you don’t know. I don’t place too much stock in either a flashy press release or the industry veterans that habituate this blog comment section (very few in number and not shale operators).
I looked for a public pure play Permian operator to estimate average capital costs and got this:
https://permianres.com/operations/
They are Delaware focused, so probably a bit deeper (more expensive) than a Midland subbasin operator.
If you look at their 2025 capital budget it is $2B (1.9-2.1B), to drill 214 net wells (285 gross, 75% WI). So that implies 9.4 MM/well. Their expected average lateral length is 10,000 feet (i.e. “two miles”).
They actually say that only 80% of the $2B is for well-level D&C, the other 20% is for central facilities and workovers, but I’ve been conservative and just allocated 100% of the total capex to the overall (net) well count.
See: https://permianres.com/permian-resources-announces-strong-fourth-quarter-2024-results-and-provides-full-year-2025-plan-with-increased-capital-efficiency/
Of course, you could look at more companies or even interview someone from Halliburton or the like.
But…if you see a bunch of wells getting drilled that don’t make sense to you, but the industry continues to do so…I would at least consider that your model (or the assumptions within it) are at issue. Not that all these operators are just trying to make peak oil blogs look bad by wasting their money.
Nony,
Thanks.
Based on 10k for 2024 for Permian Resources the average capital cost per well was about 10 million. If we assume this is average cost for all producers in the Permian Basin, and use their average sales price in 2024 for crude, NGL and NG then the well pays out in 37 months and would be profitable. If we assume prices drop to current level for Oil and NG and NGL sells at about 30% of crude, then the average well pays out at about 90 months. Also keep in mind that with tariffs, pipe will become more expensive which will tend to increase costs. This might be offset with lower costs for rigs and frac spreads due to lower levels of activity.
See comment further downthread where I still think 12 to 13 million is a better number when land cost is included.
WTI currently at $56.16. Do we see $50 or sub $50 by the end of the week or next week? Not looking good.
There some pretty strong support on the chart at about $38. But I feel if we reach that support it means things are bad. Really bad. Maybe $25 oil is in the cards. Maybe not. We shall see.
HHH
Do you think this price drop is part of an effort to convince Putin to settle the Ukraine war by starving him of income?
No I don’t think we are intentionally setting out to send the global economy into a recession just to bring Putin to his knees.
Economic weakness was clearly visible before tariffs were put into place. Globally central banks were already well into the cutting rates cycle before the tariffs. Not that interest rate cuts matter but they are an acknowledgment by the central banks that they see the weakness in the economy.
The tariffs obviously piled onto the weakness that was already there.
Oil prices are kinda like interest rates in China. Their interest rates don’t lie. Their GDP isn’t even half of the official number they report. Oil prices don’t lie. The economy isn’t doing well.
I don’t believe it’s part of some grand strategy to bring Putin’s war to an end.
Oil at $25 would be a perfect time to go bomb Iran though if you want to think semi conspiratorial.
Do the majors and large independents have high overhead? Do they figure in G&A in “breakeven?”
One of the reasons tiny companies like ours end up with production that used to be operated by majors and larger independents is that we can do it cheaper.
So, although LOE goes up as production per well drops, our G&A can be cut to the extreme. We don’t pay ourselves, we don’t make distributions (pay dividends).
I continue to be amazed by US shale. Nothing like it has happened in previous history. 5 million BOPD to over 13 million BOPD.
Will be interesting to see how US production ends up this year assuming WTI is going to stay low.
You guys might want to look at the shale play stock prices. I still own COP and XOM. Neither are pure shale play. COP is down 25% in the past year. XOM is down 9% during the same time frame.
Some companies that I think are strictly shale upstream in the past year:
FANG down 31%
EOG down 16%
CHRD down 47%
SM down 52%
CIVI down 59%
NOG down 36%
HES down 17%
CTRA down 6%
DVN down 38%
The one I found that is up is EXE, formerly Chesapeake. Up 22% in the past year.
Im sure there are others that maybe I should look at.
Based merely on the various stock performance, I’d say that falling from $70’s WTI to $50’s WTI matters a decent amount.
It matters a lot to stock speculators. If you are in the midstream (pipelines), you take a more phlegmatic approach. These things (prices, recessions, wars) come and go. But the production will flatline for a while before it crashes.
Look how long old man Bakken has hung in there. Remember Art Berman predicting inexorable decline?
https://www.forbes.com/sites/arthurberman/2017/03/01/the-beginning-of-the-end-for-the-bakken-shale-play/
It always surprising the shale h8ers how (even despite the massive decline rates), basin production manages to hang in there during price declines. There’s a lot of inertia in the system in terms of sunk costs (DUCs, lease bonuses, seismic shoots, pipeline contracts, drilling contracts). So even if production turns, it never seems to crash as hard as the Art Berman types expect. I remember Rockman talking about this over ten years ago.
The other thing of course is high grading. The marginal wells don’t get drilled…of course. But the remaining ones are the better ones. We see this all the time, with rig productivity (even factoring out DUC effect) turning up during price declines. They just drill the best of the best.
And then, there’s also an effect of day rates and pipe prices going down when there is less activity (and the converse of course during booms). Along with just general belt tightening (less G&A, R&D, exploration, consultants, Ruth’s Chris dinners, etc.).
—
But all that said, my gut says 60+ is coming. Total wild hunch, but I think as we head into summer some of the doomer feelings about Orange Man tariffs will die down and demand will pick up. And I totally get why markets freaked out. But I just think we will settle down. See a lot of my friends planning trips to Europe, buying boats, etc. Summer will get everyone in a better mood and the pump will get primed.
Nony,
Yes Bakken has hung in there with roughly a plateau since pandemic crash with average completion rate over past 4 years at 75 wells per month, as far as high grading this has not helped a lot since the fall of 2023 with average annual decline rate of about 5% from Sept 2023 to Feb 2025 and 7.7% per year from Sept 2023 to Sept 2024. From Feb 2024 to Feb 2025 the annual decline rate was 4.8%. Eventually the sweet spots will run out of room for new wells and the average well productivity will decrease in the Bakken/Three Forks.
Based on Novilabs data (last available is from March 2024), 2020 may have been the high point for average well productivity in the Bakken/Three Forks.
https://novilabs.com/blog/north-dakota-update-through-jan-2024/
Nony,
Rich folks won’t be affected by the Trump tax, it will be working class folks that probably aren’t buying new boats or making trips to Europe that will be hit by higher prices and the layoffs that will ensue when small businesses go bankrupt and big box stores cut back staff because there are fewer products to put on the shelves.
You are deluding yourself if you believe everything will be fine.
In my simple mind, USA is the only country that produces a lot of oil that wants low oil prices.
OPEC doesn’t want low oil prices. Nor does Canada. Maybe Brazil and China are similar to USA in this regard?
It looks like maybe in the 13 million BOPD is the high end for USA, and will probably hang in there for a while.
Last time oil peaked in USA was 1970-71. Oil prices were low. Then they quadrupled in 1973? Think we see that replay, or something different?
Oil production in the USA didn’t really fall off a cliff after the first peak. It stayed in the 8-9 million BOPD range for over a decade until after the 1986 price collapse.
But, oil went from $2.90 in 1972 to $11.50 in early 1974, up to $38 in 1979, and was still in the $20’s until the 1986 collapse. Oil then stayed relatively low until 2003. It then ran up from the $20’s in 2003 to $147, then crashed, then high until 2014.
I’m 55 and God willing hope to live to see 2-3 more decades of what happens to the oil price. I have a feeling during that time there will be at least one more rocket higher. But just guessing, of course.
I do think another US peak will be a big deal, assuming it happens.
Shallow Sand,
If prices remain low the peak for US may be behind us. If oil prices rise to $90/bo or more and NG returns to $4/MCF or more we might see a new peak. For current Permian average well, if we assume a full capital cost of $10 million per well and crude at $90/b at refinery gate ($85/b at wellhead), NG at $4/MCF and NGL at 30% of crude price the average well pays out at 16 months so we might see the completion rate increase if oil and natural gas prices rise in the future.
Permian scenario assuming higher oil prices (over $85/bo and natural gas over $3/MCF). Note the slow increase in Permian output may not be enough to offset declining output elsewhere in the US, the current STEO predicts a centered 12 month peak in December 2025 at 13630 kb/d, the current centered 12 month output is the high point so far at 13261 kb/d in August 2024 for US C plus C output. In my view the STEO forecast is likely to be optimistic, note that it was 390 kb/d too high for February 2025.
I expect we might see revisions in the future STEO forecast, but also wonder if political pressure will make it even less believable.
Would not surprise me if EIA stops releasing production data this year.
Shallow sand,
I hope you are wrong, but if the data is cooked that might be better than false data, my worry is that data will be published, but it will no longer be relatively unbiased.
SS/DC
Remember that we will have access to production data from the three largest states. So we will here checking up on them.
Ovi,
Yes we have state data and we can also use the 914 estimates reported to the EIA for Texas and create our own estimates from those, if the data continues to be collected and reported, we could also try to sort out the pending lease file from the RRC which would improve the RRC estimates.
https://rrc.texas.gov/resource-center/research/data-sets-available-for-download/
SS
I still think that we will have an answer for you within six month. We will have a pretty good idea if the US is on a plateau.
This is old news now, it is the reason oil prices have dropped below $60/b.
https://oilprice.com/Latest-Energy-News/World-News/OPEC-Plans-Faster-Rollback-of-Output-Cuts.html
Excerpt:
The report, which comes on the heels of OPEC ’s latest meeting, this Saturday, at which the group agreed to add another 411,000 bpd to combined production in June, after a hike of the same size for May. Reuters calculations put the total amount of supply to be brought back over the second quarter at 960,000 barrels daily, or 44% of the 2.2 million bpd cut.
It will be interesting to see if the May STEO (released tomorrow) drops their oil price forecast.
Dennis
The June announcement is the second increase. The May increase was announced about six weeks ago. So we have to see if there is a change to their crude oil forecast and possibly the US’.
Ovi,
Yes the May increase was probably accounted for in the April STEO, the June increase may affect the May STEO, if they have time to account for it (the report was finalized on Sunday and this OPEC increase was announced on Saturday, I don’t know if they can react this quickly as they have seen staff cuts.)
If Trump could choke off oil from Iran, Venezuela and Russia well, it could easily remove 2~5 million BOPD.
Sheng Wu,
The US has been trying to do that for many years starting in 2017 for Iran and Venezuela and since 2023 for Russia. China is not worried about US sanctions and will import all that they can ship to China’s ports. Also Trump is looking for low oil prices to offset higher prices due to sanctions so I doubt he does more than pay lip service to enforcing sanctions on oil.
D C,
Sure, Trump does not want oil price too low either.
Turmp 1st term was able to beat down Iranian and Venezuela oil pretty low at ~0.4 and ~0.3MBOPD, and only to see them bouncing back in the past 4 years to 1.3 and 1MBOPD.
It appears that the Mid-con states gasoline price has been on the rise, I see ~25cents/gallon higher, while oil price has been down.
Sheng Wu,
Iran and Venezuela now have improved their ability to avoid sanctions and China is now more confident that they can do without Trump’s approval and will buy all the Iranian, Venezuelan, and Russian oil that will make it to their ports. Trump thinks the oil price should be $30/b, he is not an oil man and does not understand economics it seems.
On the $12 million cost estimate per well for Permian Basin, an expert explains this at link below
https://www.oilystuff.com/forumstuff/forum-stuff/its-gonna-get-ugly
In case this disappears (as sometimes happens when I reference this blog) some is copy and pasted below, but if it is still there read the link for the full story. All of the comments by MS are enlightening, well worth reading and learning from in my opinion.
By stuff people send me, including final well costs (different than AFE’s) I consider these costs in the chart above roughly 10% lower than reality. And this was before tariffs and trade wars increased the cost of tubulars, which I don’t have a handle on yet. So I suggest a typical Midland Basin well to cost $10MM with three strings of casing, 12,000 feet of lateral, and no problems, which is rare.
I choose to ignore “tie in” costs mentioned in this chart as most wells drilled in the Midland Basin are infill stuff on existing units with massive tank batteries and treatment facilities already in place and requiring only several hundred K to lay flowline, electricity or gas make up for gas lift, etc.
What I choose NOT to ignore is “land costs.” Lots of internet experts consider leasehold, or land costs, sunk. So they are conveniently ignored in the economic analysis. I guess, however, that 65%-75% of wells being drilled in the Midland Basin now are on acquired acreage in an M&A, like Exxon and Diamondback, for instance and on a per location basis those M&A’s have run leasehold costs back up to $4 MM each per drilling location (Enverus). Each M&A contains compensation for existing production, deeply discounted; most of the value is in drillable locations, something the Permian Basin is running out of. Assuming each acquired drilling location has two benches that can be accessed from the same acre of land, total full cycle well costs in the Midland Basin are pushing $12-$13 MM each. And likely to go higher with steel costs.
I agree 100% with all of this and would suggest $12.5 million is a good number to use for full cycle well cost for the average Permian Basin well, land cost needs to be included as well as plugging cost. Note also that costs are likely to rise due to tariffs.
Lease acquisition costs are sunk, unless you are getting new leases. It’s irrelevant if you acquired a company in M&A or paid the leasehold bonus yourself. And irrelevant if it was a year ago or 50 years ago. It’s a sunk cost.
The decision now is if you drill or don’t drill. That is based on the new investment you make to drill versus the new revenues you get from production.
Land cost, for the vast majority of the PB is sunk, sunk, sunkitty sunk-sunk. Certainly on locations that companies call “our locations”, it is already sunk.
————
https://en.wikipedia.org/wiki/Sunk_cost
“In economics and business decision-making, a sunk cost (also known as retrospective cost) is a cost that has already been incurred and cannot be recovered.”
If Exxon chooses NOT to drill their acreage, the guy they bought it from in M&A won’t refund their money. It is SUNK.
P.s. Duh.
This is the single stupidest thing I have ever heard in 65 years of being in business for myself, much less the oil and natural gas business, Nony. Good grief. I can’t believe anybody actually believes a word you say.
It would be helpful, of course, if we knew your name, what you did for a living, if you actually work, what your work experience was, what exactly makes you such an expert on shale oil and shale gas, but that is entirely the point in the anonymity, isn’t it? That we don’t.
I’ve always wondered if posting on social media annonymously makes one feel less embarrassed when one says things one knows nothing about? I suppose it depends on WHERE you say them, uh? I mean really, would you say this stuff on a chat room at the JPT?
Alimbiquated, you love to criticize America, and American politics from where, Europe, whenever you can…what say ye? You folks in Europe have your energy shit together, don’t you? Yeah, man. You guys have flat been on the ball.
“Every BO extracted for a shale oil company is burdended by corporate overhead, dividend costs and debt… old, middle aged or new born BO. Stop drilling new wells and the cost burden of legacy wells increases as they assume greater responsibility for costs and liabilities. Liabilities don’t just vanish. Hee hee. If you stop drilling new wells in the shale biz you are sliding into the abyss.
The shale oil sector loses money drilling new wells below $70, IMO. It muddles thru that with cash flow. But when cash flow gets whacked 30% things get bad, fast. The company has to reconfigure itself, change its model, tell its investors no mas on dividends, try to amend loan covenants at the bank, change drilling committment clauses in OG&M leases, cut staff, cut overhead, cease the stupid buyback programs, drop rigs, break more TRRC rules, sell shit, defer plugging, stop R&D, suspend recyled water projects, flare more gas in lieu of expensive tie-ins, downspace and keep kicking the debt can down the road for another day.
The financial health of the shale oil sector is NOT determined on the economics of individual wells. That seems to be part of what I don’t understand about today’s financial engineers and internet analysts.” I said that.
Oil and gas extraction is a business, all encompassing. In the end, all of a companies liabilities, including long term debt, and P,A & D have to be paid (it is stupid to say those “future” costs should be discounted when those annual costs escalate more than the discount rate. Plugging costs are going out of sight. A few more 5.5 earthquakes, and more water bubbling up out of the ground, and retirement costs are going to eat the shale oil industry up. Or, more likely, you, the American taxpayer, will pay for it all. All you boys in Europe feeling entitled to cheap American oil, relax; you won’t have to pay a thing.
But for the insults I would not want to help here anymore;. In this particular case I agree with Dennis. Its sorta just common sense. Sunk is debt. If I borrow $13.2 billion to buy another company, that does not just vanish because the portion of that purchase attributable to undrilled acreage is “sunk.” Yeow ! The coon outside eating my bird food right now is smarter than THAT !
I looked at Conterra, Permian R. and Matador today; just south of $12B in long term debt. At $60 not one of those companies are above water on debt, even IF they were telling the truth about PDP reserves. Which they are not.
Maybe its not a good idea to listen to me. Am I truly biased toward shale oil, or am I more often close to being right, than wrong, because I have owned WI in shale oil wells and been in the oil business for over a half century? I don’t care one way or another… but Nony? Gimme a break.
Listen to what T. Stice said today and yesterday. He’s right. He’s hauling ass a from his company at exactly the right time. Its pretty much over, that from the horses mouth. He’s blaming Trump, tariffs and OPEC rather than his own poor reservoir mangement and 8% recovery rates of OOIP.
Mr Shellman,
I think it is always wise to listen to an expert like you. Thanks for sharing your knowledge here.
Why don’t you talk to a few more “experts”. Maybe start with the vast amount of people who disagree with Mike on including sunk (already spent!) costs in the going forward drilling decision model.
Oh…and I’m not a salty “earl man”. But I do know what sunk cost is. And not just as a term…but to watch out for it.
No such thing as a “sunk cost” as you describe. The money either came from debt or equity (with cash on the books belonging to the shareholders, so a draw on equity).
That cash has to be paid back.
A simplified example to drive the point:
1 – You buy a piece of land for $100M
2 – Bad news! There’s only one place to drill a single well.
3a – Good news! You can safely ignore the $100M because it’s ‘sunk’ and notice that you can invest another $10M to earn $2.5M over the next 15 years. Your investors happily ignore the $100M already plunked down and gleefully fork over another $10M.
3b – You’re SOL because the bank and investors want their money back – or what’s left of it – and demand that the land be sold for the highest bid so they can take their tax write-off this year, and not over the next 15 years.
If you think 3a is actually an option, you haven’t actually been on the capital/decision side of the equation.
Hi, Chris! I hope you are well, man!
Like “boe and/or breakeven” I never heard the term “sunk costs” in 50 years as independent oil and gas operator until the onslaught of shale. If unpaid costs accrue they do so, as you point out, in the form of debt or loss of equity (value). Both require remedy. Good operators don’t change definitions, or move the goal posts, or need words like ROCE or NAV, or NPV or IRR; its money out v. money in. Like a checkbook.
Indebtedness is a liability and every barrel of oil or MCF of gas produced by the debtor is a burden on that barrel or mcf already drilled and producing, or about to be drilled. Mergers and acquistions cost somebody money. If Bloomberg and or Rueters refers to an M&A in terms of value paid per drilling location (its a key metric in analyzing the dea), why I am being singled out is beyond me. If Rystad identifies interest expense on long term debt as a full cycle corporate cost, why isn’t the debt itself the same corporate cost and part of the breakeven calculation? It should be. That is why I suggest somebody like FANG has a true breakeven price threashold of something akin to $90 a barrel.
Debt is precisely why most of the shale sector has to keep drilling wells below breakeven. They have little control over their destiny; debt owns them.
This entire sunk argument is sort of high school. If the analyst does not wish to refer the cost per acre of land in the M&A as leasehold costs call it M&A costs (which is precisely what I wrote, not “old leasehold costs! WTF that came from I have no clue. Call it debt that has to be paid back. It is a burden on the economics of every future well because it is burden on the company.
I don’t suggest anybody listen to me. I am not an expert, just a successful oil and gas operator in Texas for a half century. I had some heavy hitters for partners. We made money because we all some skin in the game and nobody lied to each other over profits, or funky EUR’s, or 6:1 gas to oil ratios. That doesn’t make me special, just normal; one of thousands from the good days.
If as the person with no name says no other (shale) oil man or woman) in the country would agree with my interpretation of well economics and fiscal responsibility, particularly the burden debt has on the future…. I must be doing something right. Because shale oil, after 17 years, is still deeply in a financial hole, its overall management of such a valuable resource a detriment to the long term security of my country.
Shale cheerleaders typically embrace big numbers like IP’s and first year cummprods; they love that stuff. Like kids in a candy store. They avoid other big numbers like Western Haynesville wells typically COST $25-$35MM dollars to drill and complete. Or long term debt (Comstock $3.0 B, up 12% YOY). Or really little numbers like by 202410K Comstock grossed $1.25 per MCF after hedges. Royalty owners get their checks free and clear of costs and poor well economics. Capitalism and exports are all one word to most royalty owners
Its a business, oil and gas extraction. To stay in business you have to be profitable and eventually end the business with all liabilities paid in full, including debt and retirement costs.
the green energy is all like “sunk cost” too, if not 3X worse.
Including the terminal plugging cost is a good practice. Kudos. However, your model needs to discount that back. Let’s say it costs 0.25MM to plug the well. You don’t have to pay that now. You pay it 20 years from now. Or whatever your estimate is on well plug time. But you’re not plugging it the same year you complete it! Big picture, it’s good practice and the way to build your FP&A model. But not a huge lever.
12.5% is not a realistic hurdle rate. EOG is paying 5-6% for debt. Permian Resources is paying 7%. Of course, you can’t finance a portfolio of drilling entirely on debt. Equity (which is higher risk because debt is “senior” in BK), will command more return. But still…12.5% is not reasonable for a blended average, a “WACC”.
I would probably just use 10% to keep it simple. (May even be under that…after all there is minimal exploration risk, it’s price risk. You’re just doing infilling. It’s a resource play!)
Now…you will SEE a lot of 12% on company models. That (not 12.5%) is very much a sort of CFO “norm”. But it doesn’t reflect true economics. It’s an artificially high hurdle that companies like to use because they know people will lie (high) about expected future profit. But if you’re building an objective view of the economics, you should use a more classical CAPM WACC. This will help explain why “wells you don’t understand why they get drilled” do get drilled. Money is sloshing around for a home. USAA isn’t paying jack on saving/checking account interest. 12% would be glorious. But in reality, projects will get done for less…yes, even if companies “say” they use 12% as WACC (they just compensate with optimism on other parts of the model).
I would caution you to talk to MORE industry veterans. Cast a wider net. You’re going to the same exact industry veteran, you’ve been going to for years. Like exaaaaa…aaaactly they same one I thought you were. You’re single point safe. And your single point is pretty anti-shale. At least get multiple views.
I have ZERO idea if Permian Resources is a good proxy or not. I had actually never even heard of them! Much less the being my “heroes”. Just came up as first pure play Permian Basin shaleco when I looked for one online.
Again, I don’t know if 9.4 is right upfront capex or 12 is. But it’s not a no brainer, when you say 12…and the very first thing I find on line (and not by their statements, but by dividing yearly capex by yearly wells) suggests otherwise.
Again, I don’t know which number is better. (I do know how to improve the estimate, but not willing to invest a bunch of time, now, in doing so.)
I would just suggest a little more humility. Try to at least know what you don’t know. Just because you draw spaghetti diagrams on a peak oil blog, doesn’t make you an expert energy economist.
Oh…and this isn’t even to $60 is an unreasonable breakeven. Fed survey suggested low 60s! If anything I think you are low on OPEX (LOE, G&A) and high on CAPEX, so it kind of washes out.
But sunk cost fallacy for old M&A deals and lease bonuses!? Grrr….get off my lawn! 😉
Nony,
I am an economist, we use opportunity cost. I do my model in real terms, inflation adjusted dollars, a nominal discount rate of 12.5% assumes an average rate of inflation of 2.5 %, this gives me a real annual discount rate of 10%. Running an oil business is not risk free. The opportunity cost is an investment in VOO which has a long term real rate of return of 8% per year. To earn a net of 2% on a high risk investment would not be worthwhile imho.
Dennis
You might be an economist but that doesn’t mean you understand everything about how things work in practice.
https://oilprice.com/Energy/Crude-Oil/Big-Oil-Isnt-Backing-Down-at-60-Oil.html
It is obvious to me that very large companies that have very cheap to produce fields are able to withstand low oil prices. They will see small companies which only work in limited areas struggle and then go bust. The big companies will then be able to buy up all these bankrupt assets a bargain basement prices. Rockefeller springs to mind.
Also if OPEC do start pumping the 2.2 million barrels per day cuts, it will get very interesting.
The big companies will end up owning everything and be able to control the price better. The low price will boost the economy for a while and the 2018 peak is going to be beaten.
Loadsofoil,
I have never claimed omniscience, the point of mentioning economics is that business majors probably look at things differently than an economist, the same is true between physicists and engineers. A business major thinks sunk costs should be ignored, this is very short term thinking in my view, when looking at a business as a whole one needs to consider all costs because at the end of the day a profitable company has to pay back all the money it owes.
Yes some large companies may have lower costs than smaller companies due to their market power and due to economies of scale. Note however that as smaller companies go bankrupt some marginal wells will be plugged and we may end up with lower overall output. As Shallow Sand pointed out earlier the marginal wells are operated by smaller producers with lower overhead and their is a limit to how low prices can go before they also become bankrupt or simply close up shop (these operators usually do not have much debt if they are smart.)
I agree the large companies will survive and pick up the better properties from smaller producers, if those not so good wells are shut in we will see output fall rather than rise.
Low oil prices sometimes boost the economy and sometimes they are the result of low demand. The turmoil in international trade cause by Trump is likely to lead to a World Depression, it will be interesting to see the quarterly reports from the large publicly traded companies when Oil gets close to $50/b, which it may do as OPEC increases output. We aren’t going to see much increase from Canada, US, or Brazil with oil at $50/b and other nations may see a faster decline in output as investment stalls at these prices, maybe OPEC will increase by 2 Mb/d, some might be offset by Iran and Venezuela seeing more strict sanction enforcement as oil prices crash. It will be interesting.
Dennis,
In business you have to ignore sunk costs once they are sunk. There’s nothing you can do about them anyway. You have to play the hand you have. Caring about sunk cost is what you do beforehand.
Alimbiquated,
I understand some costs cannot be recovered, it is not clear that the purchase or lease rights to land that has not been developed qualifies. Also if we are considering profit and loss, it seems ignoring sunk cost is a mistake. Lets say I am a builder and buy land and build a home on that land, the cost to build the home is 500k and I sell it to a prospective buyer for 700k, do I now claim 200k profit because the land purchase is a sunk cost? I don’t think so unless I paid zero for the land, though even in that case only if I could only sell the land at a price of zero.
Typically this is not the case unless the land is in a very poor location (maybe on the moon).
Sunk costs are sunk. If a company has “10,000 locations”, the leasing cost is sunk. If someone needs to contort themselves into a snail to call those non-sunk, then they are economically silly. This is like the easiest thing in the world to look at.
If you did a bad acquisition…and you don’t drill the wells, do you get the M&A payment back? No. No…no…no.
This is massively silly. If you’re dealing with someone who “isn’t sure” that lease bonuses (or M&A buys) are a sunk cost, than you are dealing with someone who can’t be trusted on much else. This is low hanging fruit!
Nony,
One can do a point foward analysis that ignores sunk costs, or a full cycle analysis that looks at all costs to evaluate a firm, point forward is used when deciding to proceed with a project or not. Full cycle analysis answers a different question, such as why the hell is my firm not making any money? If we ignore past mistakes they will continue in the future.
Nony,
If I buy a piece of land or pay for the rights to access a lease, but I have not yet developed the land, there is no sunk cost, I can resell the land or the rights, you seem to not understand sunk cost. If I have drilled a well, that would be a sunk cost. The rights to drill on a lease can be resold to another company for some price, that is called an opportunity cost, by not selling that right for some price and instead choosing to drill a well, the company has left that money on the table as it were and that cost should be included as part of the well cost. This is very standard microeconomics 101.
Your WACC is whacked. How do you think EOG is getting debt at 6%?
Oh…and sunk cost fallacy? Just go sit in the corner and put the dunce cap on.
https://www.youtube.com/watch?v=T4An37GXb2k
Rusty Braziel on Cramer. Not saying, I agree with his points, per se, just find him decent to listen to.
1. $60 is “ok”. 50 is bad. 80 would be awesome. (For shale oil producers.)
2. LNG export growth to continue.
3. Market doesn’t like the tariff talk.
4. “AI” is overhyped.
Our wellhead today is $53.50. I’m not sure where the price points are in various shale basins in relation to WTI.
I assume few go broke at $60 and still not a lot go broke at $50, unless that lasts for a couple of years.
I do think if we stay below $60 rigs and frack spreads will drop, several factors go into that as has been discussed here a lot.
Agreed, I was talking activity (and hence production), not “going broke”.
Opps
US oil production falling 120,000-170,000bpd this year.
https://x.com/Kpler/status/1919355178756559254?ref_src=twsrc%5Etfw%7Ctwcamp%5Etweetembed%7Ctwterm%5E1919355178756559254%7Ctwgr%5Ea4f2a52d036850645219d1bd0930a0bd0995c48b%7Ctwcon%5Es1_&ref_url=https%3A%2F%2Fwww.zerohedge.com%2Fenergy%2Fus-crude-oil-output-peak-early-year-kpler
JT,
It says they have cut their forecast by 120-170 kb/d, excerpt from the tweet below
Kpler now expects US #crude production to peak in 2025 and gradually decline after that.
I just read Diamondback’s CEO letter. Appears Travis Stice has called peak oil, US onshore.
Also appears that he isn’t as MAGA as maybe he used to be. Says steel costs have risen 10% due to tariffs.
The price difference between domestic and import is not that large with transportation cost all factored in, only 10% rise in cost, steel is relatively easier to use tariffs to boost domestic steel makers.
The other major cost rise in shale oil gas is the bridge plugs, a 50 stage lateral will use over 50 plugs, and10 years ago, China was importing from US at $10K/ea, and 50 plugs will cost half a million. Now, majority of domestic US plugs use OEM or almost finished plugs from China at $~2k/ea. That’s a price hike of half a million for each well.
Thank you Ovi for this work! The most interesting graphs for me are without a doubt the STEO’s March and April forecasts. The cornucopian extra barrels are dwindling into reality. The same, IMO, will probably happen to world production. If there ever was a second and higher peak after November 2018, it will be buried under the weight of Trump’s trade war. The yearly average will be a closer call, but it is becoming more and more obvious that we are not at the left side of the peak, but on a long, ondulating plateau. May it be long and stable enough for a transition to other energy sources! Mankind already won a decade or two with fracking and unconventional oil. Maybe one more decade and we’ll make it without bloody resource conflicts all over the world.
Westexasfanclub
Thanks
Besides myself, I thought that some of our readers would be interested in that change. That change has shown a further drop in US production in today’s May STEO report. It shows US production peaking in December 2025. Chart attached.
I still think there is still a bit of hopium in today’s STEO update. I just don’t see 464 kb/d of crude being added to US production between March and December. I think that my projection charts indicate that we are very close to being on a plateau. Unfortunately, the vagrancies of updated state data mask that conclusion but today’s news from the CEO of Diamondback makes me think that my estimate may be more realistic.
“The head of the largest independent oil producer in the Permian Basin predicts US shale production has peaked and will likely decline from here as oil prices hover near four-year lows.
“We have a very good view of what the US looks like. And right now that’s a business that’s slowing dramatically and likely declining in terms of production,” Diamondback Energy (FANG) CEO Travis Stice said during the company’s earnings call on Tuesday morning.”
As I keep saying, a few more months of data should clarify the situation. Hopefully.
https://finance.yahoo.com/news/this-oil-price-doesnt-work-diamondback-ceo-says-us-shale-production-has-peaked-154712764.html
Ovi,
I agree the EIA forecast looks quite optimistic especially when we consider their price forecast for WTI. I don’t see output increasing by much after April 2025 with WTI at below $60/b as forecast in the May STEO. I also agree that a few more months of data will make this clear, though there may be many wells that have already been drilled that might be completed so there could be a 6 to 8 month delay before we see this hit hard.
I am unsure how it will play out, plateau forecast seems more reasonable for 8 months followed by decline, we may see that in falling rig counts.
Texas- “more and more obvious that we are not at the left side of the peak, but on a long, ondulating plateau. May it be long and stable enough for a transition to other energy sources! Mankind already won a decade or two with fracking and unconventional oil.”
Yes, and it would be most welcome to achieve a stable outcome.
That will take both a monumental effort with fierce determination, and having the collective mind in the right place, with smart economic policies.
Sorry to say that our country ( and most others) ranks very poorly on those aspects, acting as if oil and gas will be abundant indefinitely.
Hickory,
The US, like most countries, relies heavily for leadership on large private business owners (aka investors, aka billionaires, aka oligarchs).
It seems to me that investors seems to be more and more out of touch with reality, more and more short sighted, less and less public spirited. The Carnegies and Rockefellers of the Gilded Age were certainly rapacious, but in comparison people like Musk and Thiel seem…just stupid.
What do you think? If you agree, any idea why this might be so?
Nick G
The tech bros all cut their teeth in the software business. Things move very quickly there. As a result, there tends to be an air of unreality around the whole enterprise. But sometimes totally crazy ideas pay off. It colors their worldview.
Here’s a (now somewhat dated) book about the software industry you might enjoy. It tries to explain why so many high tech companies mentioned in the much-lauded 1981 book “In Search of Excellence” failed so quickly.
It’s called “In Search of Stupidity”
https://www.r-5.org/files/books/ethology/experience/Merrill_R_Chapman-In_Search_of_Stupidity-EN.pdf
For sure,
I have seen first hand that technology can both evaluate better where to drill, what is there and how to get the most out of it all. And this would be a far better proposition than not doing anything to promote stability on the supply side. The question remains if the technology will be exported outside the western “block”, if it is not already being copied. Major assets are being depleted as the plateau phase continues. But I have to say that without technology advances a lot more resources would become stranded assets due to price.
As to having strong governments or whatever prevailing “structures” instead being there is important. I could not agree more. It is one thing to have a toolbox for a more pragmatic lifestyle, but someone have to promote it, enforce it and incentivise it.
A bit of disruption is probably for the best in order to learn to live with reality. Is a Trump disruption in fact good? Well that entirely depends on what kind of disruption we are talking about. I am not sure a “Pearl Harbor” event is what is needed, but I can sure subscribe to that shocks to electricity prices would be good to show the inherent risks going forward. Keeping the grid together would be top priority and I guess this is more important when we eventually begin with the downslope of fossil fuels.
The worst of all worlds
https://oilprice.com/Energy/Energy-General/Saudi-Arabias-Budget-Deficit-Surged-Before-the-Oil-Price-Crash.html
https://oilprice.com/Energy/Crude-Oil/Big-Oil-Isnt-Backing-Down-at-60-Oil.html
Saudi Arabia is fed up with Iraq and Kazakhstan producing more than their agreed quotas. So they are intending to reverse most or all previous cuts. This could bring up to 2.2 mbpd onto the market by November. How far oil prices will fall is anyone’s guess. $40 oil or even $30 for a short while is possible.
The price drop will hurt many and over the next months/ year, a good number will go bust.
After that the big oil companies will buy up bankrupt companies and drilling rights at rock bottom prices. After that they will probably restrict drilling to ensure a higher oil price.
That is of course the best of the worst cases. Iran will be very angry with these low prices, their economy will be close to collapse. So an attack on Saudi terminals is a real possibility.
At that point the United States could not just sit back and bombing Quds barracks and others sights would be an obvious start. Probably with the hope that anti government groups will rise up.
Coffeeguy/all:
Do you have a link to a good overview on the Waynesville (Western Haynesville) play? I found a few articles, but they are more topical/newsy, not overviews.
https://www.tgs.com/weekly-spotlight/11-25-2024
A video or PPT would be ideal.
Maybe I will go through the Comstock quarterly webinars and there was a sort of “revelation” style overview. Like when Apache made a splash with “Alpine High”. Or like the Deep Utica stuff. Or Novi’s webinar explaining the Uinta basin
And that is not to say it will/won’t be a disappointment. But I’d just like an overview, to get up to speed. Not even to debate it, to start. Just to have a handle on it, first.
https://www.hartenergy.com/ep/exclusives/japans-mitsui-testing-western-haynesville-alongside-comstock-aethon-212420
https://x.com/novilabs/status/1805620765741478030
Saputra/Patzek had a Haynesville TTR estimate in 2021, only 40TCF in core.
https://www.sciencedirect.com/science/article/pii/S187551002100247X?via%3Dihub
Yet by Feb, 2025, Haynesville already produced 40TCF and waiting to do another peak.
https://www.eia.gov/petroleum/production/#ng-tab
Sheng Wu,
When I look at that Saputra et al paper on Haynesville there seems to be little difference between core and non-core areas for EUR so the best forecast is the core plus non-core (URR=90 TCF), excerpt from paper below
Ultimately, the 4684 existing wells in the Haynesville will give an EUR of 30 Tscf. By adding 923 wells in the core areas, EUR will increase to slightly above 40 Tscf. By adding another 5023 wells in the noncore areas, EUR will increase to above 90 Tscf. The wells in the outer Haynesville are so bad that adding 11,198 new wells increases EUR only to 105 Tscf.
Expensive wells at 30 million each, yikes.
D C,
You are right that their core and non-core area well have the close EUR estimate at 11BCF (Core) and 10BCF(non-Core).
Again, Saputra/Patzek used outdated EUR data,
” By adding 923 wells in the core areas, EUR will increase to slightly above 40 Tscf” — or core EUR at 11BCF,
while the fact is that the new completion wells should easily have EUR over 12BCF core and non-core average combined, see
https://www.youtube.com/watch?v=CVqkN6YjVSc&t=673s
and refrac of old design could also bring up the old wells EUR.
Conservative/shale bashing Art Berman gave each lateral in Haynesville at even ~ 20BCF for 2018~2021 wells, which obviously Art distorted the data to show the sudden deterioration of 2023 wells — see figure attached, and I added the white arrows to show the realistic EUR.
The 30million dollar cost is for West Haynesville wells, and the East Haynesville probably costs ~$15million. On average in the core, the East Haynesville wells have EUR (12 BCF) similar to a Marcellus dry gas shale well at under $10million. In the West Virginia shallow Marcellus, the cost of a 15K foot lateral is only ~$8million.
Sheng Wu,
My guess is that Saputra used the data available at the time, the paper was published in 2019, probably only enough data to estimate 2017 wells at the time. For average 2018 well for Haynesville I get an EUR of about 10.6 BCF. In 2020 to 2022 the wells were a little more productive, likely due to increased lateral length, probably not a huge increase to URR perhaps a 20% bump in the URR of the play to 110 TCF.
I agree the Berman EUR estimates do not look reasonable, Enno Peters had Haynesville wells up to 2022 at no more than 13 BCF.
I actually had a copy of the Saputra Haynesville preprint PDF, and the data plots are updated to 2020. The paper was received Jan.8 2021, and Accepted May 2021.
My guess is that their paper was basically using the pre 2017 parabolic decline curves in Haynesville, but actually post 2017 decline curves became linear. Similarly, they probably used a decline curve for Marcellus post 2016 well that has all tails collapsed.
Sheng Wu,
Yes the terminal decline rate of the 2017 average well seems to be about 40% per year, so exponential decline at much higher rates than Marcellus (about a 10% annual rate of terminal decline). If we assume the 2018 well has about a 38% annual rate of terminal decline we get about 9.2 BCF for EUR and about 10.3 BCF for the EUR of the average 2020-2022 well.
Based on Novilabs data from
https://novilabs.com/blog/haynesville-update-through-april-2023-4/
The Saputra et al estimate seems pretty good and a URR of 90 TCF seems reasonable.
Thanks. I wonder if it ends up being like the Deep Utica (too expensive to currently compete….but massive resource). At least it doesn’t have the constraints that the anti-infrastructure Democrats have created for the App gas production.
Really?
Within the energy sector, the word ‘infrastructure’ includes a few more sources than oil and gas. Any stereotype has limits, but other sources like wind and solar have generally received support from US democrats and opposition from US republicans. Wind and solar are often criticized as being more material intensive than fossil fuel systems. In addition, the energy transition away from fossil fuels and towards electrifying everything is cited as requiring a significant buildout of the grid infrastructure.
In other words, democrats typically support energy sources that require significant infrastructure buildout. Democrats are indeed generally less supportive of fossil fuel infrastructure for all of the obvious reasons.
Nony,
I know little of the Western Haynesville other than what Comstock has been describing in their quarterly conference calls.
However, a short ‘Waynesville’ article popped up on my newsfeed the other day that was similar to the one that you linked in your comment.
The geologic/operational parameters are simply jaw dropping.
10,000/13,000/17,000 psi???
350/400 degrees Farenheit???
These guys will need to incorporate some of the cutting edge techniques/hardware of the deep water boys if they are going to jump into that pool.
Reported depths of 19,000 feet already drilled with permits to 25,000???
If the reporting is not misconstruing TVD with TMD, that would seem to be scarcely believeable.
I know of a few Tuscaloosa wells landed at over 16,000 feet and one Rogersville well that was even deeper, but 19,000 feet down and building a lateral out from there?
Wow.
That 25,000 footer – if true vertical depth – might simply be an exploratory effort like the Rogersville effort.
The weight on the rig to land casing would be extreme.
One interesting aspect, however, might be the future knock on effects on the Deep Utica (and other potential ultra deep prospects).
There were 3 Deep Utica wells with pressures in the 10,000 psi range and this caused a lot of (understandable) caution.
If the ‘Waynesville’ boys continue to advance and produce natty in these VERY challenging circumstances, the eventual development of the Deep Utica should be able to evolve with great efficiency.
The few Utica wells that are on the same pads as the shallower Marcellus wells have MUCH greater output.
Lots and lots of natty in the USA.
Coffeeguyzz,
The Utica wells produce more at first and then decline faster, after about 60 months the average PA (mostly Marcellus) and OH (mostly Utica/Point Pleasant) wells have similar cumulative output for 2017-2020 wells.
Dennis,
There is so much diversity in characteristics amongst these Appalachian Basin wells that it is difficult to have generalized statements be both accurate and meaningful.
Yes, the early (circa 2014/2016) Deep Utica wells had some eye popping IPs, with some – not all – then quickly fading out.
That was a big reason why all but 2 of the operators (Seneca and CNX) pulled back from further Utica development in Pennsylvania.
Seneca – originally working very marginal ground on the northwest fringe of the ‘crescent’ – declared their firm intent to drill only Utica wells as the output was more than double from the Utica versus from the Marcellus on the same pads.
In recent years, they are exclusively drilling Utica wells in Tioga county (Tier 2 rock) and are producing +10 Bcf wells in early goings as a rule.
CNX offers the best perspective on Utica/Point Pleasant versus the Mighty Marcellus potential as they are targeting both formations ongoing.
One pad – Bell Point – has 6 producing wells and it offers an excellent example as 3 are PP and 3 are MM.
The 3 Marcellus wells – combined online production time of 61 months – have produced 10 Bcf total.
The 3 Point Pleasant wells have been online 85 months combined with a total output of 37 Bcf.
(One PP well has flowed a steady ~39 MMcfd for almost a year. Not unusual. These numbers blow away those – admittedly excellent – Western Haynesville estimates).
Thanks Gerry,
USGS estimate from 2010 (nothing newer available from USGS) has about 27 TCF of undiscovered natural gas resources in the Anadarko Basin as of Jan 2011, with a mean estimate of about 25 TCF being shale gas and the rest conventional natural gas.
https://pubs.usgs.gov/fs/2011/3003/pdf/FS11-3003.pdf
In my view there is less natural gas than many believe that can be extracted profitably. My guess is about 590 TCF remains to be produced of a URR of 890 TCF for shale gas. I expect the peak in output will be in late 2028 or early 2029 at about 99 BCF/d with cumulative output at about 445 TCF.
I wonder how similar the DU and Waynesville are in terms of production and cost.
Perhaps the reason why the Waynesville holds more promise is just related to transport. While field connections still need to be put in place, the general location is close to Gulf Coast pricing and demand. And long haul pipes to the coast can be done entirely within Texas.
In the App, on the other hand, you are talking about a constrained region where you basically have gas on gas competition. Only so much can get out (with the long haul pipes getting borked). So, you end up having bigger diffs to HH. That means that DU competes with Marcellus, and for now, loses.
The EUR is just not worth the well cost (for DU). There was some work to try to reduce those costs, for example with less sturdy proppant. But surprise surprise…those deeper wells kinda need ceramic proppant.
I don’t think the Waynesville is home free yet. Like anything it’s a risk. We’ll see if they can get the production to cost ratio favorable or not. At least it’s a resource for the future and a promising example of exploration.
Comstock got a lot of land at very low leasing cost. We will just have to wait and see if the farmers sold off too cheap. Or if it’s goat pasture.
West Haynesville is like an entire separate play, Dennis. It’s literally not even on the map of the entire Haynesville that Patzek drew. (Not his fault, it wasn’t being developed yet.)
It’s not the west part of the existing (what Comstock call “legacy”) Haynesville. But several counties over and with a gap in between. Maybe think of MT and ND Bakken as examples.
See: https://csv-storage.forexpros.com/slides/c0a8cb4e69814a4d35084dbbb02ac7c81abf181fccf907b8edeb49d357374e3b.png
It is WAY far away. (The blue in lower left of picture.)
Nony,
Yes I see that.
You are full of it, Dennis. Breakeven for drilling wells was the question. Cost of the well versus expected returns, at different price points. Land cost is sunk*, and varies by operator anyways. Should we have a different breakeven, for the exact same project, with different owners, based on the history of what lease or M&A costs were? No…it is SUNK.
*With the exception of a very tiny amount of new leasing.
https://bsky.app/profile/beachmagoo.bsky.social/post/3lok4oeqqf22v
risk of becoming stranded assets due to high production costs.
Nony,
The question is how we define breakeven, to maximize profits a point forward estimate is used, to evaluate a business a full cycle analysis is best in my view. A lot of poor decisions have been made in the tight oil business, point forward estimates hide this fact.
Surely this is all about short-term vs long term. It’s well known that supply elasticity (like demand elasticity) is different in the short-term vs long-term.
In the short-term you continue to operate more or less as usual (with modest tweaks if the price drop is small, with more aggressive adjustments as described by Mike S if the price drop is large), with the knowledge that prices vary unpredictably (if you could predict prices you could make all the money you wanted with derivatives!). If low prices continue to be too low for the long-term you get out of the business, in part or in all.
Paul
Not sure of the source for the Canadian data. Attached is a table that shows the operating costs posted by Suncor last night in their Q1-25 report. The $ are Cdn so multiply by 0.725 to convert to US. Realize Cdn companies collect US$ and pay Cdn wages which may be lower than those in the US.
First Quarter Highlights
• Generated over $3.0 billion in adjusted funds from operations(1) and $1.9 billion in free funds flow(1)
• Returned $1.5 billion to shareholders, with $750 million in share repurchases and $705 million in dividends.
Not sure how these numbers change with WTI at $58/b.
https://www.suncor.com/-/media/project/suncor/files/investor-centre/quarterly-reports-2025/2025-q1-suncor-energy-quarterly-report-en.pdf?modified=20250506205438&created=20250505143316
Ovi,
For non-upgraded bitumen the cost for OPEX, royalties, and transport was $32.53/b in US $. On Oil Price dot com they have central Alberta oil price at $49.92, the question is what would the cost be when capital investment is included, I imagine it would be more than $17.38/b. As a point of reference the average Permian well has a capital cost of $25.54/b on a point forward basis and about $30.41/b when looking at full cycle capital cost. It seems capital spending for Fort Hills in 2025Q1 was about $23/bo so if that is added to other expenses we get $55.59/b in US $ so that would be a loss of $5.67/b at recent central Alberta prices for non-upgraded Bitumen.
Dennis
Thanks. Analyzing Oil sands operation are tricky because a lot of the capital costs were spent in the 1980s through 1990s. Fort hills was completed in 2018 and possibly started building in the early 2010s. It was a joint venture between SU, Teck, open pit mining expert, and Total. As the project got going costs started to escalate, Trudeau, very anti oil-sands, was elected and CC started becoming a bigger issue. So eventually both Teck and Total sold their investment in Fort Hills to SU at a discount.
So I have to wonder if they just ignore the Capex for Fort Hills or it may be buried in their interest payments. Their current long term debt is $9.3B. The other question is what is important to the company today. It probably is their operating expenses, income and meeting their debt commitments
“Teck Resources announced the sale of its 21.3% stake in Fort Hills to Suncor Energy for $1 billion in cash. The sale amounts to about 40,000 bbl/day of gross production.” October 2022.
The capital costs for Fort Hills was $17B Cdn and the mine has an expected life time of 50 yrs. The name plate capacity is 194 kb/d but its average daily rate is closer to 175 kb/d.
So I have to wonder if SU just ignores the Capex for Fort Hills or it may be buried in their interest payments. Their current long term debt is $9.3B. The other question is what is important to the company today to survive. It’s probably their operating expenses, income and meeting their debt commitments.
I think starting up a project to day is different than looking back.
Let’s check capex for Fort Hills. Assume 20 yrs, even though it has a line time of 50 years. Using 150 kb/d, $17B capex and 20 years gives a capex of $15.52 per barrel. This is pretty simple. Not sure if it requires some type of discounted cash flow analysis.
So for SU, the operating expense of $33.85/b is too high and I think they want to get it below $30. Similar for Syncrude. Not sure what part of their oil sands operation has an opex of $27.80.
Canadian Natural resources announced today that their oil sands operation have an opex of $22/b, which I think still bugs SU. However the new CEO of SU has done a wonderful job of reducing expenses. For instance they are shifting over to driverless trucks to deliver the raw bitumen containing oil sands.
Ovi,
One thing to keep in mind is that there is ongoing maintenance of the mine which gets classified as CAPEX, but should really be considered part of OPEX, probably about $5.65/b in 2025Q1 for Fort Hills. So about $37/b cost, plus 15.5/b for initial CAPEX or a total of $52/b for full cost.
Dennis
Theoretically you may be right that you need to add some capital costs but practically, I don’t think you are. Those type of discounted cash flow calculations are done at the front end of a project to see if it’s viable. Oil Sands $17B projects are different than 6 month tight oil wells. In both cases one wants to know how long to recover the investment. For Oil sands recovery time is roughly 20 to 25 years. For tight oil, maybe 2 to 3 years. Quite a difference.
Once the sunk costs are spent, a company just puts all additional yearly expenditures into OPEX because assigning it to capex has tax implications with regard to depreciation in oil sands projects. At the front end a company can start to use depreciation to reduce taxes.
Once an oil sands project is built, the only thing that counts is ongoing operating expenses and ability to pay debt on time.
Suncor is starting to replace Coker drums that were originally installed 60 years ago and were written off over many years. They are replacing one this quarter and I doubt that they would declare it capex.
Suncor’s current problem is that their operating costs at Fort Hill are higher than projected at the front end. They were planning on less than $30/b.
“The Fort Hills project will add 85,000 to 100,000 bbl/d to Suncor’s bottom line as the second train is brought into stable production and an expected utilization of 90%. The higher production rate is anticipated to reduce cash operating costs by about 40%, to between $23 and $27 per barrel.”
https://www.canadianminingjournal.com/news/suncor-looks-to-2022-as-fort-hills-ramps-up/
https://www.cbc.ca/news/canada/edmonton/3-month-outage-begins-at-fort-mcmurray-upgrader-as-aging-coke-drums-replaced-1.7528962#:~:text=Oilsands giant Suncor in the,upgrader’s life by 30 years.
Ovi,
Look at page 19 of the quarterly report where capital spending is displayed. Read the notes (including footnotes) below the table. OPEX covers regular timed operating expenses, such as bills paid monthly for electricity, diesel, chemicals, etc. Upgrades and maintenance that are done from time to time at irregular intervals are part of capital spending as seen on page 19 of the 2025Q1 Report.
Dennis
Good catch. I was taking the perspective that SU hasn’t had to go into the market and issue bonds to cover capex costs like a company has to do when starting up. They have been able to cover capex out of their cash flow. Their long term debt did not change from Q4-24 to Q1-25.
Permian scenario that assumes rig counts fall due to low oil prices as forecast by May STEO. The slight increase in Permian output in 2025 will be offset by falling output in the rest of the US. I expect US C plus C output will be flat or decline slightly in 2025. CTMA=centered twelve month average. From Dec 2024 to Dec 2025 the Permian tight oil CTMA increases by 35 kb/d from 5958 kb/d to 5993 kb/d for this scenario.
Using the Permian scenario above (URR=37.5 Gb) the shale gas output for the Permian would have a URR of 188 TCF vs 218 TCF for an earlier scenario I did for shale gas. So for total US shale gas URR there would be a decrease to 860 TCF from my earlier estimate of 890 TCF, the new shale gas peak is 96.63 BCF/d in February 2029 for this scenario.
While true there is a lot of natural gas remaining, by my estimate about 540 TCF of shale gas as of April 2025, it is not unlimited and cumulative production will reach 50% of URR by July 2028 for my scenario with the peak output reached 7 months later. This is likely to be a problem for LNG producers unless US demand for natural gas or pipeline exports decrease over the next 4 years.
D C,
I think evidence continues to grow that LNG exporters will have ample supply for the reasonable future. See the link for Comstock’s recent update on the W. Haynesvile/Bossier. A 41,000 MCF/D well. in particular, note the statement “24.4 miles away from the closest producing Western Haynesville well”. This is a big step out and confirms a ton of acreage.
https://investors.comstockresources.com/news-releases/news-release-details/comstock-resources-inc-reports-first-quarter-2025-financial-and
Since its last operational update in February, Comstock has turned fourteen (11.3 net) operated Haynesville/Bossier shale wells to sales. These wells had initial production rates that averaged 25 MMcf per day. The completed lateral length of these wells averaged 12,220 feet. Included in the wells turned to sales was our first Western Haynesville well drilled in Freestone county, the Olajuwon Pickens #1, which had a 10,306 foot completed lateral. This well is 24.4 miles away from the closest producing Western Haynesville well and represents a major milestone in Comstock’s progress in delineating its Western Haynesville acreage. The Olajuwon Pickens #1 was turned to sales at an initial production rate of 41 MMcf per day.
Gungagalonga,
Comstock lost 40 cents per share in the first quarter ($121 million). Perhaps this will be a large resource, time will tell. Note that this area is included in the USGS assessment from 2016
https://pubs.usgs.gov/fs/2017/3016/fs20173016.pdf
The mean undiscovered TRR of the peripheral shale continuous (shale) gas assessment unit (AU) is about 45 TCF, but note there is both a West and East area, not clear if the Western area would be perhaps 23 TCF, the conventional West Shelf has a mean TRR of 0.6 TCF. This is all included in my shale gas estimate, in any case time will tell.
D C,
Couple of comments…
-Why reference Comstock losing 40 cents a share in the first quarter? Meaningless.
-Why reference a government 2016 USGS assessment. It is also meaningless now due to its age. Clearly it missed the potential of the deep Western Bossier and Haynesville.
-There are two benches starting to confirm in this play. A Haynesville and a Bossier. So far both showing high IP and shallow settled in declines.
-Why do you hate shale production success so much? It’s pretty amazing what the US O&G industry has and can do. Why not send them a little nod of respect. Getting gas flowing at this depth and heat is better than I could ever do. Stunning accomplishment.
Gungagalonga,
I do not hate shale gas, the USGS assessment may need to be revised, or not we will see.
The first Permian Basin continuous assessment (Midland Wolfcamp) was from 2016, methodology used was similar (that assessment was very optimistic, this may be true of the Haynesville and Bossier assessments). There is a separate Bossier assessment from 2017 that adds another 100 TCF, cumulative production and reserves from both formations was about 30 TCF at the end of 2016 so mean TRR about 333 TCF. Some of this resource will likely not be profitable to produce (my guess is that only 60% of the assessed resource will be economic or about 200 TCF).
https://pubs.usgs.gov/of/2018/1135/ofr20181135.pdf
The point of mentioning Comstock losing money is an indication that the resource may not be profitable to produce. In 2022 when natural gas prices were high ($6.23/MCF but losses on hedges reduced the net revenue received to $4.50/MCF) annual net income was $1.125 billion ($4.11 per share, diluted). With high prices they may be ok in 2025 and 2026. At the end of 2024 they had about 3.8 TCF of proved reserves with about 2.7 TCF of proved developed producing reserves and 1 TCF of proved undeveloped reserves.
Note also that proved reserves at the end of 2022 were about 6.7 TCF, so lower NG prices may have reduced proved reserves (NG price was $6.03/MCF in 2022 and $1.84/MCF in 2024). About 1.05 TCF of natural gas was produced by Comstock in 2023 and 2024 which would have reduced proved reserves reported at the end of 2022 to about 5.65 TCF by end of 2024 (with no revisions), so proved reserves were revised lower by 1.85 TCF from end of 2022 to end of 2024 (about a 48% change).
In 2024 Comstock lost $230 million and in 2023 they earned $211 million, the net loss over both years was $19 million, natural gas revenue was $2.37/MCF (including hedges) in 2024 and $2.55/MCF in 2023 (including hedges).
Interesting piece on simultaneous fracking in the US
https://www.eia.gov/todayinenergy/detail.php?id=65224
You should decide ahead of time, what question you are answering and how you are doing your analysis. If you think land should be part of the GOING FORWARD DRILLING DECISON (“breakeven oil pricing for new well drilling”) than go and defend it. Ahead of time!
You’ll be wrong. But at least you won’t be dancing and trying to equivocate. Don’t do some after the fact “maybe, maybe not” wiffle-waffle. That is clearly just you trying not to admit you made a mistake.
You should have had alarm bells going off when you read that Mike was including PAST land acquisition costs in his $12MM. You should have cavitated when you heard that the vast majority of “industry” do not include sunk costs in the going forward drilling decision.
This is EXACTLY my concern when you back yourself up based on “talking to people in industry”. And it’s the “usual suspects”. And you don’t even have enough Dunning Kruger to realize you need to educate yourself by talking to other people also!
IF we are talking INFILL DRILLING in the PERMIAN, then the leases (and M&A!) are sins of the past.
No ESS, a lot of value has been wasted. But that’s NOT the question. The question is breakeven to drill new wells. And for that, the land is sunk, sunk, sunkitty, sunk-sunk.
IF you want to do a retrospective evaluation of management, “did they do some dumb leasing”, then do that. But it sure as heck is NOT the same thing as breakeven for new drilling. It’s a RETROSPECTIVE evaluation. Retrospective…SUNK. DUH!
Oh…and for what it’s worth, a lot of value has been captured also. Look at EOG doing stealth leasing in Mountrail County before the ND Bakken had turned on. You make your bets and you takes your risks. If you pay too much, than the minerals owner gets a value transfer from the operator. If you stealth buy and get land on the cheaps, then you capture value. And everyone (including the mineral owners) knows this dynamic of the oil and gas business!
Nony,
I believe it is well known that there are two ways to look at this, point forward and full cycle. For point forward the CAPEX is about $10.5 million (Permian average) and for full cycle about $12.5 million.
Using the point forward analysis you prefer, for the average Permian well with a discount rate of 6%, wellhead oil price of $63/bo, NGL at 30% of crude price, and Natural Gas at $1/MCF (note that Permian Resources got less than this for Natural Gas in 2024) the discounted net revenue over the life of the well is $9.96 million and the well pays out at 103 months (net revenue equal to $10.5 million with no discount). The well produces 410 kbo, 156 kb NGL and 1.88 BCF over 149 months at which point it is shut in. Undiscounted net revenue over the life of the well is $10.8 million, so about 300k of profit on a $10.5 million investment over 12.4 years for an average annual rate of return of 0.22%.
Note that this break even estimate is in line with estimates in a recent Dallas Fed Survey for breakeven prices for tight oil producers. These investments are high risk and would require a higher return for a rational investor in my opinion.
One can try to answer more than one question when looking at a problem, what price would just cover forward costs (what you would call breakeven) and what price would cover full well costs (including land which an industry veteran with 50 years owning his own private oil company would consider breakeven). To me the full cycle analysis seems more useful for evaluating a business, YMMV.
The broader discussion regarding shale oil and gas has to do with the key point that Shellman makes over and over: Why in the world has the TRRC (and similar commissions) turned its back on its most important functions? There is a TRRC rule regarding the acceptable duration of venting and flaring methane gas, another rule about spacing (~1200 feet), and yet another regarding the absolute necessity of preserving reservoir pressure and being a steward of the environment. Had these rules been fulfilled–followed to the letter–there would be very little of the damage we’re seeing. Consider the almost unfathomable concept that we’re reduced to breaking open shale rock two miles down (and now three miles in the Bossier and Haynesville formations in Leon & Robertson counties Texas) in order to exploit an energy source that is a one-off, at a recovery rate that is laughable, and selling it off at bargain-basement prices. The insanity of this moment in history is likely going to bite us in the ass at some later point. And yes, we should use our real names if we’re to be taken seriously: it steadies the mind.
Thank Gerry,
Agree in full.
before WWII, Los Angeles basin produced 25% of global crude, sure it has depleted, or now more expensive and polluting to produce. But the legacy lives on, it helped US hedgemony in modern navy over the pacific and the world and win the WWII, and industrialization of US and particularly the development of west coast. If we just left the resources in LA basin till now to drill, the effect would not be better off for US or Los Angeles/West Coast. Sure, there are still complaints of pollution and Southern California, yet this area is the most developed and environmentally strict on oil development, most of the Palisade fire touched area were mingled with oil wells 100 years ago.
The 8% laughable recovery means there is still potential for another round of technology improvements, and leaving resources in the ground is not like you save them in a bank or buy bitcoin hoping peak will come to flip the crude into gold.
Now, if US did not become FF dominance with shale gas and oil, then the Ukrain war would have been different; China could not use the “green” energy dominance to threaten US, only countries want to depend on “green”.
In China, when “green” wash funded by USAID at its peak, most people working in the oil industry say the same “we are killing the future of our kids”. Although it is totally different in US oil industry, but the US public has long adopted and helped the extreme. Yet, the Chinese government did not bow to these extremists, and they continue to drill, only slowed by big oil monopoly. Another funny thing about comingle of “green” and shale oil, every “Major demo shale oil field” in China have to use tons of CO2 in fracking, or EOR;while US EOR trials already used PVT phase diagram to show CO2 won’t work even for LTO, the Chinese shale oil field ignored all these, and used CO2 in heavier shale oil.
Lots of the “green” dominance in China are funded by US/West green wash. Many of the solar and wind companies got capital from US stock market and they crash and disappear just like shale oil and gas companies in US. The Chinese government yet whole heartedly support them, letting them build large coal-firing power plant to product silicon. It all helped the industrialization in China though, and like Deng Xiaoping put it — “we have to solve problems by development”.
Gerry, this started as a discussion on the future of the LNG export industry. D C feels the LNG exporters will suffer in the future due to not enough NG to export beacause the resource is not there. I disagree with this, for the reasonable future, due to the amazing work our domestic E&P industry has done to increase current and future production. I agree with Coffeeguyzz that we are blessed with immense current and growing sources of NG is the Lower 48. Innovation is not in D C’s models.
Now if you and D C have issue with capitalism at work developing a natural resource, then so be it. My opinion is… developing the Waynseville is a prime example of free markets at work. I assume your crystal ball that tells you this is an “insanity moment” will also tell you when, exactly, it is appropriate to turn the valve on and release gas? It is so easy to be critical of a scenario when you know all the answers, right?
As for using “real” names…. Don’t read my rare posts if you don’t want to. My mind is very steady. Using a nom de plum is a time honored tradition. Not sure why you have a problem with it, but it’s your problem to have. How do we know which Gerry Maddoux you are? Did you provide a personal address and phone number? Using common names without backup is the same as using a fun handle. Don’t take it too seriously.
Apologies if you provided your personal info before I started reading POB. Not trying to be insulting, just having a discussion on LNG.
To above, I am not opposed to drilling to hell and back for gas. Google “Parker Drilling Rig #114” which was built in the sixties and drilled the Bertha Rogers in the seventies. That well was near Burns Flat, just north of where I grew up. It went down to 31,000+ feet and wound up hitting molten sulfur which caused the drill stem to twist off and the bottom hole assembly was lost but nobody died. They were silly enough to put up a sign in Elk City claiming to be the “Deep Gas Capital of the World.” There for a while, in the seventies and eighties, it was. Many of those very deep wells, a lot of them drilled by Chesapeake under the tutelage of Tom Ward and the late Audrey McClendon, are still producing fairly well. So no, I wouldn’t put me down as an opponent of deep drilling.
But there’s another thing. When the Granite Wash field was developed, there were derricks everywhere and the pressures and fear gauges were high. I don’t know the average but they hit a high-pressure zone on the Bertha Rogers well somewhere in the neighborhood of 25,000 psi–and that was more than four decades ago, so consider the danger. The temptation must have been strong to use narrow spacings when they found a sweet spot, yet they didn’t. And they didn’t wreck the countryside. It doesn’t look the same, but it’s not awful either. In short, they didn’t ruin the place for human cohabitation.
I grew up with a respect for oil and gas, being taught that it was made only once. I worked on a derrick when I was fifteen–only as a hand but I was a hard-worker and earned the respect of the crew, from the driller on down. I have never lost sight of the fact that it’s dangerous drilling for oil and gas. Back then we saw maiming and death, and the local gentry grieved right along with the oilfield. On the other hand, I also remember how important it was to the oil companies to leave the land they way they found it. A horse wandered out into a slush pit one night and got stuck. The crew that could get loose joined ranchers and farmers in trying to rescue that horse.
My reasons for commenting about these violations of the TRRC are both selfish and from a sense of responsibility. Long after the oil and gas is gone, people–real people–are going to be living in west Texas and other shale basins, trying to raise families and make a living. Let’s take the Permian, bc it’s the giant. Currently, so much produced water is being instilled down over-pressured SWD wells that it’s coming up long-forgotten well bores and also causing earthquakes. Currently, because of twice as close spacing as the rules allow, not only has the reservoir pressure been lost but the price of NG and oil have been harmed. I make my living from oil and gas, some conventional, some unconventional, some minerals and some working interest. Selfishly, I hate to sell product into a bad market, but unselfishly, I also understand just how damned important it is to the defense of our country. Right now, do you know how long the 25-million souls on Taiwan could survive without electricity from fossil fuel sources brought in? About two weeks, they say. Think about that, the greatest chip-maker in the world, they say, and their existential weak spot is . . . energy. Think they can fight off the Chinese Communist Party using wind and solar power? Eventually, they will get a great number of SMR’s (nuclear), but for the time being, their survival—-and therefore probably our survival in the AI race here in the USA—-hinges on LNG.
As edification regarding spacing distances, I have had financial interests in enough parent wells to see how they do when not sapped by too-close competitors. I have a small stake in one old well that was drilled nine years ago. It was a good well but for some reason, there have been no others yet. That old well wasn’t fracked very fancy but the decline curve isn’t anywhere near as parabolic as those with near spacings. In fact, my cut is not that far from what I was getting many years ago. Wider spacings: less fresh water needed for fracking, less produced water that has to be disposed of, no toxic waste pools showing up in some rancher’s pasture and ruining his way of making a living.
I actually own some minerals down there in that place that y’all are giving such a fancy name: Waynesville, for Pete’s sake, how lame can you get. I’m eighty and I’ve owned those minerals for a long time, waiting for something to happen. Back when I bought it I read about the geology. That part of the world was created by a thing called the Sabine Uplift, which created the Eaglebine, the bastard child halfway in between the Eagle Ford and the Woodbine Group, and also buried the Bossier shale down to 25,000 feet. I say more power to them down there, let ‘er rip, I’d love to share the joy from those deep suckers before I go. But there are some nice people down there too, from Madison County up to Robertson and Leon it’s really pretty grazing country, some crops. The TRRC oversees the spirit of making sure nobody ruins it forever. I hope they don’t screw it up; my heirs don’t need the money that bad.
And as far as your non de plume, or whatever you wish to call it, I could care less. I usually just read a few lines and go back to looking at the graphs. Me? I will use my real name, it’s good to be me. And whatever you read that I wrote you can be damn sure I didn’t write it to be a smartass, or to hurt someone, but merely to express my thoughts. Hope this answers your concerns regarding my inner workings.
Thanks Gerry, great stuff.
Since the demise of TOD, I´ve followed POB at least weekly. The peak has been allusive but I think we are about there, and likely even past it now. So 20 years later, we might be at the end of the curve. Nice knowing you all.
Rig Report for the Week Ending May 9
This week’s overall rig count message is steady as she goes. However change is occurring since the biggest change occurred in NM and Texas where the rig count dropped and rose by 4 respectively.
– US Hz oil rigs were unchanged at 437.
– New Mexico rigs were down 4 to 86 while Texas added 4 rigs to 232. Texas Permian was up 3 to 187.
– Of the 4 dropped rigs in New Mexico, Eddy dropped 3 and Lea 1.
– In Texas, Midland was unchanged at 23 while Martin added 2 to 27. Midland is down 5 rigs over the past 6 weeks.
– Eagle Ford was unchanged at 38.
– NG Hz rigs were unchanged at 85.
Frac Spread Report for the Week Ending May 9
The frac spread count dropped by 6 to 195. It is also down 63 from one year ago and down 20 spreads since March 28.
With total rigs flat and frac spreads down, does this imply that of the total cost to bring a well online, completing the well is the more expensive portion?
Is plugging in a fan the most expensive part of buying a fan?? Or are you just waiting for a hot day??
From OilPrice.com:
Tight Now, Loose Later: Oil Futures Flash Warning
OPEC+ is accelerating the rollback of production cuts, increasing output by 411,000 bpd in June.
Oil futures show a rare “smile” curve—immediate tight supply (backwardation) followed by expected oversupply (contango).
Analysts expect oil prices to remain subdued short term, with a slow recovery later in 2025 as U.S. output declines.
That is NOT what the EIA says will happen.
An update to Non-OPEC and World Oil Production has been posted.
https://peakoilbarrel.com/january-non-opec-and-world-oil-production-drops/
A new Open Thread Non-Petroleum has been posted.
https://peakoilbarrel.com/open-thread-non-petroleum-may-10-2025/