By Ovi
All of the Crude plus Condensate (C + C) production data, oil, for the US state charts comes from the EIAʼs Petroleum Supply monthly PSM which provides updated information up to December 2024.
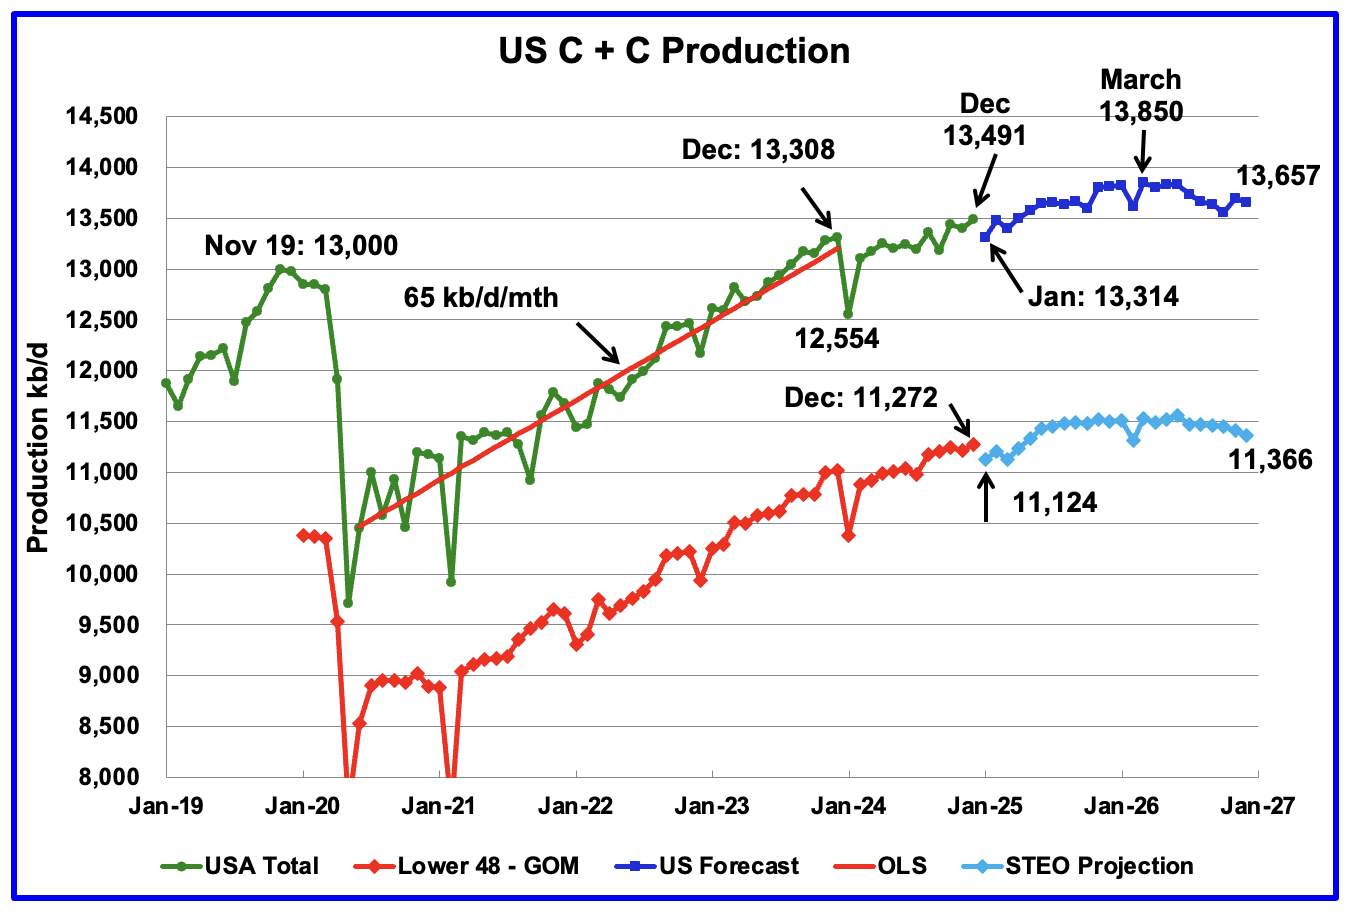
U.S. December oil production increased by 95 kb/d to 13,491 kb/d, a new all time high. It is 183 kb/d higher than December 2024. The largest increase came from the GOM, 203 kb/d. November production was revised up from last month’s 13,314 kb/d to 13,396 kb/d an increase of 82 kb/d. Production in January is expected to drop by 177 kb/d, possibly due to the drop in completions during December and January along with a drop from the GOM.
The dark blue graph, taken from the February 2025 STEO, is the forecast for U.S. oil production from January 2025 to December 2026. Output for December 2026 is expected to reach 13,657 kb/d. From December 2024 to December 2026 production is expected to grow by 166 kb/d.
The light blue graph is the STEO’s projection for output to December 2026 for the Onshore L48. December Onshore L48 production increased by 53 kb/d to 11,272 kb/d, a new high. From December 2024 to December 2026, production is expected to increase by 94 kb/d to 11,366 kb/d. December 2026 production was revised down from 11,414 kb/d by 48 kb/d from last month. Note how production is essentially flat starting in mid 2025 to mid 2026.
U.S. Oil Production Ranked by State
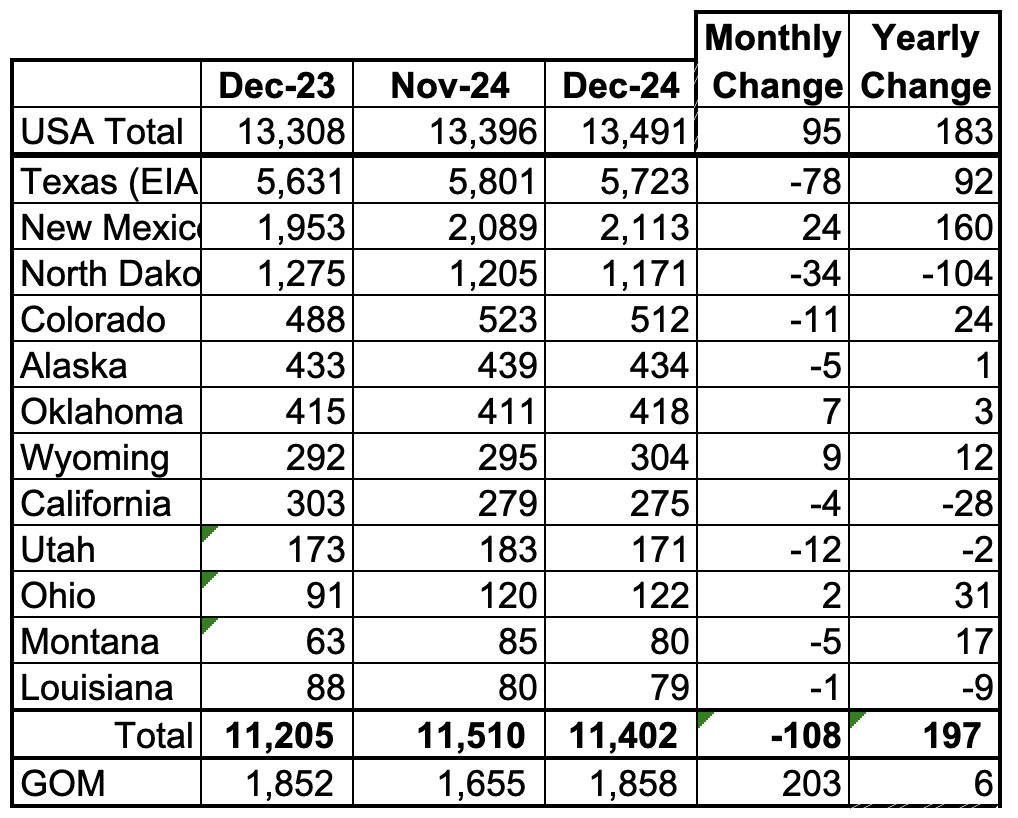
Listed above are the 12 US states with the largest oil production along with the Gulf of Mexico. Montana has been added to this table this month since its production exceeded Louisiana’s production and we wish to keep tracking Louisiana.
These 12 states accounted for 84.5% of all U.S. oil production out of a total production of 13,491 kb/d in December 2024. On a MoM basis, December oil production in these 12 states dropped by 108 kb/d. On a YoY basis, US production increased by 183 kb/d with the biggest contributor being New Mexico.
State Oil Production Charts
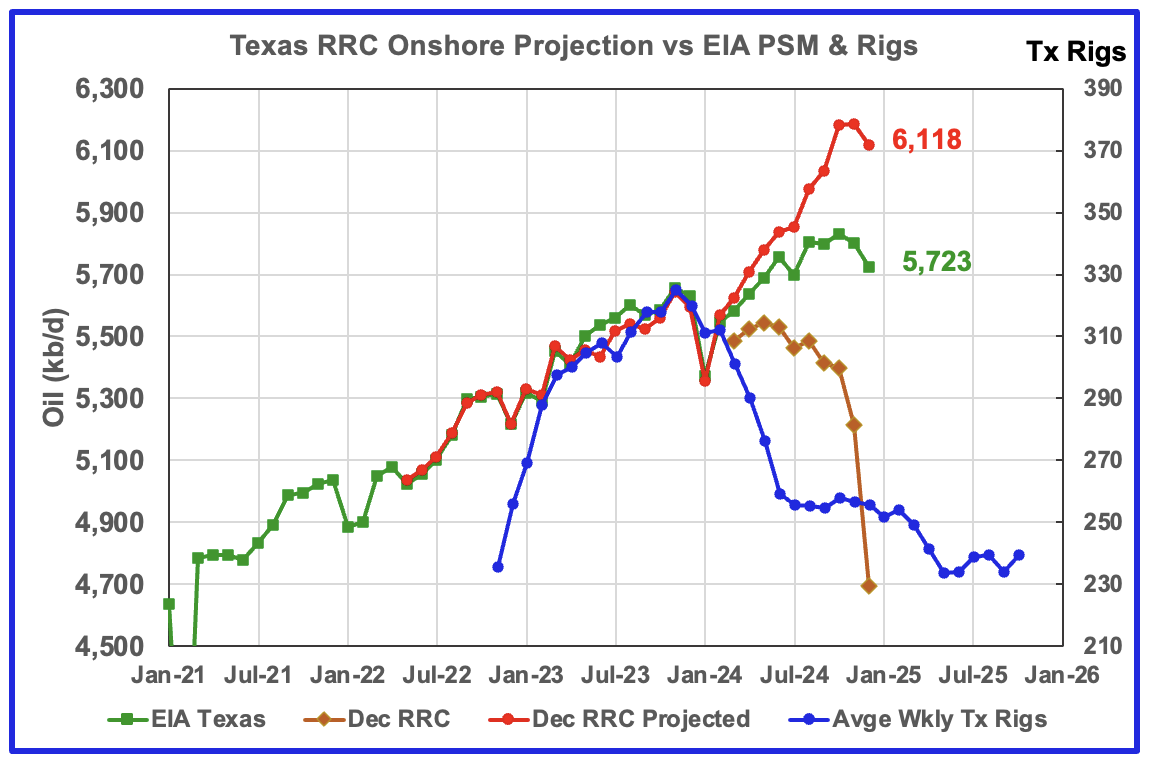
Texas production decreased by 78 kb/d in December to 5,723 kb/d. YoY production is up by 92 kb/d. Note that November production from last month was revised up by 40 kb/d from 5,761 kb/d to 5,801 kb/d.
The red graph is a production projection using November and December Texas RRC data. Due to higher than typical revisions to earlier months in the December report, the projection is too optimistic. However, note that both the projection and the EIA show production rolling over and dropping in December.
The blue graph shows the average number of weekly rigs reported for each month, shifted forward by 10 months. So the 276 rigs operating in July 2023 have been shifted forward to May 2024. From February 2024 to July 2024, the rig count dropped from 312 in time shifted February 2024 to 256 in July 2024. That drop of 56 rigs has had no impact on production up to August 2024 but December may be the first month when the rig drop impact on oil production is starting to show up.

According to the EIA, New Mexico’s December production rose by 24 kb/d to 2,113 kb/d.
The blue graph is a production projection for Lea plus Eddy counties. These two counties account for close to 99% of New Mexico’s oil production. The difference between the November and December preliminary production data provided by the New Mexico Oil Conservation Division was used to make the projection. A 1% correction was added to the Lea plus Eddy production projection to account for their approximate fraction of New Mexico’s oil production.
The projection estimates December production increased by 35 kb/d to 2,171 kb/d. The increase is related to a December production increase in Eddy and Lea counties and is discussed further down in the Permian section.
More oil production information for a few New Mexico and Texas counties is reviewed in the special Permian section further down.
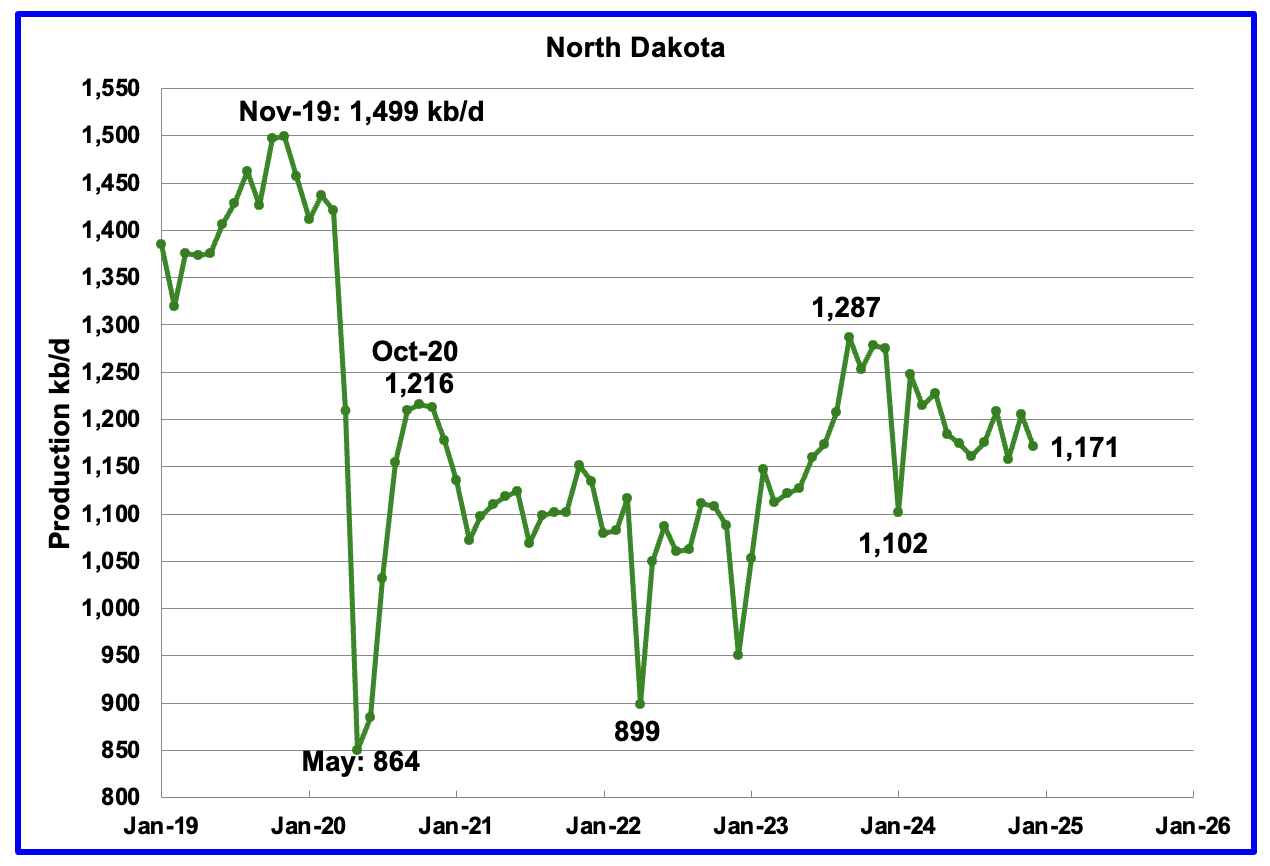
December’s output dropped by 34 kb/d to 1,171 kb/d. Production is down by 116 kb/d from the post pandemic peak of 1,287 kb/d. The North Dakota Department of Mineral resources reported December production was 1,191 kb/d.
According to this Article the Director of the North Dakota Department of Mineral Resources said “Wells waiting on completion went down slightly from November to December. December’s number was 288,” Anderson said.
He also said the number of completed wells is down from 89 in December to 78 (preliminary number) in January. He said that lower number is attributed to winter activities and potential impacts from mergers.
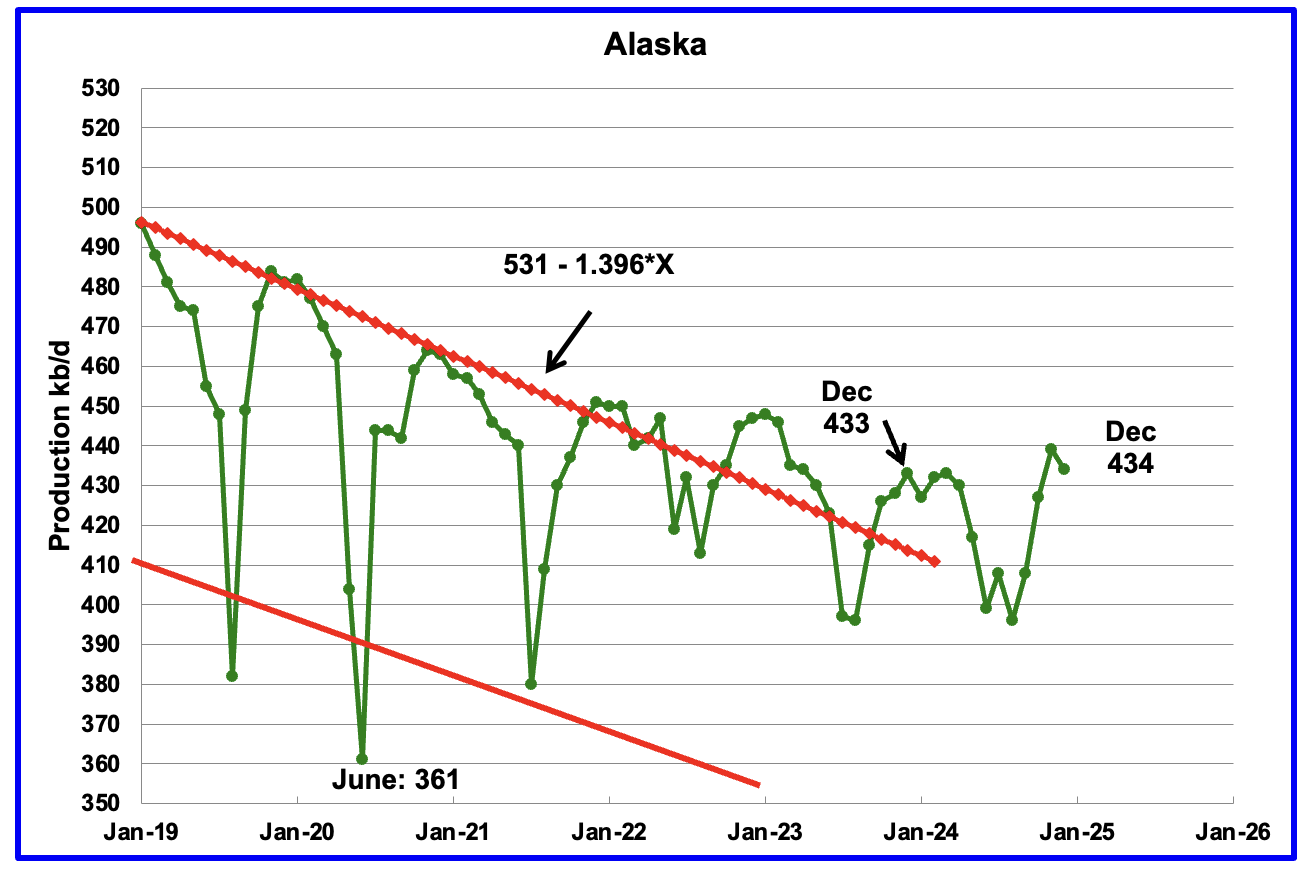
Alaskaʼs December output dropped by 5 kb/d to 434 kb/d while YoY production rose by 1 kb/d. The drop in production is an indication that production for the next few months will be on its regular plateau after summer maintenance. EIA’s average weekly December production from for Alaska is almost the same at 436 kb/d.
Alaska must have brought new fields online to consistently have YoY and monthly production gains which have broken away from the earlier dropping production trend red lines. According to this Article, First oil production begins at Nuna project in Alaska in December.
Nuna is expected to add 20,000 barrels of oil to the state’s overall oil production, at its peak production level.

Coloradoʼs December oil production decreased by 11 kb/d to 512 kb/d. Colorado began the year with 12 rigs. In December it had 7 in operation and dropped to 6 in January and February. Is the dropping rig count beginning to show up in dropping oil production?
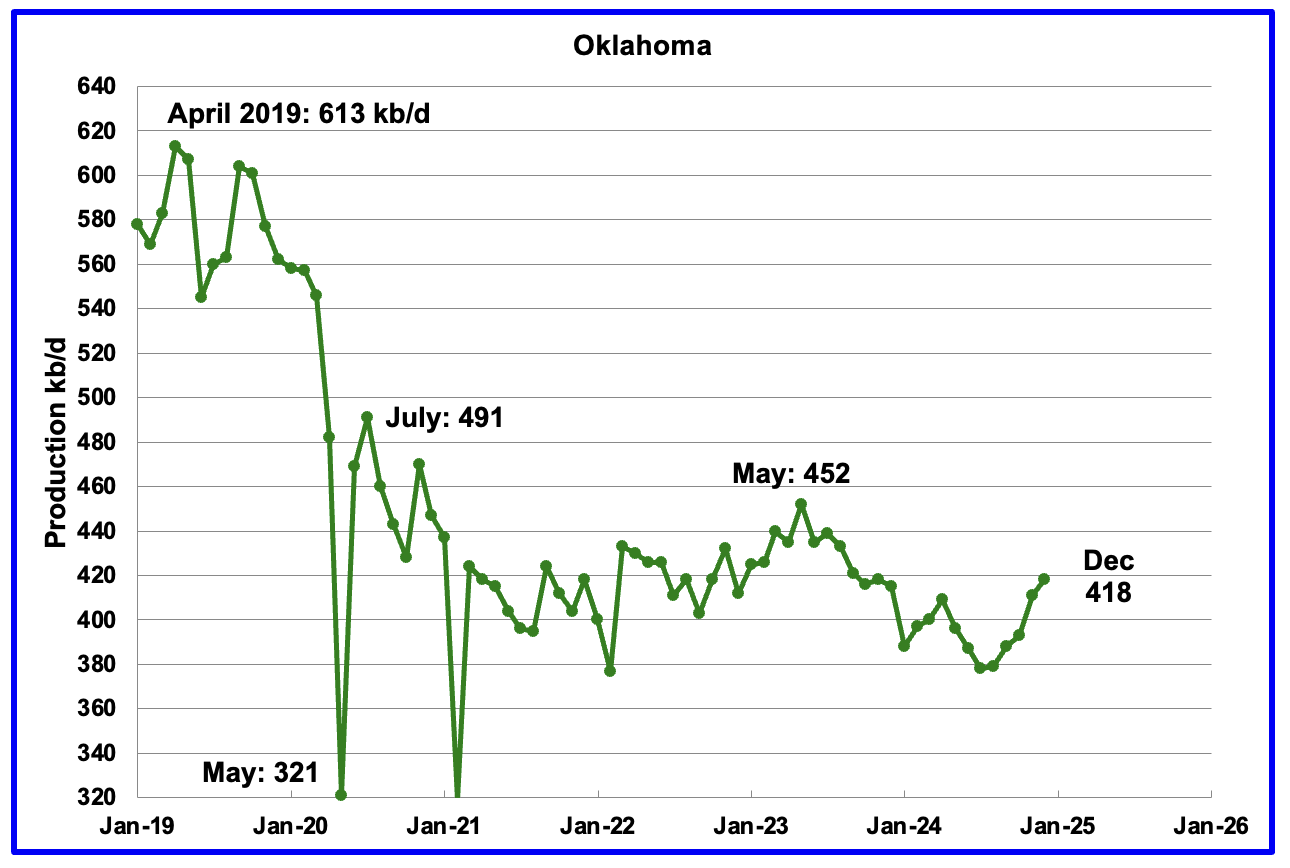
Oklahoma’s output in December rose by 7 kb/d to 418 kb/d. Production remains below the post pandemic July 2020 high of 491 kb/d and is down by 64 kb/d since May 2023. Output entered a slow declining phase in June 2023 but has now reversed and entered an increasing trend.
At the end of October 2024 there were 40 operational rigs and they have held steady at 41 ±1 from October to December. In February 4 rigs were added to bring the total to 46 in operation. Will the increase in the rig count result in increasing oil production going forward?
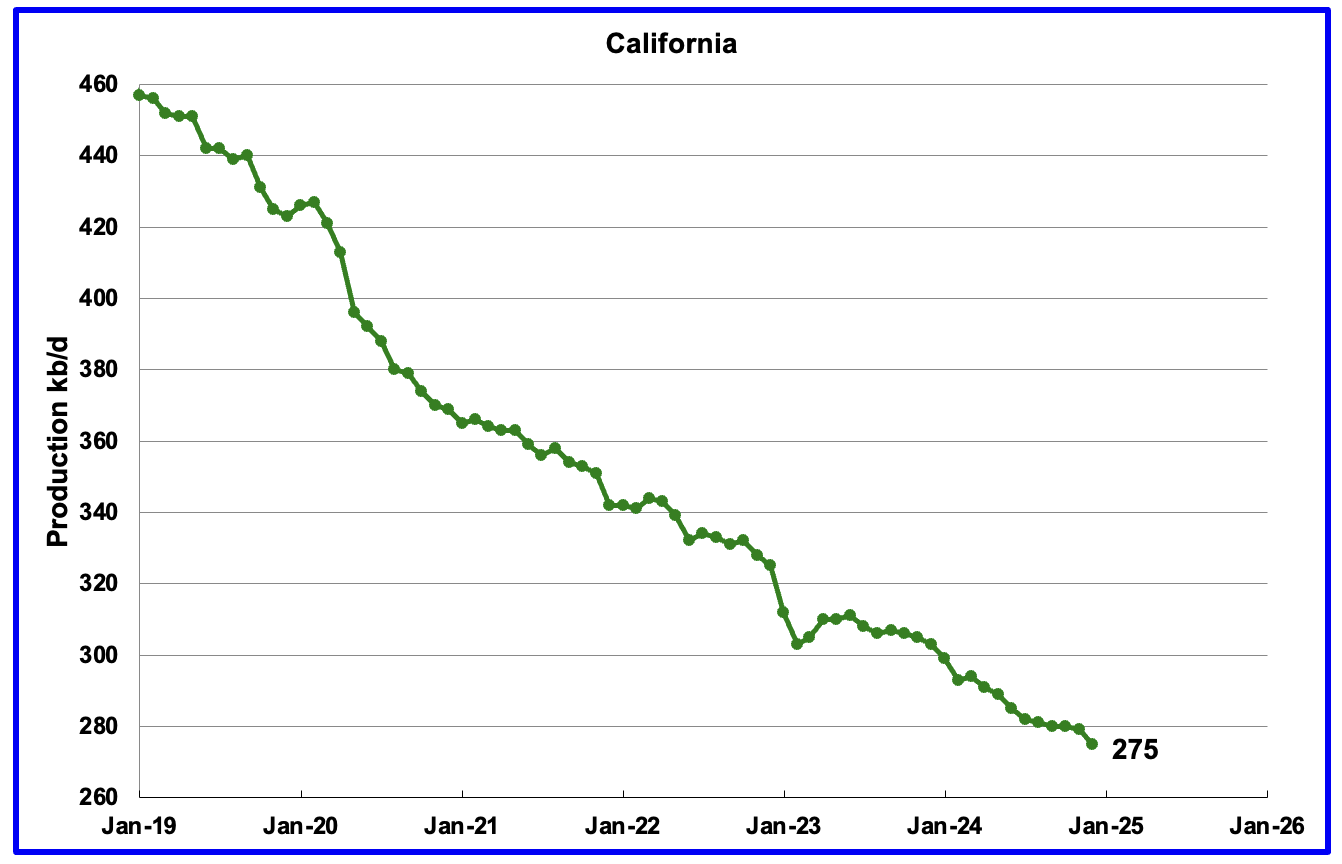
California’s declining production trend continues. December production dropped by 4 kb/d to 275 kb/d.
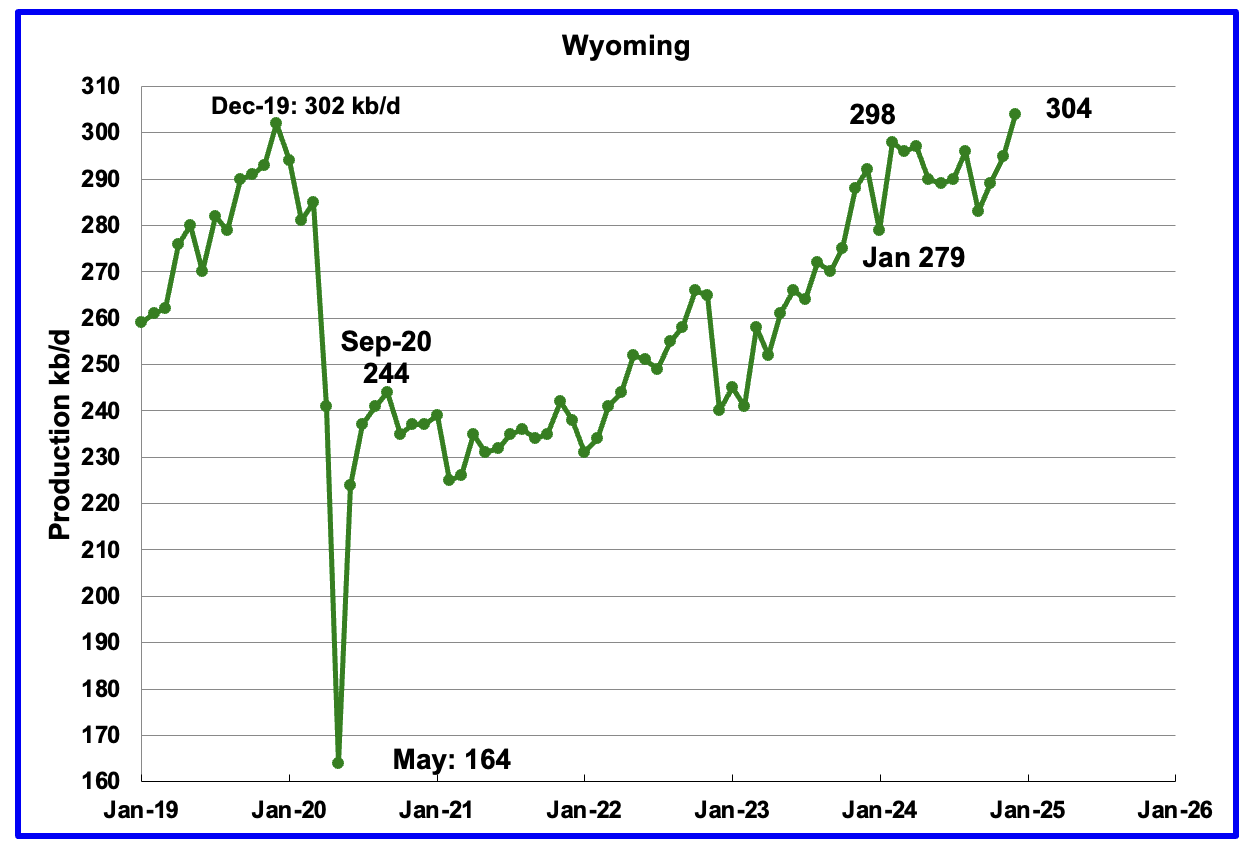
Wyoming’s oil production has been rebounding since March 2023. However the rebound was impacted by the January 2024 storm. Production peaked in February 2024 and was showing signs of being on a plateau.
However December’s production rose by 9 kb/d to 304 kb/d, a new high.
In August Wyoming had 8 operational rigs. The rig count has slowly risen to 14 from November to January and to 15 in February.
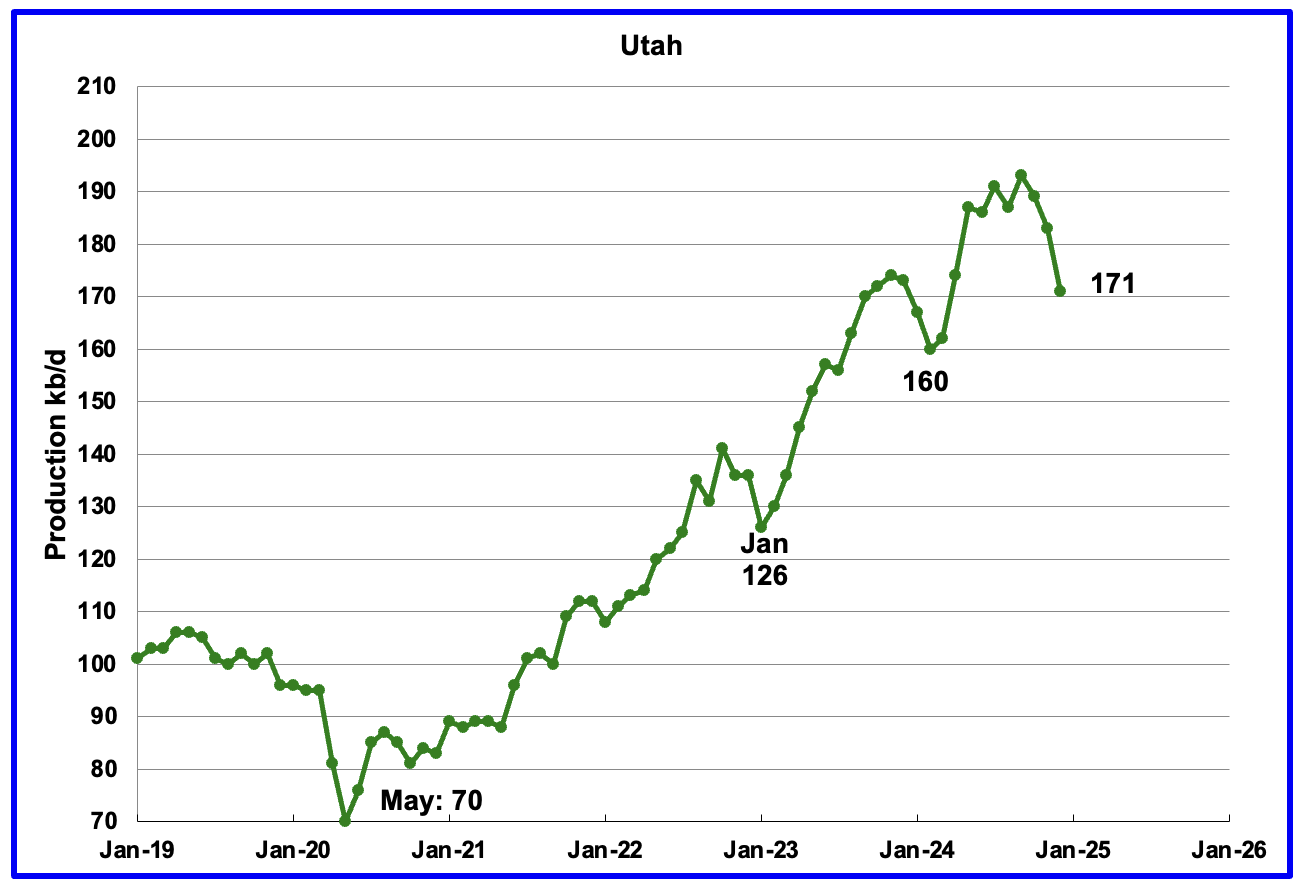
December’s production decreased by 12 kb/d to 171 kb/d. Utah had 8 rigs operating from October through February.
Did a search for December Utah oil production and the AI summary came up with this: “In January 2025, Utah’s crude oil production was 5.506 million barrels, which was down from 5.857 million barrels the previous month. Tried to find the source but was unsuccessful.
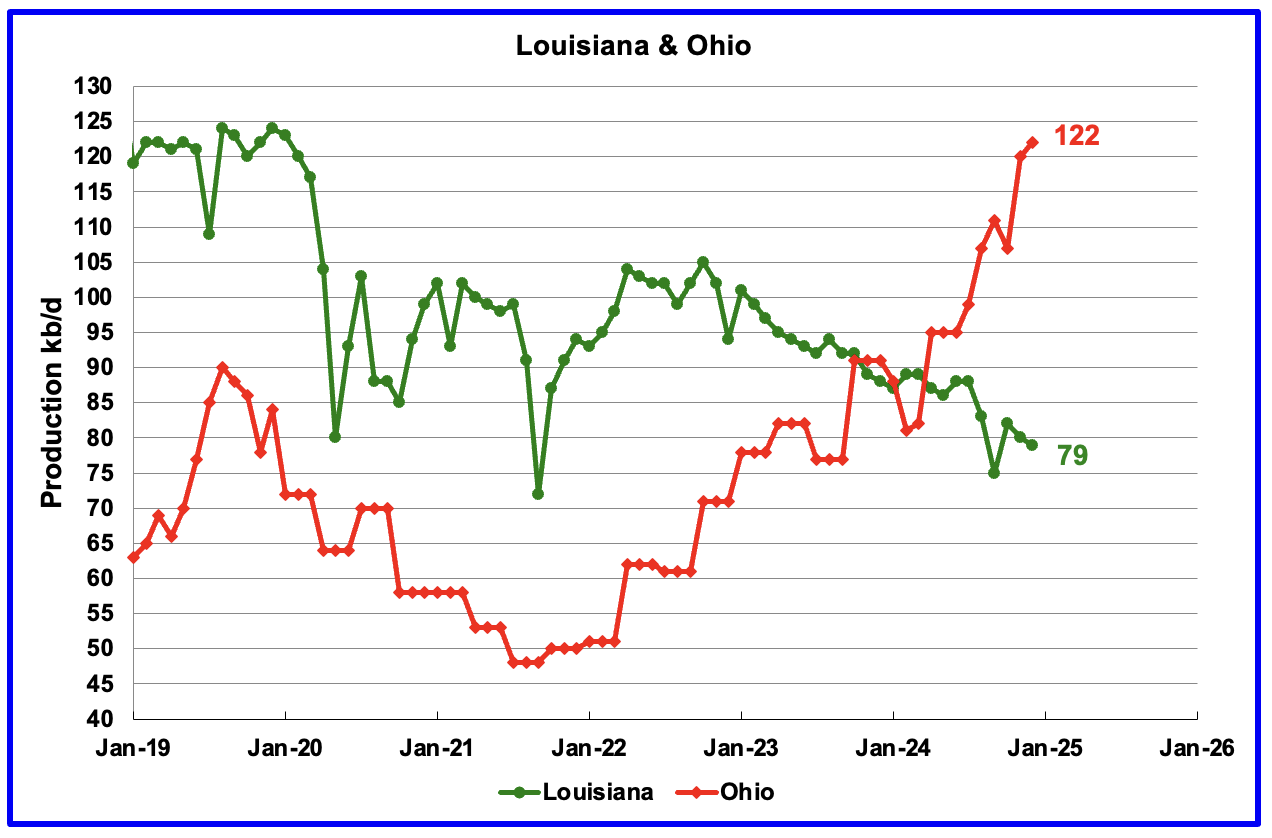
Ohio has been added to the Louisiana chart because Ohio’s production has been slowly increasing since October 2021 and passed Louisiana in November 2023.
Louisiana’s output entered a slow decline phase in October 2022 and has continued to fall in December. December’s production dropped by 1 kb/d to 79 kb/d. As of January and February, there are no oil rigs operating in Louisiana. In November 2024, one rig was operating. Anybody have any thoughts on this and can it be confirmed?
Ohio’s December oil production rose by 2 kb/d to 122 kb/d, a new record high. The most recent Baker Hughes rig report shows one horizontal oil rigs operating in Ohio in December and January and two in February.
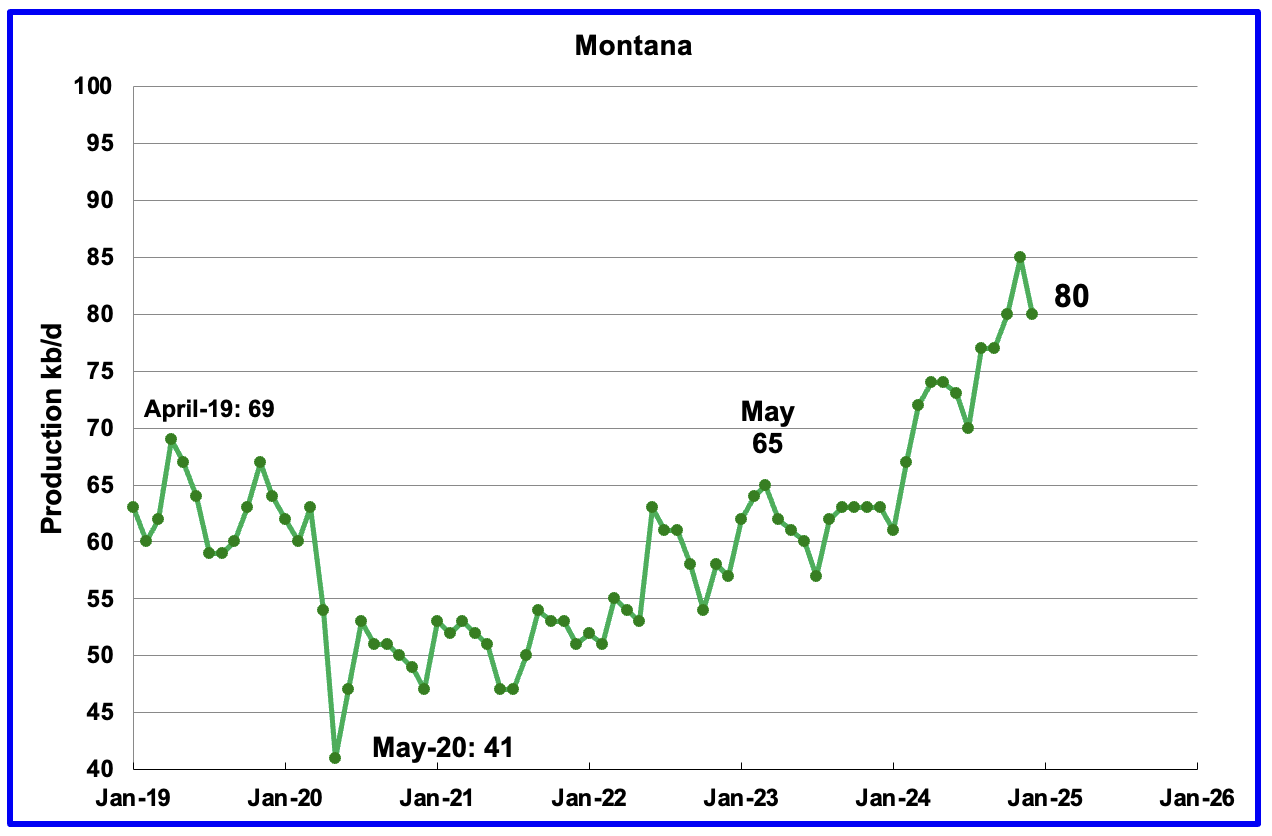
December’s oil production dropped by 5 kb/d to 80 kb/d. Montana had one oil rig operating from December through February.
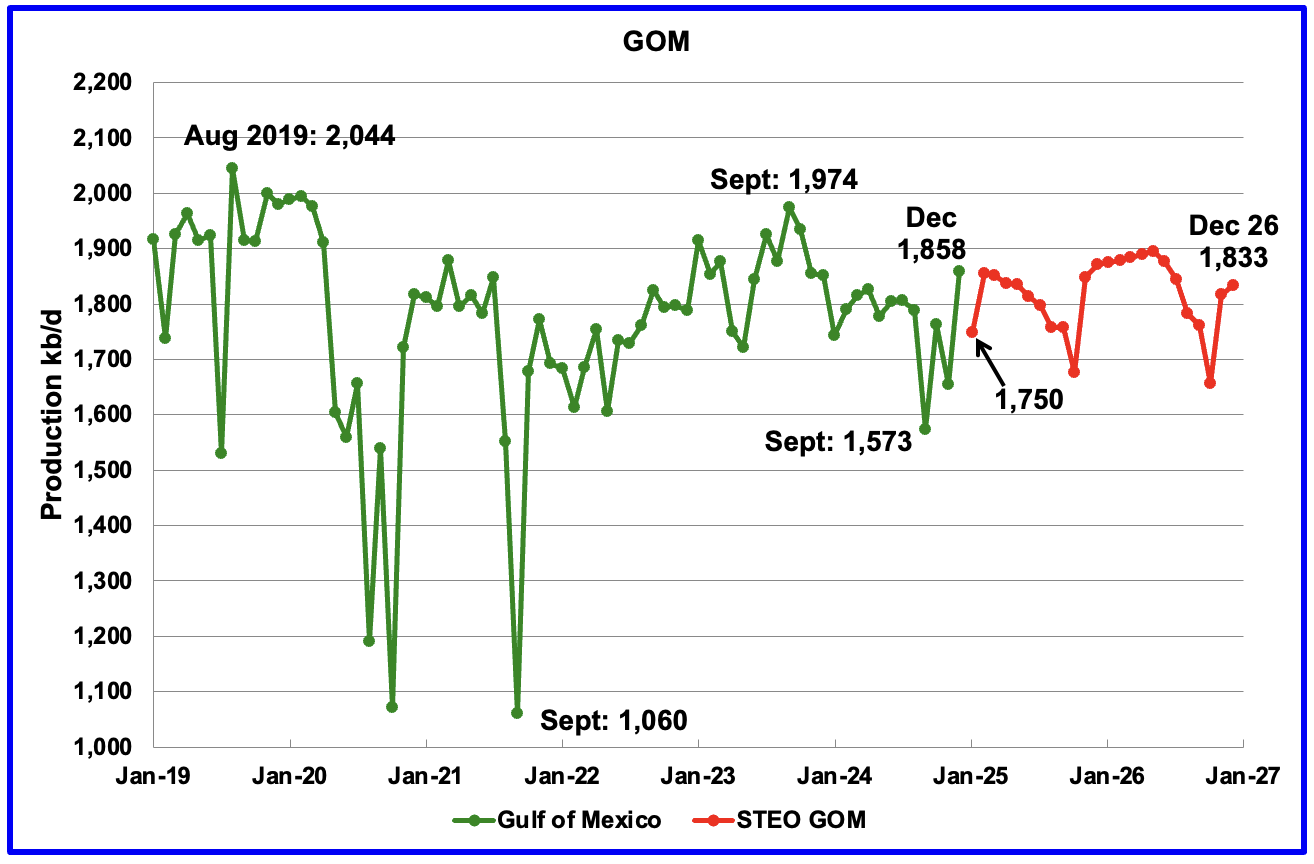
GOM production rose by 203 kb/d in December to 1,858 kb/d but is expected to drop in January to 1,750 kb/d. December’s recovery is simply continuing recovery from maintenance associated with the September Category 4 hurricane Helene.
The January 2025 STEO projection for the GOM output has been added to this chart. It projects production in December 2026 will be 25 kb/d lower than December 2024 at 1,833 kb/d.
According to the OPEC MOMR, GOM output is expected to be supported by new projects in the coming months, such as the deepwater Whale platform that started production in January.
A Different Perspective on US Oil Production
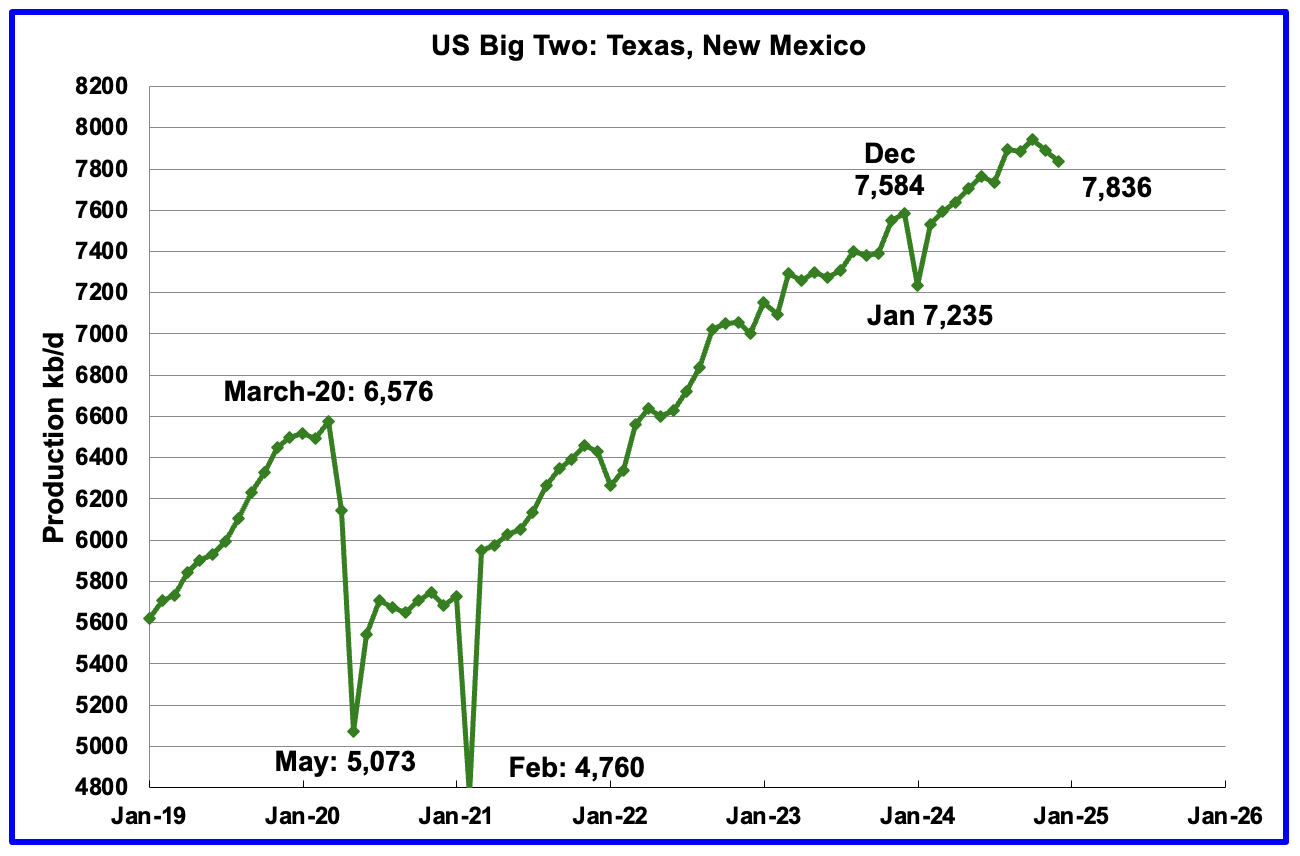
The combined oil output for the Big Two states Texas and New Mexico.
December’s production in the Big Two states decreased by a combined 54 kb/d to 7,836 kb/d and is 252 kb/d higher than December 2024. Clearly these two states are the drivers of US oil production growth on a YOY basis.
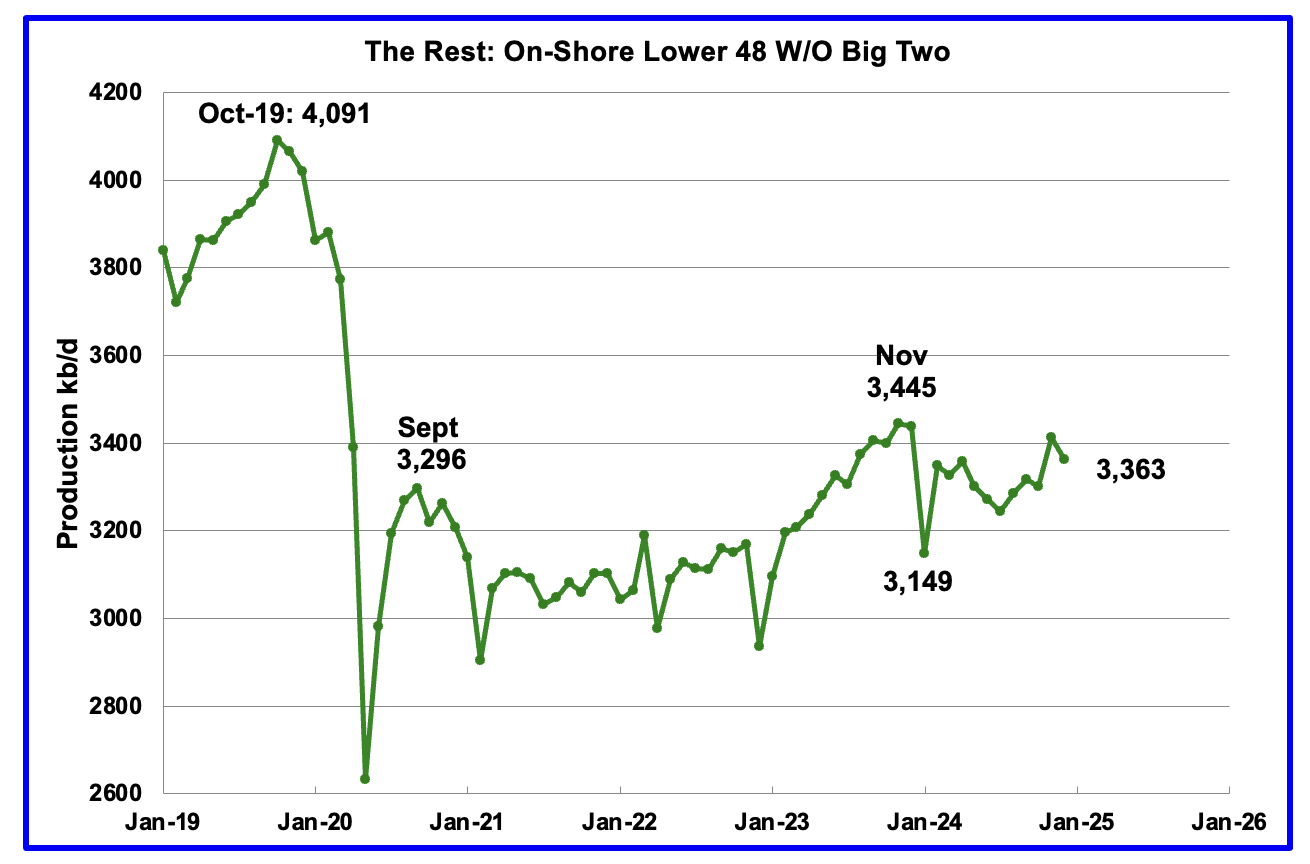
Oil production by The Rest
December’s oil production by The Rest dropped by 51 kb/d to 3,363 kb/d and is 82 kb/d lower than November 2023.
Frac Spreads
Frac Spread data is available here. Unfortunately it is difficult to use and is not fully up to date. However with a bit of work and persistence data can be extracted. The only reason this is being mentioned is that while I think the results below look fine, there could be some errors because many steps have to be taken to make the file workable and errors are possible. Nevertheless the results seem reasonable.
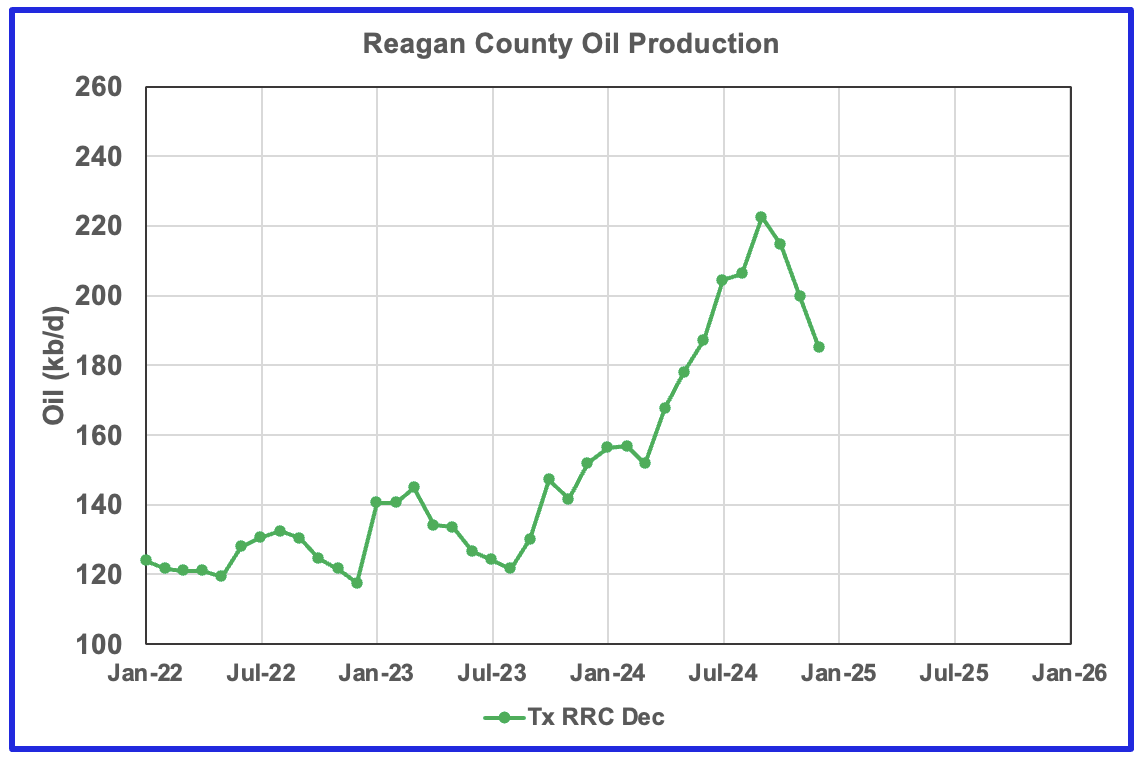
The attached table shows the distribution of Frac spreads amongst the three big States for the week ending February 7. The largest number of frac spreads are in Eddy and Lea counties. In Texas, the greatest number are in Martin, Reeves, Loving and Reagan. Note the difference in the spread count between Martin and Midland even though the rig counts are similar, shown further down. The table indicates there were eleven spreads operating in Reagan county in the week ending February 7. Reagan county oil production has not been tracked recently but will be going forward.

Permian Basin Report for Main Counties and Districts
This special monthly Permian section was recently added to the US report because of a range of views on whether Permian production will continue to grow or will peak over the next year or two. The issue was brought into focus recently by two Goehring and Rozencwajg Report and Report2 which indicated that a few of the biggest Permian oil producing counties were close to peaking or past peak. Also comments by posters on this site have similar beliefs from hands on experience.
This section will focus on the four largest oil producing counties in the Permian, Lea, Eddy, Midland and Martin. It will track the oil and natural gas production and the associated Gas Oil Ratio (GOR) on a monthly basis. The data is taken from the state’s government agencies for Texas and New Mexico. Typically the data for the latest two or three months is not complete and is revised upward as companies submit their updated information. Note the natural gas production shown in the charts that is used to calculate the GOR is the gas coming from both the gas and oil wells.
Of particular interest will be the charts which plot oil production vs GOR for a county to see if a particular characteristic develops that indicates the field is close to entering or in the bubble point phase. While the GOR metric is best suited for characterizing individual wells, counties with closely spaced horizontal wells may display a behaviour similar to individual wells due to pressure cross talking . For further information on the bubble point and GOR, there are a few good thoughts on the intricacies of the GOR in an earlier POB comment and here. Also check this EIA topic on GOR.
New Mexico Permian
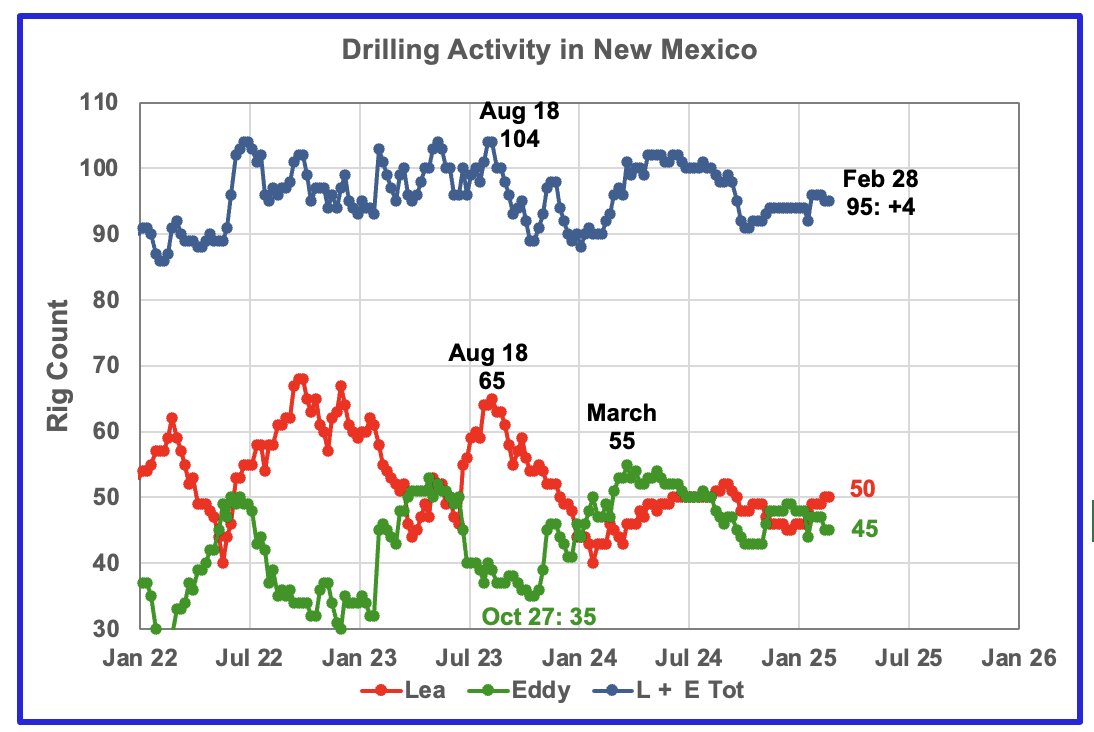
The total rig count in Lea and Eddy counties in the week ending February 28 was 95 and is down 5 from July 2024 count of 100. It has held steady for 15 weeks since late November 2024 at 94 ± 1.
Lea county rigs have been slowly dropping since late December while Eddy’s have slowly increased.
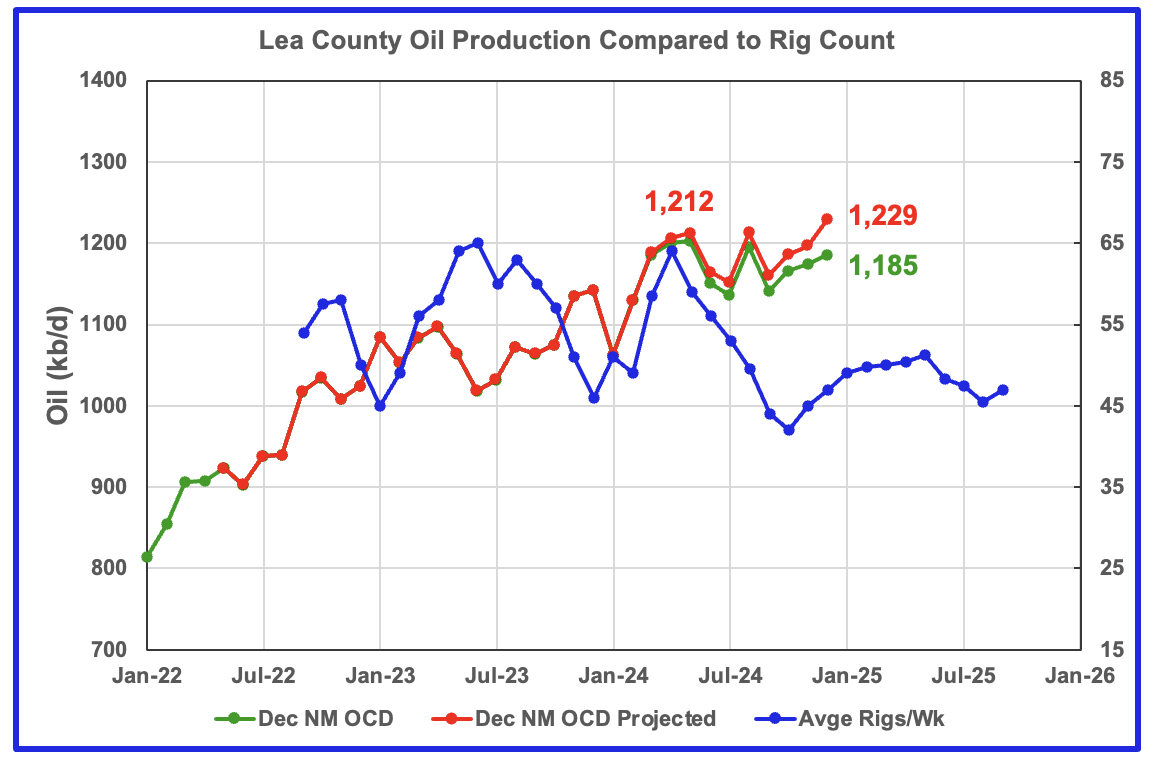
Lea County’s oil production appears to have entered a plateau phase in May at 1,212 kb/d and produced slightly more in August while December production rose by 32 kb/d to 1,229 kb/d. Production has been essentially flat to slightly rising since May 2024 as the rig count fell but began to increase in October as the time shifted rig count rose. Revisions to earlier months may be over estimating the production rise in December.
Preliminary December data from New Mexico’s Oil Conservation Division (OCD) indicates Lea County’s oil production increased by 10 kb/d to 1,185 kb/d. A projection for December’s final production estimates it will be closer to 1,229 kb/d.
The blue graph shows the average number of weekly rigs operating during a given month as taken from the weekly rig chart. The rig graph has been shifted forward by 8 months. So the 64 Rigs/wk operating in August 2023 have been time shifted forward to April 2024 to show the possible correlation and time delay between rig count, completion and oil production.
Comparing the flattening oil production since May with the dropping time shifted rig count, indicates/implies the newer wells drilled since June had higher IPs to offset the decline associated with the fewer wells drilled by the declining rig count. The rising rig count since November may be able to slow the declining/flattening production in Lea County but the writing on the wall is saying that Lea County is close to peak production.
Note that rig counts are being used to project production as opposed to completions because very few extra DUCs are being completed at this time.
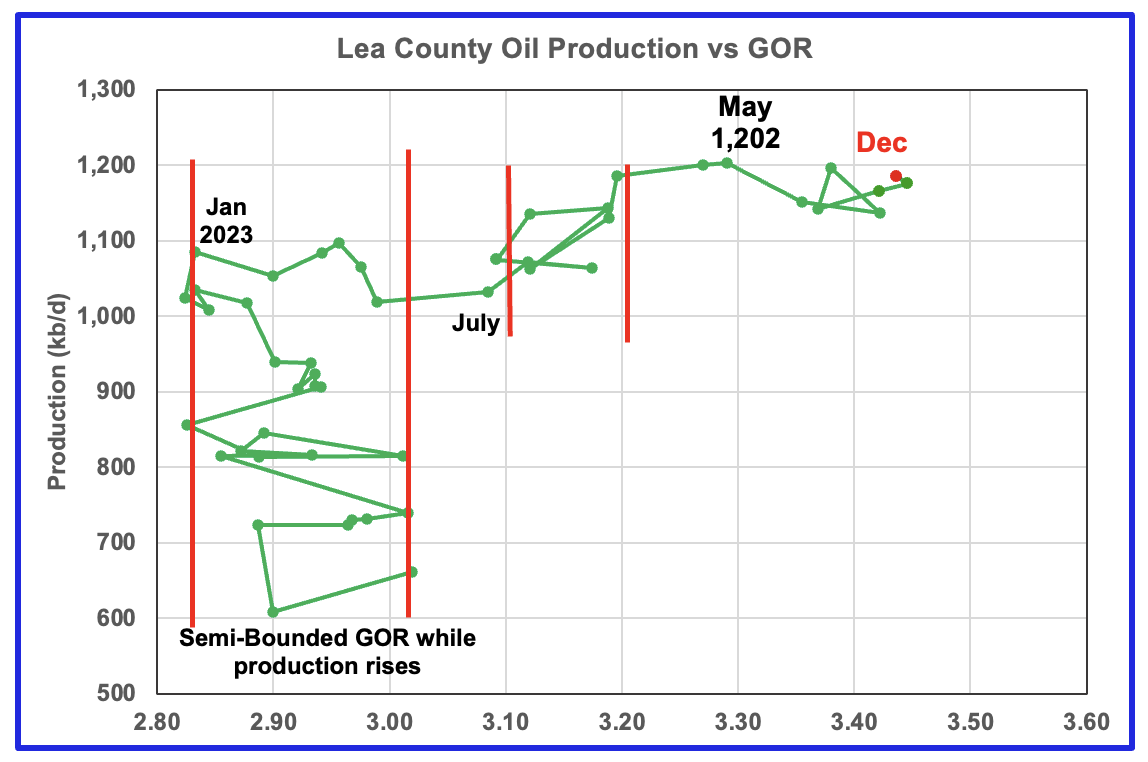
After much zigging and zagging, oil production in Lea county stabilized just below 1,100 kb/d in early 2023. Once production reached a new high in January 2023, production appeared to be on a plateau while the GOR started to increase rapidly to the right and entered the bubble point phase in July 2023.
Since July 2023 the Lea County GOR has continued to increase as production increased within a second semi-bounded GOR. This may indicate that the recent additional production is coming from a new bench/field since the GOR’s behaviour since August 2023 to March 2024 time frame appears once again to be in a semi bounded GOR phase accompanied with rising production.
The GOR moved out of the second semi-bounded GOR region in April and has continued to increase while production hit a new high in May 2024 and since appears to be in a plateau phase or slow decline.
This zigging and zagging GOR pattern within a semi-bounded GOR while oil production increases to some stable level and then moves out to a higher GOR to the right has shown up in a number of counties. See a few additional cases below.
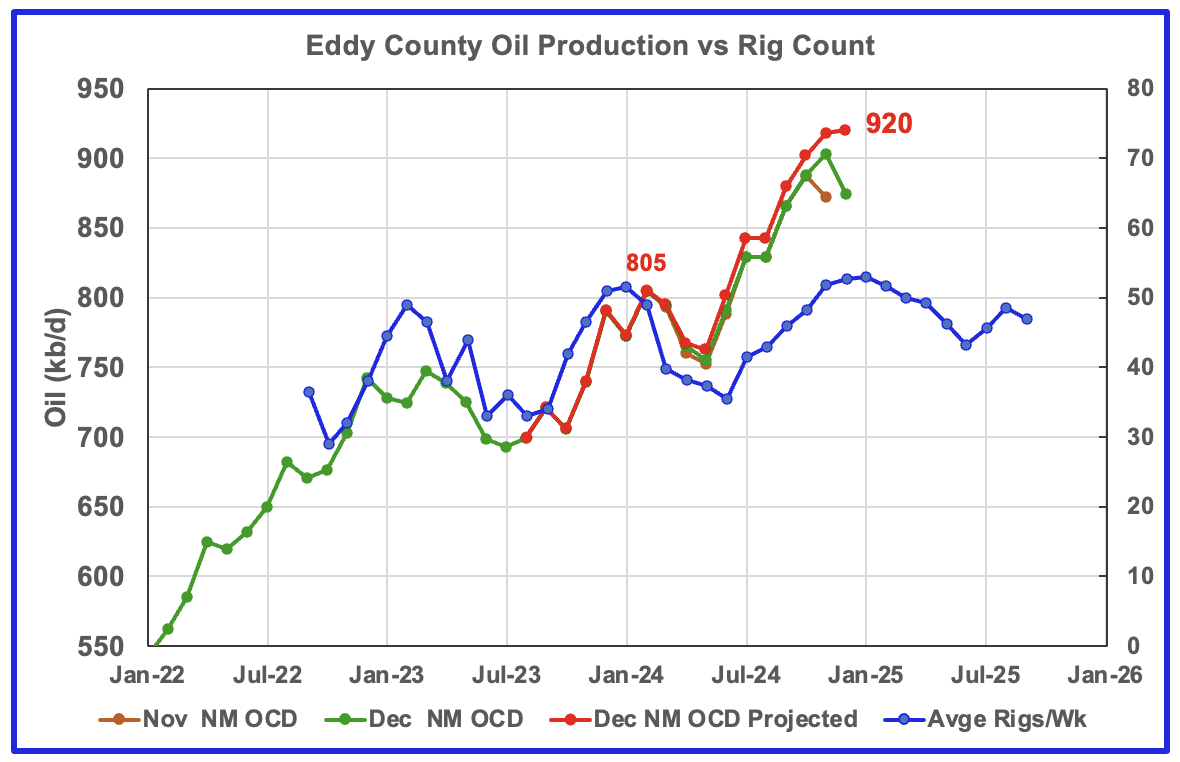
Eddy County’s oil production first peaked in February 2024 at 805 kb/d. After dropping for three months, the number of rigs and associated wells increased and so did oil production. From May to December, production rose from 763 kb/d to 920 kb/d, an increase of 157 kb/d, while essentially paralleling the increasing rig count. Over that same time shifted rig period, 14 to 15 rigs were added to Eddy County as production rose. Was a new Tier 1 region/shelf discovered to attract such a large increase in the rig count?
In December the projected oil production increased by 2 kb/d to a new high of 920 kb/d. This small increase also appears to reflect the slowing increase in the rig count.
The blue graph shows the average number of weekly rigs operating during a given month as taken from the above weekly drilling chart. The rig graph has been shifted forward by 8 months to roughly coincide with the increase in the production graph starting in November 2023.
Clearly the production rise up to October 2024 is closely associated with the rise in the rig count and associated well completions delayed by roughly 8 months. The small December increase is the second clue that the production rise associated with increasing rigs is about to end. The flattening rig count starting in December implies that production in Eddy county is heading into a short term plateau phase before starting to decrease sometime in January or February.
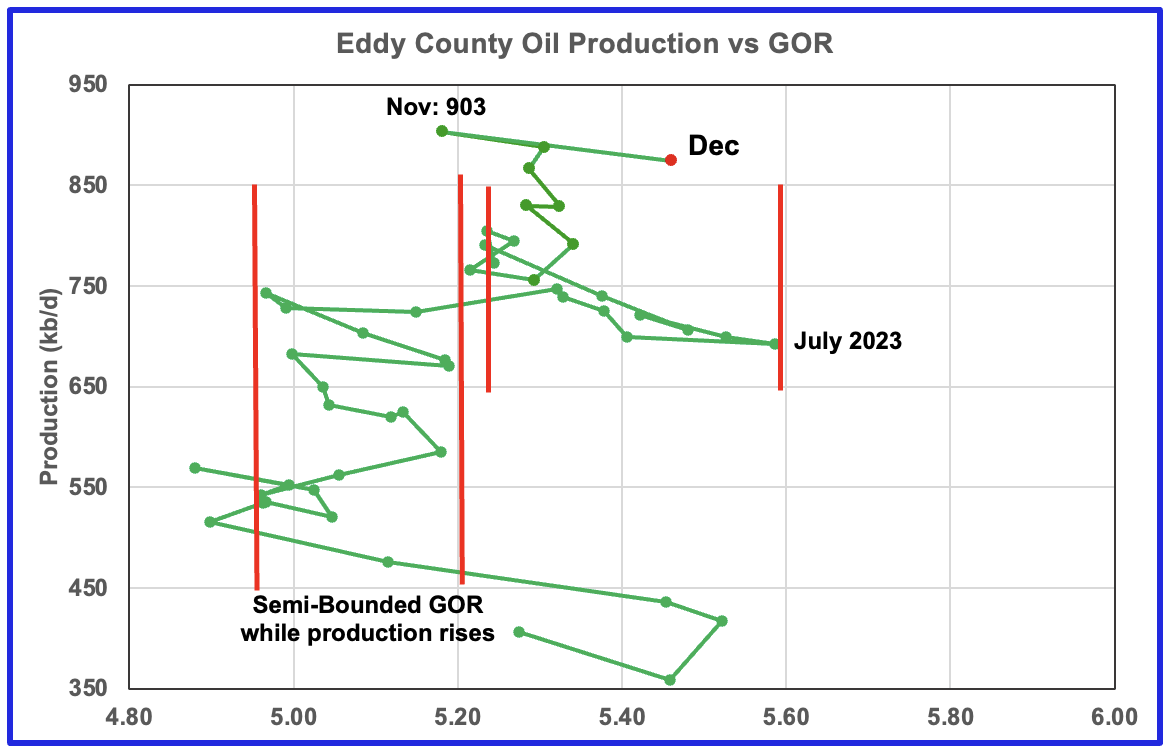
The Eddy county GOR pattern is similar to Lea county except that Eddy broke out from the semi bounded range earlier and for a longer time and then added a second semi bounded GOR phase. For December New Mexico’s reported oil production decreased by 28 kb/d to 875 kb/d and stayed within the second semi-bounded region.
Note the big increase in the GOR from November to December. Interesting to see what January brings.
Texas Permian
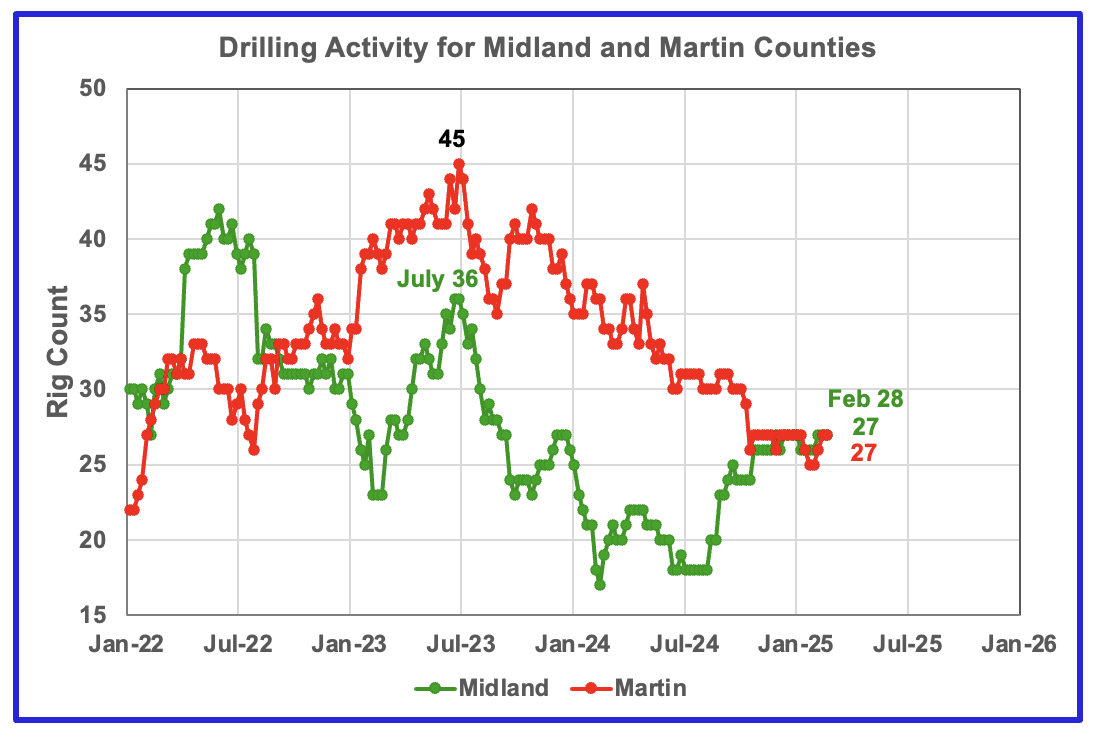
The Midland county rig count has been rising since July and is up 9 to 27 at the end of February. The opposite is true for Martin county. On February 28, 27 rigs were operational, down 18 from 45 in July 2023.
Since the end of October drilling in the Midland and Martin counties has been very steady at 26 and 27 rigs, respectively, except for January 31 when Martin dropped to 25.
Texas County Oil Production
The Texas RRC made significant revisions to its production data in their September report and those revisions now continue to affect the December projections in this update. Some of the projections for this Texas update are almost reasonable. However in a few cases the projections are over estimated.
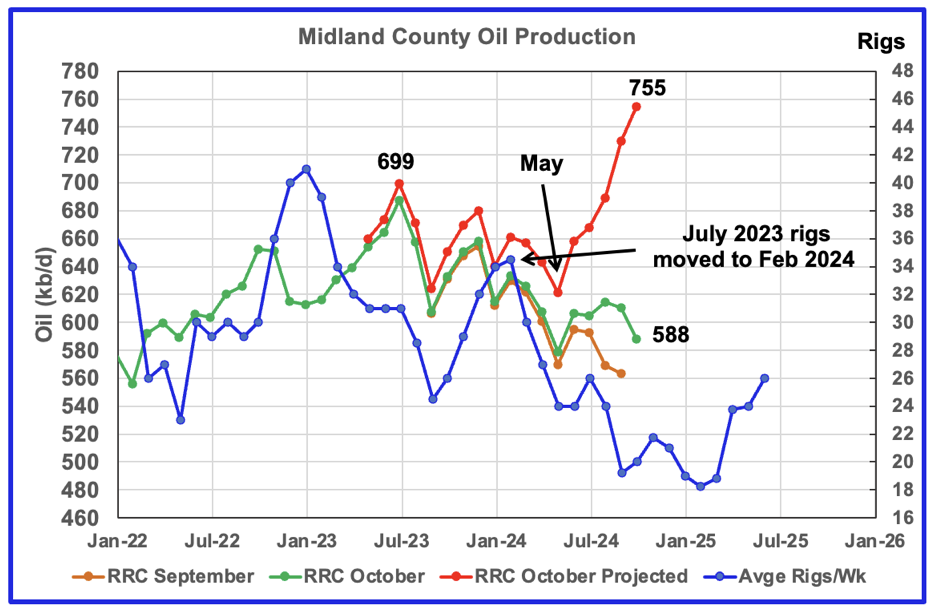
Midland October oil production chart for comparison with updated December chart below.
For many months in previous posts Midland county’s oil production had been declining. The revisions in the Texas RRC September update turned the decline into rising production that exceeds the previous production peak of 699 kb/d in July 2023 which I didn’t think was correct and mentioned in the previous US post. See next chart.
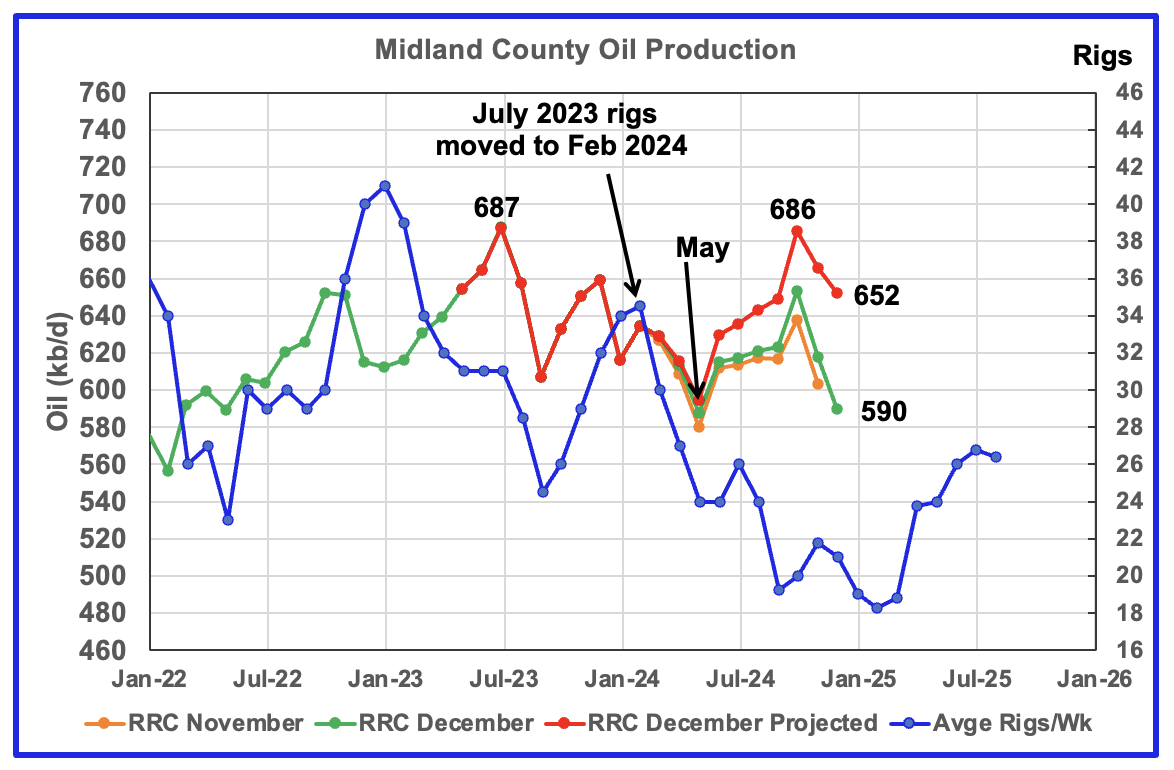
The orange and green graphs show the oil production for Midland County as reported by the Texas RRC for November and December. The red graph uses the November and December data to project production as it would look after being updated over many months.
December projected production dropped 14 kb/d to 652 kb/d. Preliminary Texas December RRC production dropped 28 kb/d to 590 kb/d.
Even though the rig count is dropping, I think the increase in the projected production after May is real based on the increasing production shown for October in the December RRC data. Comparing the current chart with the previous one, note that the projected July 2024 production has dropped by 33 kb/d, 668 kb/d to 635 kb/d.
While the post May production projection is rising, I think it is overdone and hopefully will correct itself in the next data release. Considering that oil production from July 2023 to May 2024 followed the rig count graph, it is not unreasonable to question whether magnitude of the production rise after May is believable. The initial RRC December data is showing lower production in December over November and this is reflected in the projection, however I think it is on the high side.
The blue graph shows the average number of weekly rigs operating during a given month as taken from the weekly drilling chart. The rig graph has been shifted forward by seven months. So the average 34.5 Rigs/wk operating in July 2023 have been moved forward to February 2024 to show the possible correlation and time delay between rig count, completions and oil production. If the seven month shift in the rig count is approximately correct in that oil production can be tied to the rig count, oil production in Midland county should increase for a month or two before resuming its decline.
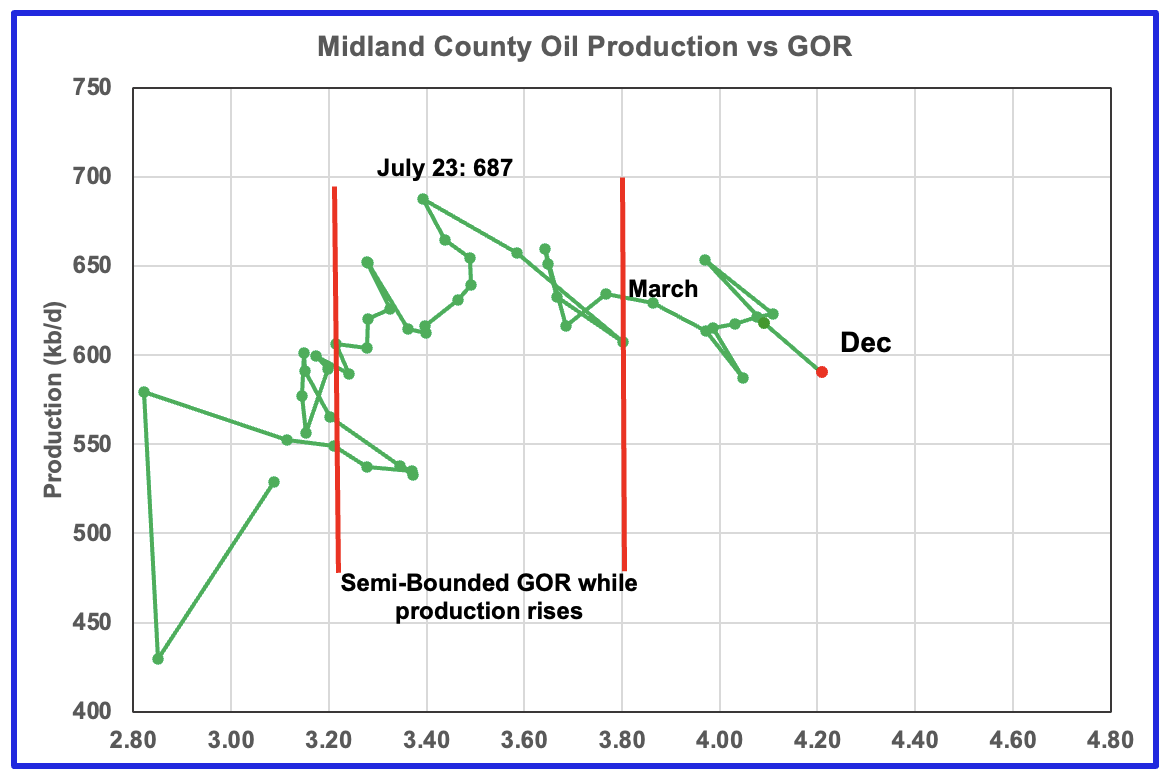
The production revisions do not affect the GOR. For December the GOR ratio increased to 4.21 while production dropped.
With Midland county into the bubble point phase, oil production and the GOR have stayed within a narrow range outside of the initial Semi-Bounded GOR region but December broke to a new high of 4.21.
The oil production and GOR shown in this chart are based on the RRC’s December production report. Note that while the last few months are subject to revisions, the July 2023 to May 2024 production data has been steady for a number of months.
Above is the Martin county oil production chart posted in the February US update. It was the second month that was hinting at a production peak for Martin county. Also it was the fourth month in which the GOR was out of the semi-bounded GOR region. The current December update has made larger than normal revisions to November’s production data and as a result the projected results shown in the next chart may be over optimistic.
This November chart has been posted to compare with the December oil production chart below.
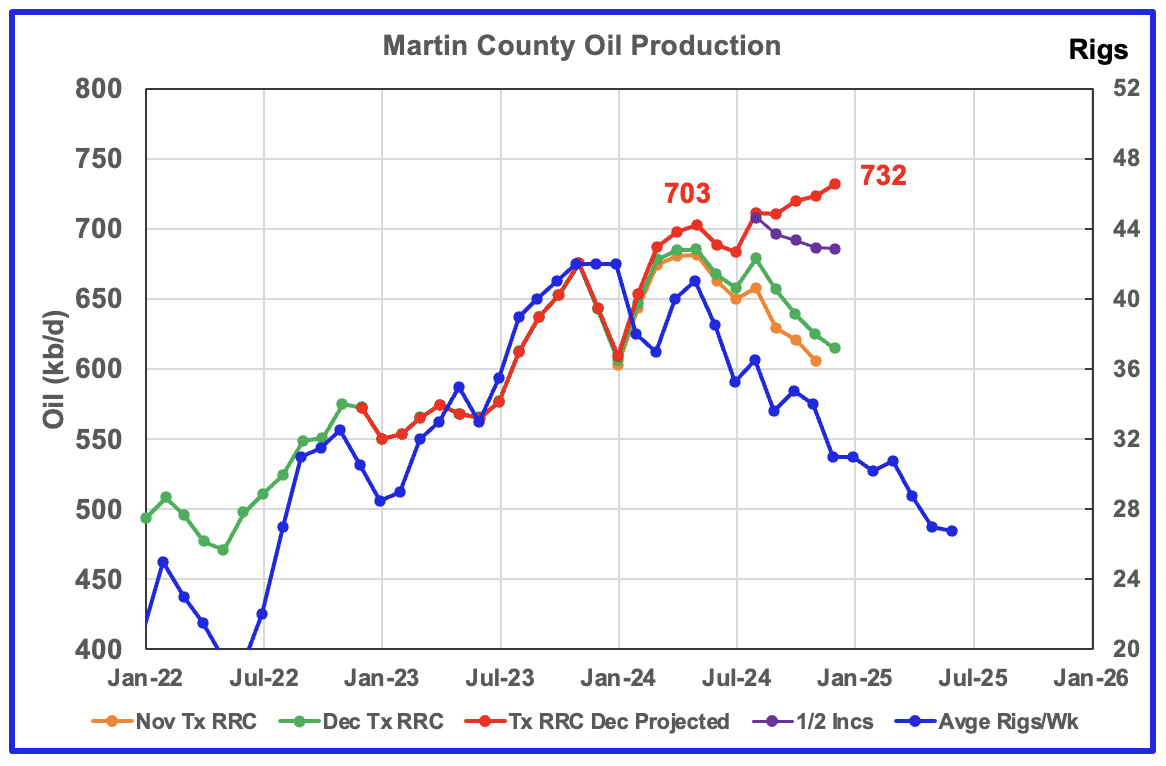
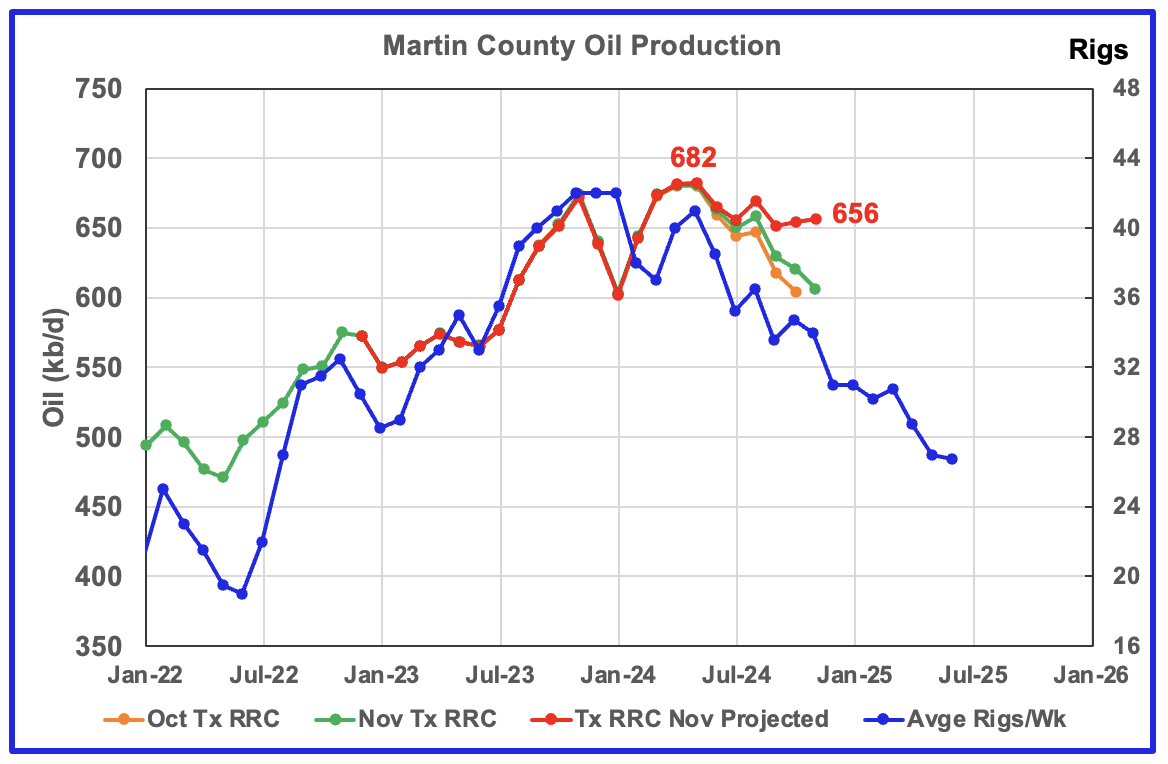
The orange and green graphs show the production for Martin County as reported by the Texas RRC for November and December. The red graph is a projection for oil production as it would look after being updated over many months.
The red graph is a production forecast which the Texas RRC could be reporting for Martin county about one year from now as the Texas RRC reports additional updated production information. This projection is based on a methodology that uses preliminary November and December production data. The green graph shows oil production reported by the Texas RRC for December and is slightly higher than November. Note how the production projection plateau in the November chart has gone to being an increasing production phase in the December chart.
Martin county’s projected December oil production increased by 9 kb/d to 732 kb/d.
In comparing the December and November month over month increments between the green and orange graphs, note the increments in the last four months in the December chart are almost double those in the November chart which results in the rising Martin production. The effect of reducing the increments by 1/2 is shown in the chart’s purple markers. We will have to wait for the January update to get a better idea of what production is really doing is Martin county.
It should be noted that the underlying assumption in this forecasting methodology is that the intra yearly monthly increments are typically monotonic and the inter yearly month increments are reasonably consistent. For this month, the inter yearly month increments over the last 4 months doubled and the projection is overly optimistic.
The blue chart shifts the rig count ahead by 6 months. Note the three flat spots in the November, December and January rig count and similar flat spots in production a few months later.
My best guess for Martin County production is that it is on a plateau.
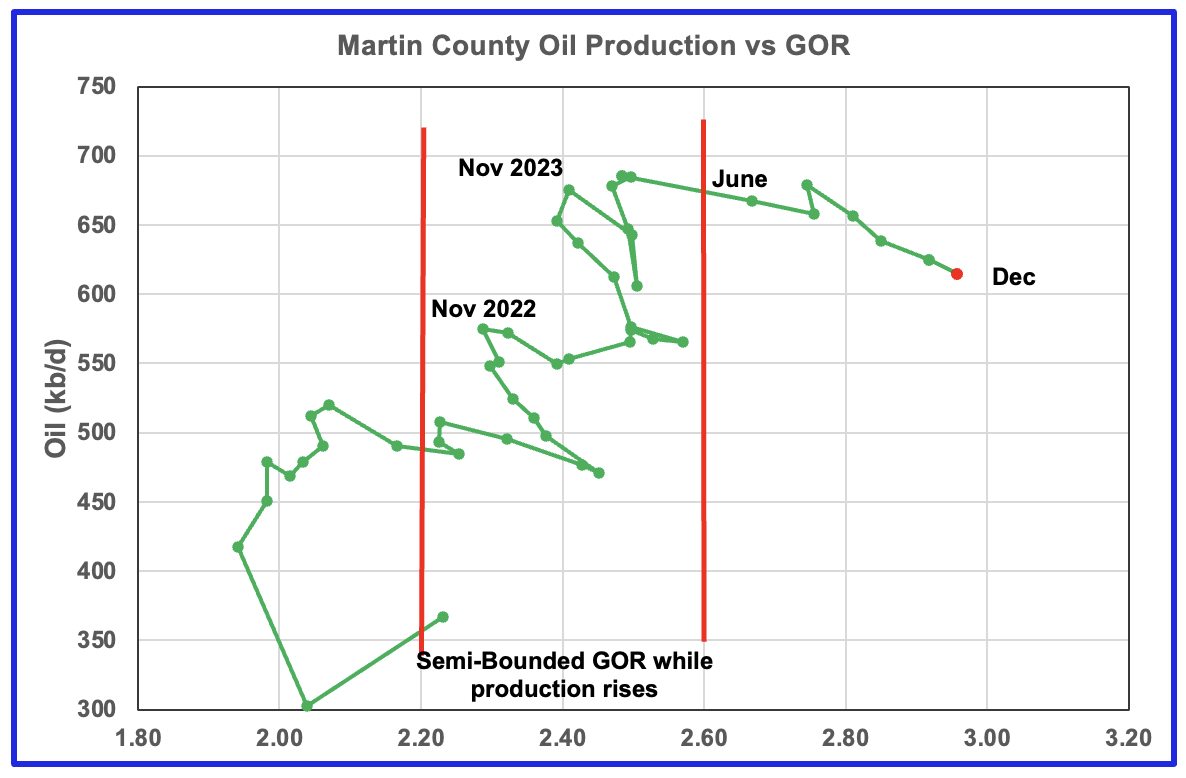
Martin county’s oil production after November 2022 increased and at the same time drifted to slightly higher GORs within the semi bounded range. However the June 2024 GOR saw its first move out of the semi bounded region. The preliminary Texas RRC’s December production for Martin county shows a continuing increase in the GOR to a new high with dropping oil production.
Martin county has the lowest semi-bounded GOR boundary of the four counties at a GOR of close to 2.60 but for December it has jumped to 2.96 and is clearly out of the semi-bounded region. Martin County has now entered the bubble point phase that should result in a dropping oil production trend.
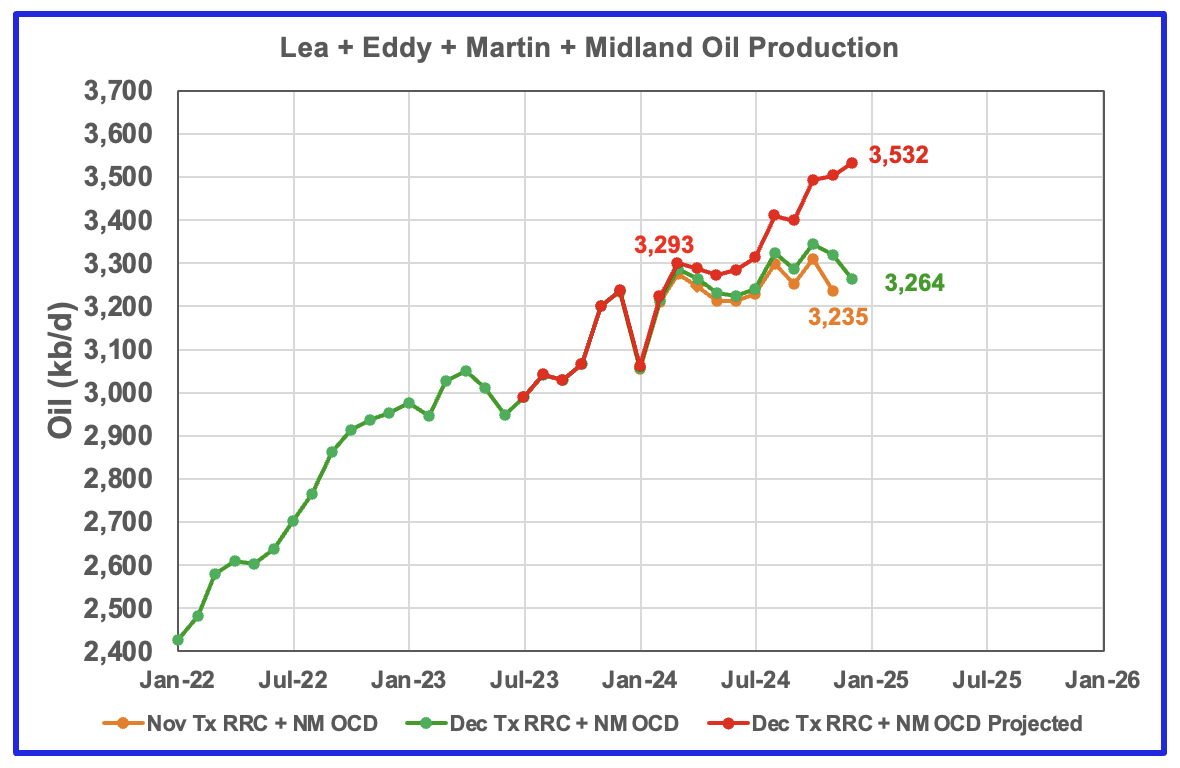
This chart shows the total oil production from the four largest Permian counties. Assuming that current December Permian production is close to 6,400 kb/d, these four counties account for close to 55% of the total.
The November and December initial production data is shown in the orange and green graphs respectively. The red graph uses the October and November data to project an estimate for the final December production. The growth is related to growth in Martin and Eddy counties.
The projection indicates that December production increased by 29 kb/d to 3,532 kb/d. The combined preliminary December production data is higher than November’s, up by 29 kb/d to 3,264 kb/d and implies the December increase is real.
However I believe the December increase is too optimistic due to larger than typical revisions to the updated previous month’s production in the latest December report.
Findings
– Lea county may have entered a plateau phase in May 2024. While oil production is not following the rig count graph directly, the dropping rig count is resulting in Lea production currently being on a plateau or possible on a shallow rise. The rise in December production appears to track the rising rig count that started in October.
– Eddy County’s oil production initially peaked in February 2024. It started a new increasing phase in June as it followed the uptrend in the rig count and exceeded its previous February peak. December production increased but slowed and it is occurring at the same time as the rig count is peaking.
– Midland county peaked in July 2023 and has roughly followed the declining rig count graph since then. It appears to have started a new increasing phase in June 2024 which peaked in October and is now in decline again. Is the rig count graph making its impact felt.
– Martin County may have peaked in May 2024 and may have entered a slow declining phase. The December production revisions may be creating an over optimistic production profile for the last four months.
– Two of the four largest Permian oil producing counties are now in their plateau phase, Lea and Martin. One is in decline, Midland and another is close to its peak, Eddy, assuming that drilling does not start to increase significantly for all four. Need a few more months of data to clarify Eddy’s growth/decline potential.
Texas District 8
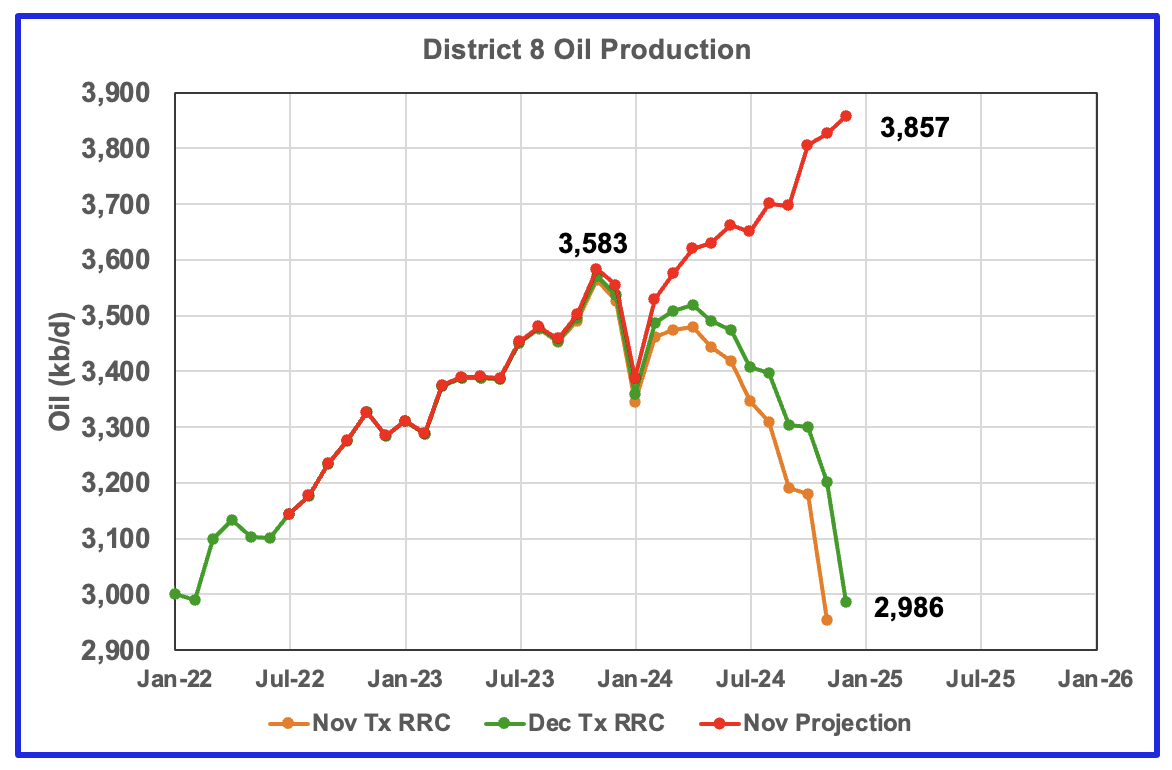
The large revisions to the previous months in the December report has changed District 8 from a District in a plateau phase to one with increasing production. This optimistic increase hopefully will be corrected in the next report.
Texas District 8 contains both the Midland and Martin counties. While these two counties are the two largest oil producers, there are many other counties with smaller production, such as Reeves #3, Loving #4, Upton #5 and Howard #6.
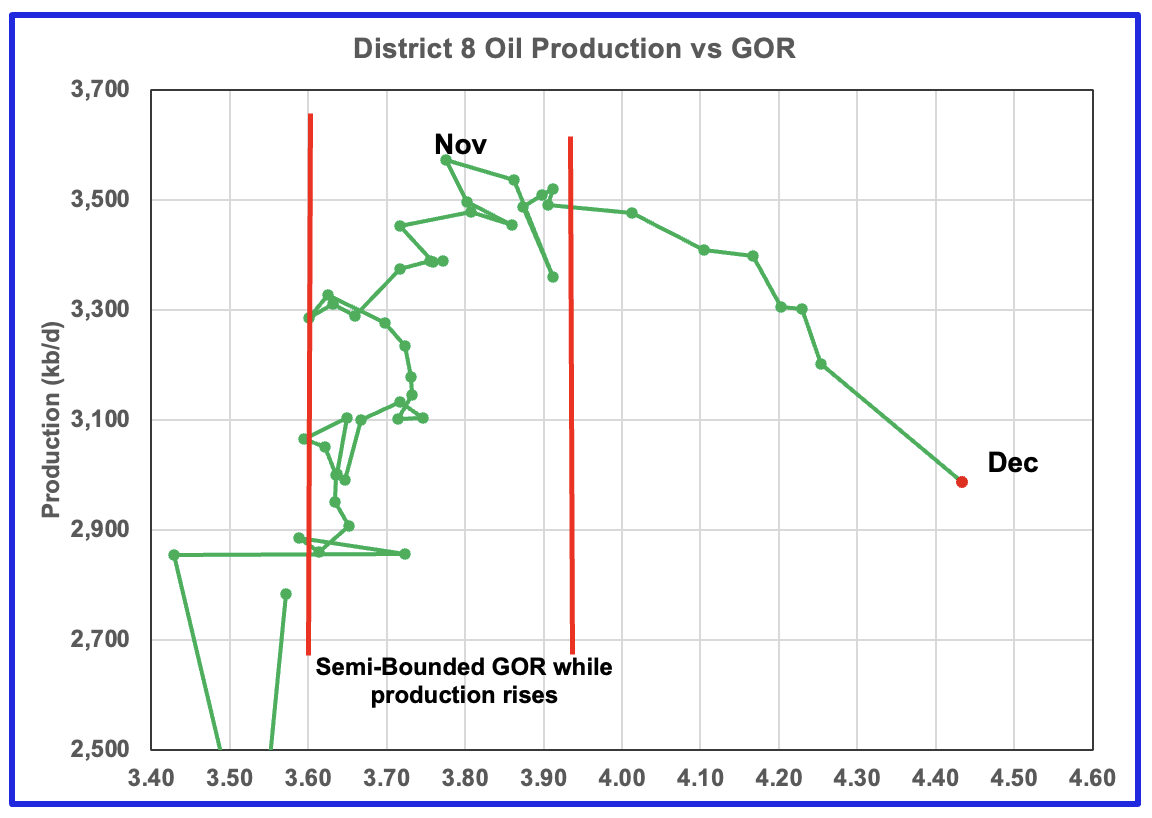
While the revisions in the production chart affect the projection, it does not affect the GOR.
Plotting an oil production vs GOR graph for a district may be a bit of a stretch. Regardless here it is and it seems to indicate many District 8 counties may well be into the bubble point phase. The GOR continue to rise and reached another high of 4.43. This is another indicator that implies District 8 has passed peak production.
Oil Production and GOR Charts for the Next Bigger Oil Producing Counties in Texas
Below are the next five top oil producing counties in Texas.
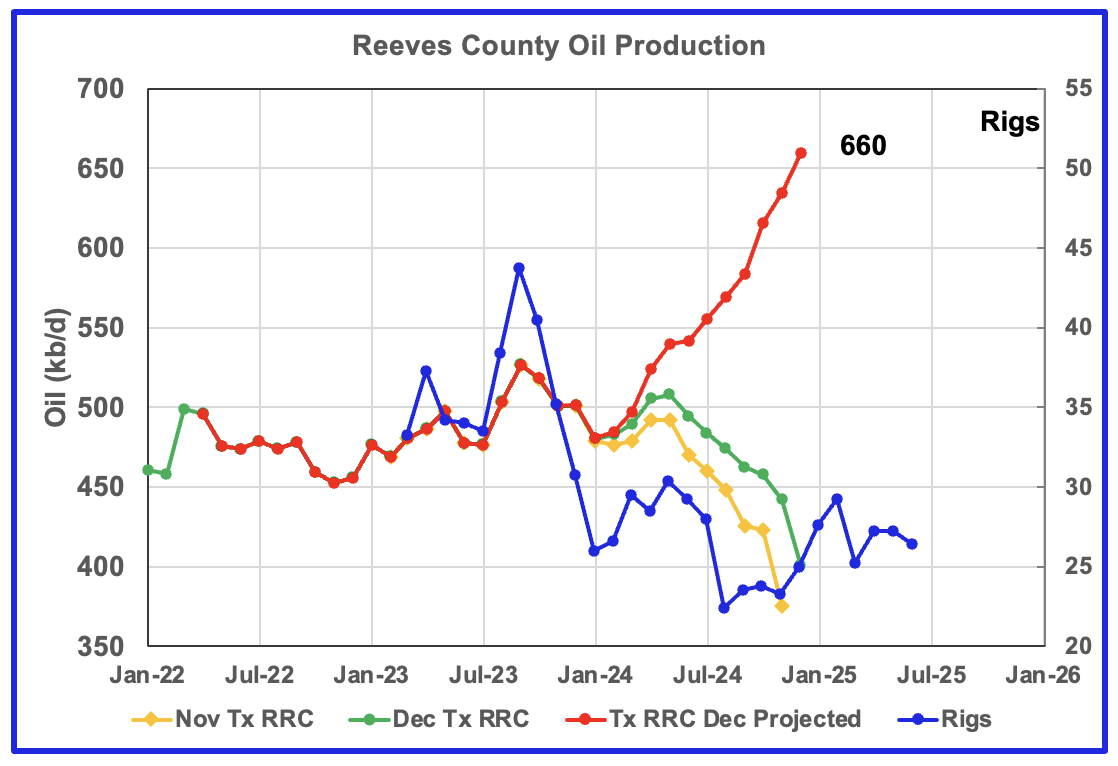
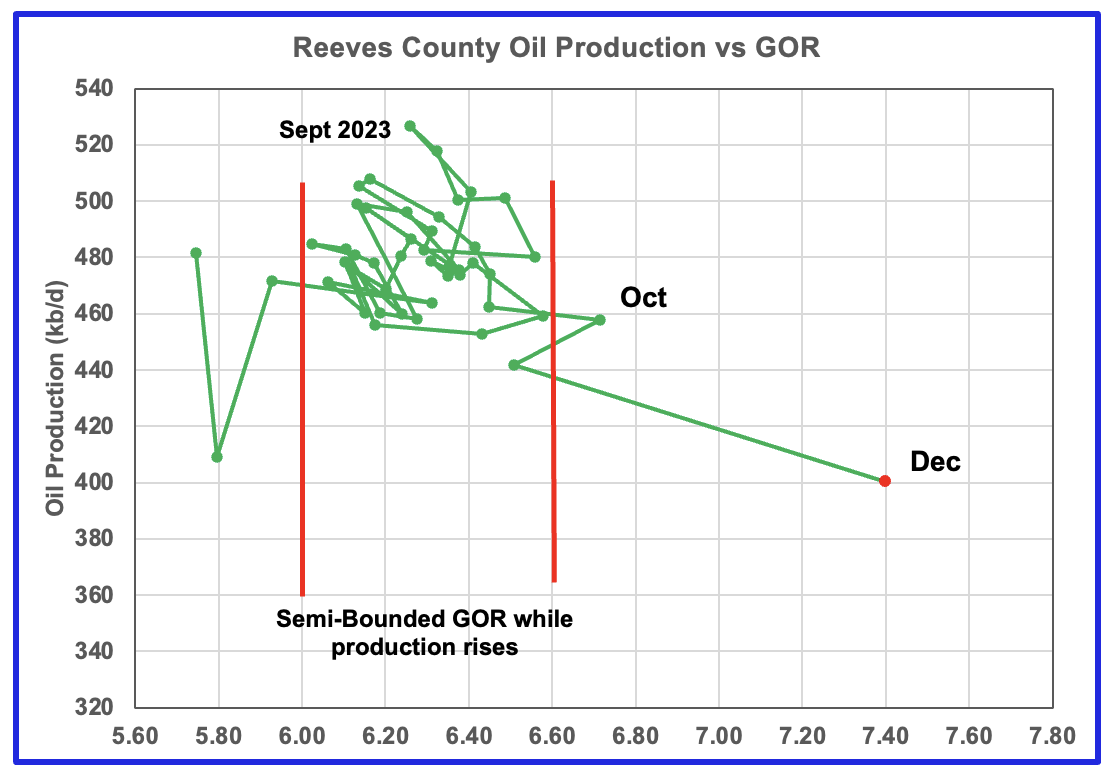
The large revisions to the December oil production data results in the forecasting model being too optimistic. The GOR chart paints a different picture. It indicates that Reeves County entered the bubble point chase in December and production should start to fall.
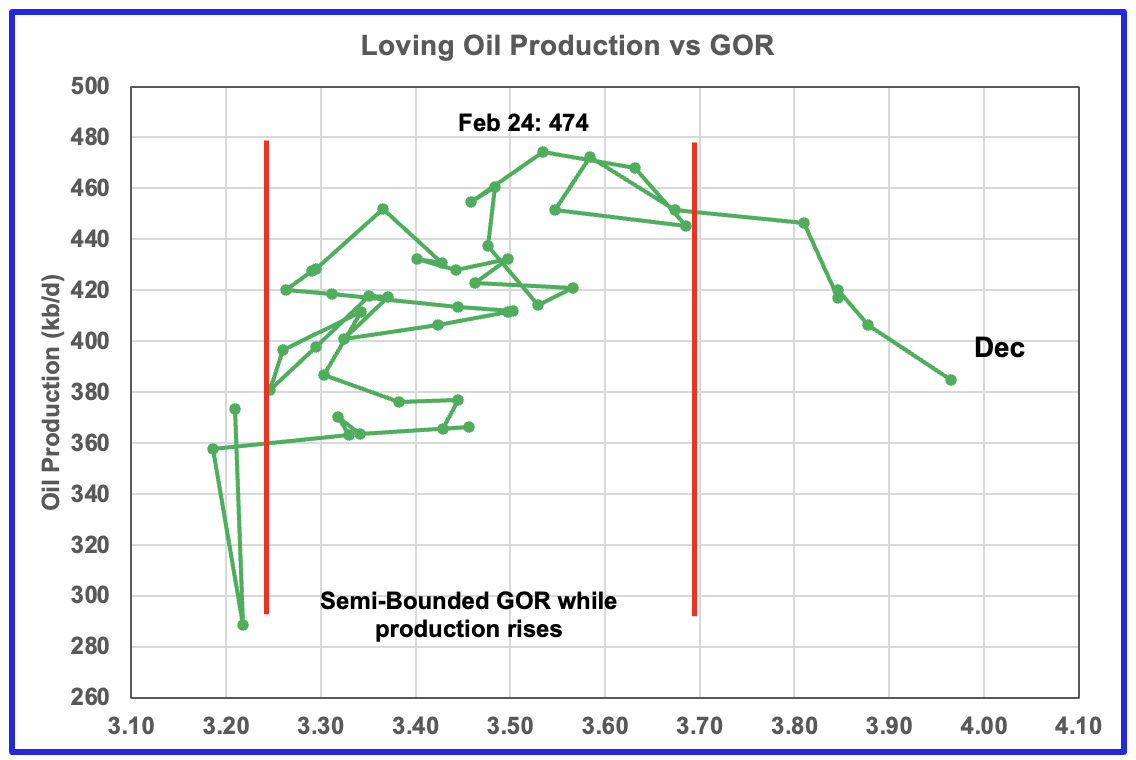
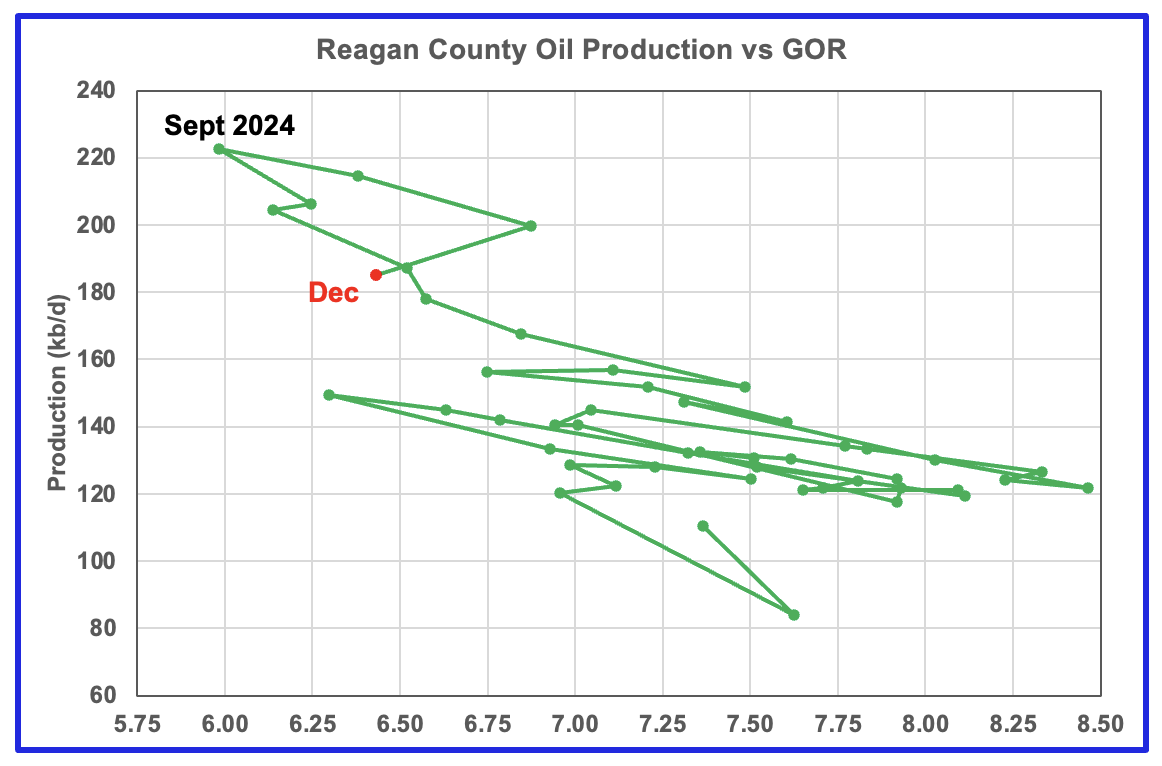
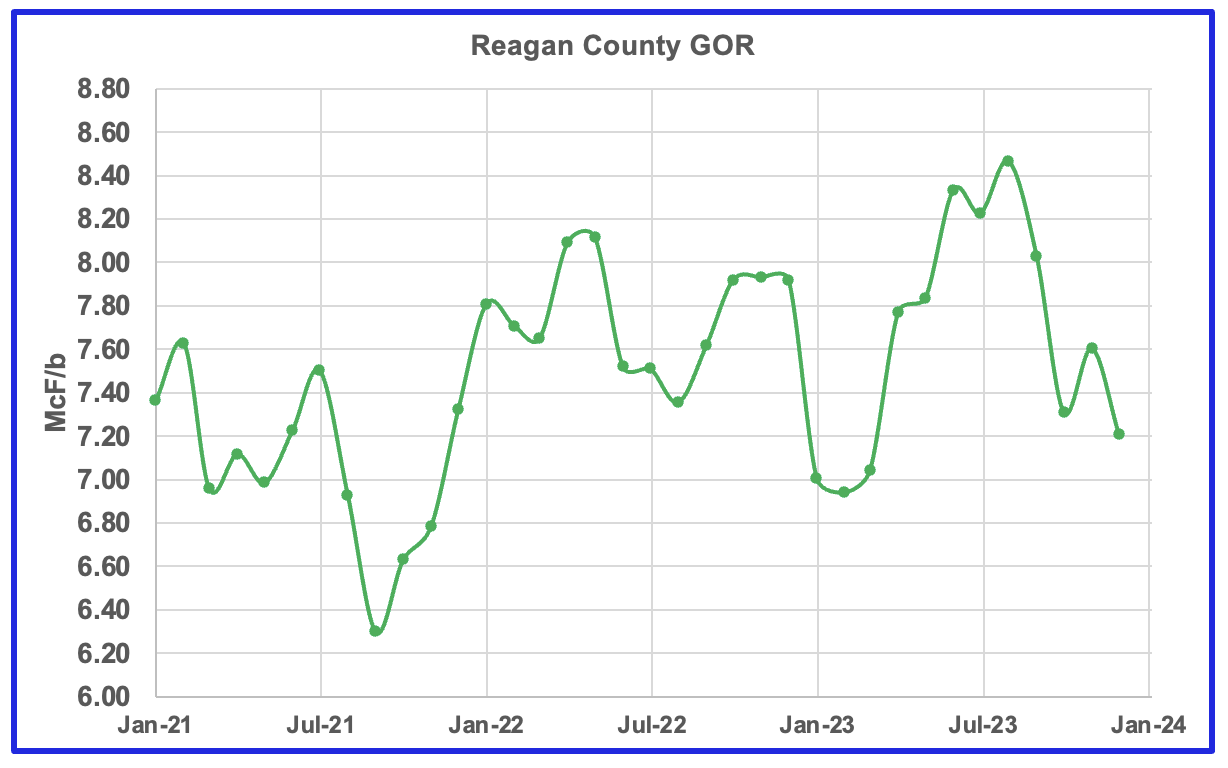
Reagan county has oil wells with a very high a GOR. The above charts indicate that oil production is falling along with the GOR, an indication that Reagan county could be gassing out.
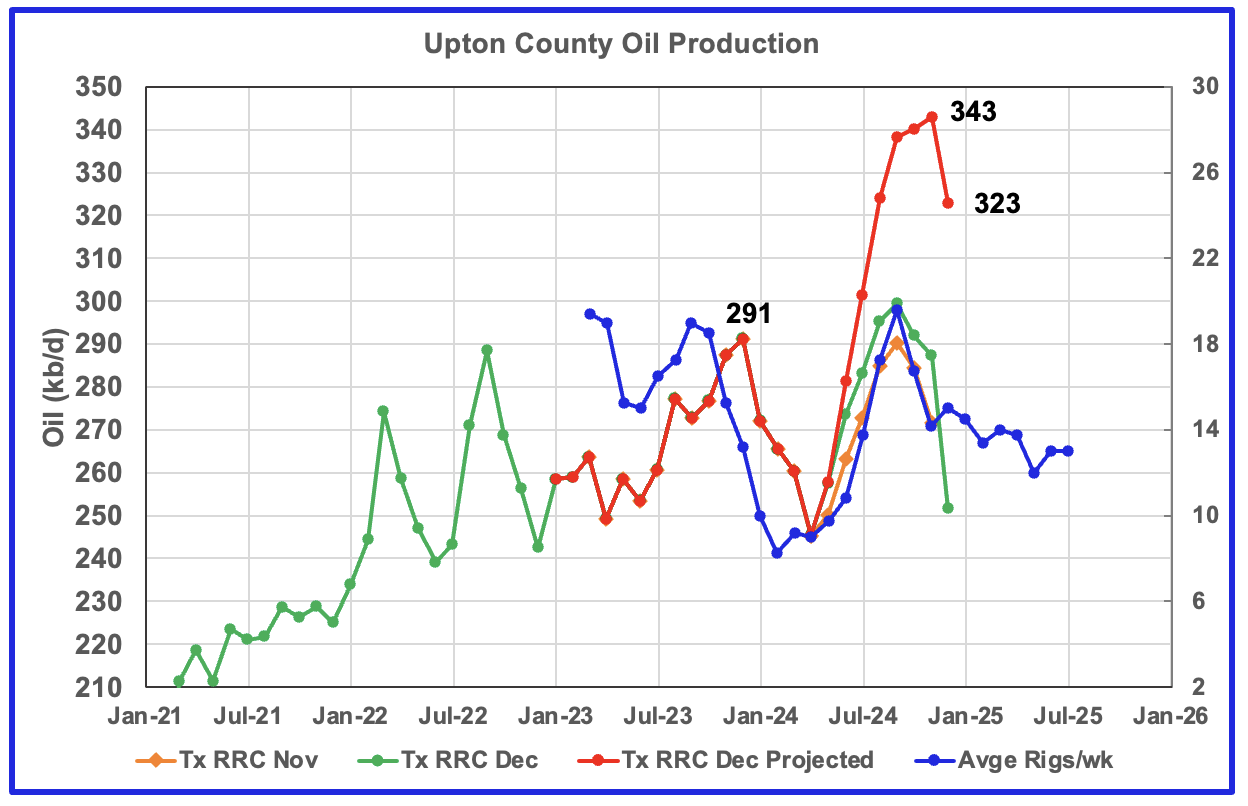
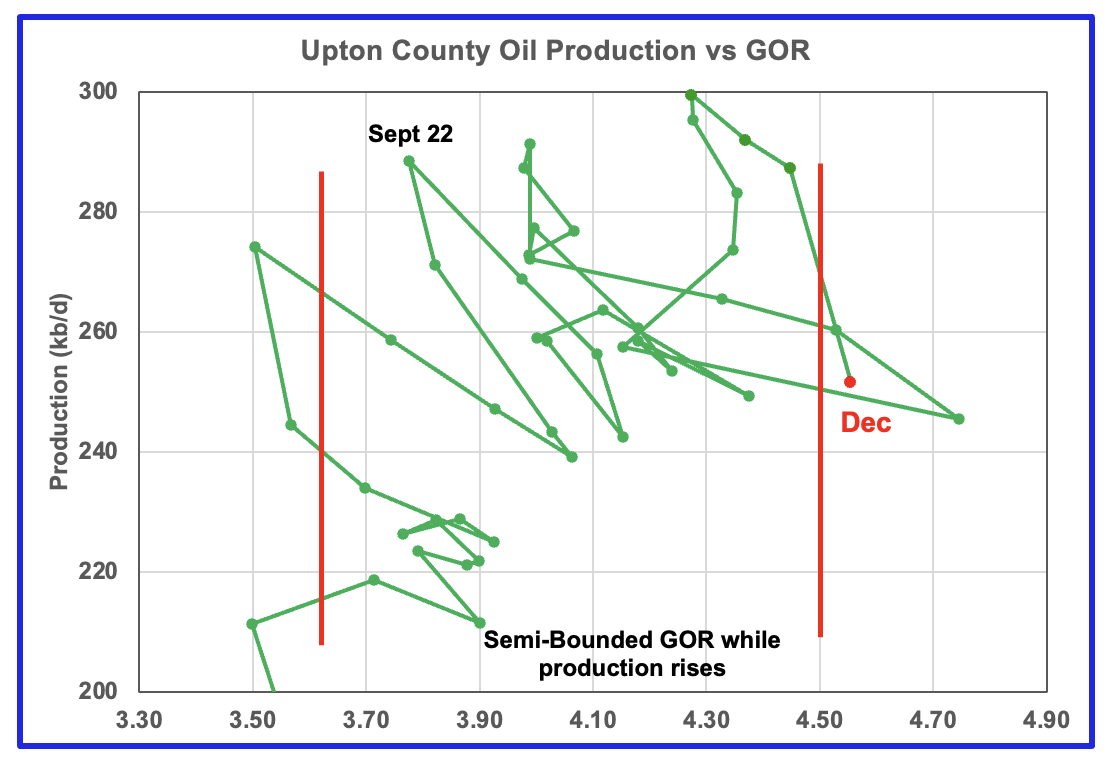
Upton county production has followed the rig count graph since January 2024 and may have peaked in November. December saw a large drop in production and the GOR may be on the verge of clearly moving out to the Semi-Bounded GOR region.
The rig graph in the oil production chart has been shifted forward by six months.
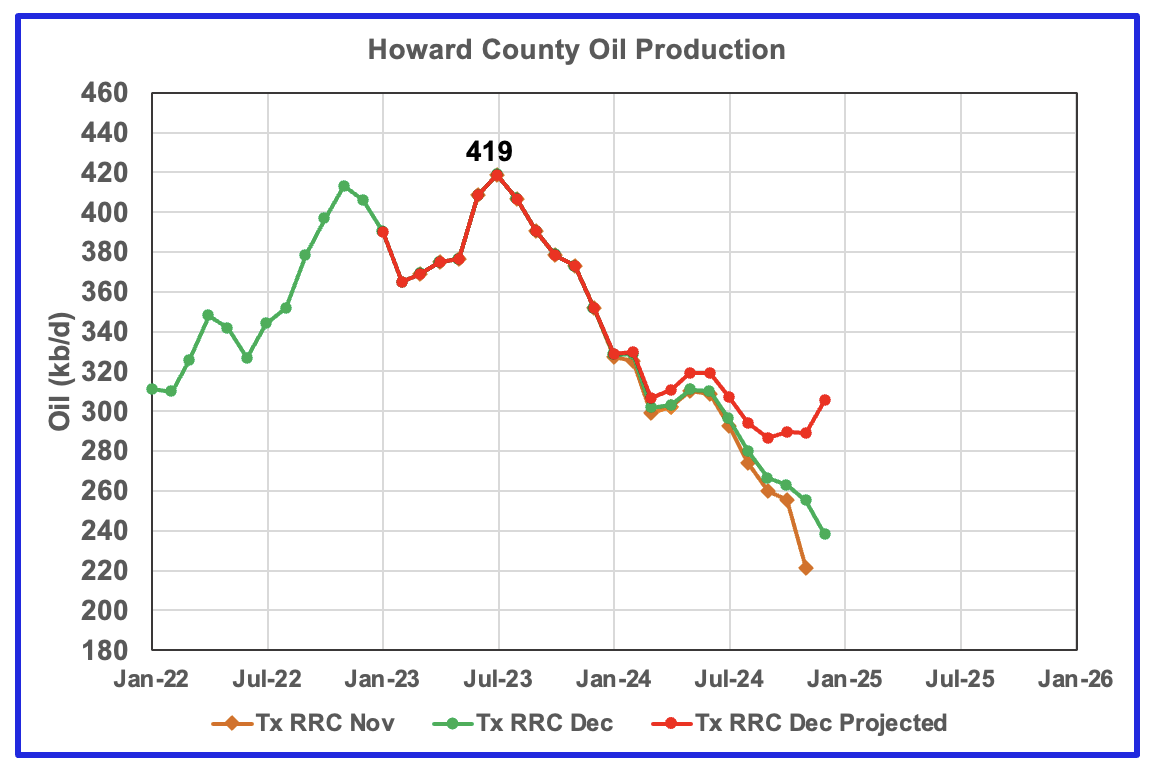
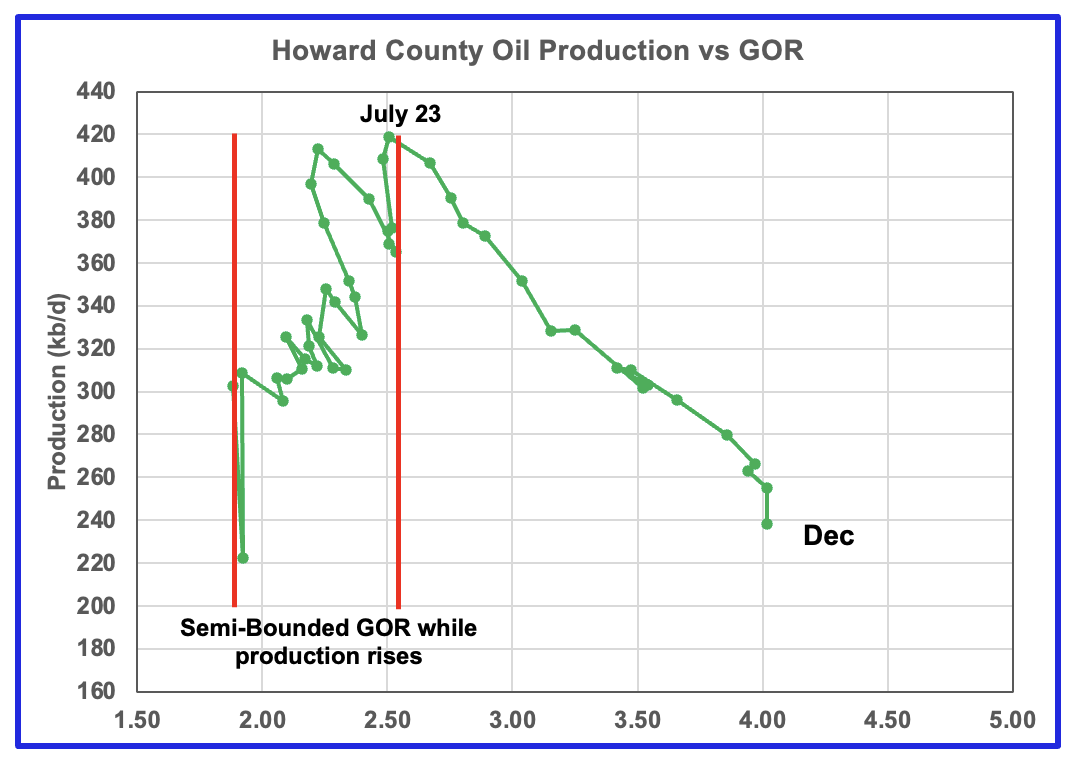
Howard county peaked in July 2023 at 419 kb/d. Note the rapid movement of the GOR to higher ratios once it broke out of the Semi-Bounded GOR range. While the GOR has risen to new highs, production has kept on falling. The production rise shown for December in the projection graph is overdone.
Drilling Productivity Report
The Drilling Productivity Report (DPR) uses recent data on the total number of drilling rigs in operation along with estimates of drilling productivity and estimated changes in production from existing oil wells to provide estimated changes in oil production for the principal tight oil regions. The new DPR report in the STEO provides production up to December 2024. The report also projects output to December 2026. The DUC charts and Drilled Wells charts are also updated to December 2025.
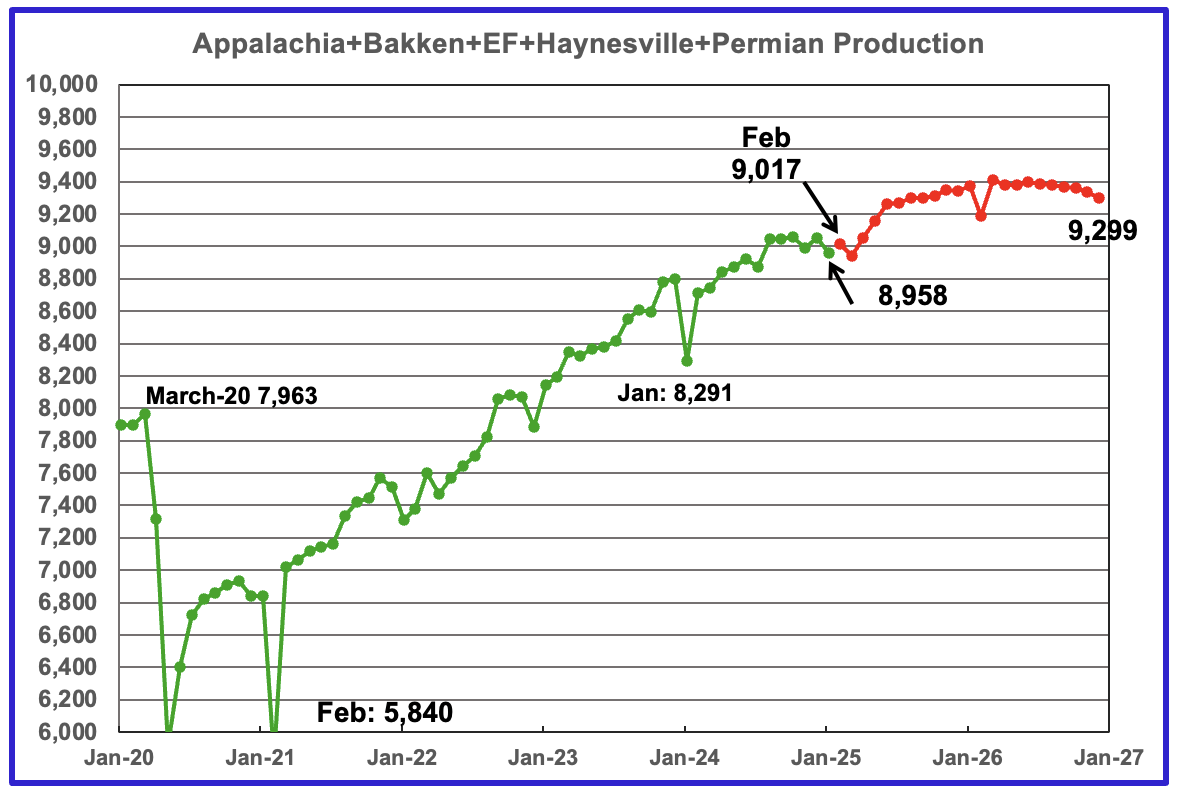
The oil production for the 5 DPR regions tracked by the EIA’s STEO is shown above up to January 2025. Also the February 2025 STEO projects production out to December 2026, red markers. Note DPR production includes both LTO oil and oil from conventional wells. DPR oil production for the Anadarko and Niobrara regions is no longer available.
The January oil output in the five DPR regions decreased by 94 kb/d to 8,958 kb/d. Production is expected to rise by 59 kb/d in February to 9,017 kb/d. Note the sharp production rise of 320 kb/d from April to June. After that, production growth slows.
From December 2024 to December 2026, production is expected to grow by 247 kb/d, down from 343 kb/d in the previous report. December 2026 production has been revised down from 9,459 kb/d to 9,299 kb/d, a downward revision of 160 kb/d. Note how production falls off in the later half of 2026.
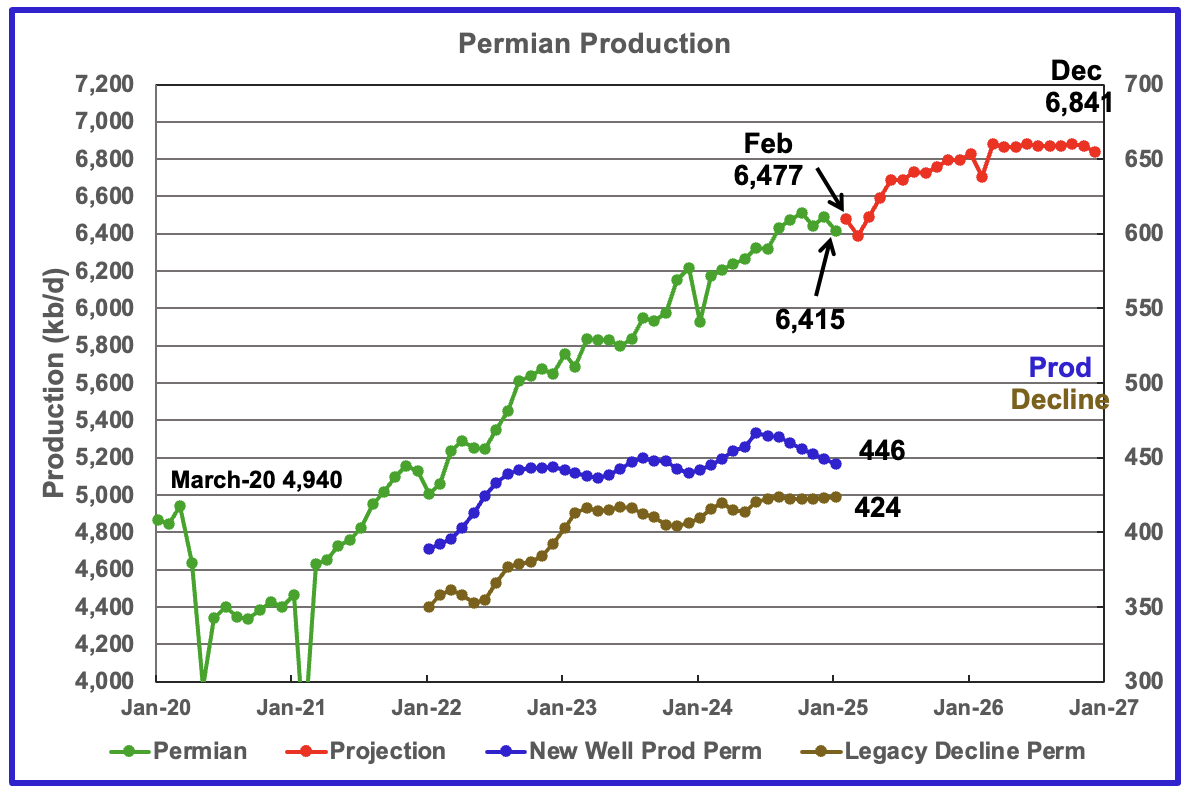
The EIA’s February DPR report shows Permian output in January decreased by 76 kb/d to 6,415 kb/d. From February 2025 to December 2026 output is expected to rise by 364 kb/d to 6,841 kb/d. Also note how production rises by 303 kb/d from April to June 2025 and then the production growth rate slows.
There has been a significant revision to the production forecast for December 2026. In the previous post, the STEO forecast production in December 2026 would be 6,997 kb/d. The updated forecast for December 2026 is 6,841 kb/d which is a downward revision of 156 kb/d.
Production from new wells and legacy decline, right scale, have been added to this chart to show the difference between new production and legacy decline. Notice the steady decline in new well production over the past eight months.
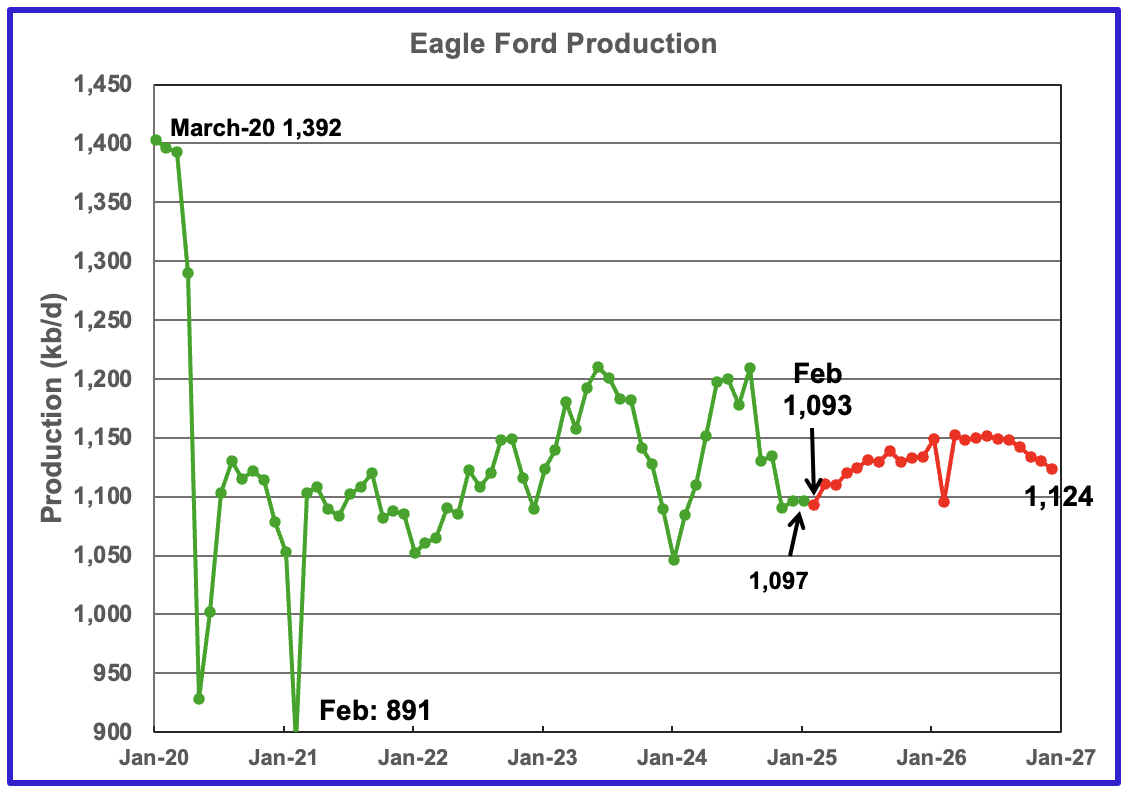
Output in the Eagle Ford basin had been increasing since January 2024 and appears to have peaked in August 2024. January production was flat at 1,097 kb/d. February 2025 production is forecast to decrease by 4 kb/d to 1,093 kb/d.
Production over the next two years is expected to peak in March 2026. Output in December 2026 expected to be 1,124 kb/d, 31 kb/d higher than February 2025.
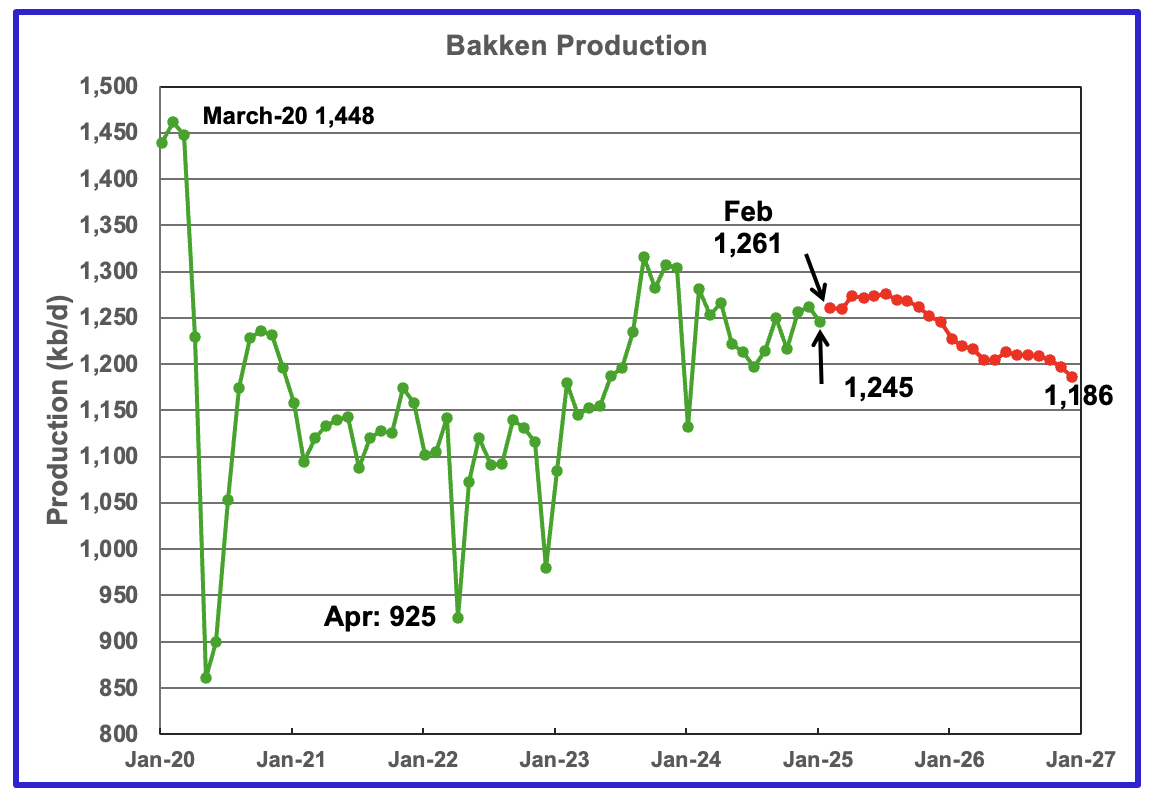
The DPR/STEO reported that Bakken output in January dropped by 16 kb/d to 1,245 kb/d. The STEO projection, red markers, shows output to be essentially in decline after July 2025, dropping to 1,186 kb/d in December 2026.
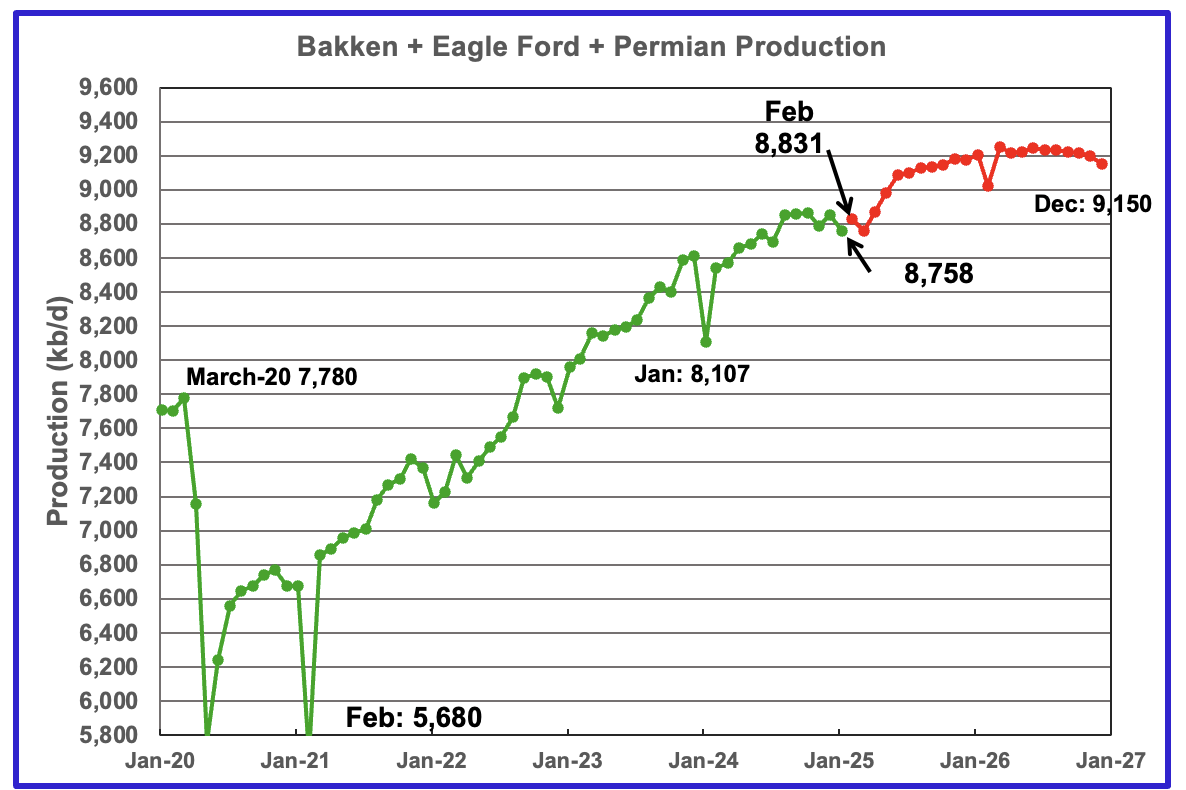
This chart plots the combined production from the three main LTO regions. For January output dropped by 92 kb/d to 8,758 kb/d. After being on an approximate plateau for the first half of 2026 at close to 9,230 kb/d, production in December 2026 rolls over and drops to 9,150 kb/d, a downward revision of 132 kb/d from the previous report.
DUCs and Drilled Wells
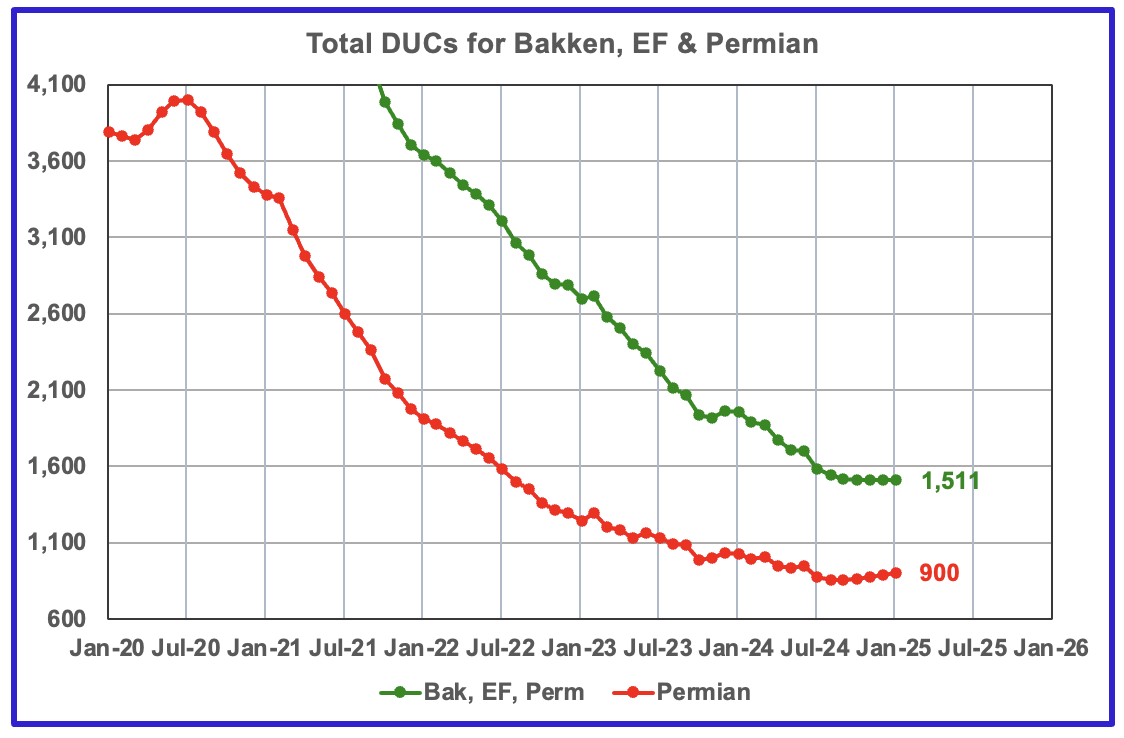
The number of DUCs available for completion in the Permian and the three major DPR regions has fallen every month since July 2020. January DUCs rose by 2 to 1,511. In the Permian, the DUC count increased by 12 to 900. The August low was 855 DUCs.
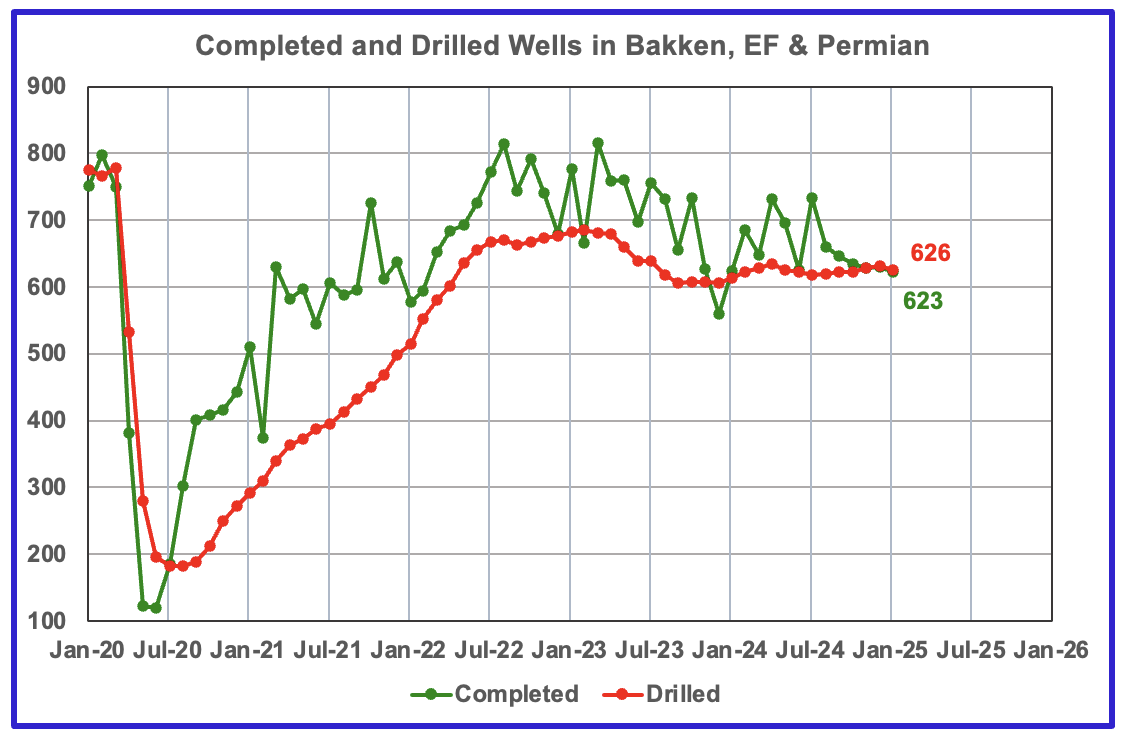
In the three primary regions, 623 wells were completed and 626 were drilled.
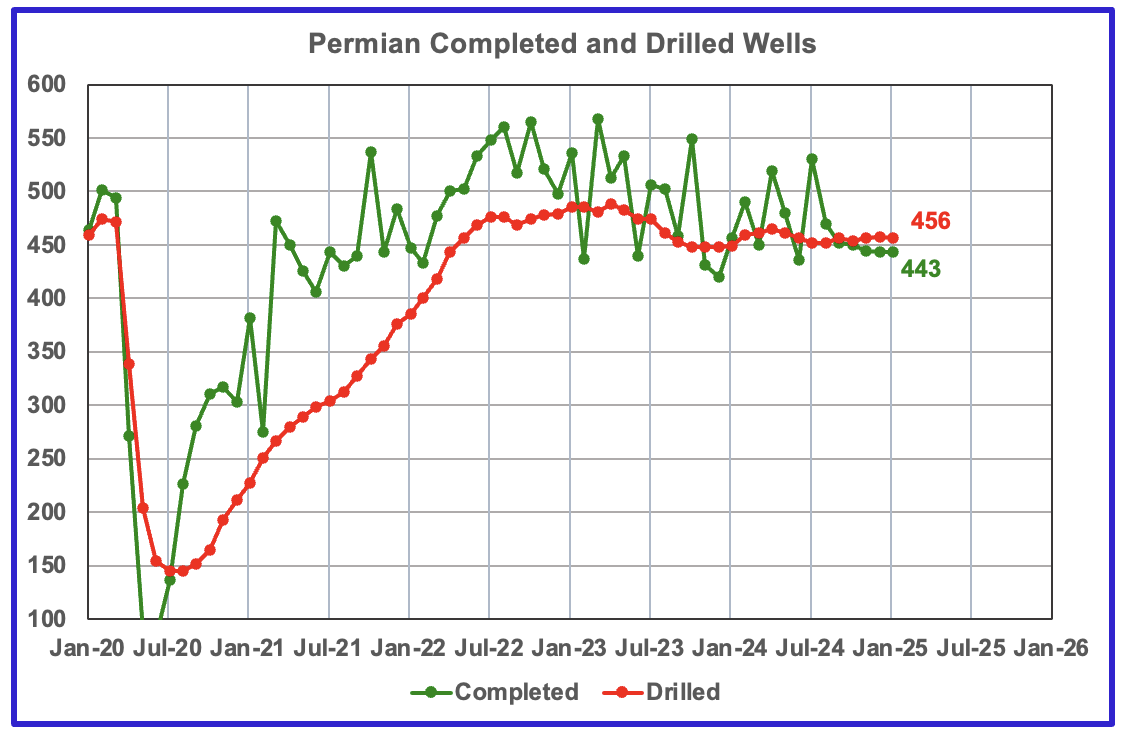
In the Permian, the monthly completion and drilling rates have been both stabilizing in the 440 to 455 range over the last 5 months.
In January 2024, 443 wells were completed while 456 new wells were drilled. This is the fifth month in a row in which the number of wells drilled exceeded the number of completed wells.
131 responses to “U.S. December Oil Production at All time High”
Great work Ovi!
https://www.reuters.com/markets/commodities/us-orders-wind-down-chevrons-oil-exports-venezuela-30-days-2025-03-04/
Putin ( I mean Trump! ) orders Chevron to wind down oil exports from Venezuela in 30 days.
Let’s see:
1) Dismantle NATO and stop giving weapons to the Ukraine
2) 25% tariffs on Canada and Mexico
3) Destroy Venezuuela ability to export oil.
4) Force California to become increasingly dependent on Middle Eastern Oil.
5) Russia parks a next generation nuclear submarine in Venezuela!
Who in the USA is this benefitting from this?
Putin and Igor Sechin (CEO of Rosneft) = “When the Permian Basin starts declining lets interfere with the USA’s ability to get oil from Canada and Venezuela”
Andre
Thanks. Much appreciated.
https://www.bloomberg.com/news/articles/2025-03-07/us-poised-to-order-more-companies-to-stop-operating-in-venezuela
US poised to order more companies to stop operating in Venezuela including a French oil producer (??? )
Is Guyana next?
https://www.msn.com/en-ph/news/world/guyana-says-venezuelan-vessel-entered-oil-block-in-guyanese-waters/ar-AA1A3JVo
Venezuelan vessel enters oil block in Guyana
Global aviation stats
https://www.iata.org/en/iata-repository/pressroom/fact-sheets/industry-statistics/
Aviation fuel consumption rose by an estimated 9 Billion gallons last year that is the equivalent of the fuel consumption of 40 million additional cars.
forecast is an increase of 6 Billion gallons this year, over 200 new airports are being built around the world and people want to fly as much as Americans do.
This is why I say when global oil production starts to fall by as much as I million barrels per day each year, there simply will not be enough fuel. Selling 90 million new electric cars each year would not be enough.
A peak oil scientist said some years ago we need an all out effort by every country to electrify, rail, cars, buses, put most freight on trains. An all out effort would take twenty years.
By now at least 40% of all electricity should be from wind and solar and 30% of cars on our roads should be electric. Being so far behind the curve is going to be a disaster for the world.
By now at least 40% of all electricity should be from wind and solar
In the UK, last 12 months has been 33.5% wind + solar.
John
Uk has done better than most in terms of wind and solar unfortunately it is a small part of the world
https://ourworldindata.org/electricity-mix
Coal and gas and oil still make 2/3 of the electricity produced
Of the 212 countries and territories listed in the link below, 82 had more than 40% renewable electricity production in 2023.
https://en.wikipedia.org/wiki/List_of_countries_by_renewable_electricity_production#Renewable_production_(percent)
The numbers were certainly higher in 2024.
Worldwide, renewables made up about 30% of electricity generation.
Super interesting – thanks for the link!
rgds
WP
when I first came to the US, Los Angeles, California in 1992 from China, I was shocked at the good air quality —
in China the high school “Global geology” class had a first color page, and it was about the smog pollution in Los Angeles. I remember the geology teacher joked about this — tail smog from tractors are good, we chase tractors in our home town to smell the diesel.
In the local church, I asked a local resident about smog, and he told me that he hads lived in Los Angeles for 40 years, and the first 25~30 years he does not know there is a mountain nearby, and I saw the firy dragon on the mountain trail in January during the fire.
In 1990s, California enacted the law requiring all autos sold in 2000 to have 10% not using gasoline or diesel.
So, GM lead the automakers putting out the EV1 in the late 1990s, and followed by others, and today you could still find a RAV4 EV made in early 2000s with 150miles range. It is said one of the EV1 engineers also designed the EV roaring on the moon, and now moon-landing hoax story tellers say the video of the moon vehicle was powered by diesel without emissions.
What killed the EV1 and the first wave of EVs? There is a Chinese scholar who visited MIT and learnt about the carbon nanotube from nano master (who just was released from jail last year and now in China). The Chinese scholar went back to China in 1996, and declared to the world that carbon nanotube doped with alkaline could store hydrogen 2~3 times more than todays’ Toyota H2 car. So Bush Jr. and along with every major goverment declared 21 century as Hydrogen century, and GM and major auto makers decided to go H2 and all abandoned the first EV. Today, only 2 EV1 are left in the world, and one is in BYD’s show room.
Thanks. That post was a lot of work!
My latest article is here:
US shale oil seems to cover up peaking crude oil production in the rest
of the world since 2018
4 Mar 2024
https://crudeoilpeak.info/us-shale-oil-seems-to-cover-up-peaking-crude-oil-production-in-the-rest-of-the-world-since-2018
It covers the debt problem showing a FRED graph with oil prices. Peak oil 2005-2008 contributing. The Wuhan virus caused a lot of debt in the US. People should be very angry that China allowed the virus to escape into the international economy.
Elon Musk mentioning it in the Oval office
Matt
U.S. production has also allowed several OPEC countries to keep a spare capacity which would otherwise be used up by now. Once U.S. starts to decline OPEC spare capacity will be gone in 2 or 3 years.
Global decline rate will be high as by then around 55 of the top 60 oil producers will be in decline.
A 2 or 3% decline rate is on the cards and will be catastrophic
It took China authorities 3-4 weeks from the first case cluster until they locked down Wuhan (Jan 23 in effect), a city of over 13 million. By that time Lunar new years peak travel had already occurred, and international travel had brought covid out of China.
Perhaps they could have shaved a week or two off of the timeline if they had really been on their toes.
Part of being really on your toes means that government officials have strong respect for and funding of scientific and public health agencies, and being very quick to institute restrictive measures on citizen daily activities and economic function.
I doubt any other big country would have handled it more quickly.
Certainly not the US.
Watch out- bird flu on the threshold. It could be much worse than covid.
Does anybody have a projection for Norway production it appears to be heading down.
Norway oil production has been declining since 2001.
https://www.norskpetroleum.no/en/production-and-exports/production-forecasts/#:~:text=Status%20of%20production,-Over%20the%20past&text=Norway%20produced%20241.2%20million%20marketable,was%20264.2%20million%20Sm%C2%B3%20o.e.
Norway C plus C
Sverdrup was a bit of an anomaly being found where it was but it sure helped for a while. Not sure if there´s more of it`s kind out there though.
Lightsout
This is what OPEC February MOMR has to say for 2025 and 2026. A small production increase for 2025 and then flat. Note this is all liquids.
In 2025, Norwegian liquids production is forecast to grow by 0.1 mb/d to average 2.1 mb/d. Several small-to-large-scale projects are scheduled to ramp up, including Kristin, Eldfisk and Balder/Ringhorne. At the same time, start-ups are expected at the Balder/Ringhome, Norne floating, production, storage and offloading (FPSO), Maria and Kvitebjorn oil field projects. Norway’s Var Energi recently announced the start-up of its Balder X oil project in the North Sea for 2Q25. According to Equinor, the Johan Castberg FPSO is expected to produce the first oil in Norway’s Barents Sea in January or February, after being delayed by bad weather conditions. According to Statistics Norway, total oil and gas investment on the Norwegian continental shelf for 2025 is forecast to rise by about 3%, y-o-y, supporting expected growth this year.
Norwegian liquids production is forecast to drop by about 40 tb/d to average 2.1 mb/d in 2026. Some projects at different scales are scheduled to ramp up in 2026, such as Johan Castberg, Edvard Grieg, Balder/Ringhorne, Heidrun, Grane, Valhall and Ivar Aasen. Simultaneously, start-ups are expected at limited assets, such as the Symra and Edvard Grieg oil field projects.
Thanks guys looks like they are fading but at a steady rate.
Estimate for Permian region output using EIA, TX RRC and NM OCD data for statewide and Permian Basin Output.
For 2023 and 2024 Permian region C plus C output increased at an average annual rate of about 400 kb/d, I expect this will decrease in 2025 and 2026 to an average annual rate of increase of about 200 kb/d.
From Jan 2023 to Dec 2025 the Permian Region accounted for about 85% of the increase in US L48 excluding GOM C plus C output (406/476=0.85).
Correction from above Dec 2025 should have been Dec 2024 as below:
From Jan 2023 to Dec 2024 the Permian Region accounted for about 85% of the increase in US L48 excluding GOM C plus C output (406/476=0.85).
To get an idea how accurate the EIA forecast for 2025 and 2026 might be, I looked back at the EIA’s STEO forecast from 2 years ago (Feb 2023) and compared with EIA PSM data from Feb 28, 2025. Obviously the future is not known.
I chose to look at L48 excluding GOM because in Feb 2023 the STEO did not do the regional forecast for the Permian Basin (these started in June 2024).
Dennis
On January 15, WTO was $80/b. This morning it is $66/b. Those steel iron rods used for drilling are going to be hit with tariffs. The question becomes “Is Drill Baby Drill” economic?
It will be interesting to see how the rig count looks/reacts a month from now. Throw in the slowing production growth from the 4 main Permian counties and a flat 2025 looks more likely.
$66 WTI doesn’t cut it.
Don’t know what will happen with steel for the year as the news flow regarding tariffs is very chaotic. If they stick assume steel prices will increase.
I’ve said many times Trump isn’t good for oil producers. But he’s like a religion, and you either believe or you don’t.
Shallow sand,
If we assume NG at Waha at about $2/MMBTU (recently it was $1.50/MCF), a wellhead price for the average Permian well at $66/bo and NGL at 28.8% of wellhead oil price, my breakeven spreadsheet gives a total discounted cash flow for the average Permian well of about $10.2 million over the life of the well (nominal disount rate of 15% is assumed). Net revenue is $13.2 million over 166 months, I believe the all in (full cycle) cost of the average Permian well is over $12 million. At 60 months net revenue (not discounted) is $10.9 million.
In short, I agree $66/bo for WTI does not cut it.
Prices for Waha from
https://www.eia.gov/naturalgas/weekly/
Excerpt:
The Waha Hub traded $2.41 below the Henry Hub price yesterday, compared with last Wednesday when it traded $3.71 below the Henry Hub price.
Trump massively damaged international supply trains the last time he was in office. The car industry has only recently recovered from the electronics shortages he caused with his erratic tariff policies. Just the amount of uncertainty he creates with his flipflopping is enough to throw sand in the gears.
A lot of the high quality steel the oil industry uses for seamless steel tubing comes from Germany. I can see the billows from the steel mill on the horizon on a clear day. Americans can also provide it, but not at a competitive price. I know this because thy guy across the street arranges the exports.
Ovi,
We live in uncertain times, my guess for 2025 and 2026 is based on BAU, could be lower or higher.
Note that annual average Permian region C plus C output was 6323 kb/d for 2024 by my estimate. In December 2024 output was 6524 kb/d. Let’s say average 2025 output is “flat” at the December 2024 level.
That would be an annual average increase of about 200 kb/d in averge annual output from 2024 to 2025.
Will US prices remain low with a 10% tariff on Canadian oil imports? I doubt it.
Oil prices are lower because of OPEC announcement of increased production and because tariffs will slow the economy, thus hurting demand.
Shallow sand,
The tariffs will also lead to higher prices.
Also keep in mind that Trump is trying to reduce exports of oil from Venezuela and Iran by ramping up sanctions on both nations, this will remove some oil from the World Market probably more than the 138 kb/d increase announced by OPEC.
Trump changes direction daily and the uncertainty will certainly reduce investment by businesses and spending by consumers. Eventually Trump might realize that chaos is not good for business, but he was never a very good businessman and soon nobody will believe anything he says, kind of like Mr. Musk. They are both con men.
As we all know, tough to predict oil prices.
However, Trump administration sees lower oil prices as the key to lowering inflation.
A Trump supporter on CNBC just pointed to oil falling from $80 to $65, and said the goal is to get it to $50 and below.
Very helpful to the 90%+ Trump vote in the oil and gas industry.
Dennis, $50 in 2025 is what price in 2016? 2016 was the worst year for us besides 2020, going all the way back to 1998. 2009 was better than 2016 even. I’m eliminating 2020 due to the extreme drop in demand as a result of the pandemic, hoping things don’t get that bad.
I actually don’t think $80 WTI is all that high. But I’m in the less than 1% in the US who like higher prices.
Kind of interesting to think the people in the worlds largest oil and gas producing country, including both administrations, want very low oil prices.
Shallow sand,
I converted WTI nominal spot prices to real 2024$ in an earlier chart. I guess you prefer 2016$. Here is the chart for real WTI Spot prices in 2016 $ per barrel of oil. I agree the low prices are going to be a serious problem for US oil producers, if they occur. I think we see US oil output start to decrease if nominal WTI spot prices go below $60/bo, at $65/bo and $3/MCF for NG we might manage flat output, but I think it will be a struggle based on the economics of the average Permian basin well (where most of the US growth is happening).
SHALLOW SAND —
The idea that low oil prices and increased oil production are compatible is part of a general anti-government ideology that maintains that all America needs is deregulation and tax cuts to the rich. It isn’t just Trump, a lot of Republicans preach this gospel.
Over the next 2 years don’t be surprised to see Russian oil more easily reaching markets.
What’s very interesting is that growth has completely stalled out. In fact, 2019-2024 production growth (<1% annual) more closely matches 2005-2010 period (2% annual). Not sure how quickly it declines but pretty sure it will drop under 10 mbpd by 2030…
The average rate of US growth in C plus C output using linear OLS on annual output data from EIA PSM from 2012 to 2024 is 515 kb/d. The EIA STEO forecasts an increase of about 514 kb/d US C plus C from 2024 to 2026 or about 257 kb/d average annual growth in average annual output. This is half the rate of the past 12 years.
The STEO forecast for real WTI oil prices in 2026 is nearly as low as in 2016. The chart below shows annual average real oil prices from 2015 to 2026 with forecast for 2025 and 2026 from the Feb STEO. From 2006 to 2014 there was a period of high real oil prices in 2024$ with average oil price over the earlier period at about $120/b vs about $72/b in 2024$ over the 2015 to 2024 period.
If we look at US annual average C plus C output over this lower oil price period from 2015 to 2024 the average annual rate of increase was about 460 kb/d. The slower growth in 2025 and 2026 in the STEO forecast may be due to the low forecast for future oil price in those years.
Not sure how to deal with Covid rebound…here’s production and DUCS…
2010 to 2019 was an annual increase of 777k barrels per year, seems maybe we are around 1/10th of that currently, maybe 100k barrels per year?
Past 12 months, only increased 300k, past 6 months only increased 200k, past three months decreased 100k or remained flat…
Past 3 months:
Prior to 2020, production between Dec and Feb would grow around 300k, after 2020, it’s typically flat or even loses 100k instead…this in addition to stalled out growth since 2020 timeframe
Kengeo,
The weekly data is mostly model based and is not very good, best to ignore that. Monthly data is also noisy, that is why I used annual data. Longer term (over past decade) annual US C plus C output has grown by about 460 kb/d.
Data from
https://www.eia.gov/dnav/pet/hist/LeafHandler.ashx?n=pet&s=mcrfpus2&f=a
Chart below uses a 2nd, 3rd, and 4th degree polynomial fit for trendline (this is a very poor way to do a projection) over 2009 to 2024 data. Not clear why a choice of the 3rd degree is best. Any use of a polynomial for forecasting is highly suspect in my view.
Also 2010 to 2019 (10 years) the OLS linear trend was 711 kb/d annual increase, most recent 10 years 2015 to 2024 the OLS linear trend was 460 kb/d, but part of this difference was the high oil prices from 2010 to 2014. Also the pandemic had an affect on output in 2020 and 2021.
From 2023 to 2024 average annual output for US C plus C increased by 281 kb/d. Over the next 2 years the STEO forecast is about 250 kb/d for the average annual increase in output.
I’d say it looks conservative compared to Rystad projections of around 4% annual decline, hitting >6% by 2040…over 10% by 2045…but I have trouble seeing much production beyond 2040, with 1P reserves at ~400 Gb and falling fast since average discoveries are in single digits…even if we add 300-400 Gb per Laherrere’s recent work it really doesn’t do much…80% of the easy oil is Gone!
Kengeo,
As usual you forget about the large volume of already discovered resources that have not yet become proved reserves, on the order of 1100 Gb or so, these contingent resources may eventually become proved reserves and then part of cumulative production.
NGLs are down for the month, but that is normal seasonally. Every winter seems to drop, think it might even just be temperature at the lease three-phase splitter affecting how much NGLs vary between the liquid (C&C) and (wet) gas phases.
NGLs are up about 0.5MM bpd YoY. And (seasonally adjusted) are at record levels. Have climbed from 2 MM bopd pre shale to current ~7 MM bpd levels.
https://www.eia.gov/dnav/pet/pet_pnp_gp_dc_nus_mbblpd_m.htm
Note that NGLs are not really “lease” production. (Those are C&C and wet gas.) The facilities that separate NGLs from the wet gas are large integrated facilities run by midstreamers. So NGLs are considered a product (e.g. in terms of export controls) analogous to refined products from crude.
an interest note aboutpetroleum geology in GOM(GOA),
the deeper they drill the more oil they found,i.e. GOR actually go down FAST— it is actually contrary to geology
Sheng Wu – My take on your observation.
The thickest sediment accumulations in the GOA are across the central Louisiana shelf. This would be where the source rocks are buried the deepest, thus resulting in these source beds being in the gas window, thus resulting in the abundance of gas production on the shelf.
So, even though the reservoirs in the deepwater fields, in most cases, are deeper than the shelf fields, the source beds are shallower, and in the oil window. On top of that, in many portions of deepwater, the reservoirs and source beds are below the thick shallow salt canopies. This results in temperatures not being as high as they would be otherwise and tends to keep the source beds in the oil window.
I think there also is a source rock composition component, but I think source rock burial depth is the primary driver.
Bob Meltz, thanks for your take!
Some chatbot in less than 1 hour which turned out faster than what I did for couple of days before, and here are some notes along with manual search:
1. the source rock for deeper black oil is the young Tertiary, Wilcox, while the shallow gas is probably the Juarssic (like the Haynesville or deeper) and Cretaceous(like EagleFord) marine at high maturity.
2. the salt canopies actually have lower heat conductivity, so it works the reverse way
3. yes, the source rock composition is different — I read Wilcox oil associated gas isotope reading as the condensate/wet gas in Eagle Ford, which indicate same maturity, but the GOR is still 1/20th or less of Eagle Ford condensate/wet gas, so they are actually hypersaline lacustrine. This means lots more oil and gas as drill deeper.
Check your notes on the thermal conductivity of salt canopies. I’m sure you have that backwards. Salt canopies have higher thermal conductivity than the surrounding sediments at the same depth. That allows them to wick off heat more effectively and keeps the rocks below them slightly cooler. That results in better porosity preservation for subsalt reservoirs, and also, can keep the source rocks in the oil window longer.
Bob,
you are right, the chatbot gave the correct numbers, but incorrect conclusions about conductivity. So, this further support deeper the drill the more oil in GOA/GOM.
Bob: Are those salt canopies autochthonous, or from subduction or some other form of tectonic violence? Thanks for your comments on this fascinating part of the world. The giant cost of the test well (Jack?) was a gutsy maneuver the likes of which we don’t see anymore.
Gerry: The salt canopies are allochthonous (out-of-place). The salt tectonics in the GOA are fascinating. It was originally deposited in the Jurassic and is called the LouAnn salt. Because of the plastic-like behavior of salt, a layer of salt can mobilize due to differential depositional loading. This can initially mobilize the salt into domes, or ridges, and then, with continued deposition, these domes or ridges can mobilize into canopies that “flow” downdip. So, some of this Jurassic Louann salt can end up as a salt canopy with, for example, much younger Miocene and Pliocene sediments immediately below and above it.
It took the oil industry a long time to figure all this out because salt plays havoc with seismic data. I was fortunate to be able to spend my entire career working as a geologist/geophysicist in the GOA basin, onshore and offshore, and to watch and experience this blossoming on understanding of salt tectonics first hand.
Bob: I was flabbergasted by the thickness and molding characteristics of the salt canopies and in trying to understand them came across your great internet article from June 10, 2005. For those international readers who are interested in this, google “Emergence of Lower Tertiary Wilcox Trend in the Deepwater Gulf of Mexico,” authored by Dave Meyer, Bob Meltz and others. It is a commendable breakthrough presentation and very interesting to read. Bob, we are honored to have someone with your stature comment on your work; this is truly phenomenal stuff. Reading this in detail, one can’t help but think there is an awful lot more oil sub-salt.
Gerry, thanks for the exiciting article link — 20 year ago news still resonate today.
I actually asked similar questions to several geologists in Houston, and they had no clue what the detailed geology behind this reverse GOR-depth.
Your story about salt canopy migrating in GOA is really fancinating, Bob!
I remember someone in an AAPG meeting telling a story about GOA had a flipping pan to creat the oil, at that time I had zero knowledge about GOA oil and gas and dont have a clue of why he presented such an unimaginable scenario.
Another interesting observtion of the deep water tertiary oil and gas is that many of the methane isotope actually has strong biogenic signature and one thesis even assign more than half as biogenic. It is quite hard to imagine biogenic process could happen in that depth and temperature —
Bob, what’s the typical reservoir temperature in deep water wells, like Big Foot, St Malo?
Thank you Bob for sharing your insights.
Gerry,
luckily, the GOA wilcox discovery wells were made before the shale revolution in oil took firm ground, if they happen 5 or 10 years later, such risky wildcats probably would not have been sanctioned.
Gerry and Sheng Wu,
Regarding carbon isotope data and biogenic gas – I’m not too familiar with that in the deepwater. I do remember that a fair bit of the shallow gas produced on the shelf, maybe reservoir depths 4000’ and shallower, have a carbon isotope signature consistent with biogenic gas.
Regarding the notion that there is a lot of oil still to be discovered in the subsalt portions of the deepwater GOA – In my view, the subsalt areas of the deepwater GOA are pretty mature from an exploration standpoint. The Wilcox has been fairly well explored with over 70 prospects drilled, and about 25 discoveries that are either being produced, or likely to be produced. A lot of activity has occurred since that paper was written back in 2005.
Regarding the reservoir temperatures at Jack (a Wilcox field), and Big Foot (a Miocene field)- I don’t have access to that type of data since retirement, but, Jack, and other Wilcox fields, are higher temperature than Big Foot, and other Miocene fields, because it’s deeper, and I know the reservoirs are poorer quality in the Wilcox fields. Jack probably has perms in the 5-20 mD range, and porosities in the 10-20% range, while Big Foot probably has perms in the 50-300 mD range and porosities in the 20-25% range. The advantage the Wilcox fields have over the Miocene fields is that both the gross and net pay reservoir thicknesses are much greater in the Wilcox fields, and this offsets the poorer Wilcox rock properties compared to Miocene rock properties.
One metric that reservoir engineers look at when trying to predict the producibility/production rates is kH, or “average permeability x net feet of pay”. In the Miocene reservoirs, these numbers might be something like 200mD and 150’ net pay, while in the Wilcox they may be 15mD and 900’ of net pay. So, while the Miocene reservoir would have a higher kH ( in this case 30,000), the Wilcox reservoir would not be too bad ( in this case 13,500), and still be able to yield a commercial flow rate.
If interested, I did a post on the Wilcox, and also one on the entire GOA – both in 2022.
https://peakoilbarrel.com/update-on-the-wilcox-in-the-offshore-northern-gulf-of-mexico/
https://peakoilbarrel.com/2022/05/
Bob,
Thanks for your 2022 posts about GOA and especially deep water projects —great reading for the weekend!
Seems sub-salt is really helping production in Brazil Santos basin, their productivity and recovery is actually higher than Wilcox? They have about the same TVD, and actually higher GOR with CO2, which could actually make the oil gas separated earlier after pressure drop. For deepwater GOA Wilcox GOR at well under 500scf/bbl, it should be more favorable for Wilcox to recover more.
The methane isotope seems to have biogenic signature, and verified they were first generated at shallow depth and then buried deeper at higher temperature and mix with more mature thermogenic oil associated gas.
Looking at the map of deep water GOA, seems there are still possibilities, I actaully was reading the deep water isotope data from the GOA west to the Mexico side, south west of Perdido fold belt where a new field (sub-salt) will be sanctioned?
Also, majority of the Wilcox deepwater GOA wells have lower GOR than 300scf/bbl, deduct the Great While, the average GOR is only 250scf/bbl, and Miocene field Big Foot (assume it also sourced from similar source rock as Wilcox) also has GOR at 300scf/bbl, then the maturity is right at the oil peak, or Ro~1.0 to 1.1, and so there should be more mature higher GOR oil somewhere from the more mature Wilcox source rocks?
Such GOR-maturity-depth is a unique feature of
hypersaline-lacustrine source rocks, i.e. GOR still very low, i.e. well 0.9~1.2, and depth is well over 5km. In Permian shale Wolfcamp, Midland, Ro~1.0, and GOR is about 800scf/bbl, and in hypersaline lacustrine source oil, GOR is just 50~100scf/bbl. The deeper than 5km TVD depth makes higher GOR oil and gas separation impossible for initial generated GOR at under 1MCF/bbl, thus exclude the possibility that the Wilcox low GOR oil is a result of phase separated higher GOR oil, otherwise there should be gas top somewhere also in the Wilcox deepwater.
Dennis
What annual decline rate do you predict for global oil production in 2030, 2035 and 2040.
Loads of oil,
In 2030 0.4% annual decline rate, 2035=1.6%, 2040=2.2%. URR for my scenario is about 2800 Gb with peak in 2028 with cumulative production of C plus C at 1655 Gb roughly 59% of URR. Cumulative output reached 1400 Gb in 2020.
For context, Laherrere 2025 uses ~2,335 Gb conventional, 50% was ~2012. Production is much lower than 2018, so not sure how Dennis is projecting production growth in light of long term sustained decline…
Production in 2018 averaged about 83 Mb/d, for the past 12 months the average has been about 82 Mb/d, so lower by 1.2% than at the peak in 2018. Not clear that this is “much” lower, but it is lower.
Dennis had been projecting the 2010-2018 trend many many years into the future, at some point I think he’s given up but still prefers to make a peak/plateau 5-10 years into the future rather than acknowledge the elephant in the room (peak was 7-9 years ago depending on how you look at it). By my math, net exports continue to fall at 3-4% per year, likely to accelerate unless oil price goes up, then no growth but maybe continued plateau…
Kengeo,
Can you find and example of where I project the 2010-2018 trend many years into the future? Here is my current scenario with peak in 2028 at 83.7 Mb/d, just slightly more than the current 2018 peak.
Keep in mind that conventional oil is only part of the story, my model has URR of conventional oil of about 2600 Gb, cumulative conventional was 1273 Gb at the peak in 2016.
Sure, there are sooo many!
Ron had a good response to this one:
RON PATTERSON
06/30/2022 at 11:56 am
Dennis, your projections, there are two of them, in your chart above do not match your 7 million barrels per day predicted increase by July 2024 in your other projection above. I wish you would be more consistent. I do not know which one to take seriously.
Well, actually I take none of them seriously. 🤣
Kengeo,
That is a look at OPEC Middle east output which is primarily Saudi Arabia, UAE, Iraq, and Kuwait. It is not a forecast for World output.
Here is a link to the entire discussion.
https://peakoilbarrel.com/eias-june-2022-oil-production-outlooks/#comment-742066
Basically I was trying to show how the EIA’s IEO 2021 outlook for the Middle East may have been realistic based on the OLS trend in OPEC Middle East data from Jan 2000 to December 2019. Ifwe use the 2000 to 2019 annual rate of increase of 393 kb/d for Middle east OPEC producers and assume that rate of increase occurs from Jan 2025 to Dec 2030 we get the following chart.
I doubt this happens, but OPEC Midlle East nations likely have the spare capacity to accomplish this. It does not mean the same happens for World C plus C.
Note that in 2022 Oil prices were about $100/b and OPEC was increasing output, I may have incorrectly assumed that high oil prices would continue in the future, that proved to be an incorrect assumption for 2023 and 2024 as oil prices fell by 20 and then 25 per barrel from the 2022 level. OPEC plus reacted to the low oil prices by cutting output.
Here is a chart with a linear trend from 2010 to 2018 projected 10 years in the future. Not a scenario I have ever done I am quite sure.
Don’t make specious claims without evidence or no one will pay attention to anything you post.
November World Oil Production up 238 kb/d
Yet 10 years of trade decline:
Shallow Sand
Oil prices needs to go down as you said because of inflation, but also because financial system is bankrupt. Everybody can san see it but cannot connect the dots.
There is no collateral that underpins this global economy. Its all funny money floating around globally. Dow at 42k is science fiction.
Opec + increasing a production is done with agreement of US administration.
In 2005 $s current price is equivalent to $40 per barrel!
That’s as low as she goes! Not sure who is willing to export oil at these prices, can’t be a long list…
Kengeo,
OPEC plus is raising output, I imagine the exporters will remain the same with most of the oil exports coming from about 10 nations.
Careful, I think you mean they are “saying” they are raising output…what they say and do don’t always align….
Kengeo,
If prices fall they might not raise output, they are trying to throw Trump a bone. The stated increase is quite small something like 135 kb/d, and yes they often change course in ways that are not expected, like in 2015 when they decided to take market share even though prices were low.
Regardless of where price is. OPEC countries need revenue. The idea that oil producers can indefinitely cut production is miss placed.
As the revenue shrinks they won’t be investing as much to keep those oil fields producing. Available oil exports will cut both ways. Less revenue for producers and less ability to pay for consumers.
Production is going to fall a lot faster than people are expecting. And price is ultimately determined by what people can afford to pay. Which clearly isn’t enough to keep prices up.
This isn’t 2012-2014. The price of everything has gone through the roof and consumers are maxed out on their ability to borrow to make ends meet.
Crude exports from OPEC ASB
Crude plus products exports for World from OPEC ASB
Rig Report for the Week Ending March 7
– US Hz oil rigs decreased by 1 to 448. The count is also down 11 rigs from April 19, 2024 and are up 21 relative to their recent lowest count of 427 on July 24th. The rig count has broken out of the very tight range between 427 and 442 since July. Is this week’s drop of one rig linked to the $13/b drop in WTI from $80/b in Mid January?
– The New Mexico and Texas Permian rigs were unchanged at 95 and 195 respectively.
– In New Mexico, both Lea and Eddy wee unchanged at 50 and 45 respectively.
– In Texas, Midland dropped 1 to 26 and Martin added 2 to 29.
– Eagle Ford was unchanged at 43
– NG Hz rigs were down 1 to 81.
Frac Spreads Rebound for the Week Ending March 7
The frac spread count dropped by 4 to 210. It is also down 53 from one year ago and down by 31 spreads since October 11.
NOVI claims there is no degradation of Midland subbasin wells.
https://novilabs.com/resources/urtec-2024-analyzing-midland-basin-well-performance-and-future-outlook-with-machine-learning/
Sheng Wu,
When we look at EUR per foot of lateral, I get average productivity falling since 2016 in the Permian Basin using Novi data for EUR and EIA data for average lateral length. Data through 2022.
DC,
the EUR numbers for latest wells since 2022 probably have huge uncertainties.
It is like Haynesville shale gas wells, higher IP first year won’t translate into higher EUR.
Sheng Wu,
I don’t have any data for new well EUR after 2022, or not enough to make an accurate estimate of EUR, basically I need about 24 months of data to accurately estimate EUR (or historically I have done pretty well with that amount of data). So for the average 2024 well I wouldn’t know the EUR until March 2027 when I have about 24 months of data available for all 12 month’s completions in 2024. The last data I have for the Permian was from April 2024, with enough data for a fairly good estimate for the average 2022 Pemian well.
Sheng Wu,
Interesting piece from Novi, they have around 20k more locations for Midland, Delaware is a bit larger so I assume another 30k locations there for a total future Permian well count of roughly 50k, as of Dec 2024 about 58k wells have been completed so total for scenario is 108k wells. I assume 1% annual productivity (EUR) decrease in average Permian wells starting Jan 2025 in this scenario (no data to back this up, but I believe a reasonable assumption). URR about 44 Gb, peak in July 2028 at 6368 kb/d.
Year 2035
European Union is passing a law that will force the scrappage of all diesel and petrol cars over 10 years old. It says it will recompence each owner with a one year family public transport card.
The European Union which already banned the sale of any new diesel and petrol cars says it has to pass this new law in order to save fuel for European Air travel and freight which transports food and goods around Europe.
Following 4 years of global oil decline, OPEC has inplemented a rationing system in order to ensure each country has enough oil for essential services such as shipping freight, aviation and fishing fleets. The Oil industry says global oil producion will fall by 1.5 million barrels per day by the end of the year. Even with this rationing system oil prices are over $140 per barrel.
Europe which has an extensive rail network has embarked on a massive scheme to transport lorries on rail wagons. All lorries must submit their journey details to the transport ministry which then gives priority to long distance journeys. Most lorries travelling from Southern Spain to Germany and Great Britain travel most of the journey on the rail system.
In the United States police say there has been a massive increase of theft of fuel from cars and garages. Local rationing has not worked with people buying old cars just to fill up with fuel. The president for life. Donald Trump has said Iran is holding back on production and a military solution is inevitable.
Leave Trump alone! By then he would be 88 or 89 years old. He is phenominal for someone 78, just compare him to Biden. By then JD Vance will be in his second term.
Just kidding about Trump.
Whoever is in power, U.S. oil production by then will be falling each year by nearly half a million barrels per day. Globally production will be falling each year by over a million barrels per day. There will be no spare capacity anywhere. Any hurricane or terrorist attack in the Middle East will have a dramatic effect on prices.
There will still be over 200 million cars and trucks in America using petrol and diesel and the availability of those fuels will be declining fast.
The only thing that will be true in 2035, if we live to see it, is that all of us will be ten years older.
Loads of Oil. How does a person who lives in a state of fuel poverty feel when they look up and see privileged people flying around in airplanes?
Realize that many things in current life that most of us here take for granted such as air travel are not inherent aspects of life, rather they are temporary flashes in the pan of civilization.
Energy havenots will get extremely resentful of those who squander oil products.
In the absence of plentiful oil simple things like food, clothing, basic building materials, metal objects, medications and electronic devices all become much more expensive. Recent inflation in US and Europe is like the first day of a year long trend. And then there is the next year and beyond.
Hickory
I know many who fly on holiday perhaps once a year but do not have a car. They prove that cars are not necessary either. They will use much less fuel than someone driving a car everyday. Aviation is increasing but only uses 8% of oil. Think of all the jobs that are supported by tourism and business trips. Most hotels and many restaurants would go bust. All the people working building airplane and working in airports.
The joy of travelling to various countries would not be possible without airplanes.
People waste food, clothing and much else why pick on such a tiny part
https://www.aljazeera.com/gallery/2021/11/8/chiles-desert-dumping-ground-for-fast-fashion-leftovers
Loads…8% of oil is a huge amount for a totally optional use. You point out the economic impact of the industry…its a good example of what is going to be weeded out by the shortage of oil in the next decades. We take far too much for granted. Much of what we have become accustomed to is not a normal part of biologic life on a finite planet.
Depletion is not a reversible process.
Novi Labs has an intriguing analysis/discussion predicting that Haynesville will grow in 2025 and Marcellus will flatline. The major difference is midstream chokepoints, not “running out of resource”.
BTW, Novi has a fair amount of content in the emailed stuff, can’t cut and paste as it’s a pdf image. The full analysis is for corporate subscribers. That said, I recommend to at least sign up for their email spam. Lot of good free content they send periodically.
Basically, they agree with the generally held view that Marcellus flatlining is because of egress restrictions, not land. All the major PA players are predicting flat production in their financial guidance. (Not dropping or rising.)
They see the Haynesville poised for growth based on improved demand (and hence price) as more LNG export comes on line, later in the year. Lots of DUCs and even completed but not put on line wells are in queue in the H. Also significant local level midstream infrastructure upgrades are being done, on the basis of heavier volumes predicted. It is a much friendlier regulatory regime in LA than in the NE (especially because interstate pipes needed there, to change the situation). FWIW, midstream changes are a pretty good predictor of future volumes. Not perfect of course…but it takes some stomach to make the investments needed, so when it happens, that signals some confidence…much more than just a random analyst opining. [I don’t know what volume of growth they predict, that wasn’t in the abstract.]
This is the forecast from Feb STEO for Haynesville, from 15 BCF/d in Dec 2024 to 17.2 BCF/d in Dec 2026 so about an annual rate of increase of 1.1 BCF/d for marketed natural gas is expected over the next 2 years from Haynesville.
For all of US Wet Natural Gas output increases by 4.3 BCF/d from Dec 2024 to Dec 2026. All of the increase comes from Haynesville and Permian.
Art manipulated the EUR numbers for Haynesville and Permian for the past 8 years, by deliberately inflate the EUR in 2016-20, and then deflate the EUR after 2021.
see inserted figure, where I added the white arrow to reflect the more realistic EUR from other source,
https://youtu.be/CVqkN6YjVSc?si=j1XfKHxCSfMmB14V&t=673
longer term Marketed Natural Gas Chart for various regions and “rest of US”.
From end of 2024, Eagle Ford and Bakken pretty flat, Appalachia offsets falling output from rest of US and most of the increase in Natural Gas comes from Permian and Haynesville.
DC,
If Permian oil could continue increase till 2026 then how could Permian gas peaked at beginning of 2026?
If Permian oil hold steadily at 6.8Million BOPD with GOR at just over 4 MCF/bbl, total permian gas should be 27~30BCFPD.
EF dry gas will certainly produce at full throttle at $4 HH, they could add at least 1BCFPD, and if starship fires once a day at 1200ton LNG a shot or 50MMCFPD, they could easily supply from 10 shale gas wells in nearby Webb Co.
The Appalachian gas probably will have 2 scenarios in next 2 years,
1. without pipeline to NE and or only limited LNG export increase, then probably only the SWPA, WV will increase 1-2BCFPD, while NEPA drop 0.5~1BCFPD.
2. if pipelines to NE are built, then could add extra 3BCFPD, even NEPA could stay flat or add up to 0.5BCFPD ?
Sheng wu,
My scenario does not use the price assumptions of STEO, simply assumes relatively constant completion rate. I think oil prices will remain roughly where they are now and natural gas prices may increase, but the increase in natural gas prices usually does not drive Permian completion rates (it might have a minor effect). Likewise, the Eagle Ford is more oil focused, not clear the wells there are productive enough to drive a big increase in drilling, Haynesville should increase, the increases that are forecast by the EIA are enought to meet LNG demand, any further increases would simply cause lower NG prices.
My guess is the resource that is profitable to produce is not as large as you imagine. For my Permian tight oil scenario URR is about 60% of mean USGS TRR, that might be a better metric for Haynesville and Permian URR for gas (60% of USGS mean TRR). For Haynesville/Bossier mean TRR is about 246 TCF, 60% of 246 is 148 TCF for URR and 50% of 148 is 74 TCF cumulative at peak. At the end of 2024 cumulative output was 42 TCF with 2024 annual output at 4 TCF the peak would be reached in 8 years in 2032. If we assume Haynesville/Bossier output increases at the 2017-2022 average annual rate of 1.59 BCF/d from Jan 2025 to July 2028 then the peak is reached in 2030 at an output level of 17 BCF/d with a plateau from July 2028 to July 2032.
Scenario for Haynesville/Bossier using URR=mean TRR from USGS times 0.6.
Permian Natural Gas scenario based on my 44 Gb tight oil scenario.
Question, if you have excess gas, real or imaginary, would you not want to sell it for top dollars in any case? Perhaps as LNG to some gas starved region? Just asking.
Laplander,
Sometimes you run out of storage space for Natural Gas and you sell it for whatever price you can get. The plan is for the US to export as much LNG as they can produce. In my view this is very short sighted, it makes more sense to produce what is needed and not ramp up Natural Gas exports any further. The resource is not as large as many proclaim once economics are accounted for. Probably about 60 to 70% of the mean TRR that has been estimated by the USGS.
Sheng Wu,
My model has Permian peak at 6.4 Mb/d at peak which at GOR of 4 would be 25.6 BCF/d. The actual Gas model has GOR at about 4.7 MCF/b at peak tight oil output.
Feb STEO price forecast for WTI oil prices and Natural Gas prices in 2025 and 2026 compared with history from 2022 to 2024.
Rystad study says oil production will peak in 2030, rapid electrification is needed to prevent shortages
https://www.rystadenergy.com/news/global-recoverable-oil-barrels-demand-electrification
Is it more feasible to replace internal combustion engines and build up a robust electrification system before or after a country finds itself short on oil products?
Hint- the answer to this question should affect your/your countries behavior now, if that isn’t one of the most obvious things in world to you already.
I suspect that Americans will look back at the last 25 years as the greatest missed opportunity in the history of the nation, as the next 25 years find us far short on all of the mechanisms that would have enabled a measure of continued basic economic strength in aspects such as manufacturing and food product handling.
If I’m still around then, I think I will still consider it slightly differently. “Missed opportunity” implies we had a chance that we somehow didn’t recognize or walked by. Instead, a sizeable fraction of the country has actively and consistently voted and acted in other ways to prevent seizing the opportunity.
I doubt it Hickory. No regrets looking back the last 25 years as Americans will stay on course to take chances, stay aggressive and innovate through the next steps to solve the problems. That’s what you miss in your paranoid analysis on society destruction theory. Human innovation is unlimited. Don’t give up!
Gunga
Perhaps you have not thought of all the issues facing humanity many for the first time.
Consider Saudi Arabia, one of the richest countries in the world. It tried to be self sufficient in food, using aquifers for irrigation. After 20 years the aquifers ran dry and the Saudis have abandoned any idea of food self sufficiency. Now the ground water is gone so has its cooling effect and the country experiences more days over 50c.
Not a good example of your optimistic future.
A report over 20 years ago warned of soil degradation, which required immediate international efforts to reverse. This more recent shows things are even worse.
https://earth.org/95-of-the-earths-soil-on-course-to-be-degraded-by-2050/
Another devastating reality check on what issues are so difficult to reverse.
Humans have been using essentially what is free for prosperity and all these things are running out.
Taking water out of aquifers for nothing and now they are running out, any idea what it would cost to irritate the farm land in the United States to prevent the aquifers from totally vanishing.
https://www.weforum.org/stories/2022/05/drought-united-states-climate-change/
When oil was first exploited it was so close to the surface as to be free to take, now it costs more but still incredibly cheap. What will it cost to replace one million barrels per day in a year and another million the next and the next. Humans have never faced such a loss of energy ever and most people haven’t a clue what the cost of replacing oil will be.
The world has fished much of the wild fish, now we have farmed fish full of sea lice and use vast amounts of chemicals to stop the fish from dying.
Another wake up call to your rosey future.
Loadsofoil,
Again, We will work the problem and find solutions. All the probs you point out are valid but thousands of humans are working it. No worries dude!
I myself have a new engineering son going to either CSU or OU as a freshman studying many of the issues you point out. He is excited to work the solutions.
Humans have always survived and thrived. Don’t give up Loads!
Gungagalonga,
A careful reading of history will show that although correct that humans have survived, for the large majority they did not “thrive”. Assuming that humans will always “thrive” may be wishful thinking, there is much that can go wrong and the current trajectory towards less cooperation among nations relative to 1945-2024 is not promising.
The Saudis pumped the aquifiers empty for cheap wheat. Meanwhile people were getting killed every year in flash floods in West of the country.
https://www.youtube.com/watch?v=m1Wek8BaHbQ
Their solution? Build canals to dump the water into the Red Sea as quickly as possible. Then spend the rest of the year bellyaching about the lack of water, or idiotically burning oil to desalinate seawater.
There is water in Arabia, but thousands of years of disastrously bad land management.
Here’s a different plan: Rainwater catching. There have been some rumors that they wat to try it, but we’ll see.
https://www.youtube.com/watch?v=T39QHprz-x8
The question is whether people will implement sensible policies, not whether such policies exist.
I believe the future cannot be predicted, but my guess is somewhere between Hickory’s pessimism and Gungagalonga’s optimism, we might find a way forward, but the road will be difficult, current World trajectory does not look promising considering that attitudes seem to be shifting to an early 20th century attitude. Globalism has prevented a Third World War, those who think appeasement of dictators is the way forward have never opened a history book or understood what they have read (if they ever opened such a book).
Musk and Trump are clowns as are all who are convinced by their con game.
Gung…I am primarily into realism, even if it is unpleasant.
It is folly to pretend that oil is an infinite energy source. Of course we will innovate, but that does not cure basic constraints.
I do realize that there is a small chance that fusion power will become feasible, but that is not something that you can rely on for planning.
When it comes to longterm energy supply innovation, I think that the prospects for enhanced geothermal production is pretty high. The energy source is perpetual and it is likely that the collected energy will be affordable for critical purposes….more so than nuclear fission I suspect.
Proof is (will be) in the pudding…not in denial, prayers or wishful thinking.
Looking at the WTI chart today. We are at horizontal support that dates back to January 2022. If the chart breaks down from here the next major support is at $40.
Just saying.
Trump is doing exactly what the fool Chamberlain did in 1938.
The Drift To War by Richard Lamb has a great deal of information of how the biased views and incompetence of a few, mainly British politicians and civil servants helped Hitler gain power.
The final failure to deal with Hitler was at the Munich Conference.
In 1938 Czecoslovakia had an effective army and fortifications, it was willing to fight. France wanted to march on Germany if it attacked the Chechs. Chamberlain refused to back France and did a dirty deal with Hitler behind the backs of the Chechs and other allies. Italy at the time being a ww1 ally would have sided with France and Britain.
Trump is splitting NATO just like the Allies were split in 1936/39. If Trump sells out Ukraine it will signal to Putin that the United States will not spend any money let alone fight if a European country is attacked.
Lets take note of the big difference in scenarios-
The fight against fascism/authoritarianism in the US currently is an internal battle.
And it is going very very poorly.
For example, his supreme court granted him immunity from criminal prosecution. And he has the right to pardon anyone who commits criminal acts on his behalf. And he has surrounded himself with operatives whose primary selection criteria is loyalty.
The only thing that protects the country from severe abuse of executive power is a reliance on his good intentions and good judgement. In my book he scores at the bottom of the scale on both accounts.
Hickory,
Putin is being compared to Hitler and Trump to Chamberlain in this scenario. I am not familiar with the history of British Politics in the 1930s except that it is widely agreed that Chamberlain was an idiot.
I tend to agree that the current situation may be much worse given the poor decisions by SCOTUS, the lack of any backbone by Republicans in the US Congress in defending the Constitution and their Article 1 powers, and the lack of any ethics by POTUS.
I understand that. I was pointing out that the threat here/now is from within….tolerance of and appeasement of authoritarianism.
Hickory,
Got it, I tend to agree, hopefully Republicans will stand up or we will hold onto Democratic institutions for at least 2 years and Democrats will stand up and be able to push back from the House of representatives, in the mean time the filibuster may need to be used in the Senate and hopefully there will be enough Republican Senators to stand up to not removing it. I am sure Trump and Musk will push for that if a filibuster stands in their way.
Hickory
You can’t equate Trump with Hitler or Stalin or Mao.
https://en.wikipedia.org/wiki/Night_of_the_Long_Knives
Hitler had over a hundred people murder during The Night of the Long Knives.
Stalin had thousands of political opponents murdered.
Trump is doing exactly what he said he would do. Chamberlain often acted completely alone without consulting any in cabinet or ignoring them. Trump is weakening long standing alliances a this is giving real facists opportunities to exploit.
I do not equate Trump with Hitler, other than they both lean/ed hard toward authoritarianism.
However there is a strong overlap between the behavior of the supporters of these two leaders . Both willing to overlook the deviation from norms of behavior in modern democracies with the hope that they personally will benefit. I’m sure it is apparent that I am extremely disappointed that almost 30% of the US population seem ignorant to the history of the long fight against tyranny.
An example- the FBI is being purged of those who did any work related to enforcement of the nations laws against violent attacks on the US Capital that occurred during the process of the peaceful transfer of power on Jan6 2021. Simply because the work they did highlights the culpability of Trump in this attack on democracy.
This should not be OK with anyone.
Loadsofoil,
It is early days for Trump, a lack of pushback could lead to lots of abuse of power, hopefully Congress will Impeach and then remove Trump from office if he goes too far.
Mitch McConnell once thought the Persident was not above the law but the Supreme Court of the United States (SCOTUS) does not seem to agree, the only guard rail seems to be impeachment, that would require Republicans with a backbone and there seems to be precious few of those.
unfair hindsight.
What would any of us do in his situation? The region Sudetland is 90%+ ethnically German, inhabitants want to join Germany. The Czech tell you, “we’re not gonna fight, you have to do it here”… So are you going to send British kids to die under these circumstances?
Don’t know about Trump, the situation is different now. the closest parallel is Obama in 2014 with Crimea, yet Obama gets very little blame, compared to Chamberlain
With one major difference, Russian men and their conventional force are far cry from the formidable German ground machine (inexhaustible fuel notwithstanding). Being part of a satellite army in the 80s I’ve got to tell you that I’m not at all surprised that the Russian army stalled in Ukraine and so many of its soldiers are being slaughtered.
Maybe they switch to beer, vodka and after shave cut you off at the knees. LOL.
It’s pretty clear that Putin convinced Trump and Musk, with whom he has been in regular contact for years, that the war in Ukraine is an internal Russian kerfuffle involving Ukrainians who are basically low class Russians and don’t really exist as a country. The story was that the only reason the war was happening is that “woke” Democrats and Europeans were causing trouble.
I think Trump and Musk honestly believed he could end the war on his first day in office just by putting his foot down against all this wokeness. After all, he is the most powerful man in the world, like a king. That certainly explains the bizarre behavior of the Americans in Munich, and the exclusion of the Ukrainians in Trump Putin meeting in Arabia.
Trump has a knack for pulling people into his delusional swamp. He has destroyed quite a few careers with this. Look at Rudy Giuliani, Mike Lindell and Sidney Powell, who were all doing fine until he started getting them to clown for him. Musk and Vance look like his latest victims. Rubio too, probably.
Global vehicle sales
https://www.just-auto.com/industry-data/global-light-vehicle-sales-up-2-in-2024-globaldata/?cf-view
2024 was close to the all time high in vehicle sales.
The number of vehicles scrapped is estimated at around 40 to 50 million, many older cars are shipped to third world countries where owners keep them running as long as possible often over 30 years.
Taking the number of electric and hybrid sales at 18 million, means that this year there are around 20 to 30 million additional ice vehicles on the roads of the world.
Scrappage rates are obviously increasing reflecting the increasing sales over time. It will require electric vehicle sales to hit 30 to 40 million before we see consistent fall in road fuel demand globally.
LOADSOFOIL
True, but this ignores two and three wheel vehicles, which are switching much more quickly, and are simply better adapted than cars to the dense Asian cities where about half the world’s population lives. There are about 700 million motorcycles around.
Alim
The fuel consumption of two and three wheelers is minuscule.
https://ourworldindata.org/co2-emissions-from-transport
An update to November Non-OPEC and World Oil Production has been posted.
https://peakoilbarrel.com/november-non-opec-and-world-oil-production-rose/
A new Open Tread Non-Petroleum has been posted.
https://peakoilbarrel.com/open-thread-non-petroleum-march-12-2025/