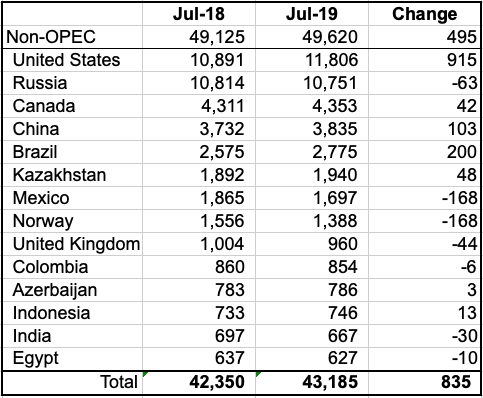
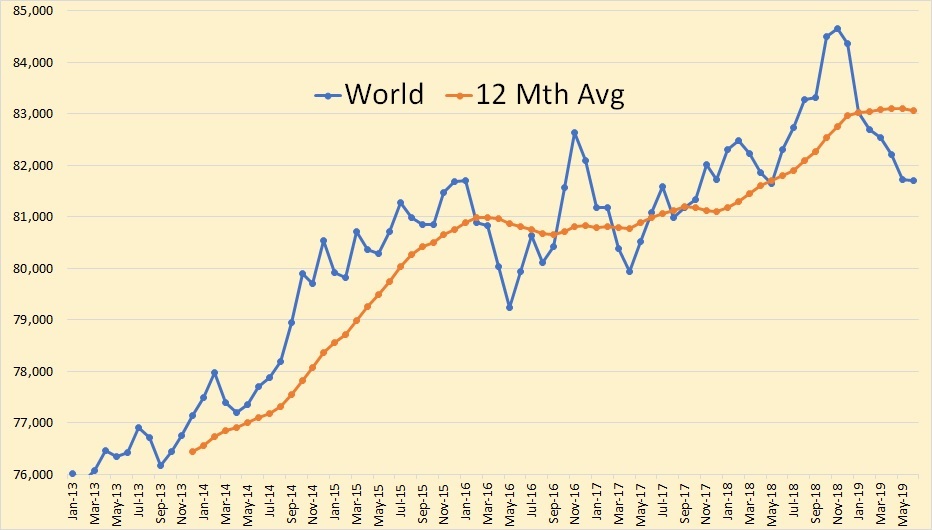
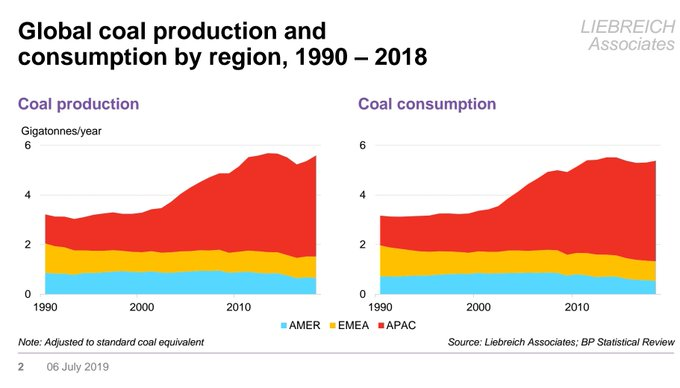
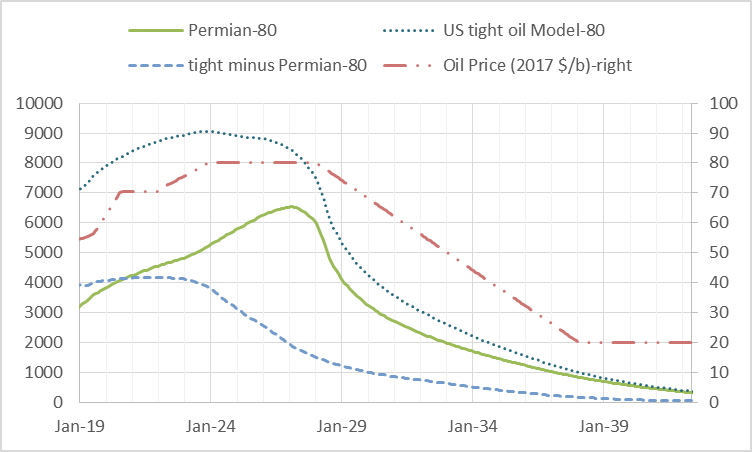
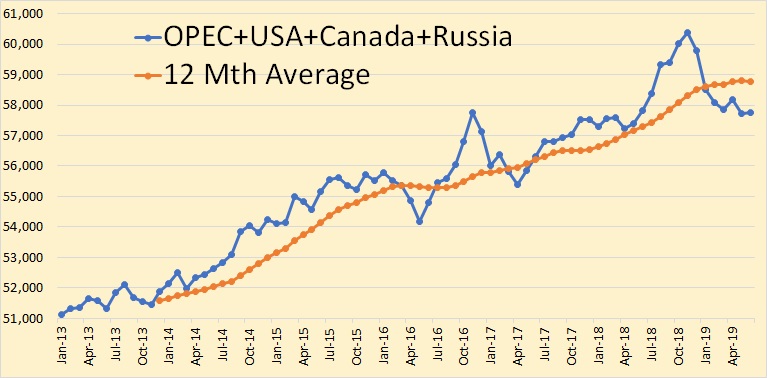
Below are a number of Non-OPEC charts created from data provided by the EIA’s International Energy Statistics.
The charts and table below are primarily for the world’s largest Non-OPEC producers and are updated to July 2019, except for the U.S., which is updated to August 2019. The first set of charts is for Non-OPEC countries with production over 500 kb/d and the last few provide a world overview.
Under some charts are added country comments from the IEA since I have updated data from them up to September 2019. While the IEA production numbers reflect “all liquids”, their July to September increments provide an indication of how the trend in the EIA charts will change by September.
