A guest post by Ovi
All of the Crude plus Condensate (C + C) production data for the US state charts comes from the EIAʼs February Petroleum Supply monthly PSM which provides updated information up to December 2022.
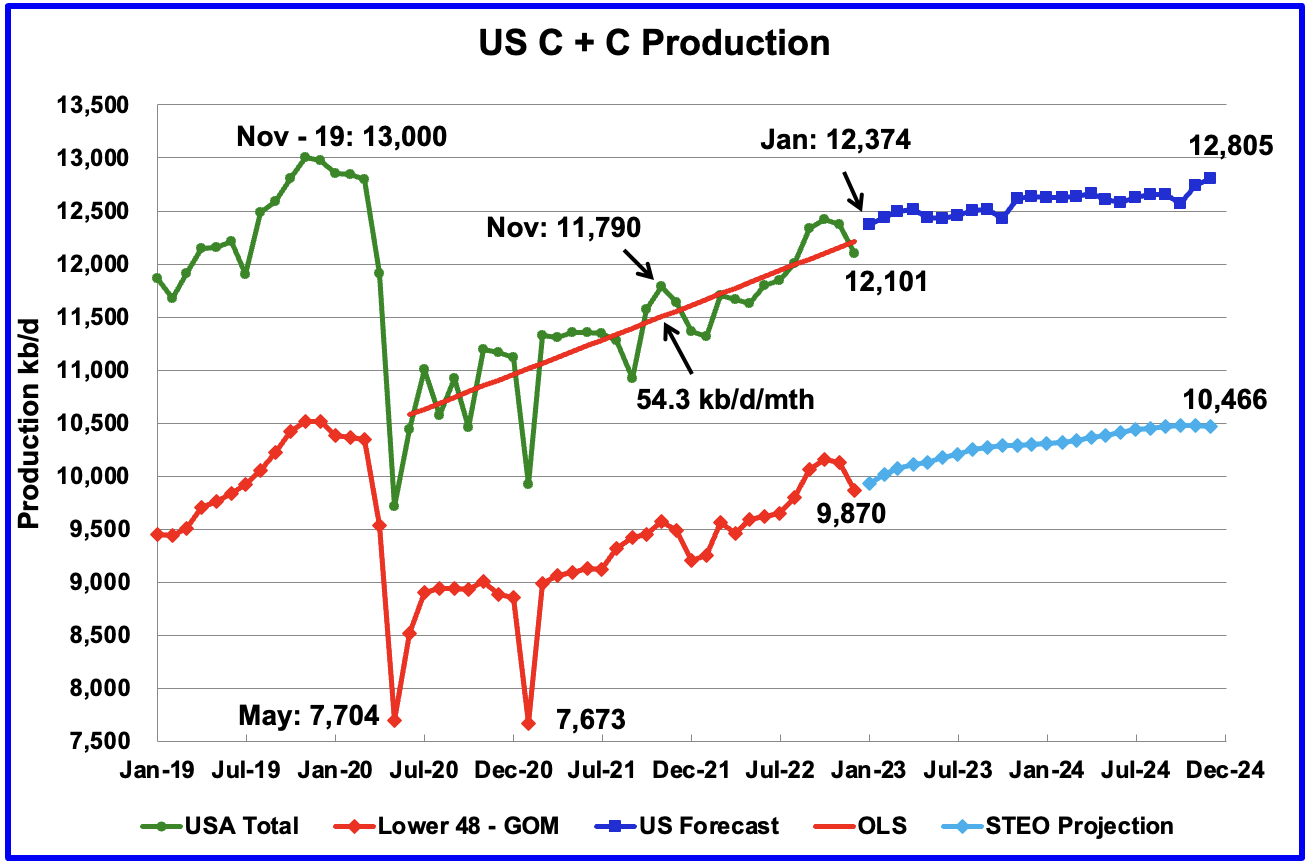
U.S. December production decreased by 276 kb/d to 12,101 kb/d. For December, the state with the largest decrease was North Dakota with 135 kb/d followed by Texas with 65 kb/d while New Mexico had the largest increase, 46 kb/d. The December production decline was caused by bad weather in many states.
Read More