The EIA’s Questionable Numbers

The EIA’s, on June 30th, published its Petroleum Supply Monthly. I Think their numbers are just way too high. I compared them with the EIA’s Weekly Petroleum Status Report. The chart below shows the Results.

EIA Post 1

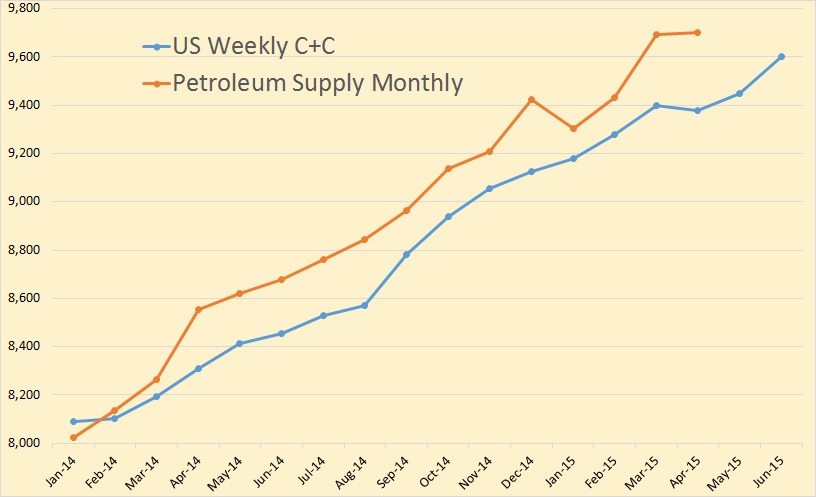
I averaged the weekly numbers and converted them to monthly data. They were pretty close for the first three months of 2014 but then they begin to diverge. Of course they were much closer earlier but in the Petroleum Supply Monthly has, over several months, been revised upward. The Weekly Petroleum Status Report is never revised.

In April, the Petroleum Supply Monthly shows US C+C production 322,000 barrels per day above the weekly average of the Weekly Petroleum Status Report.

Read More

Texas RRC February Production

The Texas Railroad Commission has released its  incomplete production data for February.  The RRC also estimates final production but that data has not been posted yet.

All Texas RRC data is through February. The EIA data is through January.

Texas C+C

It looks like, after the final Texas data comes in, that February crude oil will be above January production but still below December production. It is my best guess that Texas production will be down about 80,000 barrels per day in January and up about 50,000 bpd in February or about 30,000 bpd below December production.

Texas Crude Only

I always post the last six months data just so we can get some idea of the general trend. You can see the general trend is up until January when it took a huge hit and only partially recovered in February.

Read More