Eagle Ford Output Estimate and Future Scenario

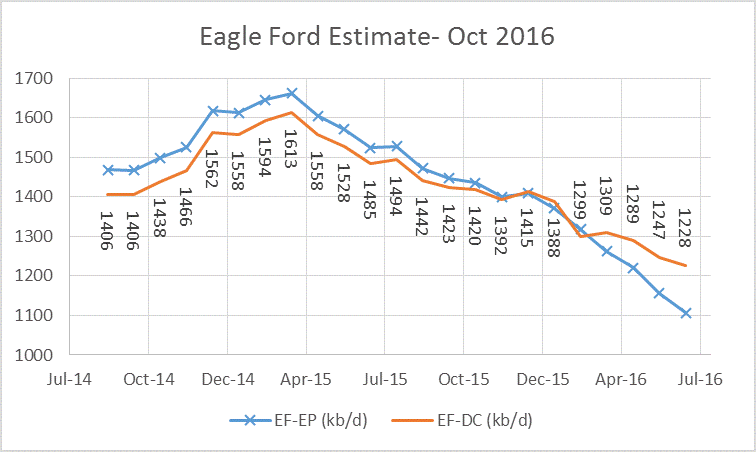
Eagle Ford output is difficult to estimate as there are 20-25 separate fields that need to be followed to get a full picture. To save time, I have used Enno Peters’ data for horizontal wells from Districts 1 to 5 in Texas from his website shaleprofile.com, he has data through June.  Enno’s data is combined with the RRC data for statewide C+C output to find the percentage of Texas C+C from the Eagle Ford. This percentage is multiplied by Dean’s estimate for Texas C+C output to get the following estimate, which is compared with Enno Peters’ data.  EF-EP is Enno Peter’s collection of data from the RRC, EF-DC is my estimate using the method described.  Based on a May 2016 Eagle Ford estimate, I subtract 70 kb/d from the EF-DC estimate to account for non-Eagle Ford horizontal well output in Districts 1 to 5
TXchart/

Read More

Texas Oil and Natural Gas- June 2016

Dean has shared his estimates for Texas Oil and Natural Gas output. Texas (TX) C+C output was revised lower by -10, -17, -22, -18, and -52 kb/d for Nov 2015 through March 2016 respectively. Output in April 2016 increased by 27 kb/d from the revised March 2016 estimate to 3511 kb/d. The EIA estimate for March 2016 is 3276 kb/d, and Dean’s revised estimate is 3484 kb/d, 208 kb/d more than the EIA estimate.

TXchart/

Read More

Texas Oil Production Still on a Plateau

The Texas RRC Oil and Gas Production Data is out. There appeared to be no decline in December production and may have even been a slight increase. 

The Texas RRC data is incomplete and only gives an indication as to whether Texas production increased or decreased. The data appears to droop because each month the the Texas Railroad Commission receives a little more data and the totals increase, little by little, month by month, until after many months the data is complete.

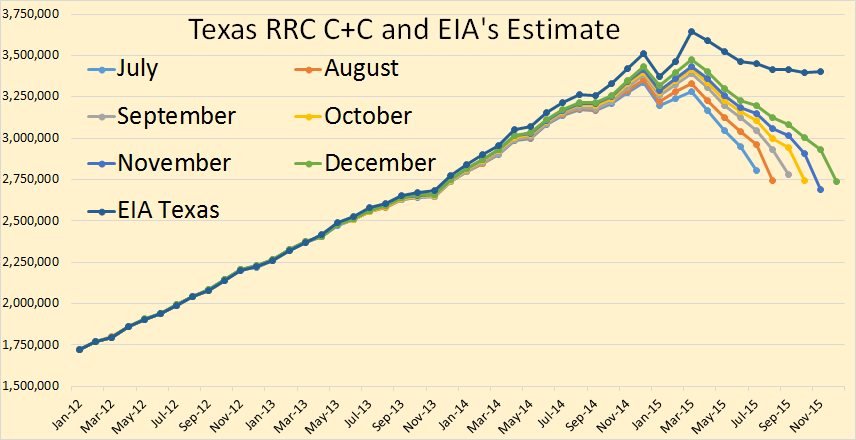
In my charts I post the past six months of data in order to give some indication as to whether production is increasing or decreasing. The final data is through December and the EIA data is through November.

Texas C+C

Texas crude plus condensate declined a little in November but seemed to make up that decline in December. Total Texas C+C seems to be on a flat plateau, declining in Eagle Ford but making up that decline in the Permian and the rest of Texas.

The EIA estimates the final Texas data through November. They have Texas peaking in March and down about a quarter of a million barrels per day since that point.

Read More

Texas Oil and Gas Production Declining

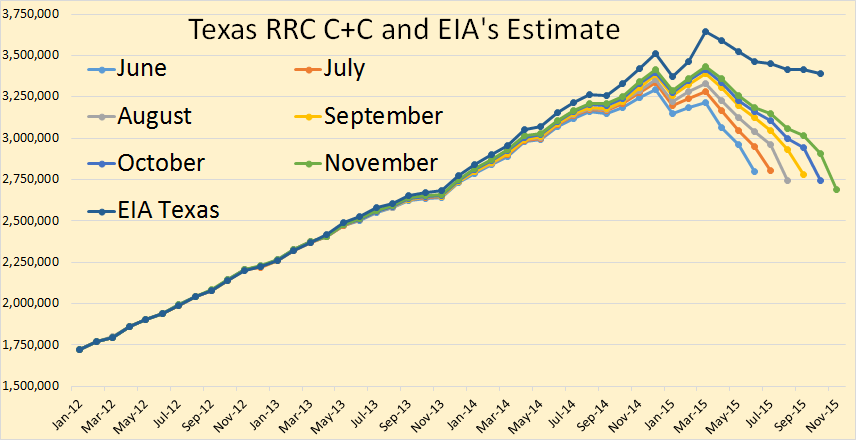
The Texas RRC Oil and Gas Production Data is out. This data is  always incomplete. But we can get some idea of what the trend is by comparing it with previous months. This is what I have done in the charts below. If the latest months data is below the previous months data then the trend is down. But if the latest months (incomplete) data is above the previous months (incomplete) data the trend is up.

All RRC data is through November 2015 but the EIA data is only through October. The oil data is in barrels per day.

Texas C+C

The trend is definitely down. The scale makes it difficult to gauge the month to month change but I have the exact month to month change here in barrels per day. Of course this only gives you a general idea of what is happening. The final change could be either less or greater than the numbers indicate here. But the EIA data should be very close.

Jun. to Jul.  7,245
Jul. to Aug. -63,827
Aug. to Sep. 34,507
Sep. to Oct. -33,486
Oct. to Nov. -52,802
Jun. to Nov. -108,363

EIA Dec. to Oct. -121,000

Read More

Texas RRC Oil and Gas Production

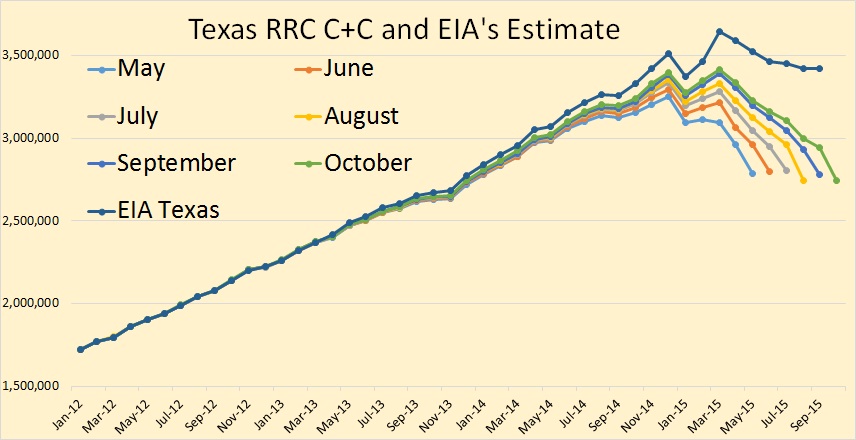
The Texas RRC Oil and Gas production data is out. All the RRC data below is through October 2015 and all the EIA data below is through September 2015.

Important: All the Texas RRC data is incomplete, especially the latter months. They will be revised upward as the Texas RRC gathers more data. The EIA data is what the EIA expects the final data will look like.

Texas C+C

The RRC Crude + Condensate data for October shows a slight decline in October. The EIA says Texas C+C was flat, August to September.

Read More