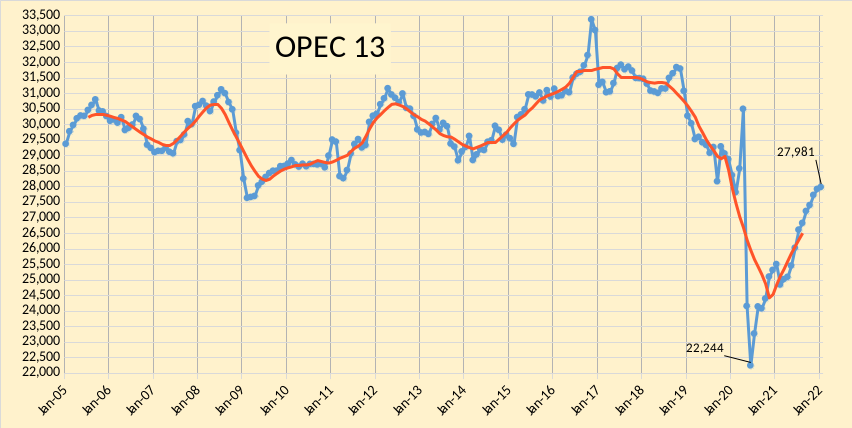
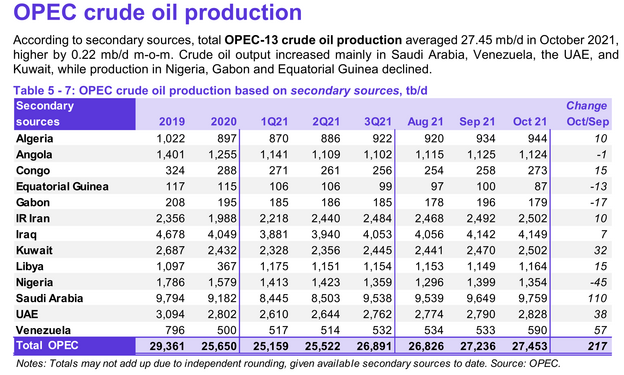
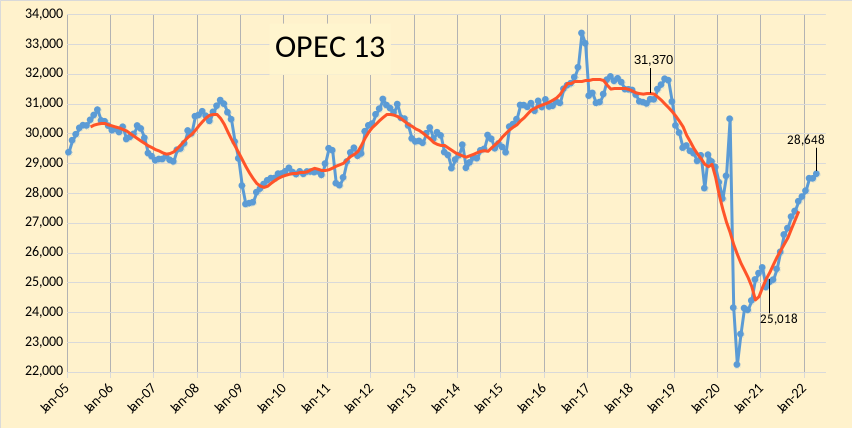
The OPEC Monthly Oil Market Report for October 2021 was published this past week. The last month reported in each of the charts that follow is September 2021 and output reported for OPEC nations is crude oil output in thousands of barrels per day (kb/d). In the charts that follow the blue line is monthly output and the red line is the centered twelve month average (CTMA) output.
Read MoreTag: OPEC
OPEC Update, September 2021
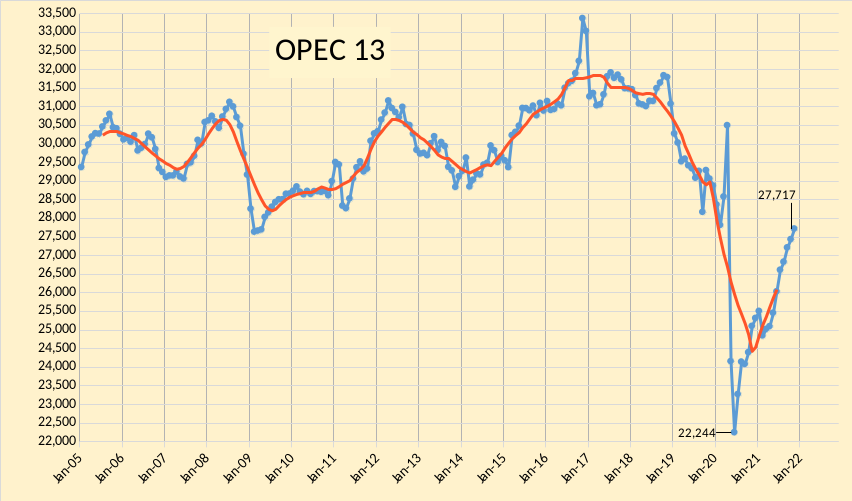
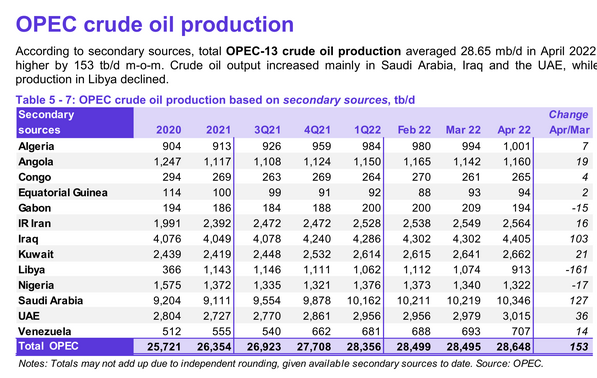
The OPEC Monthly Oil Market Report for September 2021 was published this past week. The last month reported in each of the charts that follow is August 2021 and output reported for OPEC nations is crude oil output in thousands of barrels per day (kb/d). In the charts that follow the blue line is monthly output and the red line is the centered twelve month average (CTMA) output.
Read MoreAnnual Reserve Revisions Part VI: Sub-Saharan OPEC Members
A guest post by George Kaplan
IOC Reserves and Production
About the only place where properly audited estimates for OPEC’s claimed reserves are available is sub-Saharan Africa, principally Nigeria and Angola, but with Congo, Equatorial Guinea and Gabon as minor players. Except for some on-shore legacy production in Nigeria most of the fields are partly owned and wholly operated by western IOCs that are required to provide accurate estimates for reserves and revisions for SEC and other financial reports.
In the 10-k or 20-f reports the estimates are presented geographically with Africa seprated out and, usually, sub-Saharan Africa separated from North Africa, which is typically lumped with the Middle East (in which the IOCs now have little direct ownership in OPEC countries).
Read MoreOPEC Update, June 2021
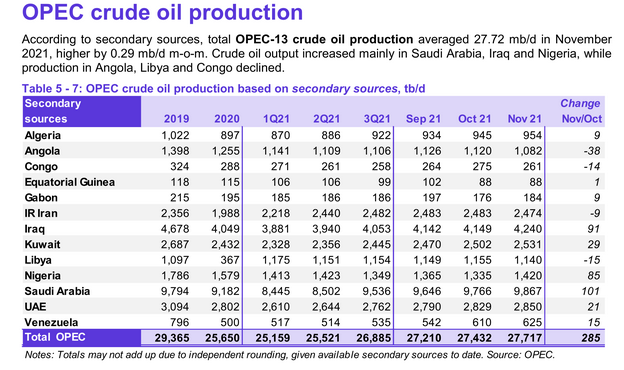
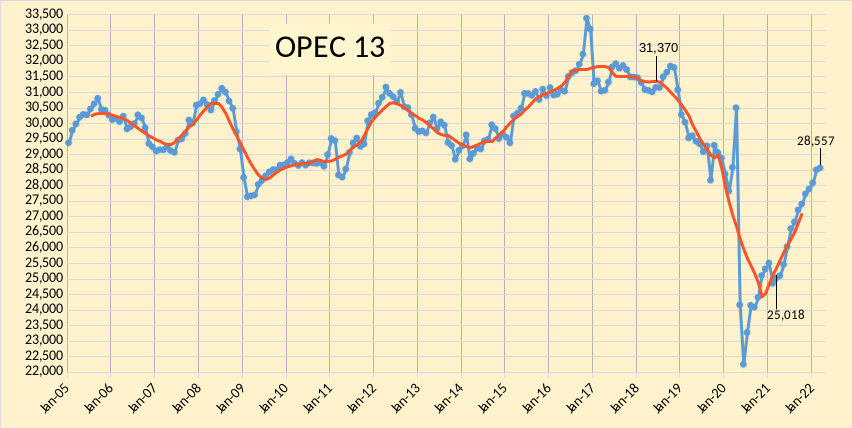
The OPEC Monthly Oil Market Report for June 2021 was published this past week. The last month reported in each of the charts that follow is May 2021 and output reported for OPEC nations is crude oil output in thousands of barrels per day (kb/d). In the charts that follow the blue line with markers is monthly average output and the red line without markers is the centered twelve month average (CTMA) output.
Read MoreOPEC Update, May 2021
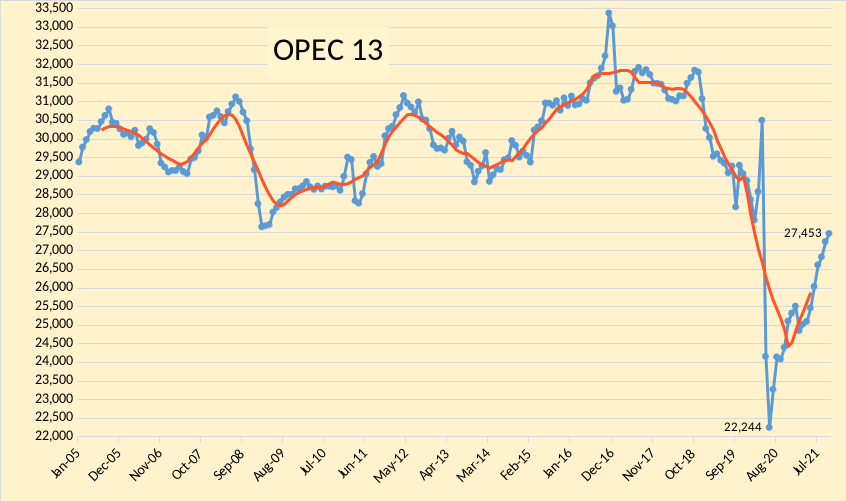
The OPEC Monthly Oil Market Report for May 2021 was published this past week. The last month reported in each of the charts that follow is April 2021 and output reported for OPEC nations is crude oil output in thousands of barrels per day (kb/d). In most of the charts that follow there is a red (and in one case yellow) line without markers which is the centered twelve month average (CTMA) for output. Note that this a change from the way Ron Patterson has reported the average data for many years which used a trailing twelve month average. Essentially the curve shifts back in time by 5 months as I choose July as the center month for the January to December 12 month average.
Read More